Embed Size (px)
Citation preview


Implementation Of Radon Remediation Techniques In
/ IRART
Proiect POS CCE ID 586 - SMIS 12487/ 160/ 15.06.2010
derulat in perioada 15 IUNIE 2010 - 14 IUNIE 2013
Programul Sectorial " Economice
- co- prin Fondul European de Dezvoltare -" pentru viitorul “
Universitatea - Bolyai din Cluj - Napoca Facultateade Ingineria Mediului


Romania /Bihor map and Baita-Stei zone Investigated Baita-Stei area
Baita-Stei area: is situated in the northwest of Romania (West Carpathian Mountains) at 120 km southeast of Oradea
LOCATION
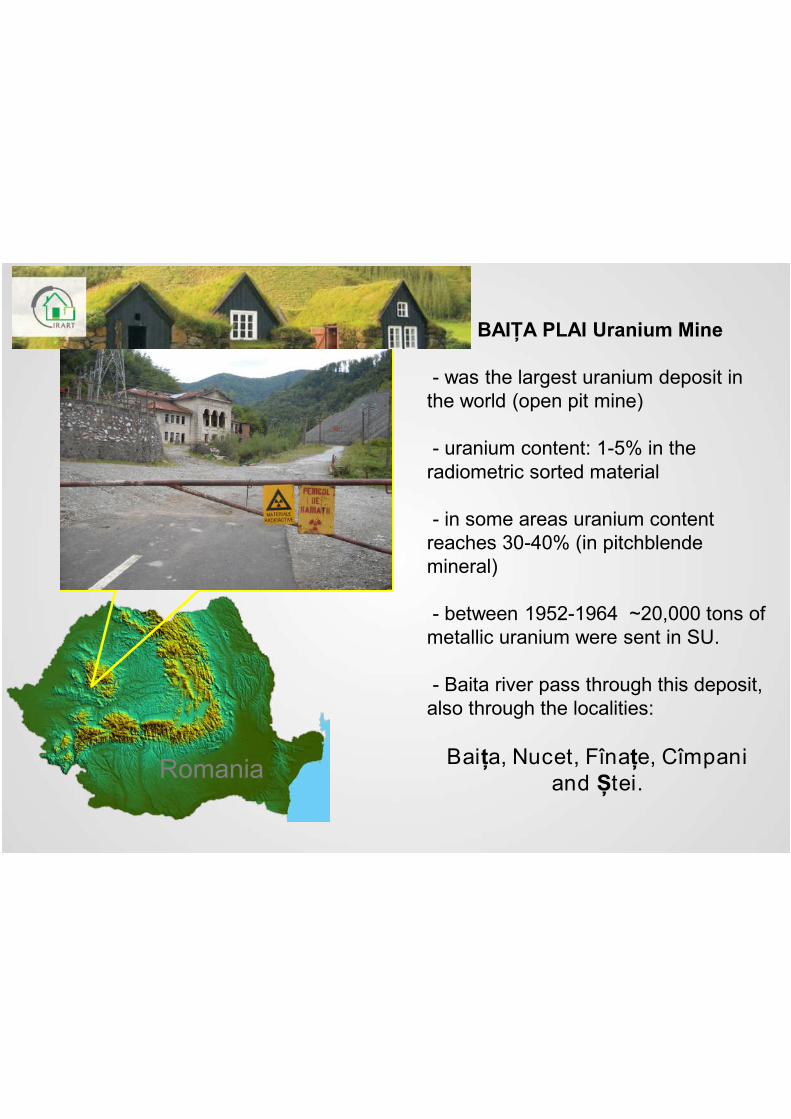
- was the largest uranium deposit in the world (open pit mine)
- uranium content: 1-5% in the radiometric sorted material
- in some areas uranium content reaches 30-40% (in pitchblende mineral)
- between 1952-1964 ~20,000 tons of metallic uranium were sent in SU.
- Baita river pass through this deposit, also through the localities:
Bai a, Nucet, Fîna e, Cîmpaniand tei.
Romania

Ec hipa de managementProf. Dr. Carlos Sainz Manager de proiec t
Prof. Univ. Dr. Constantin Cosma Direc tor adjunc t de proiec t
Dr. Ing. Alexandra Responsabil de proiec t
Ec . Bejenaru Vladimir
Dr. Ec . Florin Pop Consultant ec onomic
Ing. Dorin Stanc iu Consultant
Echipa de cercetareProf. Dr. Carlos Sainz Director de proiectProf. Univ. Dr. Constantin Cosma Director adj. de proiect
Dr. Ing. Alexandra (Dinu) Responsabil proiect
Lect. Dr. Tiberius Dicu
Dr. Mircea MoldovanLect. Dr. Robert BegyDr. Dan Fulea
Drd. Ciprian Cîndea Asistent cercetare
Drd. Botond Papp Asistent cercetare
Drd. Bety Burghele Asistent cercetare
Prorector Prof. Univ. Dr. Silaghi-Dumitrescu coordonare strategii
Prorector Prof. Univ. Dr. Cristina coordonare strategii
Subing. Boc coordonareEc. Carmen coordonare aspecte contabilitateRodica coordonare - aspecte de resurse umaneCons Juridic AlexandruEc. Ovidiu P ca

1998-2010: 2100 integratedmeasurements of indoor radonCR-39
905 typical houses
M high Rn concentrations in soil
high RP in 85% of houses(200)
uranium tailing as buildingmaterial
“ RADON PRONE AREA”
Basement subsoil main radonsource + building materials
Uranium mine
AM = 292 Bq/m3
Max Val = 3653 Bq/m3
AM for Romania = 126 Bq/m3
(excluding - )
The arithmetic mean of indoor radon concentrationsin - radon-prone area, 1x1 km grid cells.
(Cosma C., (Dinu) A., Dicu T., Sainz C (2013), Preliminaryresults regarding the first map of residential radon in some regionsin Romania, Radiation Protection Dosimetry, 155(3), 343-350.
Sainz C., Dinu A., C. Cosma et al., (2009), Comparative riskassessment of residential radon exposures in two radon-proneareas, (Romania) and Torrelodones (Spain), Science of TheTotal Environment, 407 (15), 4452-4460.
Dinu Alexandra, PhD thesis „Correlations between indoor radonand lung cancer incidence in - Uranium Mine area”, 2009)
PRELIMINARY RESULTS - FIRST ROMANIAN INDOOR RADON MAP


Measurements of radon in houses:
Basic methodsRadon screening by integral methods (nuclear track detectors CR-39,RSK type, RadoSys)
2 campaigns of measurements (winter 2010, spring 2011)303 randomly selected houses from interested area3-4 rooms/house2300 measurements (2x1150)
Special methods for radon diagnostics before mitigation in PILOTHOUSE and 20 selected houses with radon level higher than 600 Bq m-3:continual indoor monitoring, radon exhalation measurements (soil andbuilding materials) by gamma and alpha spectrometry, measurements ofsoil radon and permeability around, gamma dose (DIAGNOSTIC)
Follow-up of mitigation efficiency after mitigation by integratedmeasurements and continual monitoring
A. (Dinu), C. Cosma…, C. Sainz, (2012), Thorough investigation on indoor radon in radon-prone area (Romania), Science of The Total Environment, 431, 78–83.


Integrated Measurements:
Continuous measurement devices:
Radosys System CR-39 nuclear track detectors
Soil radon measurement:
Gamma dose measurement:
Gamma Scout
LUK 3C scintillation detection with Lucas cells
ALPHAGUARD PQ 2000, RADIM, RAD7, Radon Scout, RTM 1688-2 Radon/Thoron, Doseman Pro, Ramon


Radon Bihor county)
- The house was constructed in 1976-1978;
- House area of 3198 m²;
- Building material: gravel, sand and slag from the
mine area and -
- Investigated area for diagnostic and remediation:
2 bedrooms, 1 living, 1 bathroom, 1 cellar;
RoomAnnual C Rn
(Bq/m3)
Bedroom 1 889
Bedroom 2 1104
Living 349
Bathroom 395


RADON DIAGNOSTIC MEASUREMENTS IN HOUSES OF BAITA REGION, ROMANIA
– AVRAM DOREL
3.1.1. Inspection of the house
The house was built in 1954. Walls are built of red bricks. The house foundation was filled with stones from the mining area. Sand used for coating the house was brought from the mining waste. Recently, the inside was renovated with building materials purchased from the store. Under half of the living is the basement which was also build with stones from the mining waste. All the house, except the half living above the basement - which is made out of wood - has concrete cap. On top of those, the living room has laminated parquet. Bedroom 2 (blue) has varnished floor as does Bedroom 1.
Building materials used for the construction: bricks, stones, sand and ballast from the mining waste; basement - stones from former mining area (Baita Plai); filling - stones from former mining area; walls - bricks. The windows are double glazing, new and tight.
The measured part of the house is not used for living, at the moment. During diagnostic measurements, the rooms were tempered, uninhabited and mostly closed.
Drinking water used in the house comes from a municipal water supply.
3.1.2. Radon index of the building site
Results of direct in situ measurements of soil-gas radon concentration and of permeability of soil in the surroundings of the house are presented in Table 1.
Table 1: - Radon index of the building site
Measur ing point cRn (kBq/m3)
k (m2)
1 15.510 3.8E-11 2 13.350 3.1E-11 3 33.030 4.8E-11 4 44.090 3.5E-11 5 9.489 3.9E-11 6 60.140 2.2E-11 7 12.280 1.2E-11 8 0.500 4.5E-12 9 0.500 4.7E-11 10 0.500 2.9E-11 11 52.340 3.4E-11 12 36.910 1.9E-11
Evaluation
75th percentile 36.9 3.8E-11 RP 85
Radon index high (RP 35)
RADON INDEX
Rn soilPermeability

Fig. 1. Location of the sampling points for soil-gas radon concentration measurements.
3.1.3. Detection of leakages in the contact between the subsoil and the building
Results of measurements of radon concentration (cRn) in air samples collected in places, where contaminated soil-gas may enter into the house (cracks, etc.), are summarized in Table 2. Location of measuring points is presented in Figure 2.
Table 2: - Detection of leakages in the contact between the subsoil and the building
Measur ing point Description
cRn (kBq/m3)
I Living – front door threshold, right 0.723±0.12 II Living – front door threshold, left 0.947±0.230III Living – middle of the front wall 1.337±0.774IV Living – out corner with the bathroom 1.102±0.293V Living – corner with the larder, left 1.207±0.173VI Living – corner with the bathroom 1.353±0.192VII Living – corner Bedroom 2 with larder 0.974±0.128VIII Living – in front of the glazed tile stove 1.217±0,213IX Living – Bedroom 1 threshold, left 0,879±0.135X Bedroom 2 - right corner, outside wall 0.179±0.047XI Bedroom 2 – threshold, right 0.475±0.102XII Bedroom 2 – middle of the left wall 0.578±0.101XIII Bathroom – crack near the pipe 1.023±0.231XIV Bedroom 2 – middle of the right wall 0.673±0.10 XV Bedroom 1 – under the window, middle of the outside wall 0.973±0.137XVI Bedroom 1 – middle of the left wall 0.873±0.150XVII Bedroom 1 – in front of the glazed tile stove 0.328±0.110XVIII Bedroom 1 – threshold, right 0.579±0.149XIX Lobby – left corner 0.578±0.123
MAPPING OF THE HOUSE AND
DETECTION OF LEAKAGES AND
GAMMA ANOMALIES

Fig. 2: B , detection of leakages in the contact between the subsoil and the building - location of sampling points
3.1.4. Continual and integral measurements of indoor radon concentration
Results of simultaneous continual and/or integral measurements of indoor radon concentrations in different parts (rooms) of the house are presented in Fig. 3. Average values of indoor radon concentrations are given in Table 3.
CONTINUOUS AND INTEGRATED
RADON MEASUREMENTS

Table 3: - Average values of indoor radon concentration (cRn)
Location of sampling Bedroom 2 Bedroom 1 Living Basement Kitchen Apparatus Sarad Scout
446 Sarad Scout
447 Sarad Scout
445 Alpha Guard
Minimum (Bq/m3) 526 510 164 88 - Maximum (Bq/m3) 1617 990 809 3312 -
AM (Bq/m3) 710.51 744.30 299.57 296.88 - GM (Bq/m3) 691.71 733.24 281.21 196.04 -
Track detectors
CR39
Campaign I (Bq/m3) - 1353 1070 1325 272 Campaign II (Bq/m3) - 508 387 895 110
The exhalation rate from the floor of Bedroom 1 and 2 (ER = 45.46 Bq/m2/h, respectively 9.04 Bq/m2/h) was determined based on the data in fig. 4 (Rad7) and fig. 5 (Rad7).
Figure 4. Determining the exhalation rate for the floor (Bedroom 1 – Rad7).
Figure 5. Determining the exhalation rate for the floor (Bedroom 2 – Rad7).
MEASUREMENTS OF RADON
EXHALATION

A. Radon potential of the building site (RP):
- radon in soil measurements (C Rn kBq/m3 ) and soil
permeability (k m2 ) around the house in 15 points
CRn,75 k75 RP = (CRn,75-1) / (-log k75-10)
RP = 40 high radon risk (RP > 35).
(based on Neznal M. model)
B. Detection of radon leakages from cracks:
- By radon concentration measurements in the contact of the
floor and building sub-soil (> 1 kBq m-3)
Description (room) CRn [kBq m-3]
bedroom 1 (4 points) 0.4 - 1.1
bedroom 2 (12 points) 0.7 - 6.7
lobby (3 points) 0.5 - 4.7
bathroom (1 points) 0.5
statisticsC Rn
(kBq/m3)k
(m2)
Min 0.3 (p4) < 5,2E-14
Max 485.3 (p8) 1.6E-11
3th quartile 40.9 9.9E-12

C. Continous indoor radon measurements:
- Radon concentration measurements in same time in different rooms in the house, by radon monitors:
RoomCRn Bq m-3]
Min Max Mean
cellar 25 2874 1131
bedroom 1 67 578 330
bedroom 2 187 1425 889
lobby 100 546 333
bathroom 56 731 395
D. Gamma dose rate measurements: - Detection of gamma anomaly:
Description (room) D Sv h-1
bedroom 2, hot spot near the window 0.74
outdoor wall near the entrance, basement 0.28-0.40
CLOSED ROOMS


VENTILATOR/FAN
RADON SUMP
PIPES
MEMBRANE
AUTOMATIC SURVEILLANCE
SYSTEM
ACCESSORIES
THE MITIGATION SOLUTION existing buildings
an active sub-slab ventilation system

ACTIVE SOIL EXTRACTION/PRESURIZATION

COMBINED MEMBRANE + EXTRACTION

sump pit
kitchen
bedroom 1
bedroom 2
Entry

B. Testing the effect of the combination sub -soil extraction techniques (depressurisation by radon
extractors, electrical fan of 30 W and eolian) and anti radon membrane based on continuous
measurements of indoor radon concentrations in periods of accumulation and extraction (min 5+5 days)
determination the efficiency of the applied techniques ;

Testing radon remedial techniques in pilot house
A. Testing SUB-SOIL VENTILATION TECHNIQUES (depressurisation/pressurisation) by radon
extractors and electrical fans BASED ON CONTINUOUS MEASUREMENTS OF INDOOR RADON
CONCENTRATIONS IN PERIODS OF ACCUMULATION AND EXTRACTION (MIN. 5+5 DAYS)
determination the efficiency of the applied techniques ;Exp.1: depresurizare, vent. 2 + 4
0
200
400
600
800
1000
1200
1400
time [dd.mm. hh:mm]
camera 1
camera 2
sufragerie
baie
pivnita
Exp.2: depresurizare, vent. 1 + 3
0
100
200
300
400
500
600
700
800
time [dd.mm. hh:mm]
camera 1
camera 2
sufragerie
baie
pivnita

Exp. 3: depresurizare, vent. 4
0
100
200
300
400
500
600
700
800
time [dd.mm. hh:mm]
camera 1
camera 2
sufragerie
pivnita
Exp. 4: depresurizare, vent. 2
0
200
400
600
800
1000
1200
time [dd.mm. hh:mm]
camera 1
camera 2
sufragerie
baie
pivnita
Exp. 5: depresurizare, vent. 1
0
200
400
600
800
1000
1200
time [dd.mm. hh:mm]
camera 1
camera 2
sufragerie
baie
Exp. 11: depresurizare, vent. 1 + 2 + 3 + 4
0
200
400
600
800
1000
1200
time [dd.mm. hh:mm]
camera 1
camera 2
sufragerie
baie

THEORETICAL MODEL FOR ACCUMULATION AND EXTRACTION PERIODS
0
200
400
600
800
1000
1200
0 20 40 60 80 100 120 140 160 180 200t(hour)
C1
t1
C0 C2
acumulare
C0 = initial Rn concentration
(for accumulation),
C1 = saturated Rn concentration
(for accumulation),
C2 = Rn concentration for the
period of extraction,
t1 = accumulation time.
RADON REMEDIATION EFFICIENCY:
where Cafter and Cbefore are the annual means of integrated radon
concentrations before and after remediation
[%]100before
afterbefore
C
CCR
1
21
C
CCeff

Extraction experiment
roomaccumulation extraction Eff.
(%)C0 C1 k1 C1’ C2 k2
Exp. 1, depressurisation, fans 2+4
Bedroom 1 34 397 0,04 410 206 0,07 48 %
Bedroom 2 0 943 0,15 1134 275 0,08 71 %
Living 14 270 0,05 302 90 0,13 67 %
Bathroom 0 407 0,06 358 133 0,16 67 %
Cellar 25 90 0,11 130 33 1,03 63 %
Exp. 2, depressurisation, fans 1+3
Bedroom 1 187 376 0,02 324 189 0,05 50 %
Bedroom 2 191 826 0,04 810 248 0,08 70 %
Living 101 435 0,01 189 91 0,05 79 %
Bathroom 125 239 0,05 256 103 0,09 57 %
Cellar 45 - 49 - -
Exp. 3, depressurisation, fan 4
Bedroom 1 174 519 0,01 263 - 49 %
Bedroom 2 240 956 0,02 675 429 0,07 55 %
Living 143 - 162 - -
Cellar 64 - 50 - 22 %
Exp. 4, depressurisation, fan 2
Bedroom 1 69 349 0,03 329 191 0,03 45 %
Bedroom 2 208 1098 0,02 1117 261 0,08 76 %
Living 60 188 0,03 193 95 0,09 50 %
Bathroom 144 261 0,05 253 126 0,08 52 %
Cellar 46 - 43 - 7 %


Adress OwnerRadon potential
(RP)Room
Integrated measurements (Bq/m3)
Winter Spr ing Annual avg.
Dronca Mihai 119 bedroom 1461 1613 1537Lazea Mircea 148 bedroom 1406 909 1157Iordache Gh. 99 living room 1452 1188 1320Avram Dorel 85 bedroom 1353 508 931Petruse Traian 75 living room 901 902 902Filip Maria 123 bedroom 1025 774 900Lazea Sanda 79 living room 3092 1772 2432Lazea Viorel 136 bedroom 1587 1219 1403Brasovean Ioan 65,9 bedroom 1357 1002 1180Dronca Gheorghe 93 living room 1354 1277 1316
CÂMPANI 57 Dale Floarea 62 bedroom 1013 301 657CÂMPANI 71 Baic Gheorghe 159 bedroom 751 537 644CÂMPANI 103 Popa Gheorghe 51 bedroom 869 468 669CÂMPANI 279 Marta Florian 83 living room 1009 573 791
23 Mot Gheorghe 163 kitchen 1950 1206 1578189 Popa Ioan 192 bedroom 1392 623 1008118 Butisca Danut 21 bedroom 1446 1169 1308136 Muset Dumitru 74 office 3463 1542 2503
Aron Vasile 102 bedroom 1107 822 965
SELECTED HOUSES (20)

Type of room
Frequency
AM
(Bq m-3)
SD
(Bq m-3)
GM
(Bq m-3)
GSD
(Bq m-3)
Median
(Bq m-3)
Max
(Bq m-3)
C.V.
(%)
% (No> 300
(Bq m-3)
Kitchen 247 196 191 141.3 2.2 131 1278 98 18 (44)
Bedroom/ Living
618 273253
197.12.2
196 2016 91 31 (193)
Cellar 233 251 343 151.8 2.5 136 3054 137 22 (52)
Other 30 188 161 133.2 2.4 135 651 86 20 (6)
a. Descriptive statistics for the radon measurements BY ROOM TYPE within dwellings of -Stei area.
LocationNumber
of houses
AM
(Bq m-3)
SD
(Bq m-3)
GM
(Bq m-3)
GSD
(Bq m-3)
Median
(Bq m-3)
Max.
(Bq m-3)
C.V.
(%)
% (No.) >300
(Bq m-3)
131 227 215 162.9 2.2 148 1186 95 22 (29)
Nucet 15 172 87 150.2 1.8 150 337 51 7 (1)
71 279 172 236.3 1.8 239 1067 62 39 (28)
Câmpani 86 244 121 214.0 1.7 224 593 50 30 (26)
Total 303 241 178 191.4 2.0 194 1186 74 28 (84)
b. Descriptive statistics of indoor radon concentrations in monitored dwellings -Stei radon-prone area.

A.M. = 241 Bq/m3
S.D. = 178 Bq/m3
G.M. = 191 Bq/m3
GSD = 2 Bq/m3
Median = 194 Bq/m3
P= 0.21: Shapiro-Wilk test
Log-normal distribution of average concentration in 303 houses
A. (Dinu), C. Cosma, … C.Sainz, (2012), Thorough investigation on indoor radon in radon-prone area (Romania), Science of The Total Environment, 431, 78–83.


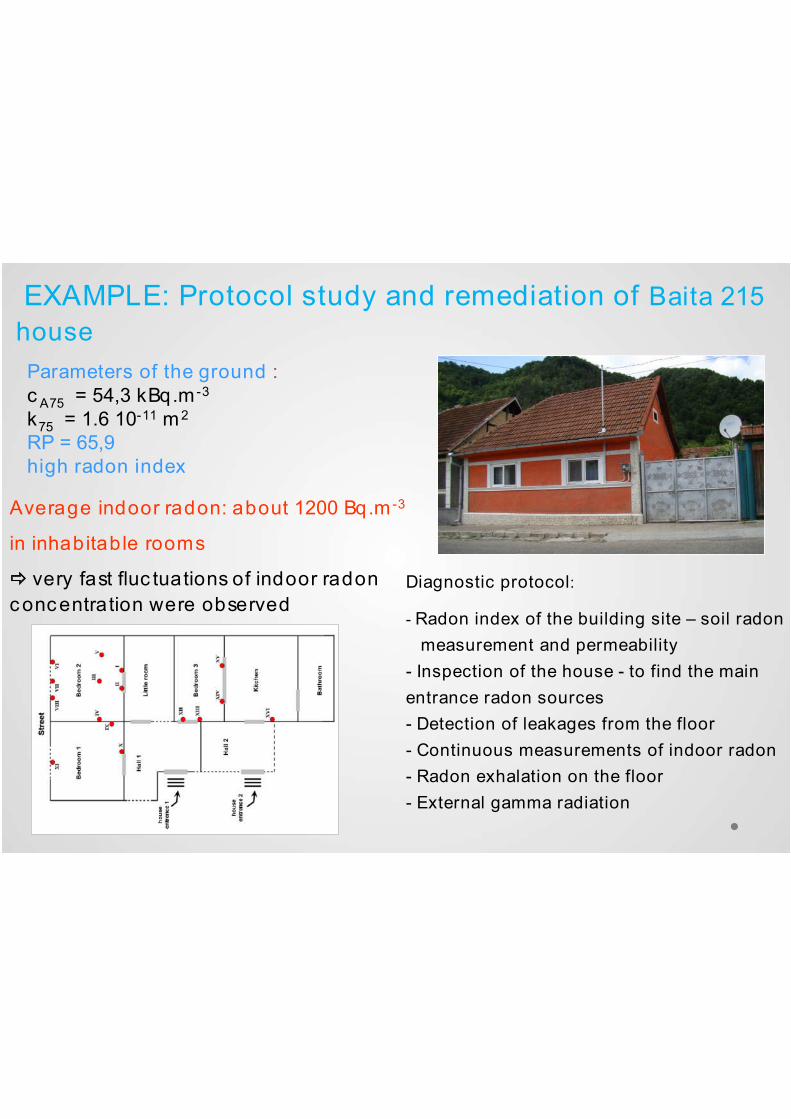
EXAMPLE: Protocol study and remediation of Baita 215
house
Diagnostic protocol:
- Radon index of the building site – soil radon
measurement and permeability
- Inspection of the house - to find the main
entrance radon sources
- Detection of leakages from the floor
- Continuous measurements of indoor radon
- Radon exhalation on the floor
- External gamma radiation
Parameters of the ground :c A75 = 54,3 kBq.m-3
k75 = 1.6 10-11 m2
RP = 65,9high radon index
Average indoor radon: about 1200 Bq.m-3
in inhabitable rooms
very fast fluc tuations of indoor radon
c onc entration were observed
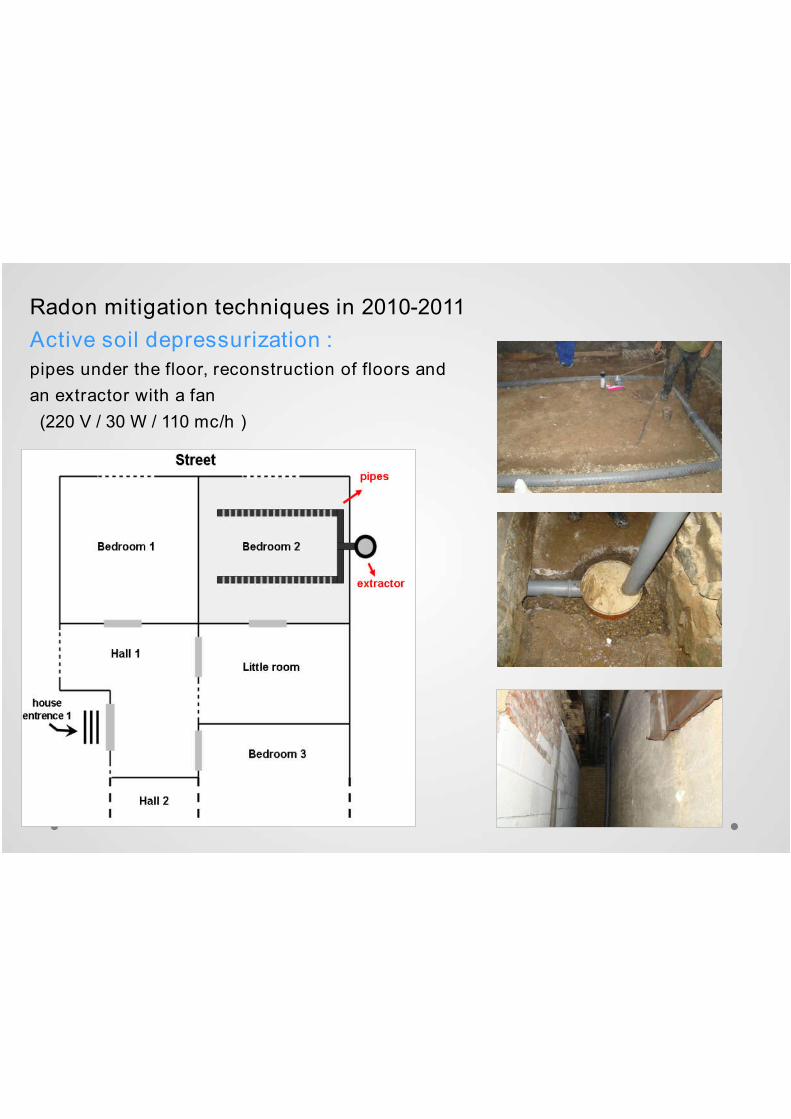
Radon mitigation techniques in 2010-2011
Active soil depressurization :
pipes under the floor, reconstruction of floors and
an extractor with a fan
(220 V / 30 W / 110 mc/h )

0
500
1000
1500
2000
2500
time [dd.mm. hh:mm]
bedroom 1
bedroom 2
accumulation
extraction
Mitigation type RoomC med. Eff.
(%)C before C after pres.
Active soil depressurization
bedroom 1 1102 121 - 89
bedroom 2 272 77 - 72
Monitoring of radon concentration during accumulation and DEPRESSURISATION by the fan

Exp. 15: Eoliana + Vent. 1+3 (depresurizare)
0
200
400
600
800
1000
1200
1400
time [dd.mm. hh:mm]
dormitor 1
dormitor 2
eoliana
eoliana + vent. electric
Exp. 14: Eoliana + Vent. 1+2 (depresurizare)
0
200
400
600
800
1000
1200
1400
time [dd.mm. hh:mm]
dormitor 1
dormitor 2
eoliana
eoliana + vent.electric
Experiment roomC Rn Bq/m3 Eff (%)
before eolian elect. fan eolian elect. fan
Eolian + fans 1+2 (depressurisation)
Bedroom 1 297 280 224 6% 25 %
Bedroom 2 787 710 144 10% 82 %
Eolian + fans 1+3 (depressurisation)
Bedroom 1 297 300 181 - 39 %
Bedroom 2 787 800 111 - 86 %
COMBINATION OF SUB-SOIL EXTRACTION TECHNIQUES
(DEPRESSURISATION) AND EOLIAN

Experiment
Membrane + (el. Fan + eoliana)
Bedroom 2
C Rn Bq/m3 Eff (%)
before Membr.Membr.+
(el.fan+eolian)Membr.
Membr. + (el.fan+eolian)
787 351 227 55 % 71 %
Results of the measurements by the effect of the RADON MEMBRANE
and sub-soil extraction (depressurisation) and eolian
0
100
200
300
400
500
600
700
800
time (mm.dd. hh:mm)
dormitor 2
membrana
membrana + vent.el. + eoliana

No. House adress Room
Annual CRn (Bq m-3) RemediationEff.(%)
Average Remediation
Eff. (%)all rooms
Variation range
Eff. (%)Before
remediationAfter
remediation
1. Baita 6 Bedroom 1354 159 88.3 79.0 71.1 - 88.3
2. Baita 75 A Bedroom 982 143 85.4 85.3 85.3 - 85.4
3. Baita 75 B Living 872 107 87.7 87.7 87.7
4. Living 1062 100 90.6 89.5 88.3 - 90.6
5. Baita 119 Bedroom 761 137 82.0 84.5 80.5 - 82
6. Bedroom 948 92 90.3 90.3 90.3
7. Baita 138 Bedroom 534 113 78.8 78.8 65.6
8. Living 771 152 80.4 78.3 75.9 - 80.4
9. Baita 206 Bedroom 1557 91 94.2 93 83.5-94.2
10. Baita 213 Bedroom 1205 112 90.7 79.1 67.5-90.7
11. Baita 215 Bedroom 1010 117 88.4 81.9 75.5-88.4
12. Baita 228 Bedroom 1059 155 85.3 86.4 79.1 - 85.3
13. Campani 57 Bedroom 530 91 82.8 82.8 82.8
14. Campani 71 Bedroom 548 86 84.3 77.0 72.6 - 84.3
15. Câmpani 103 Living 560 122 78.2 78.2 78.2
16. Kitchen 3389 867 74.4 70.6 66.7 - 74.4
17. Bedroom 1177 214 81.8 65.2 65.4 - 81.8
18. Fanate 118 Bedroom 1127 77 93.2 90.8 88.4-93.2
19. Fanate 189 Bedroom 834 219 73.7 72 70.3-73.7
20. Nucet 9 Bedroom 1958 96 95.1 95.1 95.1
21 Pilot house Bedroom 1395 174 87.5 76.9 68.7-87.5
AVERAGE 85.4 81.4 65.4-95.1
Min 73.7 65.2Max 95.1 95.1
Efficiency of the mitigated rooms/houses


The project
General objectiveImprove the Indoor Air Quality in houses with energy saving
systems, thus contributing to increase the safety and health of the population.
URBAN APPROACH: Bucuresti, Cluj Napoca, Iasi, Sibiu and Timisoara.
48 months (2016 – 2020)
SMART SYSTEMS FOR CONTROL AND MITIGATION OF RESIDENTIAL RADON LINKED WITH ENERGY EFFICIENCY IN ROMANIA

Introduction
REGULATORY FRAMEWORK
2012/27/EU Directive on Energetic Efficiency
2013/59/EU Directive EURATOM
(TO BE IMPLEMENTED IN 2017 AND 2018 RESPECTIVELY)

IntroductionSOMECONSEQUENCES…
INDOOR ENERGY EFFICIENCY (IEE)
Reduction of EnergyConsumption
Reduction of ventilation(renovation rate of
indoor air with freshoutdoor air)
INDOOR AIR QUALITY (IAQ)
Accumulation of indoorair pollutants
Construction material and combustion
products (VOC’s, CO2, CO, etc..)
Radon (222Rn) concentration

Introduction
Necessity of ’÷harmonization÷÷…
Integrated measurement system(CO, CO2, VOC’s, Rn, P, t, H)
Automatic Smart System- Analyze- Communicate- Take decisions
The ‘’radon example’’
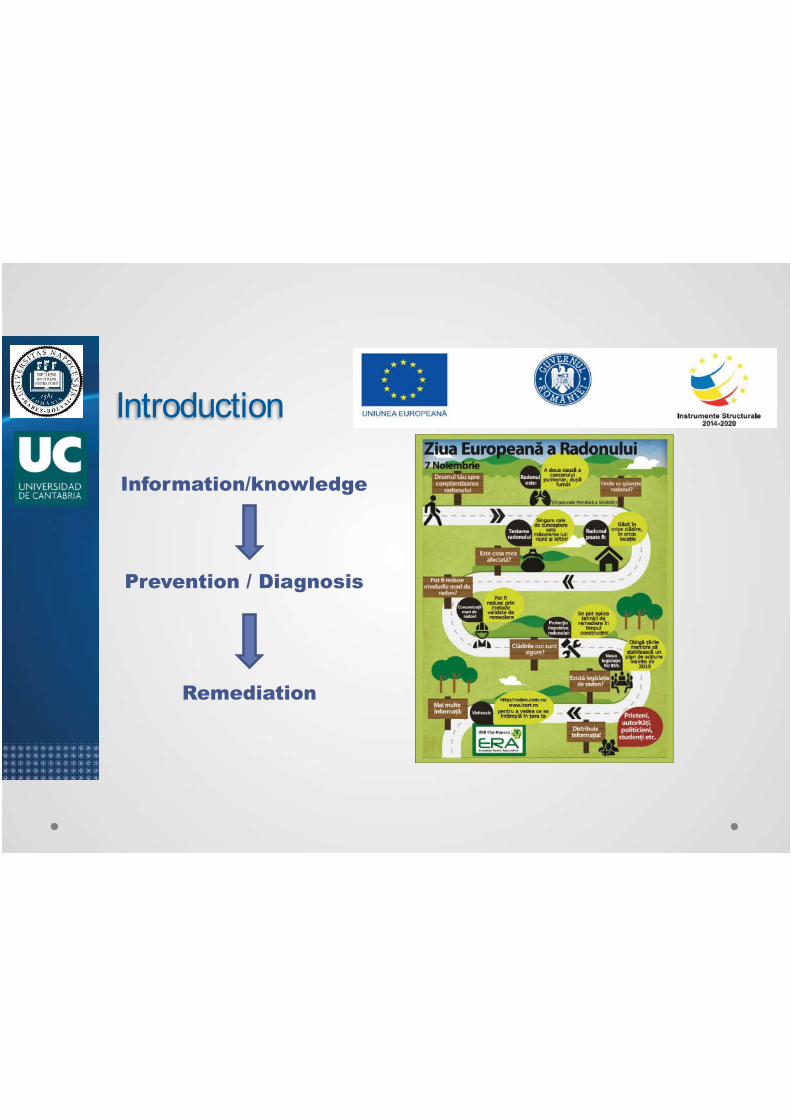
Introduction
Information/knowledge
Prevention / Diagnosis
Remediation

Introduction
IRART PROJECT
(2010-2013)
We got the information…

Introduction
IRART PROJECT
(2010-2013)
We made the diagnostic…

Introduction
IRART PROJECT
(2010-2013)
… and we reduced radon exposure…
0
500
1000
1500
2000
2500
time [dd.mm. hh:mm]
bedroom 1
bedroom 2
accumulation
extraction

The projectMATERIAL RESOURCES
CAPACITIESo Radon metrology (high quality
control)o Radon diagnosis and remediationo Risk communication
Rn AND INDOOR AIR QUALITY IN URBAN
ENVIRONMENT
Proiect POS CCE ID 586 - SMIS 12487/ 160/ 15.06.2010
derulat in perioada 15 IUNIE 2010 - 14 IUNIE 2013

The projectHUMAN RESOURCES
SCIENTIFIC: 23 researchersUBB (Cluj): 7 + 2 technicians+ 3 PhD studentsUTCB (Bucharest): 3 + 1 PhD studentUTC (Cluj): 6 post docUS (Cluj): 1 post docUC (Santander, Spain)
FINANTIAL/ADMINISTRATIVEUBB (Cluj)Primainvest (Cluj)
Multidisciplinary team
Afford complex project
Communication


The project

The project


Solu ia 1
Racitor evaporativ
Put canadian
Recuperatorcaldura

- Designed to evaluate INDOOR AIR QUALITY (radon, CO2, CO,VOC’s) and CONFORT (t, H, p) in relation to energy efficiency in 100houses with high exposure to radon (CRn > 300 Bq/m3).
- A prototype system for continuous monitoring and remote datatransmission.
THE PROTOTYPE

Integrated monitoring system (CO, CO2, VOC’s, Rn, P, t, H)
Automatic “ Smart” system:- Analyze
- Communicate- Take decisions
CURENT DEVELOPMENT OF PROTOTYPE

Integrated sensors:
- Radon Sensor (Tesla TSR2): 0 – 50000 Bq/m3, T: 0 - 100 , H: 0 -100%
- BLOC VOC Sensor (MEMS): 0 – 100 %
- BLOC CO2 sensor (CDM7160 CO2 ): 0 – 4092 ppm
- BLOC Sensor CO (TGS5141 CO): 0 – 18414 ppm
- BLOC THP sensor (ambient temperature, humidity and atmospheric pressure):-40…+85 ; 0-100 RH;
CURENT DEVELOPMENT OF PROTOTYPE

Proposed monitoring system communication scheme
The SMART_RAD_EN monitoring system
CURENT DEVELOPMENT OF PROTOTYPE

CURENT DEVELOPMENT OF PROTOTYPE
User interface Mobile app interface

RESEARCH TESTING - Radon
Monitoring Radon Activity Concentration
in 3 rooms

RESEARCH TESTING - CO
7 CO sensors were calibrated

RESEARCH TESTING – CO2
*R – Measured concentration / Theoretical concentration
According to the distribution of R only 1 sensor needs to be calibrated

- The monitoring system will act as a mediatorbetween user behaviour and indoor air quality.
- The owner will be able to understand the effectsof his behaviour on indoor air quality and will beable to change his routine in order to increaseand maintain indoor air quality to the desiredlevel.

TO BE CONTINUE… 2020
- PROTOTYPES INSTALATION- IMPLEMENTATION OF SOLUTIONS- VALIDATION- DISEMINATION- ETC…

Imposiblesolo… ¡gracias! multumesc!