Embed Size (px)
Citation preview

Think 2020
Lab Center – Hands-On Lab Session 6018
Hands on lab for Db2 Data Management Console
Jason Sizto

Think 2020
DISCLAIMER IBM’s statements regarding its plans, directions, and intent are subject to change or withdrawal without notice at IBM’s sole discretion. Information regarding potential future products is intended to outline potential future products is intended to outline our general product direction and it should not be relied on in making a purchasing decision. The information mentioned regarding potential future products is not a commitment, promise, or legal obligation to deliver any material, code or functionality. Information about potential future products may not be incorporated into any contract. The development, release, and timing of any future features or functionality described for our products remains at our sole discretion I/O configuration, the storage configuration, and the workload processed. Therefore, no assurance can be given that an individual user will achieve results like those stated here. Information in these presentations (including information relating to products that have not yet been announced by IBM) has been reviewed for accuracy as of the date of initial publication and could include unintentional technical or typographical errors. IBM shall have no responsibility to update this information. This document is distributed “as is” without any warranty, either express or implied. In no event, shall IBM be liable for any damage arising from the use of this information, including but not limited to, loss of data, business interruption, loss of profit or loss of opportunity. IBM products and services are warranted per the terms and conditions of the agreements under which they are provided. IBM products are manufactured from new parts or new and used parts. In some cases, a product may not be new and may have been previously installed. Regardless, our warranty terms apply.” Any statements regarding IBM's future direction, intent or product plans are subject to change or withdrawal without notice. Performance data contained herein was generally obtained in controlled, isolated environments. Customer examples are presented as illustrations of how those customers have used IBM products and the results they may have achieved. Actual performance, cost, savings or other results in other operating environments may vary. References in this document to IBM products, programs, or services does not imply that IBM intends to make such products, programs or services available in all countries in which IBM operates or does business. Workshops, sessions and associated materials may have been prepared by independent session speakers, and do not necessarily reflect the views of IBM. All materials and discussions are provided for informational purposes only, and are neither intended to, nor shall constitute legal or other guidance or advice to any individual participant or their specific situation. It is the customer’s responsibility to insure its own compliance with legal requirements and to obtain advice of competent legal counsel as to the identification and interpretation of any relevant laws and regulatory requirements that may affect the customer’s business and any actions the customer may need to take to comply with such laws. IBM does not provide legal advice or represent or warrant that its services or products will ensure that the customer follows any law. Information concerning non-IBM products was obtained from the suppliers of those products, their published announcements or other publicly available sources. IBM has not tested those products about this publication and cannot confirm the accuracy of performance, compatibility or any other claims related to non-IBM products. Questions on the capabilities of non-IBM products should be addressed to the suppliers of those products. IBM does not warrant the quality of any third-party products, or the ability of any such third-party products to interoperate with IBM’s products. IBM expressly disclaims all warranties, expressed or implied, including but not limited to, the implied warranties of merchantability and fitness for a purpose. The provision of the information contained herein is not intended to, and does not, grant any right or license under any IBM patents, copyrights, trademarks or other intellectual property right. IBM, the IBM logo, and ibm.com are trademarks of International Business Machines Corporation, registered in many jurisdictions worldwide. Other product and service names might be trademarks of IBM or other companies. A current list of IBM trademarks is available on the Web at "Copyright and trademark information" at: www.ibm.com/legal/copytrade.shtml. Java and all Java-based trademarks and logos are trademarks or registered trademarks of Oracle and/or its affiliates. Linux is a registered trademark of Linus Torvalds in the United States, other countries, or both. Microsoft, Windows, Windows NT, and the Windows logo are trademarks of Microsoft Corporation in the United States, other countries, or both. OpenShift is a trademark of Red Hat, Inc. UNIX is a registered trademark of The Open Group in the United States and other countries. © 2020 International Business Machines Corporation. No part of this document may be reproduced or transmitted in any form without written permission from IBM. U.S. Government Users Restricted Rights — use, duplication or disclosure restricted by GSA ADP Schedule Contract with IBM.
Think 2020
We Value Your Feedback
Don’t forget to submit your Think 2020 session and speaker feedback! Your feedback is very
important to us – we use it to continually improve the conference.
Access the Think 2020 agenda tool to quickly submit surveys from your smartphone or laptop.

Think 2020
Table of Contents
1 Introduction .............................................................................................................................. 5 1.1 High Level Architecture ...................................................................................................................... 6
2 Getting Started ......................................................................................................................... 7 2.1 Lab Environment ................................................................................................................................. 7
2.1.1 VM setup ...................................................................................................................................... 7 2.1.2 Logging into VM ............................................................................................................................ 8 2.1.3 Start Db2 .................................................................................................................................... 10
3 Data Management Console lab ................................................................................................. 13 3.1 Install and Configure DMC ................................................................................................................ 13
3.1.1 Installing DMC ............................................................................................................................ 13 3.1.2 Setup Repository ....................................................................................................................... 19 3.1.3 Statistics Event Monitor opt-in .................................................................................................. 20 3.1.4 Setup Db2 connections .............................................................................................................. 21 3.1.5 Setup DMC Authentication ......................................................................................................... 27
3.2 Monitoring ......................................................................................................................................... 38 3.2.1 HOME page ................................................................................................................................ 38 3.2.2 Database Summary page ........................................................................................................... 50 3.2.3 Database time spent page ......................................................................................................... 53 3.2.4 Database usage page ................................................................................................................. 63 3.2.5 Statements ................................................................................................................................. 66 3.2.6 Locking ....................................................................................................................................... 73
3.3 Restful Services ................................................................................................................................ 78 3.3.1 Pre-req for using the APIs ......................................................................................................... 79 3.3.2 Introduction to DMC APIs .......................................................................................................... 79 3.3.3 Create connection profiles ......................................................................................................... 80 3.3.4 Grant connection profile to users .............................................................................................. 87
4 Conclusion .............................................................................................................................. 91

Think 2020
1 Introduction
IBM® Db2® Data Management Console is the next step in the evolution of IBM Data Server Manager. Your whole
team can work together to manage, monitor, receive alerts and optimize the performance of one or hundreds of
Db2 databases from a single screen.
Much like Data Server Manager, you can install the console on a central server (or your laptop) and manage one
to hundreds of databases across the Db2 family from ground to cloud. You can download and install on a
Windows, Linux, AIX, or now a MacOS machine, and share the interface with your team through a web-based
console.
DMC includes alerts, monitoring, historical data collection, object administration including privilege
management, relationship mapping and exploration. You can also edit, run and analyze your SQL with an
updated editor and visual explain tool.
Yet, there are two things that will seem the most different.
1. How we approach monitoring and problem determination using our Rapid Triage Summary page.
2. Changes to the underlying architecture that will open the console to team collaboration, interface
composition and extension with a fully open set of APIs.
Rapid Triage Summary Page
At a high level the health and status of your database is represented by six stories. We have developed six core
instruments to understand the availability, responsiveness, throughput, resource use, user contention and
time spent in each Database Summary. What these instruments or "widgets" tell you make it easy to quickly
understand the nature and status of your database on one screen.
These same stories and metrics will also be available on a single enterprise HOME page that will summarize all
your databases from a single screen.
Open RESTful API
Everything we do through the user interface goes through a new RESTful API that is open and available. That
includes APIs to run SQL, Manage Database Objects and Privileges, Monitor performance, load data and files and
configure all aspects of the console.
In this hands-on-lab, we will show how to:
• Install DMC and configure authentication
• Use the Rapid Triage pages to divide and conquer and drill down to find performance problems
• Use the new RESTful APIs to perform DMC Administrative tasks (that are tedious to perform with UI)

Think 2020
1.1 High Level Architecture The following chart shows the high-level architecture for the Hands-on Lab environment.
In the lab, we are simulating a typical customer environment using multiple VMs. The Data Management Console
will be installed on DMC Ubuntu VM. Typically, we encourage DMC to be installed on a dedicated server with
appropriate resources, especially if it is intended to manage large amount of Db2s.
For DMC repository and Monitoring database, we have a separate Db2 instances in the lab. It is advised not to
install DMC repository on same instance of Db2 if there are critical database(s) collocated together. Repository
will store the historical monitoring metrics and DMC metadata for all its managed databases. The DMC
repository is installed on the DMCREPO Ubuntu VM in this lab.
The Monitoring Database is installed on the TPCDS Ubuntu VM. The Monitoring database is loaded with the
TPCDS benchmark database.
For accessing the Data Management Console, we have created a Windows 10 VM call ACCESSWIN. The
ACCESSWIN VM will serve as a machine that access different VMs in the lab.
Monitoring
Database - TPCDS
DMC Repository
Data Management
Console
Windows VM –
Browser
Think 2020
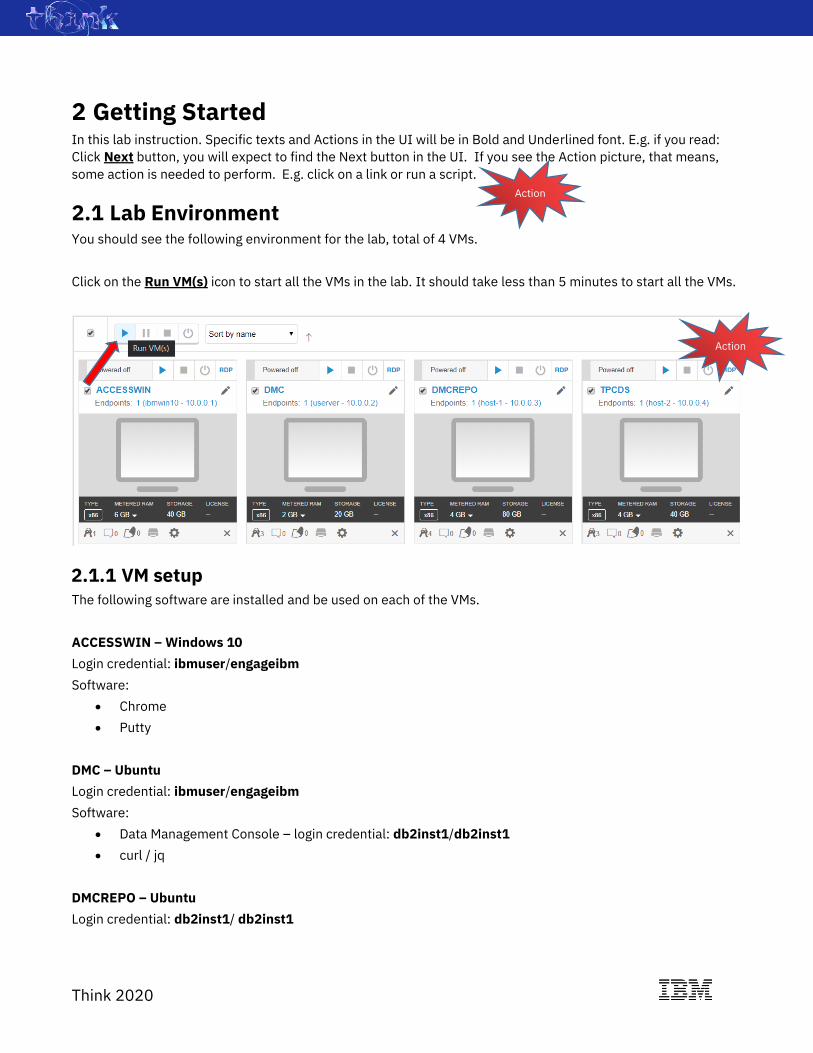
2 Getting Started In this lab instruction. Specific texts and Actions in the UI will be in Bold and Underlined font. E.g. if you read:
Click Next button, you will expect to find the Next button in the UI. If you see the Action picture, that means,
some action is needed to perform. E.g. click on a link or run a script.
2.1 Lab Environment You should see the following environment for the lab, total of 4 VMs.
Click on the Run VM(s) icon to start all the VMs in the lab. It should take less than 5 minutes to start all the VMs.
2.1.1 VM setup The following software are installed and be used on each of the VMs.
ACCESSWIN – Windows 10
Login credential: ibmuser/engageibm
Software:
• Chrome
• Putty
DMC – Ubuntu
Login credential: ibmuser/engageibm
Software:
• Data Management Console – login credential: db2inst1/db2inst1
• curl / jq
DMCREPO – Ubuntu
Login credential: db2inst1/ db2inst1
Action
Action

Think 2020
• Software:
Db2 – login credential: db2inst1/db2inst1
TPCDS – Ubuntu
Login credential: db2inst1/ db2inst1
Software:
• Db2 – login credential: db2inst1/db2inst1
2.1.2 Logging into VM In this lab, we will try to use the ACCESSWIN VM as the main working desktop. We will use it to access other
VMs in the lab.
Click on the ACCESSWIN link to access this VM. E.g.
You will get a separate browser tab. This will be the main desktop for the lab. E.g.
Action

Think 2020
Something important
Useful Tips
You can click on the Fit to Window icon to change the resolution for the VM display.
E.g.
You can always access the credentials for the VM by clicking the Credentials icon on the top of the desktop.
E.g.

Think 2020
Cut and paste between your personal computer and the VM can be done by clicking the Clipboard button. E.g.
2.1.3 Start Db2 Start DMC Repository
In the ACCESSWIN VM, double click the dmcrepo icon in the desktop to start a Putty session to dmcrepo VM.
E.g.
Login using credential: db2inst1/db2inst1
After successful login, issue: db2start
E.g.
Action

Think 2020
Start TPCDS
Similarly, double click the tpcds icon in the desktop to start a Putty session to tpcds VM.
E.g.
Action
Action

Think 2020
Login using credential: db2inst1/db2inst1
After successful login, issue: db2start
Then, issue: ./run_workload.sh &
E.g.
Now, you have successfully started the 2 Db2 instances used in this lab. And you have started the workload for
the lab.
Let’s proceed to next section for DMC.
Action

Think 2020
3 Data Management Console lab In this lab, you will start from the very beginning with installing Data Management Console and perform the
important authentication setup steps.
Then, followed by examples on how to use DMC Monitoring pages to quickly divide and conquer and drill down
to find performance problem in your Db2 databases. Along the way you will gain insight on how to use the
Administer and Run SQL functions in DMC.
You will also learn how to use RESTful API to perform DMC administrative tasks.
We have a lot to cover today. So, let’s go and dive right in!
3.1 Install and Configure DMC
3.1.1 Installing DMC
At the moment this lab is being written, the latest DMC version 3.1.2 code is not GA yet. Therefore, the image
used in this lab may have slight differences when compare to the 3.1.2 GA image.
You can obtain the latest DMC package from the DMC product page: https://www.ibm.com/products/db2-data-
management-console/details
You can also obtain it from Passport Advantage or IBM Fix Central page. In this lab, we will be installing DMC
package using the Script installer.
To get started, double click the dmc icon in the desktop to start a Putty session to the dmc VM.
E.g.
Login using credential: ibmuser/engageibm
Action

Think 2020
After successful login, issue the following 3 commands to locate and extract the DMC package.
cd /opt/dmc
ls
tar xvfz ibm-datamgmtconsole-3.1.2-linux.tgz
E.g.
After the DMC package is extracted, issue the following commands to launch the setup script:
cd ibm-datamgmtconsole
ls
./setup.sh
E.g.
Enter 1 to perform new install
Action
Action

Think 2020
Enter 1 to accept license agreement
Enter superadmin as default administrator ID.
Enter passw0rd as password for the default administrator account. Confirm by enter passw0rd again.
Enter Y to continue the setup.
E.g.
Action
Action

Think 2020
The DMC server is now being installed, and the server will be automatically started afterwards.
After successful installation, it will show you the URLs for accessing the DMC. Note down the URLs.
Summary
* Web console HTTP URL
http://dmc:11080/console (login: superadmin)
* Web console HTTPS URL
https://dmc:11081/console (login: superadmin)
E.g.
Action

Think 2020
You have successfully installed DMC. Let’s verify the DMC can be accessed from ACCESSIBM VM browser.
Double Click the Chrome icon to open the Chrome browser. From the bookmark tool bar, click on the DMC
bookmark, and it will open to the DMC login page.
E.g.

Think 2020
Let’s login to DMC using credential: superadmin/passw0rd
You have now successfully installed the package. Next section will show you the configuration steps.
Action
Action

Think 2020
3.1.2 Setup Repository
Once you logged in to DMC, the first thing we need to do is to setup a Repository for DMC to store the metadata
and collection history for the monitoring databases.
In order to save time, an empty database called DMC_REPO is already created in the dmcrepo VM with the
following connection DDLs.
Pre-executed DDL:
$db2
CREATE DATABASE DMC_REPO USING CODESET UTF-8 TERRITORY US PAGESIZE 8 K
CONNECT TO DMC_REPO
UPDATE DB CFG USING LOGPRIMARY 6 LOGSECOND 50 LOGFILSIZ 51200
UPDATE DB CFG USING SELF_TUNING_MEM ON
TERMINATE
$ db2
DEACTIVATE DB DMC_REPO
ACTIVATE DB DMC_REPO
TERMINATE
Please note that DMC repository requires the database locale to be Unicode. And we have increased the number
of logfiles and the logfile size initially to avoid long transaction roll back, you can adjust the logging values base
on the size and number of databases you plan to configure in DMC.
Something important
Customize Repository is possible:
Note:
Customizing the storage location for the DMC repository database is possible. This is supported by manually
editing the DMC repository DDLs in the scripts provided before executing them.
For more information on how to setup the DMC repository, you can refer to the Knowledge Center page:
https://www.ibm.com/support/knowledgecenter/en/SS5Q8A_3.1.x/com.ibm.datatools.dsweb.ots.installconfig.
doc/topics/creatingrepo.html
Enter the Connection information to the UI and click Next.
Connection information for the DMC repository:
Host: dmcrepo
Port: 50000
Database: DMC_REPO
Credential: db2inst1/db2inst1

Think 2020
Configuration of the DMC repository will take a few minutes.
Once the repository configuration is successful, you will be moved to the Statistics Event Monitor opt-in page.
3.1.3 Statistics Event Monitor opt-in
The opt-in page is introduced at DMC version 3.1.2. It allows you to turn on Statistics Event Monitor to monitor
the Statements Response time. The collected information will be shown in the Query run time distribution
widget in the Monitor Summary page.
The Query run time distribution widget will show you a histogram of execution elapse times for the queries
running in the time frame selected.
We will opt-in to this option by toggle the Set statistics event monitor opt-in to On.
By doing this step, DMC will create the Statistics Event Monitor and the tablespace that holds the tables for the
event monitor. An ATS task is also created as watchdog to the created Statistics Event Monitor as well. Please
Action

Think 2020
note the SYSDEFAULTUSERWORKLOAD and SYSDEFAULTADMWORKLOAD will be altered to have COLLECT
AGGREGATE ACTIVITY DATA BASE workload attribute enabled.
E.g.
Click Next to continue to set up the connection to monitor database.
Something important
Monitoring overhead:
Using Event Monitors in Db2 will incur additional overhead to the database environment albeit small. You can
turn on or off this function anytime from Settings icon > Stats event monitor opt-in page to opt-out. After
that, go to Settings icon > Event monitor profile page to disable Stats event monitor individually. Opting in
with this option may also cause extra overhead due to COLLECT AGGREGATE ACTIVITY DATA BASE is turned on
for SYSDEFAULTUSERWORKLOAD and SYSDEFAULTADMWORKLOAD.
NOTE: If you had existing workload, you need to manually enable COLLECT AGGREGATE ACTIVITY DATA BASE
workload attribute before you will get query distribution for query in this workload.
3.1.4 Setup Db2 connections
The next step is to create the monitoring connection to your Db2.
Action

Think 2020
In this lab, we will be monitoring the TPCDS_1G benchmark database. Enter the following connection
information in the UI. Click Save button when finished.
Connection information:
Connection name: TPCDS_1G
Host: tpcds
Port: 50000
Database: TPCDS_1G
Credential: db2inst1/db2inst1

Think 2020
Something important
pureScale support:
In DMC version 3.1.2, Purescale supported is added. You can see the Initialize pureScale checkbox is available
in the page above. By selecting the checkbox, connections for all pureScale cluster members are added
automatically when connection profile is created.
Action

Think 2020
pureScale status, member performance and CF summary monitoring are now available. Alerts for pureScale
member status, cluster host status, cluster CF status, group bufferpool hit ratio, total page reclaims, virtual
memory in use in CF are added.
Administer page supports pureScale member and CF object explore.
You have now successfully Configure DMC to monitor the TPCDS_1G database.
We will add the DMC_REPO database connection, so that we can monitor and manage the DMC repository using
DMC itself. Click on the Add more connections button.
E.g.
In the Connection profile page, click Add Connection + button. Then, choose the default Add a connection radio
button and click Next.
E.g.
Action

Think 2020
Enter the following connection information in the UI. Click Save button when finished.
Connection information:
Connection name: DMC_REPO
Host: dmcrepo
Port: 50000
Database: DMC_REPO
Credential: db2inst1/db2inst1
Action

Think 2020
You have successfully added the DMC_REPO connection to repository.
Action

Think 2020
Now, click on the Databases link to go to the DMC HOME page.
E.g.
This is the DMC HOME page; you will see a summary of all the configured databases in DMC.
At this point, it will take some time for monitoring data to be collected for the lab. Let’s go through an important
configuration step, the Authentication setup, in next the exercise.
3.1.5 Setup DMC Authentication
By default, after DMC is setup, only the default administrator account is setup. We call this the super admin
account. Without proper authentication method setup, this will be the only account that can access the DMC.
Beside the super admin account, DMC supports the LDAP authentication and Repository authentication. In this
lab, we will setup Repository Authentication for DMC. When authentication is set to repository, user
authentication will be delegated to Db2, specifically, the DMC Repository database connection.
In DMC, there are 2 roles. It is the DMC Administrator role and the User role. The DMC Administrator role is
responsible to administer DMC, e.g. setup security option, connections, email / SNMP communication for DMC.
And DMC User role are user that will use DMC to connect to Db2. They can be DBAs, Developers, or any users
that needs to connect to Db2.
In repository authentication, the DMC role can now be setup with Db2 level privileges. You can use Db2
Authorities, Db2 Groups, Db2 Roles and Db2 UDF to map users to DMC Administrator or User role. In this
exercise, we will be using Db2 UDF to map DMC Administrator and User role.
In the DMC_REPO instance, the following users are pre-created.
• db2inst1 – SYSADM for the Db2. It does not have SECADM and ACCESSCTRL authority.
• secadmin – SECADM for the database. It is the typical security officer, it has SECADM and ACCESSCTRL
authority, no DATAACCESS authority.
• peter – DBADM for the database. This is DBA. DMC Administrator role will be granted to peter.
• paul – SQLADM for the database. This is developer. DMC User role will be granted to paul.
• mary – SQLADM for the database. This is developer. DMC User role will be granted to mary.
Action
Think 2020
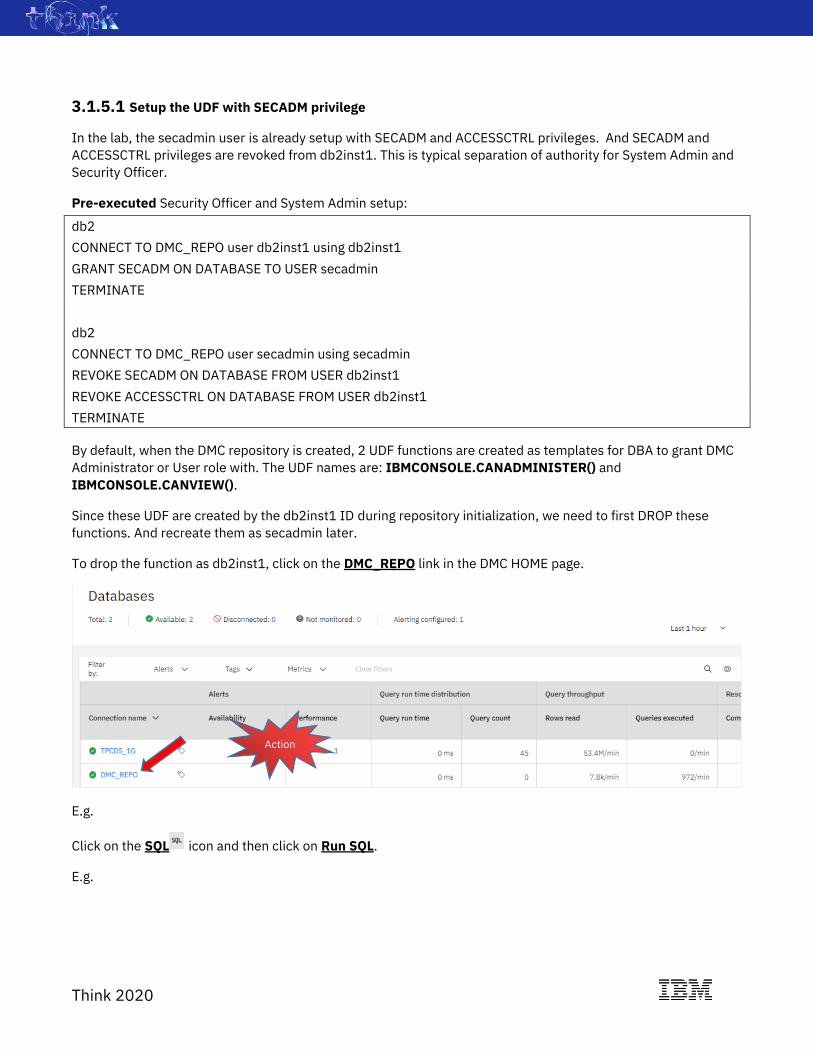
3.1.5.1 Setup the UDF with SECADM privilege
In the lab, the secadmin user is already setup with SECADM and ACCESSCTRL privileges. And SECADM and
ACCESSCTRL privileges are revoked from db2inst1. This is typical separation of authority for System Admin and
Security Officer.
Pre-executed Security Officer and System Admin setup:
db2
CONNECT TO DMC_REPO user db2inst1 using db2inst1
GRANT SECADM ON DATABASE TO USER secadmin
TERMINATE
db2
CONNECT TO DMC_REPO user secadmin using secadmin
REVOKE SECADM ON DATABASE FROM USER db2inst1
REVOKE ACCESSCTRL ON DATABASE FROM USER db2inst1
TERMINATE
By default, when the DMC repository is created, 2 UDF functions are created as templates for DBA to grant DMC
Administrator or User role with. The UDF names are: IBMCONSOLE.CANADMINISTER() and
IBMCONSOLE.CANVIEW().
Since these UDF are created by the db2inst1 ID during repository initialization, we need to first DROP these
functions. And recreate them as secadmin later.
To drop the function as db2inst1, click on the DMC_REPO link in the DMC HOME page.
E.g.
Click on the SQL icon and then click on Run SQL.
E.g.
Action

Think 2020
Click on Create new + button
E.g.
Enter the following SQL text into the Editor, then click Run all button.
E.g.
DROP FUNCTION IBMCONSOLE.CANADMINISTER;
DROP FUNCTION IBMCONSOLE.CANVIEW;
Enter the credential db2inst1/db2inst1 and click Save button.
Action
Action
Action

Think 2020
The 2 UDF functions are now successfully dropped.
E.g.
Now, we want to recreate the 2 UDF function as secadmin. Click on the Add new scripts + link.
E.g.
Then, click Create new + button.
E.g.
Action
Action

Think 2020
Paste the following SQL text into the Editor.
Create UDF and GRANT privileges:
CREATE FUNCTION IBMCONSOLE.CANADMINISTER() RETURNS INT SPECIFIC
DSWEBSECURITY_CANADMINISTER LANGUAGE SQL CONTAINS SQL NO EXTERNAL ACTION DETERMINISTIC
RETURN 1;
CREATE FUNCTION IBMCONSOLE.CANVIEW() RETURNS INT SPECIFIC DSWEBSECURITY_CANVIEW
LANGUAGE SQL CONTAINS SQL NO EXTERNAL ACTION DETERMINISTIC RETURN 1;
GRANT EXECUTE ON FUNCTION IBMCONSOLE.CANADMINISTER TO USER DB2INST1;
GRANT EXECUTE ON FUNCTION IBMCONSOLE.CANADMINISTER TO USER PETER;
GRANT EXECUTE ON FUNCTION IBMCONSOLE. CANVIEW TO USER PAUL;
GRANT EXECUTE ON FUNCTION IBMCONSOLE. CANVIEW TO USER MARY;
Then, click on the Change operational credential icon.
Action
Action

Think 2020
Enter the credentials for secadmin. They are: secadmin/secadmin and then click Save button.
E.g.
With the above steps, you are creating another connection to Db2 using the secadmin credentials. Now, click
the Run all button to create the UDF and execute the GRANTs.
E.g.
E.g.
Action
Action

Think 2020
Now you have successfully created the UDF under secadmin ID and GRANT EXECUTE privilege for the
IBMCONSOLE.CANADMINISTER function to db2inst1 and peter, and IBMCONSOLE.CANVIEW function to paul
and mary.
Note: User db2inst1 will no longer have authority to GRANT or REVOKE EXECUTE permission on the 2 UDFs used
for DMC authentication.
NOTE: Concept for multiple scripts and Operation credential.
With the above steps, you have use 2 important functions in Run SQL.
First, DMC offers functions for multiple scripts to be opened to the same database by
clicking the Add new script + link. This adds flexibility when you are working on multiple
tasks for your work.
Second, you can switch the connection credentials to the database by clicking on the Change
operational credential icon. The entered credential is different from the credential you
entered when creating the connection profile in earlier steps. That was the monitoring
credential.
You have ability to save the operation credentials to repository. If you do so, the
credential will be saved to the repository under the DMC login user. This credential is
private to the DMC login user.
The monitoring credential configured when setting up the connection profile and will only be
used for collecting monitoring data from the monitoring database.
NOTE: Connections are normally created by DMC Administrator and then shared to all other DMC
Users. This is to avoid multiple users creating connections from DMC to Db2 and cause
multiple monitoring situation. We will cover more on the creating and sharing of connections
using RESTful API in later section.
We are now ready to switch the DMC authentication to repository authentication mode.

Think 2020
3.1.5.2 Setup Repository Authentication mode
Click on the Settings icon and then click Authentication.
E.g.
Click the Repository radio button as Authentication Type, then, select Db2 UDF as User role mapping method.
By default, the IBMCONSOLE.CANADMINISTER and IBMCONSOLE.CANVIEW UDF names are populated in the
Admin UDF and User UDF respectively. Since the UDFs are already recreated, we will use the defaults. Click
Next button now.
E.g.
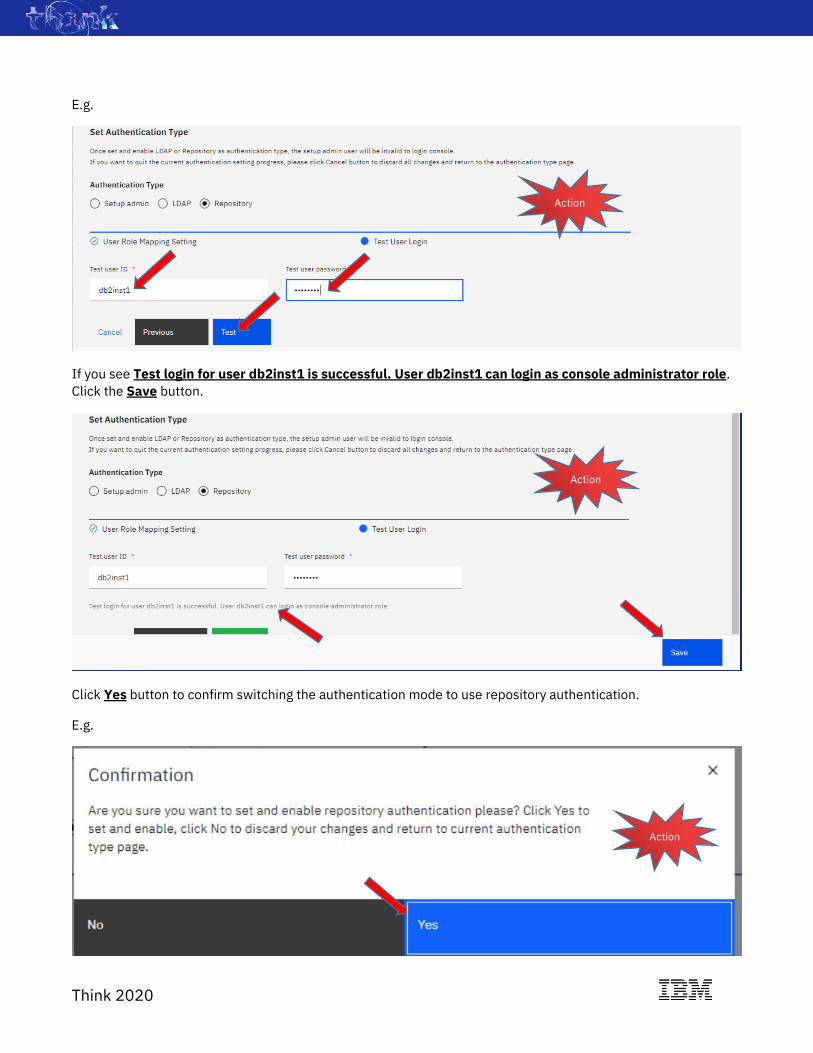
Now, you need to test the repository login before Saving the setting to DMC. We will use the db2inst1 credentials
for the test. Enter db2inst1 as Test user ID and db2inst1 as Test user password. Then, click Test button.
Action
Action
Think 2020
E.g.
If you see Test login for user db2inst1 is successful. User db2inst1 can login as console administrator role.
Click the Save button.
Click Yes button to confirm switching the authentication mode to use repository authentication.
E.g.
Action
Action
Action
Think 2020
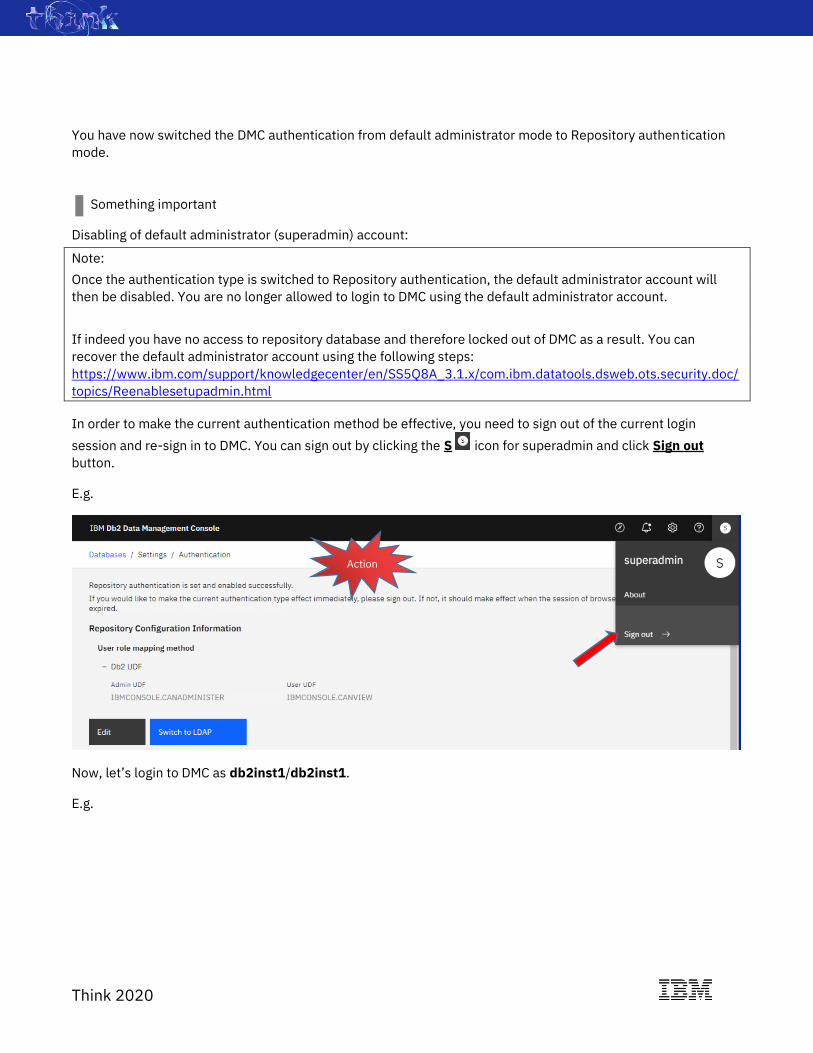
You have now switched the DMC authentication from default administrator mode to Repository authentication
mode.
Something important
Disabling of default administrator (superadmin) account:
Note:
Once the authentication type is switched to Repository authentication, the default administrator account will
then be disabled. You are no longer allowed to login to DMC using the default administrator account.
If indeed you have no access to repository database and therefore locked out of DMC as a result. You can
recover the default administrator account using the following steps:
https://www.ibm.com/support/knowledgecenter/en/SS5Q8A_3.1.x/com.ibm.datatools.dsweb.ots.security.doc/
topics/Reenablesetupadmin.html
In order to make the current authentication method be effective, you need to sign out of the current login
session and re-sign in to DMC. You can sign out by clicking the S icon for superadmin and click Sign out
button.
E.g.
Now, let’s login to DMC as db2inst1/db2inst1.
E.g.
Action

Think 2020
You will be landing to the DMC HOME Page by default.
db2inst1 has the Administrator Role, by default, it has authority to monitor all the Db2 connections created in
DMC. The 2 connections, TPCDS_1G and DMC_REPO are available to db2inst1, by default.
Optionally, you can click through the on-boarding steps to get started on how to use DMC. We will skip the
tutorial for now.
E.g.
Action

Think 2020
Setting up authentication method is one of the basic configuration requirements in DMC, you have now learned
how to setup repository authentication to allow multiple users to use DMC.
Another important configuration requirement is to share connections to DMC User role users. We will cover the
configuration steps by calling the RESTful API available in later section.
3.2 Monitoring As mentioned in the introduction, DMC is the next step in the evolution of DSM. You will find some familiarity
when working with the DMC if you are migrating from DSM.
DMC continues to support the ability to do Real-time, historical monitoring, Alerts and notifications. The
resiliency of DSM is still in the DNA of DMC.
As the evolution continues, drill down is more intuitive. The overall database health status is represented by six
stories, similar to how every airplane is equipped with six core instruments. In DMC, we call it Rapid Triage. With
Rapid Triage, you will get an overview on database Alert, Responsiveness, Throughput, Resource usage,
Contention and Time Spent.
3.2.1 HOME page In the HOME page, you will get an enterprise view of all the Db2s you have configured for DMC. The 6 database
status instruments are available on the HOME page main table. By now, it has been a few minutes since we
started the lab, DMC should have collected some data for the monitor Db2.
In the main table, you will see groups for Alerts, Query run time distribution, Query throughput, Resource
consumption, Locking and Time Spent. The metrics are bound by the Time frame chosen, by default, it is the
Last 1 hour.
The HOME page is intended to give you an overall view in your enterprise. In each of the metric boxes, you can
expect to see some trending information. By default, DMC will calculate the baseline for each metric and the
trending algorithm is based on standard deviation away from the mean value. You can tell if the database is
performing away from its norm. We will explain more on the calculation later.
With an executive level view on Alerts and core metrics trending information, you will be able to see what
databases in your enterprise are behaving ‘abnormally’. A handy way to see the overall health of your enterprise
Db2.
E.g.

Think 2020
… Cont…
3.2.1.1 Alerts
In Alerts, DMC provides 2 different types of Alerts, the Availability and Performance alerts, which they can be
configured in the Monitoring Profile page. You can create a custom Monitor Profile for your database by going to
Settings > Monitor profile page.
You can find more info here:
https://www.ibm.com/support/knowledgecenter/en/SS5Q8A_3.1.x/com.ibm.datatools.dsweb.ots.monitor.doc/
topics/mon_setup_hist_monitoring.html
By now, we may get a Performance alert for the TPCDS_1G database, if you hoover to the alert, and then, click
into the alert link, you will be redirected to the Notification center. You can find more information related to the
alert and do further drill down and investigation. Click on the link in the Performance alerts. E.g.

Think 2020
It will bring you to the Notification center page and show you the alert automatically. In this example, the
TPCDS_1G and Warning filter are applied.
By selecting the alert, you will see more information related to the alert on the right panel.
E.g.
In this example, we got a Warning alert on Statement Total activity time. Alert threshold can be adjusted by
clicking on the Monitor Profile link.
The Statement text for the query and suggestions on how to further investigate the issue will be provided. You
will also get the detail metrics for the execution of the query.
If you have finished reviewing the Alert, you can Delete the alert. Or you can share the Alert Details to your
teammates by Email.
Let’s go back to the HOME page by clicking the Database link or IBM Db2 Data Management Console link.
Action
Action
Think 2020
E.g.
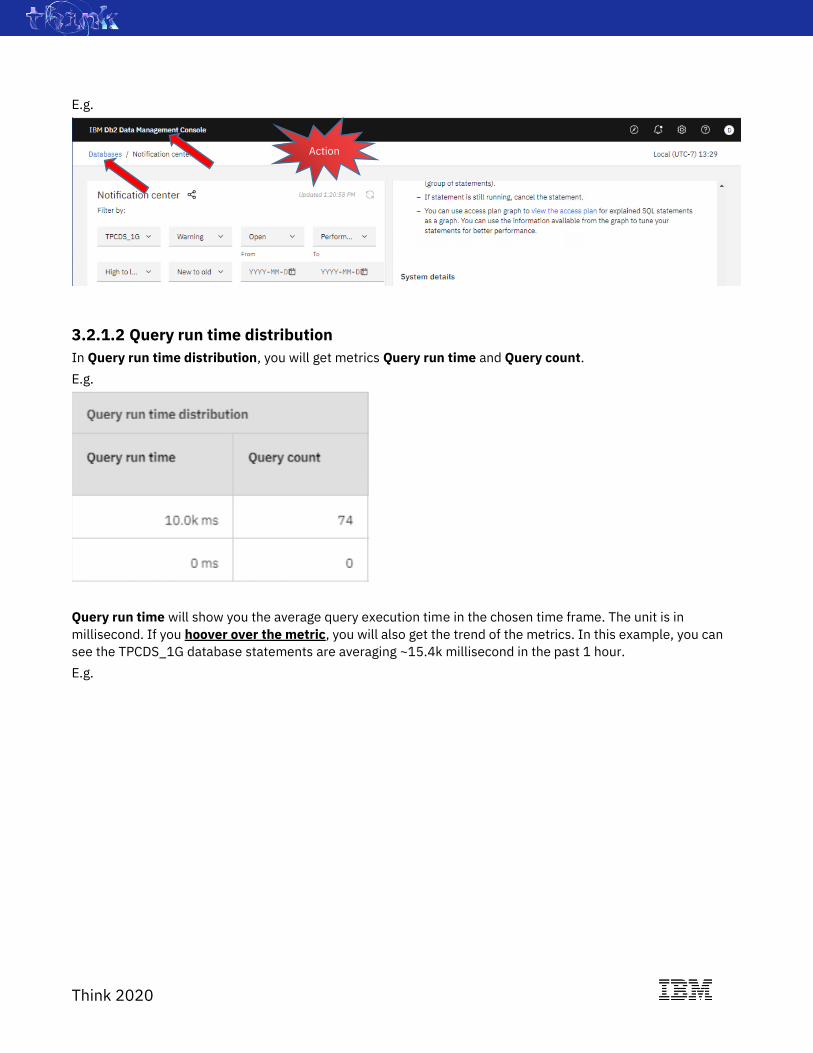
3.2.1.2 Query run time distribution
In Query run time distribution, you will get metrics Query run time and Query count.
E.g.
Query run time will show you the average query execution time in the chosen time frame. The unit is in
millisecond. If you hoover over the metric, you will also get the trend of the metrics. In this example, you can
see the TPCDS_1G database statements are averaging ~15.4k millisecond in the past 1 hour.
E.g.
Action

Think 2020
Query count will show you the total number of executed statements in the chosen time frame. Again, if you
hoover the metric, you will see the trend of the metric in the select time frame.
The trending of the Average Query run time and Query count can tell you the system responsiveness.
3.2.1.3 Query throughput
In Query throughput, you will get metrics Rows read and Queries executed.
E.g.
Rows Read is the average Rows Read rate (per min) for the database in the given time frame. You can get an
idea how busy it is in the system.
Query executed is the average SQL rate (per min) for the database in the given time frame. It is the transaction
rate for the database.
The trending of the Rows Read and Query executed metrics and tell you the overall throughput of your system.
Action

Think 2020
3.2.1.4 Resource consumption
In Resource consumption, you will get metrics. The Compute, Memory, Storage and Log space.
E.g.
Compute is the average CPU (%) used in the given time frame. If the database has multiple nodes, only the
master node (member = 0) is considered.
Memory is the average memory (%) used in the given time frame at the database level.
Storage is the latest storage (%) used in the given time frame.
Log Space is the max log space (%) used in the given time frame at the database level.
Something important
Multiple database in same instance scenario:
Note:
The CPU and Storage metrics are collected at the system level, if you had multiple databases configured in same
instance, the % reported for CPU and Storage will be same across for all the databases configured.
3.2.1.5 Locking
In Locking you will get metrics Lock waits and Active Connections.
E.g.
Lock Waits is the maximum lock waits number per minute in the given time frame.
Active Connections is the max concurrent connections value in the given time frame.

Think 2020
The trending of Lock Waits and Active Connections metrics can tell you if there is any contention problem in your
system.
Something important
Database Configuration Parameter expected in DMC
Note:
If you are not seeing the Lock waits metrics, your database may not have the expected Database Configuration
Parameters setup. For this metric, DMC expects MON_LOCKWAIT is set to at least WITHOUT_HIST value. For
more expected database parameter values used in DMC, find out more here:
https://www.ibm.com/support/knowledgecenter/en/SS5Q8A_2.1.x/com.ibm.datatools.dsweb.ots.installconfig.
doc/topics/pre-set_db_properties.html
3.2.1.6 Time spent
In Time spent, you will get metric Top time spent.
E.g.
Top Time Spent is the top (%) of the time spent do Db2 processing in the given time frame. Time spent contains
SQL execution, I/O, Lock waits, Other waits, and Other processing. We will explore more details in later
section in Database time spent page.
This Top time spent metrics will tell you if the database system is in general performing what action. If you see
Top time spent is for Lock Wait and you see contention problem in Locking metrics, it is good idea to first go
investigate locking related issues.
After describing the 6 cockpit database metrics, we will look at how to filter in the HOME page, and this is
important if you had hundreds of databases in your enterprise.
3.2.1.7 Filtering connections
For illustration purpose, the following screenshots, are taken with other DMC setup which has 156 databases
configured.

Think 2020
Filter to see all Available database by clicking the Available link.
E.g.
Filter to see all Disconnected database by clicking the Disconnected link.
E.g.
Filter to see all databases not being monitored by clicking the Not monitored link.
E.g.
Something important

Think 2020
Note:
Database are not monitored for different reasons. E.g.
The database belongs to a monitoring profile that is deactivated.
The database does not belong to any monitoring profile when the connection is created without Monitoring
credentials.
The Db2 server type is not supported by DMC console (yet), e.g. BIGSQL connection.
The database connection is to a Db2 for z/OS.
Filter to see all databases with Alerts by clicking the Alerting configured link.
E.g.
For further Alert filter, you can click on Alerts drop down and pick a specific type of alert and its severity level.
Click the Clear filters to reset.
E.g.
Databases can also be filtered by Tags. DMC has the HADR and PureScale tags defined as system defined tags
and when an HADR or PureScale databases are added, they will automatically be tagged.
Tagging info can be shown when you hoover over the tag icon. You can also add multiple tags for a given
connection. Let’s click on the tag icon for TPCDS_1G connection and add a tag called TPCDS and click
Create new tag “TPCDS”.
E.g.
Action

Think 2020
Then, click the Tags drop down and select TPCDS. You should see the tag filtering. After this, we can click
Clear filters to reset to default view. E.g.
Tagging is great ease of use function when there are hundreds of databases to manage. We get asked a lot on
tagging and now you learned how to group your databases into logical tags for easy access.
Database metrics can also be used as filter as shown below by clicking the Metrics drop down.
E.g.
3.2.1.8 Explaining the trends
Finally, if you see a little icon next to the metrics, e.g. or Let’s explain the meaning of them.
First, we need to understand the baseline. And to understand the baseline, we first need to know how the base
is calculated. To start each day, time will be divided into 6 blocks, in 4 hours windows.
E.g.
Time block Represented time range
Block 1 0000-0400
Action
Action

Think 2020
Block 2 0400-0800
Block 3 0800-1200
Block 4 1200-1600
Block 5 1600-2000
Block 6 2000-2400
Let’s assume current time is 2030.
Next. We need to understand the time frame chosen for the HOME page. For example, current time is 2030, and
the time frame chosen is Last 6 hours. Then, we need to go back 6 hours for metrics, i.e. 1430. And the baseline
data is based on this 6-hour time block.
The start and end time for 6-hour time frame is: 1430-2030. And the metrics will be found in 3 time blocks for
this example, they will be time block 4-6.
To help visualize it, the data for the 6 hours window will be overlapped in 3 time Blocks below:
E.g.
Time Time block Represented time range
Block 1 0000-0400
Block 2 0400-0800
Block 3 0800-1200
1430 Block 4 1200-1600
Block 5 1600-2000
2030 Block 6 2000-2400
So, the base is metrics from time block 4-6.
To form the baseline, we will look back at the metrics collected in the same time-blocks in the past 4 weeks.
In this example, we have 3 base time blocks. For each time block, we will group the metrics for the same time
block in past 4 weeks. CurWk is current week. So 4 weeks are CurWk, CurWk-1, CurWk-2, CurWk-3.
For each group block, we will calculate 2 statistical values, the mean and the Sum of Squares (SS) values.
CurWk CurWk-1 CurWk-2 CurWk-3 Mean SS
Group Block 4: 1200-1600 gb4w0 gb4w1 gb4w2 gb4w3 M4 SS4
Group Block 5: 1600-2000 gb5w0 gb5w1 gb5w2 gb5w3 M5 SS5
Group Block 6: 2000-2400 gb6w0 gb6w1 gb6w2 gb6w3 M6 SS6
Once we get the Mean and SS for each group block, we will use them to calculate the Sum of Square Difference
(SSD) value for each group blocks, i.e. minSSDx and maxSSDx, where x is the number of deviations from mean.

Think 2020
E.g.
minSSD1 maxSSD1 minSSD2 maxSSD2 minSSD3 maxSSD3
GB4 M4 – SS4 M4 + SS4 M4 – SS4*2 M4 + SS4*2 M4 – SS4*3 M4 + SS4*3
GB5 M5 – SS5 M5 + SS5 M5 – SS5*2 M5 + SS5*2 M5 – SS5*3 M5 + SS5*3
GB6 M6 – SS6 M6 + SS6 M6 – SS6*2 M6 + SS6*2 M6 – SS6*3 M6 + SS6*3
We only need the min and the max values among the group blocks (4, 5 and 6). Therefore:
minSSD1 = MIN((M4 – SS4), (M5 – SS5), (M6 – SS6) )
maxSSD1 = MAX((M4 + SS4), (M5 + SS5), (M6 + SS6) )
minSSD2 = MIN((M4 – SS4*2), (M5 – SS5*2), (M6 – SS6*2))
maxSSD2 = MAX((M4 + SS4*2), (M5 + SS5*2), (M6 + SS6*2))
minSSD3 = MIN((M4 – SS4*3), (M5 – SS5*3), (M6 – SS6*3))
maxSSD3 = MAX((M4 + SS4*3), (M5 + SS5*3), (M6 + SS6*3))
Finally, the conclusion. Assuming you see the following icons for the metrics in the summary table:
means: maxSSD2 > metrics >= maxSSD1
means: maxSSD3 > metrics >= maxSSD2
means: metrics >= maxSSD3
means: minSSD1 >= metrics > minSSD2
means: minSSD2 >= metrics > minSSD3
means: minSSD3 > metrics
For example, when you see for metrics xxx, that means, xxx is over 3 SSD away from the baseline of 4 weeks.
This is a nice visualization method in spotting trends for individual metrics for the database. And the baseline is
formed base on the time frame chosen, so you have more control on what specific data to look at.
Something important
Note:
For metrics: Storage under Resource consumption. The calculation of SSD will only be performed using the
current time block, even if the time frame is set to last 6 hours or more.
Now, we understand how the baseline is calculated. If you see charts in DMC with a blue bar in the chart, e.g.:

Think 2020
You can compare the current metric against the baseline which is historical value within 1 SSD.
The DMC HOME page is loaded with information for identifying problem and spotting trends. You can rely on it to
guide you into further drill down for additional information. You will learn more details on specific database drill
down in next section.
Let’s look into the TPCS_1G database by clicking on the TPCDS_1G link.
3.2.2 Database Summary page When you drill down into the Database Summary page, you will be looking into each of the core database
metrics identified in the HOME page with elaborated information. This is our Rapid Triage page.
At the top of the page, you can choose the pre-set time range or you can also set to a custom time range. The
selected time frame will be applied to all the different widgets in the page.
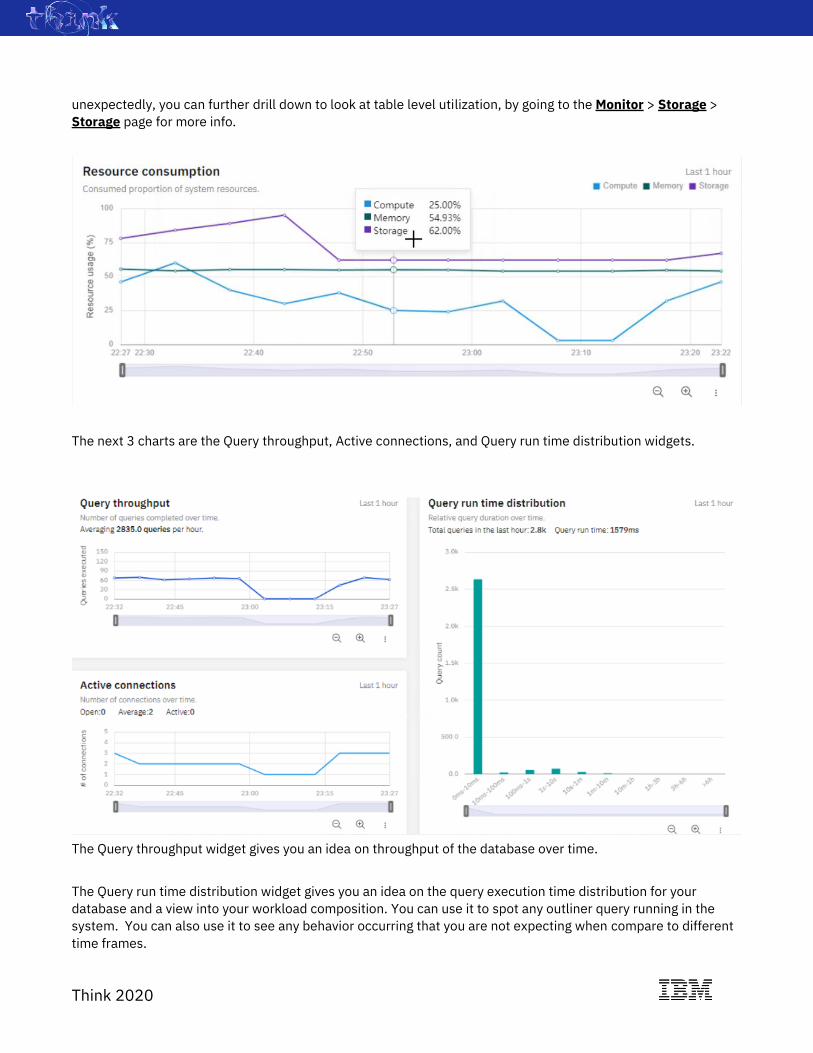
The Resource consumption widget gives you an overview of the different resource metrics of the system. If you
hoover over the chart, you will also see a tooltip for each of the metric consumption percentage at the collection
time point. In the bottom right corner, you can do zoom in and zoom out of the chart.
The Compute percentage in the chart is collected at the system level. The data is collected similar to the vmstat
commands in linux system. Typically, Db2 instances are installed as the only application in the system. If there
are multiple applications installed on same system, then, this compute value is representing the overall system
CPU resource.
Similarly, the Storage percentage is also collected at the system level for the filesystem used by Db2 server. This
metric gives you an overview of how the storage is growing for your Db2 over time. If you see storage is growing
Action
Think 2020
unexpectedly, you can further drill down to look at table level utilization, by going to the Monitor > Storage >
Storage page for more info.
The next 3 charts are the Query throughput, Active connections, and Query run time distribution widgets.
The Query throughput widget gives you an idea on throughput of the database over time.
The Query run time distribution widget gives you an idea on the query execution time distribution for your
database and a view into your workload composition. You can use it to spot any outliner query running in the
system. You can also use it to see any behavior occurring that you are not expecting when compare to different
time frames.

Think 2020
The Active connections widget shows you the number of connections connected to the database. You will get a
sense on how many connections are made to the database and determine if there is any contention in client
connecting to Db2.
Next, you will see the Locking and Time spent widgets.
Locking widget allows you to see the trend for number of lock waits, deadlocks and log timeouts for your
database. These are important indicators for any lock contention issue. With this cockpit view, you can easily
spot spikes at the system level and further looking into locking issue from MONITOR > Locking pages.
The Time spent widget shows you the percent time spent for different database events happening at the
workload level. Different activities happening in the database will classified into 5 different categories, they are
SQL execution, I/O, Lock waits, Other waits and Other processing. We will discuss more on this important
widget in the Database time spent page section.
On the right side of the page, you will also get a view for the currently running queries in the system. By default,
the long running queries will be show and you can also sort by Most recent query. This view gives you an
overview of what are the heavy hitter queries running in the system.
Lastly you see the Sync charts toggle on top of the page: . If this is turned on, then, when you hoover
the mouse over a chart and move along the time series, the mouse will move across all the charts in the page.
Toggle on the to turn Sync charts on. Then, move the mouse on the chart, and you should see the
tool tips on each graph be moving in sync. This is useful when you are trying to spot if any 2 or more metrics have
correlations.
E.g. tool tips will move in-sync

Think 2020
The new summary page follows the best of the breed Carbon Design System. It is a modern and award-winning
design kit. Read more: https://www.carbondesignsystem.com/
3.2.3 Database time spent page From the Summary page, we have seen the database behavior at the system level.
Next, we will further drill down into each database processing component with the Database time spent page.
Click on the Monitor icon > Monitor > Database time spent to get to the Database time spent page.
E.g.
The Database time spent page tracks the Time-spent on different types of Db2 processing. By looking at the
chart, you will get an overview of what specific processing is happening within Db2 at the current moment or in
history.
E.g.
Action

Think 2020
The Database time spent chart is divided into five major categories. They are SQL execution, I/O, Lock waits,
Other waits and Other processing. And for each of the category, they are subdivided into smaller categories
that made up the total.
E.g. as you can see from the above chart, the SQL execution category can be subdivided into Section
processing and Section sort time.
Before we go into the details on the categories, let’s first understand how the data is being collected. The chart
is made up of different time-spent elements collected by the MON_GET_WORKLOAD table function. By default,
the chart is shown for All user workloads.
When we install DMC, DMC will create a CONSOLE_WORKLOAD to logically group together all the queries
executed by DMC itself. In doing so, we will get an idea of what is the resource footprint done by the DMC
queries.
And All user workloads means everything but CONSOLE_WORKLOAD.
If you had individual workloads created, then, you will be able further break down. You can see later how break
down by workloads in the Database time spent chart. If you have many applications or many users using the
same database, then, the All user workloads view may not be fine grain enough for investigation purpose. You
may want to create additional workload for drill down purpose.
Also noted that, if the database is on multi-partitioned environment, the time-spent element is collected as
aggregated time-spent among all members. With the background information on how the time-spent data is
collected, lets dive deeper into how to dissect the information presented to you.
First, let’s look at the CONSOLE_WORKLOAD first as an example. Click the Workload drop down > click
CONSOLE_WORKLOAD.
E.g.

Think 2020
By doing so, you will see the individual category % Time-Spent metrics only for the CONSOLE_WORKLOAD.
E.g.
As you can see, the % Time-spent footprint is slightly different from the All user workloads resource footprint.
In this example, you see the Other waits footprint constitutes roughly 10% of the database processing time.
But, what is that Other waits time? What does it represent, right? We will cover it shortly.
Besides the default CONSOLE_WORKLOAD. We have pre-created 3 workloads to track statements executed by
user PETER, PAUL and MARY.
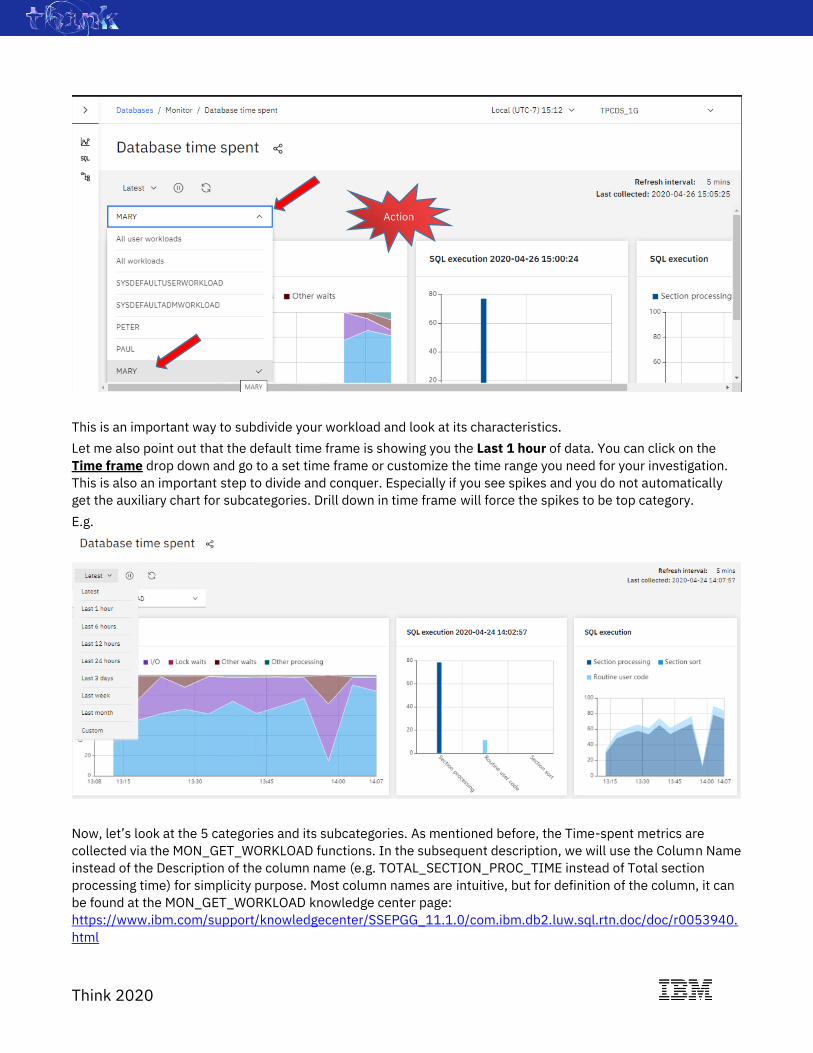
You can look at the workload characteristics for workload from PAUL and MARY by clicking the Workload drop
down manual > click PAUL / MARY.
E.g.
Action
Think 2020
This is an important way to subdivide your workload and look at its characteristics.
Let me also point out that the default time frame is showing you the Last 1 hour of data. You can click on the
Time frame drop down and go to a set time frame or customize the time range you need for your investigation.
This is also an important step to divide and conquer. Especially if you see spikes and you do not automatically
get the auxiliary chart for subcategories. Drill down in time frame will force the spikes to be top category.
E.g.
Now, let’s look at the 5 categories and its subcategories. As mentioned before, the Time-spent metrics are
collected via the MON_GET_WORKLOAD functions. In the subsequent description, we will use the Column Name
instead of the Description of the column name (e.g. TOTAL_SECTION_PROC_TIME instead of Total section
processing time) for simplicity purpose. Most column names are intuitive, but for definition of the column, it can
be found at the MON_GET_WORKLOAD knowledge center page:
https://www.ibm.com/support/knowledgecenter/SSEPGG_11.1.0/com.ibm.db2.luw.sql.rtn.doc/doc/r0053940.
html
Action
Think 2020
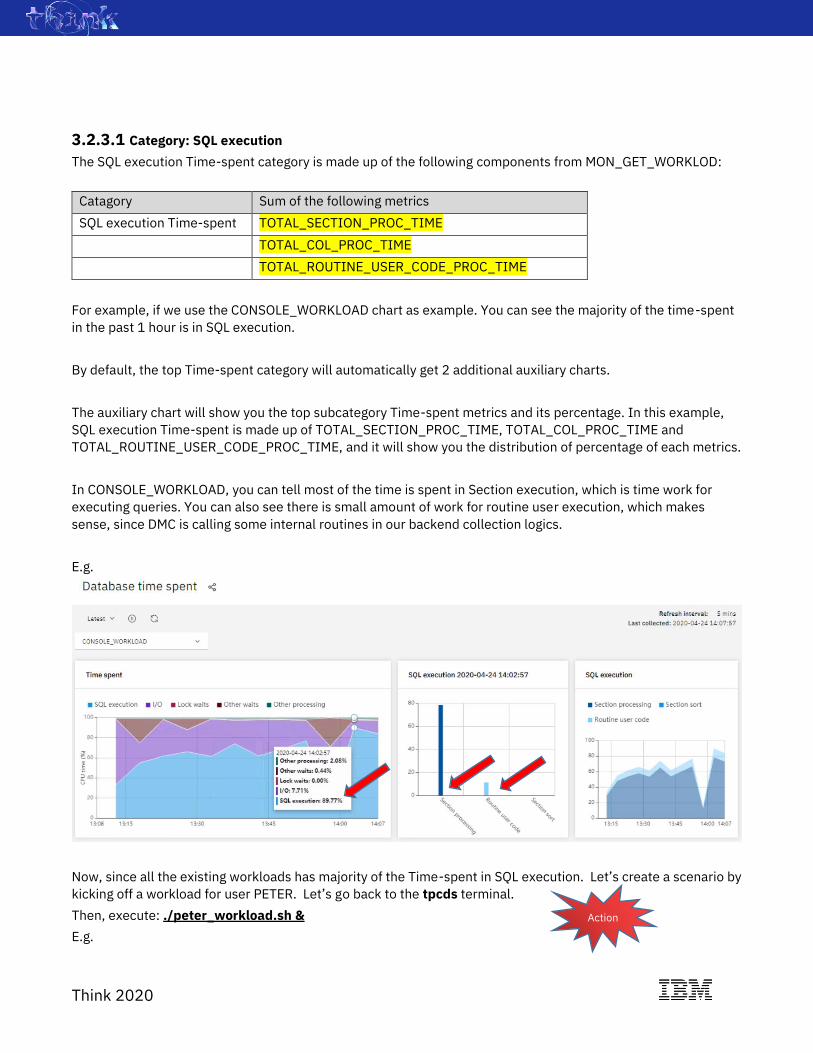
3.2.3.1 Category: SQL execution
The SQL execution Time-spent category is made up of the following components from MON_GET_WORKLOD:
Catagory Sum of the following metrics
SQL execution Time-spent TOTAL_SECTION_PROC_TIME
TOTAL_COL_PROC_TIME
TOTAL_ROUTINE_USER_CODE_PROC_TIME
For example, if we use the CONSOLE_WORKLOAD chart as example. You can see the majority of the time-spent
in the past 1 hour is in SQL execution.
By default, the top Time-spent category will automatically get 2 additional auxiliary charts.
The auxiliary chart will show you the top subcategory Time-spent metrics and its percentage. In this example,
SQL execution Time-spent is made up of TOTAL_SECTION_PROC_TIME, TOTAL_COL_PROC_TIME and
TOTAL_ROUTINE_USER_CODE_PROC_TIME, and it will show you the distribution of percentage of each metrics.
In CONSOLE_WORKLOAD, you can tell most of the time is spent in Section execution, which is time work for
executing queries. You can also see there is small amount of work for routine user execution, which makes
sense, since DMC is calling some internal routines in our backend collection logics.
E.g.
Now, since all the existing workloads has majority of the Time-spent in SQL execution. Let’s create a scenario by
kicking off a workload for user PETER. Let’s go back to the tpcds terminal.
Then, execute: ./peter_workload.sh &
E.g.
Action

Think 2020
3.2.3.2 Category: I/O
The I/O Time-spent category is made up of the following components from MON_GET_WORKLOD:
Catagory Sum of the following metrics
I/O Time-spent POOL_READ_TIME
POOL_WRITE_TIME
DIRECT_READ_TIME
DIRECT_WRITE_TIME
Since we do not have I/O as majority Time-spent metrics in the lab environment now, I am using a screen shot
from another DMC as example. You can see the majority of the time-spent in the past 1 hour is in I/O. And the
majority of that is in Pool read and some for Direct read.
E.g.
Action

Think 2020
If we know the Pool read is consistently a high percentage of database time spent, you might want to drill down
to see what causes the high buffer read time.
E.g. it can be a system I/O performance issue when reading from disk. Or there can be bottleneck in Db2 in
performing I/O efficiently. You can look at the number of num_ioservers configure. Or the problem can be
improved by redesigning the database / database storage to spread out the I/O access.
With the subcategory drill down, you gain better insight on the bottleneck. Next, we can look into other
correlated metrics for more clues in Database Usage page.
3.2.3.3 Category: Lock waits
The Lock waits Time-spent category is made up of the following components from MON_GET_WORKLOD:
Catagory Sum of the following metrics
Lock waits Time-spent LOCK_WAIT_TIME
LOCK_WAIT_TIME_GLOBAL
Since we do not have Lock waits as majority Time-spent metrics in the lab environment now, I am using a screen
shot from another DMC as example. You can see the majority of the time-spent in the past 1 hour is in Lock
waits. And the majority of that is in lock wait time.
E.g.

Think 2020
In this case, the applications under this workload were waiting for a lock within this database. There are
different reasons why lock wait time is a big portion of the database time spent. It is a good starting point to look
for specific locking issues in the database. DMC offers a view into locking problem by going to Monitor > Locking
and various locking pages.
By default, locking metrics will be collected by DMC using Db2 monitoring functions. It also utilizes the Locking
event monitor to track a more complete view of the locking history. The Locking event monitor can be turned on
by going to Settings > Event monitor profile page.
We will look at an example of how to identify locking issue by identifying a WAITOR and BLOCKER applications
later in the lab. You will be able to identify blocker / waiter relationship and learn how to drill down.
3.2.3.4 Category: Other waits
The Other waits Time-spent category is made up of the following components from MON_GET_WORKLOD:
Catagory Sum of the following metrics
Other waits Time-spent AGENT_WAIT_TIME
WLM_QUEUE_TIME_TOTAL
LOG_BUFFER_WAIT_TIME
LOG_DISK_WAIT_TIME
TCPIP_RECV_WAIT_TIME
TCPIP_SEND_WAIT_TIME
IPC_SEND_WAIT_TIME
IPC_RECV_WAIT_TIME
AUDIT_SUBSYSTEM_WAIT_TIME
AUDIT_FILE_WRITE_WAIT_TIME

Think 2020
DIAGLOG_WRITE_WAIT_TIME
EVMON_WAIT_TIME
TOTAL_EXTENDED_LATCH_WAIT_TIME
PREFETCH_WAIT_TIME
COMM_EXIT_WAIT_TIME
IDA_SEND_WAIT_TIME
IDA_RECV_WAIT_TIME
RECLAIM_WAIT_TIME
SPACEMAPPAGE_RECLAIM_WAIT_TIME
FED_WAIT_TIME
To illustrate how to drill down in workload to investigate performance issues, the peter_workload.sh we kicked
off earlier will demonstrate different Time-spent characteristics. This workload will create high Other wait or
high Other processing Time-spent. Let’s drill down to the PETER workload by clicking the Workload drop down
manual > click PETER. You will be able to see the workload characteristics for user PETER.
E.g.
In this example, the PETER workload is spending majority of the time in Other waits and the subcategory is IPC
send+receive.
At this point, we know there is high percentage of IPC (inter-process communication) time. And we want to find
more clues on what caused it. We know that IPC is for communication between processes using shared
memory. What could cause that?
There are couple places we can drill down to in DMC.
1. We can look at other accompanying statistics during the timeframe of the problem in Database usage page.
This can be achieved by clicking the Monitor icon > Monitor > Database usage page.
2. Look at the queries coming in for user PETER and analyze the problem from query workload perspective. We
will cover these 2 topics in later section.
Action

Think 2020
3.2.3.5 Category: Other processing
The Other processing Time-spent category is made up of the following components from MON_GET_WORKLOD:
Catagory Sum of the following metrics
Other processing Time-spent TOTAL_COMPILE_PROC_TIME
TOTAL_IMPLICIT_COMPILE_PROC_TIME
TOTAL_LOAD_PROC_TIME
TOTAL_REORG_PROC_TIME
TOTAL_RUNSTATS_PROC_TIME
TOTAL_CONNECT_REQUEST_PROC_TIME
TOTAL_CONNECT_AUTHENTICATION_PROC_TIME
TOTAL_COMMIT_PROC_TIME
TOTAL_ROLLBACK_PROC_TIME
TOTAL_BACKUP_PROC_TIME
TOTAL_INDEX_BUILD_PROC_TIME
Since we do not have Other processing as majority Time-spent metrics in the lab environment now, I am using a
screen shot from another DMC as example. You can see the majority of the time-spent in the past 1 hour is in
Other processing. And the majority of that is in Explicit compile processing.
E.g.
Similar to the Other waits category, the Other processing category consists of various processing times
measured across Db2 processing. This category is again tricky as it consists of many different components. The
additional subcategory drill down will help you in identifying the problem.

Think 2020
This example is purely on Explicit compile processing. And that means Db2 is spending a lot of time compiling
dynamic SQL that are coming into the package cache. To start, you can investigate the historical package cache
hit ratio and see if increasing the package cache size can help.
NOTE: DMC Performance Alert has the package cache hit ratio alert, which you will be alerted when package
cache is below a certain threshold.
Another suggestion would be to analyze the pattern of the incoming SQL and see if they are similar SQLs with
different literal values running at a high frequency. E.g. a frequent simple insert with different literal values can
thrash the package cache hit ratio. In this case, you may consider turning on statement concentrator to reduce
compile time.
The Database time spent page consists of many detailed information and give you hint on what metrics is
potentially causing bottleneck in the database. This information is crucial in leading to further drill downs.
The following article has good description on how database time spent breakdown:
https://www.ibm.com/support/knowledgecenter/SSEPGG_11.5.0/com.ibm.db2.luw.admin.mon.doc/doc/c0056
890.html
Now, you learned how to investigate time-spent by 5 different categories and its subcategories. You have also
learned the technique of further bring the execution time by using individual WORKLOADs and investigate at
specific time ranges.
The next important page we will look at is the Database usage page, which you will find correlations between
collected metrics.
3.2.4 Database usage page
Click on the Monitor icon > Monitor > Database usage to get to the Database usage page.
E.g.
You will go to:
Action

Think 2020
More..
Continuing from the Database time spent page, we have knowledge about the Time-spent category and
subcategories. The next logical thing to do is to identify the metrics that may be influencing the high Time-Spent.
The screenshot above shows you various Db2 metrics. These metrics are collected by the same
MON_GET_WORKLOAD function in Database time spent page. So, the metrics in the 2 pages are correlated. In
another word, the Database usage page is intended to use along with the Database Time-spent page.
Think 2020
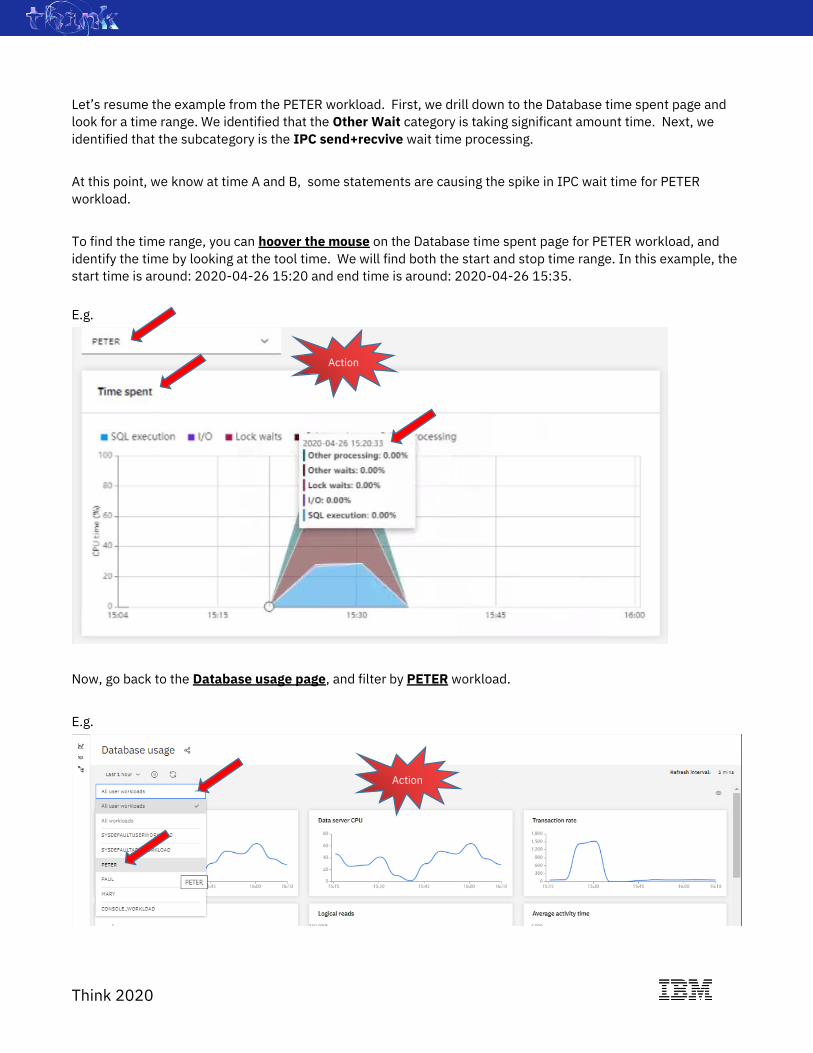
Let’s resume the example from the PETER workload. First, we drill down to the Database time spent page and
look for a time range. We identified that the Other Wait category is taking significant amount time. Next, we
identified that the subcategory is the IPC send+recvive wait time processing.
At this point, we know at time A and B, some statements are causing the spike in IPC wait time for PETER
workload.
To find the time range, you can hoover the mouse on the Database time spent page for PETER workload, and
identify the time by looking at the tool time. We will find both the start and stop time range. In this example, the
start time is around: 2020-04-26 15:20 and end time is around: 2020-04-26 15:35.
E.g.
Now, go back to the Database usage page, and filter by PETER workload.
E.g.
Action
Action

Think 2020
Next, we will look for the time range 2020-04-26 15:20 and 2020-04-26 15:35. Since the issue is happening in
the past 1 hour, we don’t need to do time frame filtering. In this example, the Transaction rate metrics jumps
out.
So, we know that there is big jump in Transaction rate (>1500/min), but, not much jump in other metrics (logical
read jump from 0 to 2, which we can ignore).
The logical thing to look at now is to find out the Statements executed for PETER.
From this example, you can see different metrics in Db2 are somewhat corelated, so, by putting multiple chart in
the same page, you will get a feel of what metrics are influencing each other.
To continue with the investigation, we want to look at the incoming queries for PETER workload.
We will then go to the Monitor icon > Monitor > Statement > In-flight executions page to see what the
statements are running at that time.
3.2.5 Statements
Click on the Monitor icon > Monitor > Statement > In-flight executions to get to the In-flight executions
page.
E.g. Action

Think 2020
Depending on how fast we are navigating the lab, the statements executed by the PETER workload may have
finished. The In-flight executions page will show you all the currently executing queries by the database.
Also, very fast executing queries is hard to catch in this page.
Since we cannot find Peter’s query in In-flight execution page, the next Statement page we look at is the
Package cache statement page. You can go there by clicking on the Monitor icon > Monitor > Statement >
Package cache.
E.g.
Statement in the Package Cache page is collected by the MON_GET_PKG_CACHE_STMT table function. By
default, DMC take a snapshot of the statements in the package cache and store the Statement execution
information in the repository.
Action

Think 2020
Depending on the package cache size setup in the database, and the number of statements configured in DMC to
be copied to repository in the Monitoring Profile page. You may not be always finding the statements you are
looking for.
Also, statements and metrics collected are in aggregated format. Also, different users (authid) can executing the
same statement using same plan (without recompile) in the package cache. In another words, filtering by USER
(authid) is not possible by using package cache page. We need other statement collection method in order to
help narrow down the search.
That said, the package cache page is good for spotting long running SQLs and the runtime metrics for it.
We will look at using Activity event monitor for Statement collection next.
Something important
Note:
Multiple factors determine if the statement you are looking for will be in the Package cache statements page.
We can break it down to Database level and DMC level limitation.
Database level:
1. The size of the package cache
2. The transaction rate on your database
DMC level:
1. The Collect data every (minutes) parameter
2. The SQL statements captured parameter
3. The Table data read for a collection parameter
For DMC level limitation, you can configure the above parameter in the Monitor profile page. To go there, go to
Settings icon > Monitor profile. Then, select and edit the profile you are interested at. The above
parameters are under the Monitor Settings tab.
DMC facts:
The Collect data every (minutes) parameter decides how often monitoring metrics are collected. For package
cache, it is the time when snapshot is taken. When this parameter is changed, it will affect all the collection
intervals for the database configured for the monitor profile.
By default, DMC will only collect the TopN statements based on 24 performance metric categories, e.g. TopN
queries in CPU time. And the SQL statements captured parameter is the number for TopN. This design avoids
DMC to store excessive number of queries in the repository.
The Table data read for a collection parameter is the total number of statements store for the database in the
repository.
Think 2020
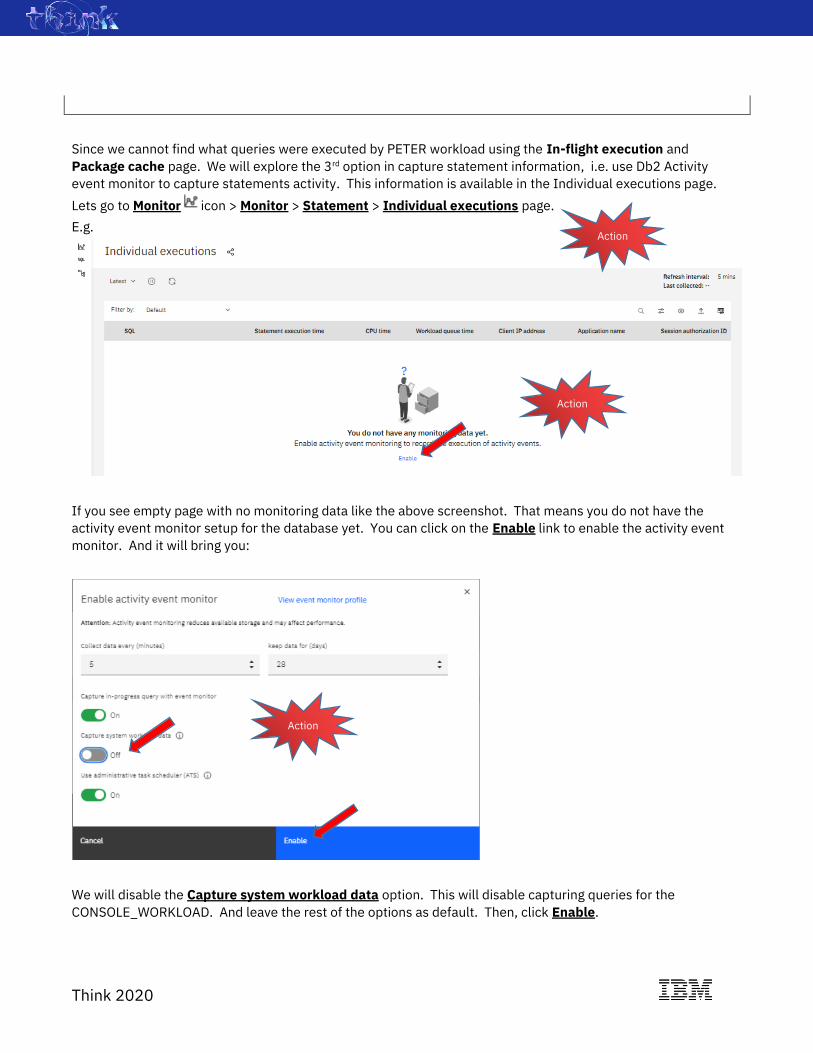
Since we cannot find what queries were executed by PETER workload using the In-flight execution and
Package cache page. We will explore the 3rd option in capture statement information, i.e. use Db2 Activity
event monitor to capture statements activity. This information is available in the Individual executions page.
Lets go to Monitor icon > Monitor > Statement > Individual executions page.
E.g.
If you see empty page with no monitoring data like the above screenshot. That means you do not have the
activity event monitor setup for the database yet. You can click on the Enable link to enable the activity event
monitor. And it will bring you:
We will disable the Capture system workload data option. This will disable capturing queries for the
CONSOLE_WORKLOAD. And leave the rest of the options as default. Then, click Enable.
Action
Action
Action

Think 2020
Note: enabling activity event monitor will be happening in the next monitoring cycle, so, that means it could be 5
minutes away.
After enabling the Activity event monitor, we need to check if the workloads that we want to collect statements
activities have the correct workload attribute. To enable workloads to collect statements, go to Explore icon
> Workloads page.
E.g.
If you have not save the password to repository, you will be prompted to enter the Operation credentials for the
connection, use db2inst1/db2inst1. Then, click Save.
E.g.
In this page, you will see all the workloads that are created for this database. The ones we are interested are the
MARY, PAUL and PETER workloads. In the Collect activity data column, you can see None of the workloads
are enabled to collect data. Let’s enable the MARY, PAUL and PETER workloads to collect activity data by
checking the checkbox for MARY, PAUL and PETER workload, and click on the 3 dots icon and go to the
Enable collect act… page.
Action

Think 2020
E.g.
In the Generate SQL page, click Run all button.
E.g.
By doing so, we have enabled the MARY, PAUL and PETER workload to collect statement activity data.
Let’s go back to the Monitor icon > Monitor > Statement > Individual executions page and wait for the
statements to come. Also, since the PETER workload has already completed, let’s start the workload again by
going to the tpcds terminal, and run command: ./peter_workload.sh &
Let’s refresh the Individual executions page, until we see query information.
E.g.
Action
Action
Action
Action

Think 2020
We can see the query from PETER in Session authorization ID column. If we cannot find the query, we can
create a filter by clicking on the filter icon, to only look at the PETER workload. Look at the statement text by
clicking on the SQL.
E.g.
For illustration purpose, the PETER workload is executing the select current sqlid as c0 from
sysibm.sysdummy1 statement in a loop for 5 minutes. I created this workload to illustrate how to drill down
from Database Time Spent page to Database Usage page to Statements page.
For this scenario, the execution time for the query is very fast, as sysibm.sysdummy1 is not a physical table but
just a dummy table in memory. Therefore, there is no database runtime execution involved (no bufferpool, sql
section processing etc.)
Since the resource footprint is very low, the performance characteristics may not show up if you are only looking
at the overview of the database. But, with divide and conquer, we can look at individual workloads, and drill
Action

Think 2020
down on time range, look at the category and subcategory of problem, and finally look for correlation among
metrics and use Activity event monitor to capture the statement for analysis.
As you can see, with proper method, performance analysis on relatively light footprint queries can still be done
with DMC.
Something important
Note:
When drilling down to enable workloads for collect statement activity data, we have tread into the Explore
(Administer) function in DMC. The Explore function in DMC has major UI and UX revamp using the latest carbon
design kit.
We will not have time to show the Explore function in this lab, but, do try it out in your free time. Let us know
your feedback in DMC Community and Forum page.
The final monitoring example we will cover in this lab is to identify blockers and waiters in locking situations.
3.2.6 Locking
Following steps allows you to gradually drill down to find out more on locking issues in your database. In the
HOME page, you will first get an idea if there is significant lock wait issue by looking at the Locking cockpit.
E.g.
Then, you can go to the Database Summary page, in the Locking widget, to see the historical trend for Lock
waits, Deadlock and Lock timeouts info.
E.g.

Think 2020
You can also get an idea on whether at the database level, if much time is spent on Lock waits using the Time
spent widget.
E.g.
Then, we can proceed to the Database time spent page, and further drill down to see Lock waits category at the
workload level. For better visualization, we can disable all the other categories by unchecking them and only
leave the Lock waits category to be showing.
E.g.
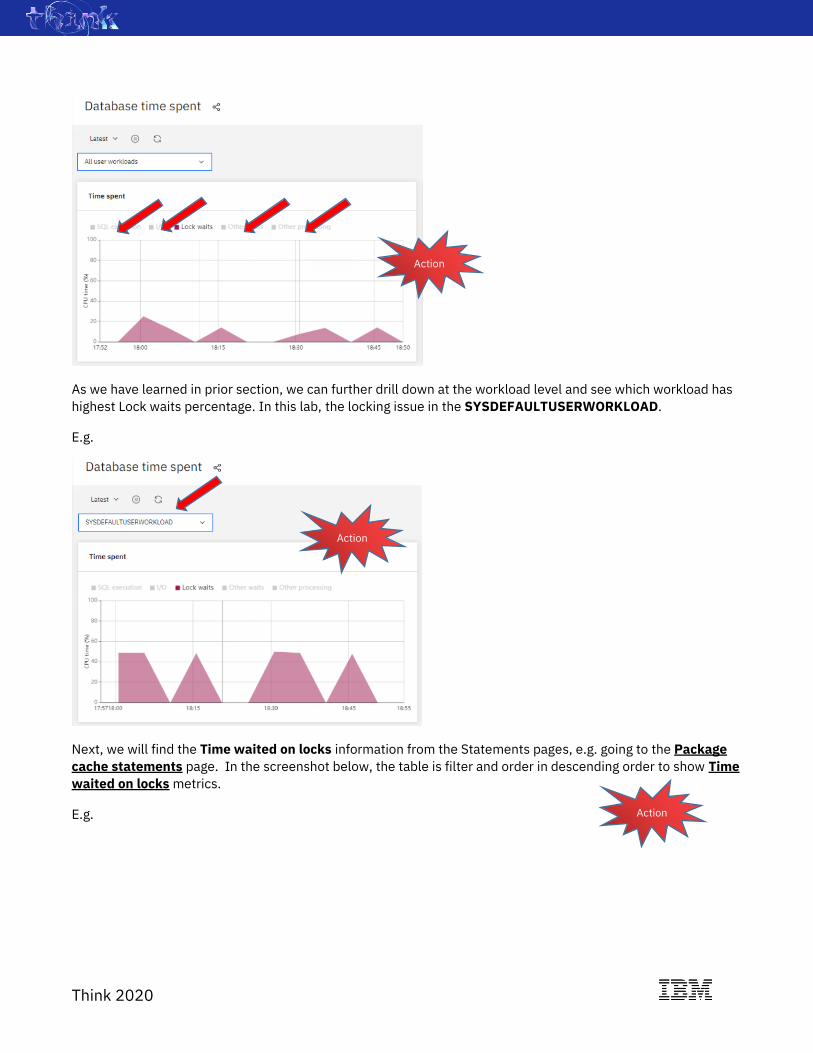
Think 2020
As we have learned in prior section, we can further drill down at the workload level and see which workload has
highest Lock waits percentage. In this lab, the locking issue in the SYSDEFAULTUSERWORKLOAD.
E.g.
Next, we will find the Time waited on locks information from the Statements pages, e.g. going to the Package
cache statements page. In the screenshot below, the table is filter and order in descending order to show Time
waited on locks metrics.
E.g.
Action
Action
Action

Think 2020
We see that there is a delete from results where cnt > ? statement spending a lot of time waited on locks. (139
second) What caused it? Is there a query that is blocking the delete statements?
To find out, we will go to the Monitor icon > Monitor > Locking > Blocking and waiting connections page.
E.g.
In the Blocking and waiting connections page, you can go to specific time frame and identify the Blocker and
Waiter information. In this lab, we create the locking scenario periodically, you should be able to find it in the
Last 1 hour time frame. Also, if you expand on the BLOCKER section, you will see the list of WAITER waiting for
the lock held by the BLOCKER. Click on the 3-dots icon > View Details.
Action
Action

Think 2020
Note, if you are not able to find any BLOCKER or WAITER connection in Latest or in Last 1
hour, please go to the tpcds terminal and execute.
cd /home/db2inst1
./lock.sh
You should be seeing the BLOCKER and WAITER connection very soon.
You will be able to see the detailed info on BLOCKER and WAITER connection. E.g. the SQL text, the authid and
application handle. Etc.
E.g.
And Waiter:
This exercise gave us glimpses of how you can drill down from DMC to identify locking issues. I encourage you
to explore the rest of the locking pages for more hands on experience.
Something important

Think 2020
Note:
As mentioned in earlier section, by default, locking information are collected using Db2 monitoring function in
collection intervals, and therefore it is just a snapshot every 5 minutes.
Also, there are additional parameters in the Monitor profile page that you need to setup in order to have the
above BLOCKER and WAITER (and other) scenarios to work.
To set, go to Settings icon > Monitor profile. Then, select and edit the profile you are interested at. The
above parameters are under the Monitor Settings tab. In the Locks section, there are 2 parameters:
1. Lock wait threshold (milliseconds). This is the lock wait threshold that we set for DMC. If any connection
has this threshold (default 30 seconds) met, then, the locking information will be collected. Please also noted
DMC will rely on the Database Configuration Parameter MON_LW_THRESH to be set to same value as well.
2. The Table data read for a collection parameter is the total number of locking info store for the database in
the repository
DMC also expects the following Database Configuration Parameters to be set for locking collection to work:
MON_LW_THRESH 30,000,000
MON_DEADLOCK history
MON_LOCKTIMEOUT history
MON_LOCKWAIT without_history
To turn on Locking event monitor for the database, go to the Settings icon > Event monitor profile page and
edit the Event monitor settings for the database you are interested in.
We hope the above exercise give you a good introduction on how to use DMC to drill down into specific area for
problem investigation. There are other Monitoring pages that provides specific information on Buffer pools,
Storage, Connections and more. You can use them to look for specific problems once you had identified the core
areas to investigate. We hope this will jump start you in using the tool as you gain some insights of the inner
working of the tool. We value your feedback and you can always reach out to us in DMC Community and Forum
page.
3.3 Restful Services
In this portion of the lab, you will be learning the basics on how to call the RESTful API provided by DMC. There
are certain DMC administrative steps that are repetitive, and it is better done with a script or via the RESTful API.
E.g. Adding 100s of connection profiles for DMC or changing credentials for connection profiles in a batch as
passwords expires periodically. Or, granting 100s of users to share the connection profiles for accessing Db2.
These tasks are easier done with scripts than using UI.

Think 2020
3.3.1 Pre-req for using the APIs
First and foremost, the API doc can be found by going to the Help icon > APIs page.
E.g.
This will lead you the documentation for all the API services provide by DMC. You will find the specification of
each API service, and with sample code which you can copy from the choice of your development language.
In this lab, we will be using cURL (open-source) command-line tool. This tool is used to send and receive data
with DMC RESTful services using the URL syntax with http protocol. It is a easy to use together with bash
scripting.
Also, most of the API responses are in JSON format, we will be using jq (open-source) JSON processor to parse
or manipulate the JSON output in this lab.
Both tools are pre-configured for the lab.
3.3.2 Introduction to DMC APIs
To request a RESTful service in DMC, you need to first know the URL that is providing the service. In this lab, the
URL to request service is: https://dmc:11081
Next, you need to identify the API and API version, which is: dbapi/v4. This info can be found from API doc.
Next, you need to identify the API request and the API parameters. If the API expects a parameter, the options
are passed in in the URL and parameters are separated by an &. For example:
http://dmc:11080/dbapi/v4/metrics/statements_count?start=1546272000000&end=1546272300000
This API call will return the number of statements for a specified time frame and the start and end timestamps
are passed in as parameters.
Next, you need to know the headers. Every API request must include the Authorization HTTP header with the
value Bearer [access_token]. This access token can be obtained with the /auth/tokens call. Each call will also
have the Content-Type header which specifies the media type of the resource.
Next, for some complex request, the API may require a payload, which is in JSON format. For example, when
running SQLs using the /sql_jobs, this request would require a JSON object as payload to identify the statement
text, statement delimiters and maximum number of returned rows etc. We have examples using payload in the
lab.
Action
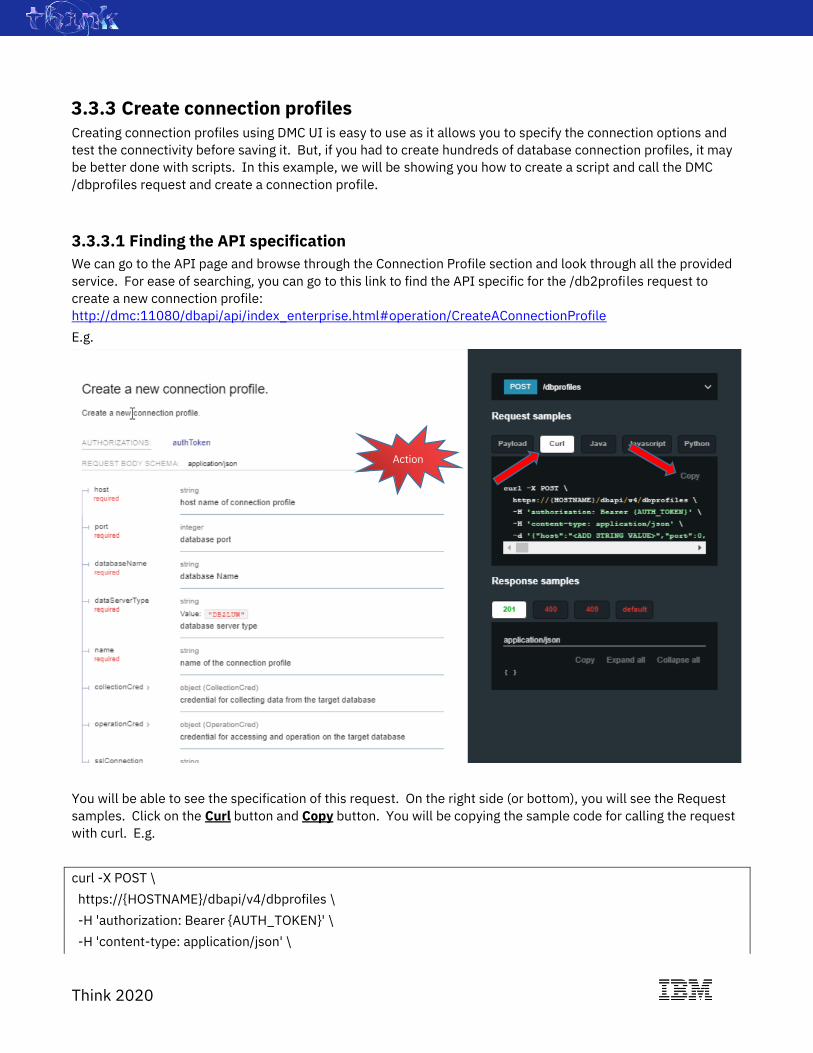
Think 2020
3.3.3 Create connection profiles Creating connection profiles using DMC UI is easy to use as it allows you to specify the connection options and
test the connectivity before saving it. But, if you had to create hundreds of database connection profiles, it may
be better done with scripts. In this example, we will be showing you how to create a script and call the DMC
/dbprofiles request and create a connection profile.
3.3.3.1 Finding the API specification
We can go to the API page and browse through the Connection Profile section and look through all the provided
service. For ease of searching, you can go to this link to find the API specific for the /db2profiles request to
create a new connection profile:
http://dmc:11080/dbapi/api/index_enterprise.html#operation/CreateAConnectionProfile
E.g.
You will be able to see the specification of this request. On the right side (or bottom), you will see the Request
samples. Click on the Curl button and Copy button. You will be copying the sample code for calling the request
with curl. E.g.
curl -X POST \
https://{HOSTNAME}/dbapi/v4/dbprofiles \
-H 'authorization: Bearer {AUTH_TOKEN}' \
-H 'content-type: application/json' \
Action

Think 2020
-d '{"host":"<ADD STRING VALUE>","port":0,"databaseName":"<ADD STRING
VALUE>","dataServerType":"DB2LUW","name":"<ADD STRING VALUE>","collectionCred":{"user":"<ADD
STRING VALUE>","password":"<ADD STRING VALUE>","apiKey":"<ADD STRING
VALUE>","kerberosUseCachedTGT":"<ADD STRING
VALUE>","securityMechanism":3,"encryptionAlgorithm":1},"operationCred":{"user":"<ADD STRING
VALUE>","password":"<ADD STRING VALUE>","apiKey":"<ADD STRING
VALUE>","kerberosUseCachedTGT":"<ADD STRING
VALUE>","securityMechanism":3,"encryptionAlgorithm":1,"saveOperationCred":"false"},"sslConnection":"false",
"sslTrustStoreLocation":"<ADD STRING VALUE>","sslTrustStorePassword":"<ADD STRING
VALUE>","xtraProps":"<ADD STRING VALUE>","comment":"<ADD STRING VALUE>"}'
In this example, we know it is a POST request and the request URL. It has 2 headers (-H option), for
authorization and content-type. And a JSON payload is required (-d option) to call this API. As mentioned
before, all API request must include the Authorization HTTP header with the value Bearer [access_token]. We
will find out how to get the access token next.
Click on this link to see the API doc for the /auth/tokens to request an access token:
http://dmc:11080/dbapi/api/index_enterprise.html#operation/Authenticate
E.g.
E.g.
curl -X POST \
https://{HOSTNAME}/dbapi/v4/auth/tokens \
-H 'content-type: application/json' \
-d '{"userid":"<ADD STRING VALUE>","password":"<ADD STRING VALUE>"}'
Action
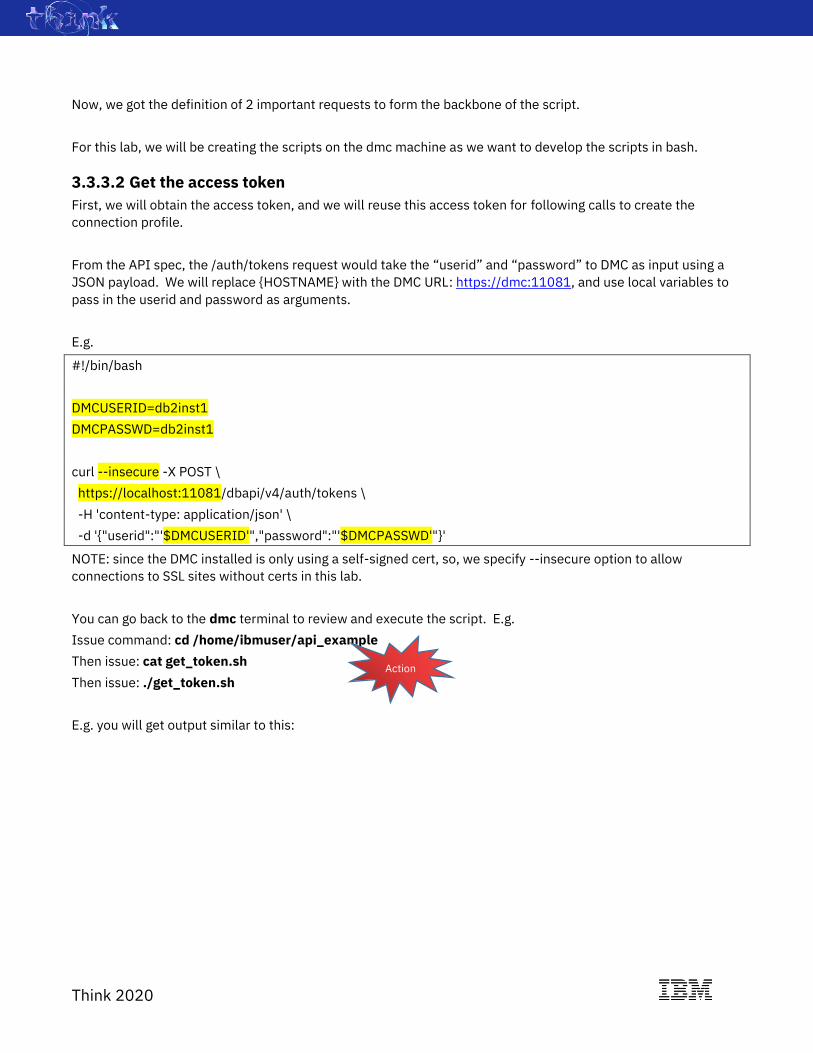
Think 2020
Now, we got the definition of 2 important requests to form the backbone of the script.
For this lab, we will be creating the scripts on the dmc machine as we want to develop the scripts in bash.
3.3.3.2 Get the access token
First, we will obtain the access token, and we will reuse this access token for following calls to create the
connection profile.
From the API spec, the /auth/tokens request would take the “userid” and “password” to DMC as input using a
JSON payload. We will replace {HOSTNAME} with the DMC URL: https://dmc:11081, and use local variables to
pass in the userid and password as arguments.
E.g.
#!/bin/bash
DMCUSERID=db2inst1
DMCPASSWD=db2inst1
curl --insecure -X POST \
https://localhost:11081/dbapi/v4/auth/tokens \
-H 'content-type: application/json' \
-d '{"userid":"'$DMCUSERID'","password":"'$DMCPASSWD'"}'
NOTE: since the DMC installed is only using a self-signed cert, so, we specify --insecure option to allow
connections to SSL sites without certs in this lab.
You can go back to the dmc terminal to review and execute the script. E.g.
Issue command: cd /home/ibmuser/api_example
Then issue: cat get_token.sh
Then issue: ./get_token.sh
E.g. you will get output similar to this:
Action

Think 2020
As you can see from above output there is a key value pair: “token”:”eyJraWQiOiJX…” Since we need to pass
the token value to the next API call. We will use jq, to parse out the JSON output for the access token, with the
following syntax.
E.g.
#!/bin/bash
DMCUSERID=db2inst1
DMCPASSWD=db2inst1
TOKEN=$(curl --insecure -X POST \
https://localhost:11081/dbapi/v4/auth/tokens \
-H 'content-type: application/json' \
-d '{"userid":"'$DMCUSERID'","password":"'$DMCPASSWD'"}' \
| jq -r '.token'
)
echo $TOKEN
The above modification has been saved to get_token_1.sh you can view and execute the script. E.g.
Issue: cat get_token_1.sh
Then issue: ./get_token_1.sh
E.g.
Action

Think 2020
You can see only the token value is in the output.
3.3.3.3 Call API using token
At this point, we have the access token, and we are ready to pass it to the /db2profiles POST request. We will
append the sample code for calling the /db2profiles request to the end of the previous script.
From the API spec, the /db2profile request would take the following as mandatory inputs:
"host", "port", "databaseName", "dataServerType”, "name", collectionCred "user", collectionCred "password".
In preparation for this lab, database TEST1 has been created on dmcrepo machine. These will be to connection
information to TEST1.
DATABASEHOST=dmcrepo
DATABASEPORT=50000
DATABASENAME=TEST1
CONNECTIONNAME=TEST1
COLLECTCREDUSERID=db2inst1
COLLECTCREDPASSWD=db2inst1
After creating the connection profile, we will call the /db2profiles/{dbprofile_name} GET request to valid the
connection is added successfully.
E.g.
#!/bin/bash
DMCUSERID=db2inst1
DMCPASSWD=db2inst1

Think 2020
TOKEN=$(curl --insecure -X POST \
https://localhost:11081/dbapi/v4/auth/tokens \
-H 'content-type: application/json' \
-d '{"userid":"'$DMCUSERID'","password":"'$DMCPASSWD'"}' \
| jq -r '.token'
)
echo $TOKEN
DATABASEHOST=dmcrepo
DATABASEPORT=50000
DATABASENAME=TEST1
CONNECTIONNAME=TEST1
COLLECTCREDUSERID=db2inst1
COLLECTCREDPASSWD=db2inst1
COMMENT=my_first_API_test
# Add profile
ADDPROFILERESULT=$(curl --insecure -X POST \
https://localhost:11081/dbapi/v4/dbprofiles \
-H 'authorization: Bearer '$TOKEN \
-H 'content-type: application/json' \
-d
'{"name":"'$CONNECTIONNAME'","dataServerType":"DB2LUW","databaseName":"'$DATABASENAME'","port":"'
$DATABASEPORT'","host":"'$DATABASEHOST'","URL":"jdbc:db2://'$DATABASEHOST':'$DATABASEPORT'/'$DA
TABASENAME':retrieveMessagesFromServerOnGetMessage=true;","sslConnection":"false","disableDataCollecti
on":"false","collectionCred":{"securityMechanism":"3","user":"'$COLLECTCREDUSERID'","password":"'$COLLEC
TCREDPASSWD'"},"comment":"'$COMMENT'"}')
echo "Add profile result"
echo $ADDPROFILERESULT
echo
# Get profile
GETPROFILERESULT=$(curl --insecure -X GET \
'https://localhost:11081/dbapi/v4/dbprofiles/'$CONNECTIONNAME \
-H 'authorization: Bearer '$TOKEN \
-H 'content-type: application/json')
echo
echo "PROFILE information for $CONNECTIONNAME "
echo $GETPROFILERESULT | jq '.'

Think 2020
echo
In this example, we noticed that in the API doc in DMC 3.1.2 is not updated yet, and we require the following 2
fields in order to proceed with the connection profile creation.
1. "URL":"jdbc:db2://'$DATABASEHOST':'$DATABASEPORT'/'$DATABASENAME':retrieveMessagesFromSe
rverOnGetMessage=true;"
2. "disableDataCollection":"false"
The above script is already created for you and saved to create_connection_profile.sh. Let’s view and execute
the script. E.g.
Issue: cat create_connection_profile.sh
Then issue: ./create_connection_profile.sh
After execution, you should see results similar to this:
Action

Think 2020
In this exercise, you learned how to get an access token and pass it to another API request. As a result, you
have created a new connection profile for TEST1 database.
3.3.4 Grant connection profile to users Grant connection profiles to users in DMC UI is nice, but, if you had to add multiple users to many different
monitor profiles, this task can be tedious. In this example, we will be showing you how to create a script and call
the DMC /userProfilePrivileges?action=assign request and grant connection profile TEST1 to user mary.
We noticed that in the API doc in DMC 3.1.2 is not updated for REQUEST: POST
/userProfilePrivileges?action=assign yet. Let’s review the specification for the payload below. In the payload,
you can specify multiple profiles to be updated, e.g. PROFILE_NAME1 and PROFILE_NAME2 below. You can
also grant the connect to user as OWNER or USER type. E.g. user1, user2, user3 are OWNERs and user4 and
user5 are USERs of the PROFILE_NAME1, PROFILE_NAME2. E.g.

Think 2020
PAYLOAD:
[{"profileName":"PROFILE_NAME1","OWNER":["user1","user2","user3"],"USER":["user4","user5"]},{"profileNa
me":"PROFILE_NAME2","OWNER":["user1","user2","user3"],"USER":["user4","user5"]}]
With this info, let’s review the example, which we are going to grant USER privilege to mary for connection
profile TEST1.
#!/bin/bash
DMCUSERID=db2inst1
DMCPASSWD=db2inst1
TOKEN=$(curl --insecure -X POST \
https://localhost:11081/dbapi/v4/auth/tokens \
-H 'content-type: application/json' \
-d '{"userid":"'$DMCUSERID'","password":"'$DMCPASSWD'"}' \
| jq -r '.token'
)
echo $TOKEN
CONNECTIONNAME=TEST1
USERLIST=mary
# Add profile
GRANTPROFILE=$(curl --insecure -X POST \
https://localhost:11081/dbapi/v4/userProfilePrivileges?action=assign \
-H 'authorization: Bearer '$TOKEN \
-H 'content-type: application/json' \
-d '[{"profileName":"'$CONNECTIONNAME'","OWNER":[],"USER":["'$USERLIST'"]}]'
)
echo "Add profile result"
echo $GRANTPROFILE
echo
The above script is already created for you and saved to grant_connection.sh. Let’s view and execute the script.
E.g.
Issue: cat grant_connection.sh
Then issue: ./grant_connection.sh
Action

Think 2020
After execution, you should see results similar to this:
In this exercise, you learned how to grant connection (multiple) profile to multiple OWNER users and multiple
USER users. As a result, you have grant connection profile USER privilege to mary.
You can now go back to console UI, and logout as db2inst1. And you can relogin as user mary. By default, when
Mary logs in, she should be able to immediately use the connection TEST1. E.g.
Then, login as mary/mary
Action

Think 2020
After login, you should see the connection TEST1 automatically available for Mary to use.
You have learned how to use the Console RESTful APIs to perform DMC administrative tasks.
Sharing of connection profile to end users is an important concept, and you don’t want to create multiple
connection profiles to monitor the same database. You have now learned how to perform this task using
RESTful API. This is particular useful if you had hundreds of databases that you need to configure and hundreds
of users that you need to share to. Doing the steps in a programmatic manner will help you save time and
reduce human errors. Hope you will find this exercise useful.
Action

Think 2020
4 Conclusion With this lab, you have learned how DMC Monitoring pages are designed to help you dissect and breaking down
big problem into little pieces, along the way, you have also picked up glimpses of how to use Run SQL and
Explore functions in DMC. Having a systematic approach in breaking down a problem can help you in identifying
the root cause of performance problem.
In another section of the lab, you have learned how to use the RESTful Services to administer DMC itself. For
more examples on using the RESTful API, you can try out our hand-on-lab.
Please leave me comments, feedback or survey for improvement in lab content or DMC suggestions.
I hope you find the lab useful and you will start using DMC soon. You can reach our team in DMC Community or
contact me via email.
Thank you.
Jason Sizto
Useful Resources
DMC Community:
https://community.ibm.com/community/user/hybriddatamanagement/communities/community-
home?communitykey=e1f1cc2c-065f-4152-bef7-3641a384c9e1&tab=groupdetails
DMC Knowledge Center:
https://www.ibm.com/support/knowledgecenter/en/SS5Q8A_3.1.x/com.ibm.datatools.dsweb.ots.over.doc/topi
cs/welcome.html
Try it for free: https://www.ibm.com/products/db2-data-management-console/details
DMC Roadmap: https://bigblue.aha.io/published/7fa56b793c07e406f258866976ad051d?page=6