Embed Size (px)
Citation preview

E4.1
Spring 2015
Lab E4: Capacitors and the RC Circuit
Capacitors are among the most-commonly used circuit elements in modern electronic devices. Your calculator and cell phone contain dozens or hundreds of them. Any two electrical conductors brought near each other form a capacitor. If a charge Q is transferred from one conductor to the other (so that one has a charge +Q and the other has charge -Q), then there will be a voltage difference V, which is proportional to the charge
Q. The constant ratio is called the capacitance C.
(1) .
[To see that V must be proportional to Q, recall that the electric field is proportional to the charge ( ), and the voltage is proportional to ( ), hence, ] A parallel-plate capacitor, formed by two flat plates of area A, separated by a distance d, has a capacitance given by
(2) ,
where is the permittivity constant of free space, which has the value in SI units. Eq’n (2) applies when the plates are separated by air or vacuum, as an approximation. When there is a dielectric medium such as plastic or glass between the plates, the capacitance is greater than predicted by (2) and the correct formula is
(3) .
( Greek letter kappa) is a dimensionless number called the dielectric constant. The
value of depends on the dielectric medium, but it is always greater than one ( >1). The dielectric constants of various media are …
The SI unit of capacitance is the farad (F): . A farad is an immense capacitance; a typical capacitor in an electronic circuit has a capacitance of
Material κ nylon 3.4 oil 4.5 Pyrex 4.7 silicon 12 titania ceramic 130 strontium titanate 310
E4.2
Spring 2015
micro-farads (1µF = 10-6F ) or nano-farads (1nF= 10-9F ). Even a µF capacitor is regarded as a rather large capacitance and making such a capacitor in a small package is quite a technological feat. Consider trying to a make a 1µF capacitor with two square plates separated by a 1mm (10-3 m) air gap. The area A needed is
6 32
11o
C d 10 10A 100m10
− −
−
⋅= ≈ =
ε.
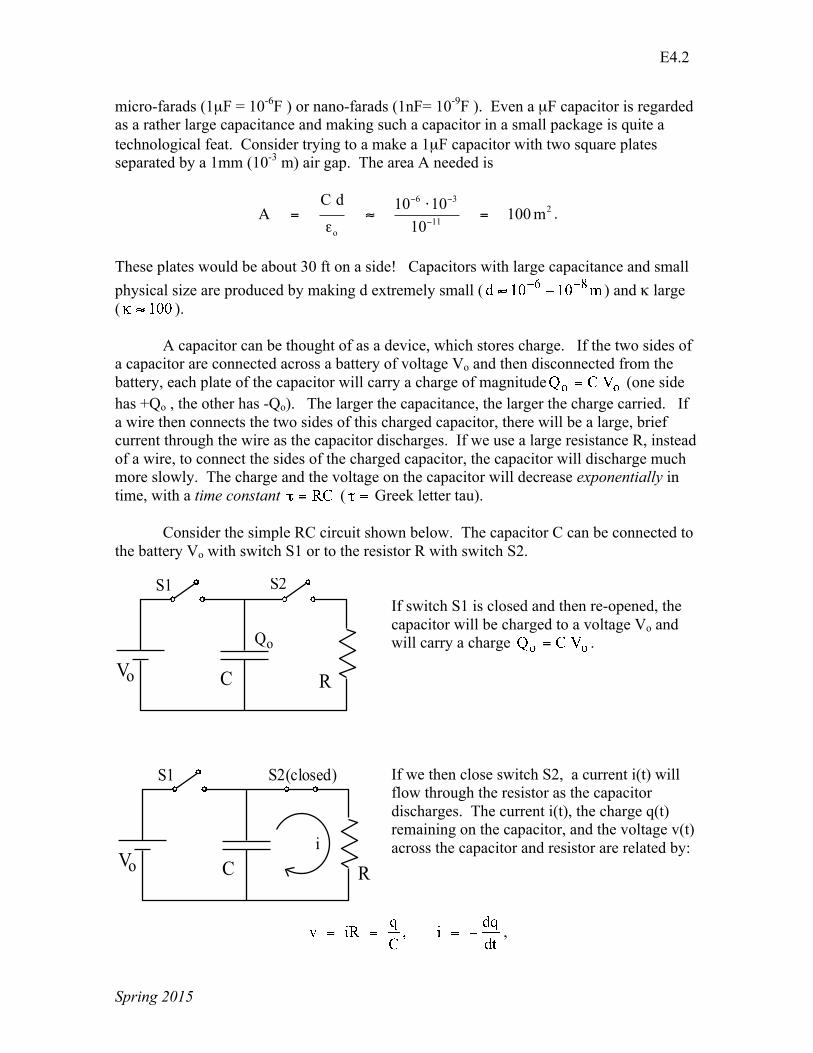
These plates would be about 30 ft on a side! Capacitors with large capacitance and small physical size are produced by making d extremely small ( ) and κ large ( ). A capacitor can be thought of as a device, which stores charge. If the two sides of a capacitor are connected across a battery of voltage Vo and then disconnected from the battery, each plate of the capacitor will carry a charge of magnitude (one side has +Qo , the other has -Qo). The larger the capacitance, the larger the charge carried. If a wire then connects the two sides of this charged capacitor, there will be a large, brief current through the wire as the capacitor discharges. If we use a large resistance R, instead of a wire, to connect the sides of the charged capacitor, the capacitor will discharge much more slowly. The charge and the voltage on the capacitor will decrease exponentially in time, with a time constant ( Greek letter tau). Consider the simple RC circuit shown below. The capacitor C can be connected to the battery Vo with switch S1 or to the resistor R with switch S2.
If switch S1 is closed and then re-opened, the capacitor will be charged to a voltage Vo and will carry a charge . If we then close switch S2, a current i(t) will flow through the resistor as the capacitor discharges. The current i(t), the charge q(t) remaining on the capacitor, and the voltage v(t) across the capacitor and resistor are related by:
,
C RVo
S1 S2
C RVo
S1 S2(closed)
Qo
i

E4.3
Spring 2015
The minus sign in the second equation indicates that the charge q is getting smaller as the current i flows. Combining these two equations yields the differential equation
(4) ,
where we have written . Notice that has the units of time. With the initial condition q(t=0) = Qo, the solution to this differential equation is (5) . The voltage v(t) is given by
(6) .
Taking the natural log of both sides of (6) yields
(7) . (the natural log is unitless)
Hence, a plot of ln(v) vs. t should be a straight line with slope = -1/τ. Experiment Part I. Capacitance of parallel plates In this section, you will measure the capacitance of a parallel-plate capacitor as a function of the plate separation. Then, using equation (2), you will compute the permittivity constant . This experiment must be performed on a wooden table because the presence of large, electrically conducting objects (such as metal tables) would affect the delicate capacitance measurement. Here, the capacitor consists of two large aluminum plates held apart by nylon plastic washers. Begin by measuring the dimensions of the plates and compute the area A. Then, check the zero of the capacitance meter by disconnecting any wires to the meter, setting the range to 200 pF (the most sensitive setting), and turning the zero knob very gently until the reading is within 1pF of zero. The zero knob is extremely sensitive; turn it just a little bit. When using the meter to measure capacitance, always set the range for the most sensitive setting, which does not cause overflow (this allows the most precise measurement). The number shown on the dial for the setting is the upper limit of what the

E4.4
Spring 2015
meter can measure on that setting, if your capacitor has a capacitance larger than this upper limit you have to change the setting to the next most sensitive setting. Now you are ready to measure the capacitance of the aluminum plates. Place plastic washers at the four corners of the capacitor plate holder, so that the plate separation is the thickness of 1 washer. Now step back away from the plates a few feet and note the capacitance on the meter to the nearest pF = 10-12 F. [Your body is full of salty water, which is a good conductor, so the presence of your body can affect the reading if you are too close.]
Now repeat this procedure with stacks of washers so that the plate separation equals the thickness of 2 washers, 3 washers... up to 6 washers. In this measurement, the capacitance meter measures not only the capacitance between the plates, but also the stray capacitance, which is the capacitance between the wires + the capacitance between each wire and the opposite plate. You can measure this stray capacitance by noting the capacitance reading when the plates are both flat on the table and not too close to each other, as in the drawing to the right. The idea is to reproduce, as nearly as possible, all the measurement conditions, except without the plates over each other. Subtract the measured stray capacitance from your earlier measurements to determine the inter-plate capacitance for each of the six separations. Now you must determine the average thickness of the nylon washers, in order to compute the separation of the plates for the six measurements. The washers are not perfectly identical; there is a slight variation in thickness from washer to washer. You can quickly get a very precise average thickness by stacking 30 or more washers and measuring the total thickness of the stack with the white plastic calipers. Divide your total stack height by number of washers to get the thickness of a single washer. (Use the “poker chip tray” provided to stack the washers easily.) Plot the inter-plate capacitance C vs. (1/d). Does the graph agree with theory? Now use your data (measured values of A, d, and C) to compute for each of your six measurements, and use eq’n (8) to compute for each of your six plate separations.
metal capacitor plates
capacitance meter
plastic washers
wooden plate holders

E4.5
Spring 2015
Compute the average of , as well as the standard deviation and the standard deviation of the mean. As usual, compare your result with the known value and comment on any discrepancy. Part II. Measurement of the time constant of an RC circuit. In this part, you will observe the exponential decay of the voltage on a capacitor in an RC circuit, using a sophisticated digital oscilloscope. You will measure the time constant τ of the decay and compare with the computed . In this part, you will use a commercial resistor and capacitor (not the aluminum plate capacitor of the last section). Before assembling the circuit shown below, measure the capacitance C of the capacitor and the resistance R of the resistor using the capacitance meter and the digital multimeter. From your measured values, compute RC; it should be in the range 10 - 50 msec. Now assemble the circuit and set the power supply voltage somewhere between 3.0 and 3.5 volts.
At first glance, the oscilloscope has a formidable-looking front panel. Fortunately, all the correct front-panel settings are stored in memory and can be recalled at any time with following sequence of commands: 1) Press SAVE/RECALL SETUP button on the upper right of the scope. 2) On the row of button below the screen, press RECALL SAVED SETUP. 3) On the column of buttons just to the right of the screen, press RECALL SETUP 1.

E4.6
Spring 2015
on/off clearmenu
cursor toggle cursor control knob
horizontal position
vertical position
Channel 1 signal in
1
2
3For correct settings, press buttons 1, 2, 3.
volts/div sec/div
With the circuit properly assembled, close the switch S and then open it. The digital oscilloscope will record the brief exponential decay of the voltage across the capacitor when the switch S is opened. The recorded signal should appear as in the diagram above. As you can see, there is a lot of information displayed on the screen. The volts/division of the vertical scale and the time/division of the horizontal scale are shown at the bottom of the screen. The zero volts position is shown with a little (1→) symbol (1 refers to Channel 1). You can quickly read the voltage and time of any point on the recorded waveform by using the two cursors which are controlled with the cursor toggle button and the cursor control knob. (If any screen menus are displayed, press CLEAR MENU before using the cursor controls.) One cursor or the other is made “active” with the toggle button and the active cursor is moved with the control knob. The active cursor is shown as a solid vertical line; the inactive cursor is shown as a dashed vertical line. The vertical distance (Δvoltage) and the horizontal distance (Δtime) between the two cursors is shown at the upper right of the screen, along with the absolute voltage of the active cursor. The oscilloscope screen displays only a portion of the recorded waveform. You can view more of the recorded waveform with the horizontal position knob. You want to measure time from the moment when the switch S was closed and the voltage on the capacitor began to decay. So set one of the cursors directly over the point
E4.7
Spring 2015
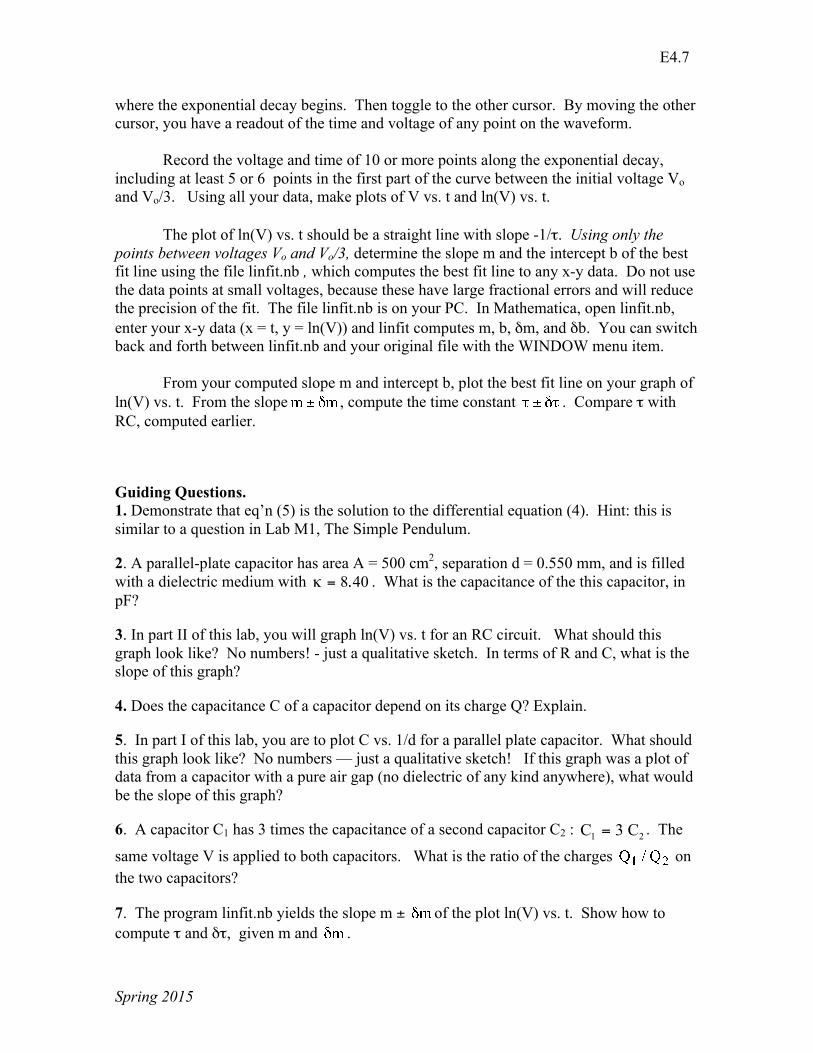
where the exponential decay begins. Then toggle to the other cursor. By moving the other cursor, you have a readout of the time and voltage of any point on the waveform. Record the voltage and time of 10 or more points along the exponential decay, including at least 5 or 6 points in the first part of the curve between the initial voltage Vo and Vo/3. Using all your data, make plots of V vs. t and ln(V) vs. t. The plot of ln(V) vs. t should be a straight line with slope -1/τ. Using only the points between voltages Vo and Vo/3, determine the slope m and the intercept b of the best fit line using the file linfit.nb , which computes the best fit line to any x-y data. Do not use the data points at small voltages, because these have large fractional errors and will reduce the precision of the fit. The file linfit.nb is on your PC. In Mathematica, open linfit.nb, enter your x-y data (x = t, y = ln(V)) and linfit computes m, b, δm, and δb. You can switch back and forth between linfit.nb and your original file with the WINDOW menu item. From your computed slope m and intercept b, plot the best fit line on your graph of ln(V) vs. t. From the slope , compute the time constant . Compare τ with RC, computed earlier.
Guiding Questions. 1. Demonstrate that eq’n (5) is the solution to the differential equation (4). Hint: this is similar to a question in Lab M1, The Simple Pendulum.
2. A parallel-plate capacitor has area A = 500 cm2, separation d = 0.550 mm, and is filled with a dielectric medium with 8 40.κ = . What is the capacitance of the this capacitor, in pF?
3. In part II of this lab, you will graph ln(V) vs. t for an RC circuit. What should this graph look like? No numbers! - just a qualitative sketch. In terms of R and C, what is the slope of this graph?
4. Does the capacitance C of a capacitor depend on its charge Q? Explain.
5. In part I of this lab, you are to plot C vs. 1/d for a parallel plate capacitor. What should this graph look like? No numbers — just a qualitative sketch! If this graph was a plot of data from a capacitor with a pure air gap (no dielectric of any kind anywhere), what would be the slope of this graph?
6. A capacitor C1 has 3 times the capacitance of a second capacitor C2 : 1 2C 3 C= . The
same voltage V is applied to both capacitors. What is the ratio of the charges on the two capacitors?
7. The program linfit.nb yields the slope m ± of the plot ln(V) vs. t. Show how to compute τ and δτ, given m and .

E4.8
Spring 2015
8. In part I of this lab, what is the stray capacitance and how is it measured?
9. An RC circuit has a time constant of 85τ = msec. A switch is closed, which causes the capacitor to discharge through the resistor. How long after the switch is closed will the voltage on the capacitor have fallen to 2% of its initial value?
10. True or False: Holding everything else constant, if one capacitor is physically larger than another capacitor, then the larger-sized capacitor must have a larger capacitance.
E4.9
Spring 2015
Pre-lab assignment for E4: Capacitors and the RC Circuit. This prelab is designed to focus your attention on what is important in the lab before you start the experiment and give you a “leg up” on writing your report. Use this template when you write your report.
1. Carefully read the lab instructions for E4
2. Using Mathematica, set up a template for your lab report. This will include:
I. Header information such as title, author, lab partner, and lab section: (to do this, In Mathematica, go to “File”, “Print Settings”, “Header and Footer” from this dialog box you can enter all of the required information.) Mathematica automatically enters the file name in the right side of the header. Leave this alone.
II. Section Headings including “Title”, “Summary of Experiment”, “Data and Calculations”, “Discussion of Uncertainty”, and specific section headings for each part of the experiment. (All of the Physics 1140 lab manuals include multiple parts.)
3. Write a Summary of the experiment. What are you going to measure and what
data will you collect to make the measurement? (For example, in part one of M1, you will measure the length of a pendulum along with the period of the pendulum to determine the acceleration due to gravity.)
4. For each part of the lab do the following: A.) For part one: suppose you have a square parallel plate capacitor that is 20cm
on each side. Plot a theory graph showing the relationship of Capacitance vs Plate Separation. Use equation (2) for inspiration.
B.) For part two: suppose you create an RC circuit with a 1Mohm resistor and a 10nF capacitor. You set the initial voltage at 5 Volts. Create a theory graph that shows the decay of voltage v(t) as a function of time.
Remember, all graphs you make in a prelab or lab report should include the following:
I. Plot your theory or expectation as a line. (In Mathematica, you should define a function and plot it using the command “Plot”) Reference the Mathematica tutorial to do this.
II. Label your axes, in English (not just symbols) and with units.
III. Include a brief caption (namely, a text statement of what the plot shows.)
E4.10
Spring 2015
IV. Set the x and y range of the plot to be close to what you expect for your data. For example: in M1 your longest length pendulum should be no more than 130 cm in length.
5. Write a Discussion of Uncertainty. What are the major sources of uncertainty in
the experiment and how will you account for them?
6. Turn in a printout of your Mathematica document that includes 2-5 above. This document should be no more than 2 pages long.