Embed Size (px)
Citation preview

LAB MANUAL
SERVICING AND MAINTENANCE LAB
BIOMEDICAL ENGINEERING


STATE INSTITUTE OF TECHNICAL TEACHERS TRAINING AND RESEARCH
GENERAL INSTRUCTIONS
Rough record and Fair record are needed to record the experiments conducted in the laboratory.
Rough records are needed to be certified immediately on completion of the experiment. Fair records are
due at the beginning of the next lab period. Fair records must be submitted as neat, legible, and complete.
INSTRUCTIONS TO STUDENTS FOR WRITING THE FAIR RECORD
In the fair record, the index page should be filled properly by writing the corresponding experiment
number, experiment name , date on which it was done and the page number.
On the right side page of the record following has to be written:
1. Title: The title of the experiment should be written in the page in capital letters.
2. In the left top margin, experiment number and date should be written.
3. Aim: The purpose of the experiment should be written clearly.
4.Apparatus/Tools/Equipments/Components used: A list of the Apparatus/Tools /Equipments
/Components used for doing the experiment should be entered.
5. Principle: Simple working of the circuit/experimental set up/algorithm should be written.
6. Procedure: steps for doing the experiment and recording the readings should be briefly
described(flow chart/programs in the case of computer/processor related experiments)
7. Results: The results of the experiment must be summarized in writing and should be fulfilling the
aim.
8. Inference : Inference from the results is to be mentioned.
On the Left side page of the record following has to be recorded:
1. Circuit/Program: Neatly drawn circuit diagrams/experimental set up.
2. Design: The design of the circuit/experimental set up for selecting the components
should be clearly shown if necessary.
3. Observations: i) Data should be clearly recorded using Tabular Columns.
ii) Unit of the observed data should be clearly mentioned
iii) Relevant calculations should be shown. If repetitive calculations are needed, only show a sample
calculation and summarize the others in a table.
4. Graphs : Graphs can used to present data in a form that show the results obtained, as one or more of
the parameters are varied. A graph has the advantage of presenting large
amounts of data in a concise visual form. Graph should be in a square format.
GENERAL RULES FOR PERSONAL SAFETY
1. Always wear tight shirt/lab coat , pants and shoes inside workshops.
2. REMOVE ALL METAL JEWELLERY since rings, wrist watches or bands, necklaces, etc. make excellent
electrodes in the event of accidental contact with electric power sources.
3. DO NOT MAKE CIRCUIT CHANGES without turning off the power.
4. Make sure that equipment working on electrical power are grounded properly.
5. Avoid standing on metal surfaces or wet concrete. Keep your shoes dry.
6. Never handle electrical equipment with wet skin.
7. Hot soldering irons should be rested in its holder. Never leave a hot iron unattended.
8. Avoid use of loose clothing and hair near machines and avoid running around inside lab .
TO PROTECT EQUIPMENT AND MINIMIZE MAINTENANCE:
DO: 1. SET MULTIRANGE METERS to highest range before connecting to an unknown source.
2. INFORM YOUR INSTRUCTOR about faulty equipment so that it can be sent for repair.
DO NOT: 1. Do not MOVE EQUIPMENT around the room except under the supervision of an instructor.

Experiment No. 1.1
TESTING OF ELECTRONIC COMPONENTS
Aim: To familiarise with testing of electronic components.
Objectives: After completion of this experiment student will be able to test different electronic
components.
Equipment/Components:
Sl no Name and Specification Quantity required
1 Resistor, Capacitor, Inductor,
Transformer, Diode, LED,
Transistor, MOSFET, Zener diode
1 each
2 Multimeter 1
Principle
An electronic component is a basic discrete device or physical entity in an electronic system
used to affect electrons or their associated field .the electronic components are mainly classified
into two groups or categories. They are active and passive components.
1. Active components
The main components used in electronics are of two general types: passive (e.g. resistors and
capacitors) and active (e.g. transistors and integrated circuits). The main difference between
active and passive components is that active ones require to be powered in some way to make
them work.
2. Passive components
Components incapable of controlling current by means of another electrical signal are called
passive devices. Resistors, capacitors, inductors, transformers etc.
Procedure
I. Sketch the given components and identify their terminals.
II. Testing of passive components
1. Resistors:-
To check to see whether a resistor is good or not, we need to only perform one test and this is
to check the resistor's resistance value, using the ohmmeter of a multimeter.
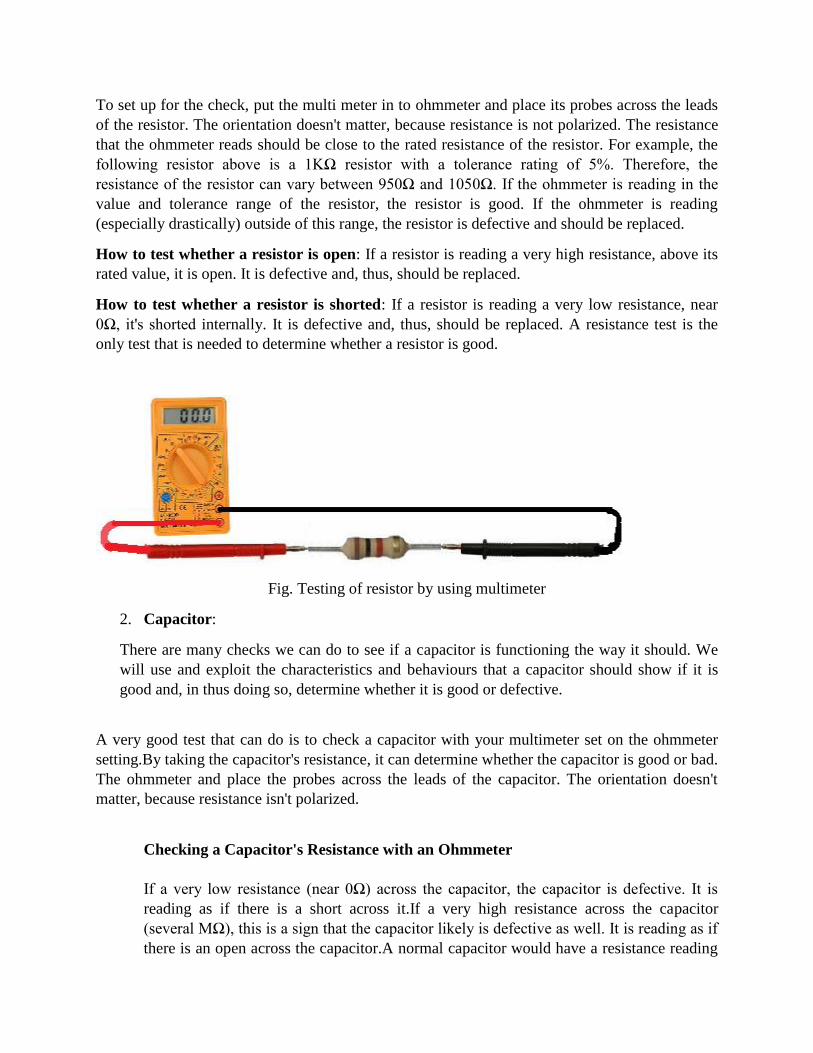
To set up for the check, put the multi meter in to ohmmeter and place its probes across the leads
of the resistor. The orientation doesn't matter, because resistance is not polarized. The resistance
that the ohmmeter reads should be close to the rated resistance of the resistor. For example, the
following resistor above is a 1KΩ resistor with a tolerance rating of 5%. Therefore, the
resistance of the resistor can vary between 950Ω and 1050Ω. If the ohmmeter is reading in the
value and tolerance range of the resistor, the resistor is good. If the ohmmeter is reading
(especially drastically) outside of this range, the resistor is defective and should be replaced.
How to test whether a resistor is open: If a resistor is reading a very high resistance, above its
rated value, it is open. It is defective and, thus, should be replaced.
How to test whether a resistor is shorted: If a resistor is reading a very low resistance, near
0Ω, it's shorted internally. It is defective and, thus, should be replaced. A resistance test is the
only test that is needed to determine whether a resistor is good.
Fig. Testing of resistor by using multimeter
2. Capacitor:
There are many checks we can do to see if a capacitor is functioning the way it should. We
will use and exploit the characteristics and behaviours that a capacitor should show if it is
good and, in thus doing so, determine whether it is good or defective.
A very good test that can do is to check a capacitor with your multimeter set on the ohmmeter
setting.By taking the capacitor's resistance, it can determine whether the capacitor is good or bad.
The ohmmeter and place the probes across the leads of the capacitor. The orientation doesn't
matter, because resistance isn't polarized.
Checking a Capacitor's Resistance with an Ohmmeter
If a very low resistance (near 0Ω) across the capacitor, the capacitor is defective. It is
reading as if there is a short across it.If a very high resistance across the capacitor
(several MΩ), this is a sign that the capacitor likely is defective as well. It is reading as if
there is an open across the capacitor.A normal capacitor would have a resistance reading
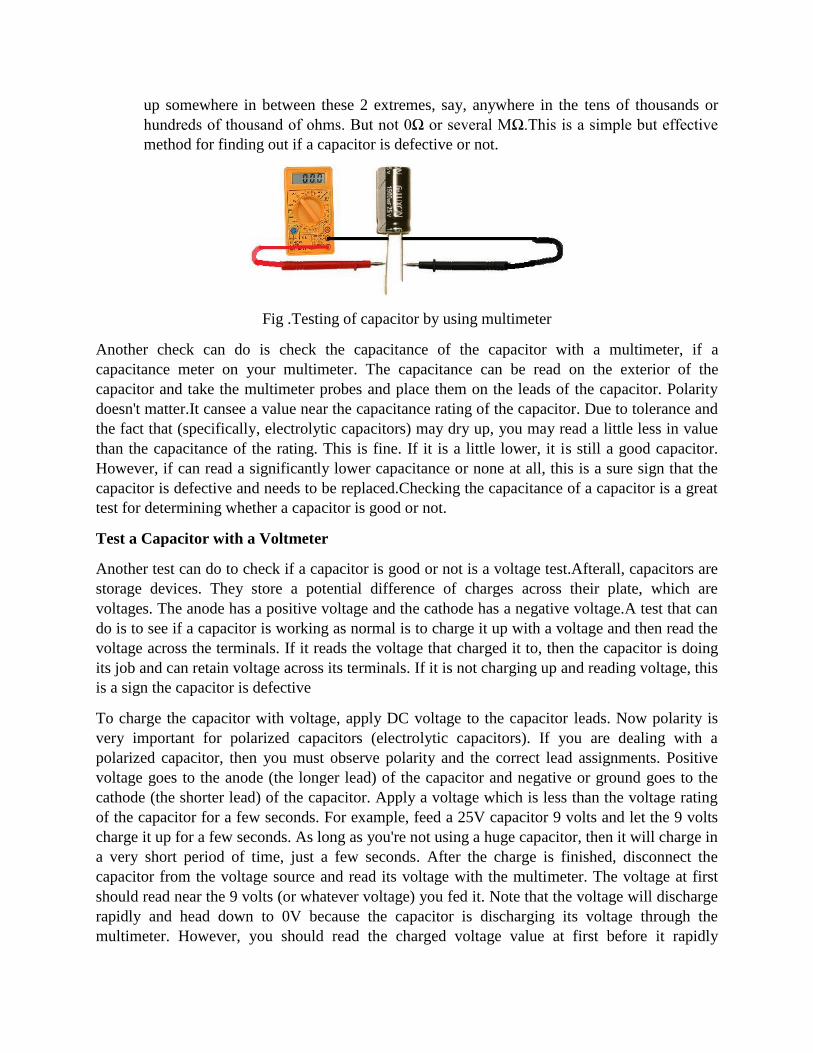
up somewhere in between these 2 extremes, say, anywhere in the tens of thousands or
hundreds of thousand of ohms. But not 0Ω or several MΩ.This is a simple but effective
method for finding out if a capacitor is defective or not.
Fig .Testing of capacitor by using multimeter
Another check can do is check the capacitance of the capacitor with a multimeter, if a
capacitance meter on your multimeter. The capacitance can be read on the exterior of the
capacitor and take the multimeter probes and place them on the leads of the capacitor. Polarity
doesn't matter.It cansee a value near the capacitance rating of the capacitor. Due to tolerance and
the fact that (specifically, electrolytic capacitors) may dry up, you may read a little less in value
than the capacitance of the rating. This is fine. If it is a little lower, it is still a good capacitor.
However, if can read a significantly lower capacitance or none at all, this is a sure sign that the
capacitor is defective and needs to be replaced.Checking the capacitance of a capacitor is a great
test for determining whether a capacitor is good or not.
Test a Capacitor with a Voltmeter
Another test can do to check if a capacitor is good or not is a voltage test.Afterall, capacitors are
storage devices. They store a potential difference of charges across their plate, which are
voltages. The anode has a positive voltage and the cathode has a negative voltage.A test that can
do is to see if a capacitor is working as normal is to charge it up with a voltage and then read the
voltage across the terminals. If it reads the voltage that charged it to, then the capacitor is doing
its job and can retain voltage across its terminals. If it is not charging up and reading voltage, this
is a sign the capacitor is defective
To charge the capacitor with voltage, apply DC voltage to the capacitor leads. Now polarity is
very important for polarized capacitors (electrolytic capacitors). If you are dealing with a
polarized capacitor, then you must observe polarity and the correct lead assignments. Positive
voltage goes to the anode (the longer lead) of the capacitor and negative or ground goes to the
cathode (the shorter lead) of the capacitor. Apply a voltage which is less than the voltage rating
of the capacitor for a few seconds. For example, feed a 25V capacitor 9 volts and let the 9 volts
charge it up for a few seconds. As long as you're not using a huge capacitor, then it will charge in
a very short period of time, just a few seconds. After the charge is finished, disconnect the
capacitor from the voltage source and read its voltage with the multimeter. The voltage at first
should read near the 9 volts (or whatever voltage) you fed it. Note that the voltage will discharge
rapidly and head down to 0V because the capacitor is discharging its voltage through the
multimeter. However, you should read the charged voltage value at first before it rapidly
declines. This is the behavior of a healthy and a good capacitor. If it will not retain voltage, it is
defective and should be replaced.
3. Inductor
Test an Inductor with a Multimeter in the Ohmmeter Setting for Resistance
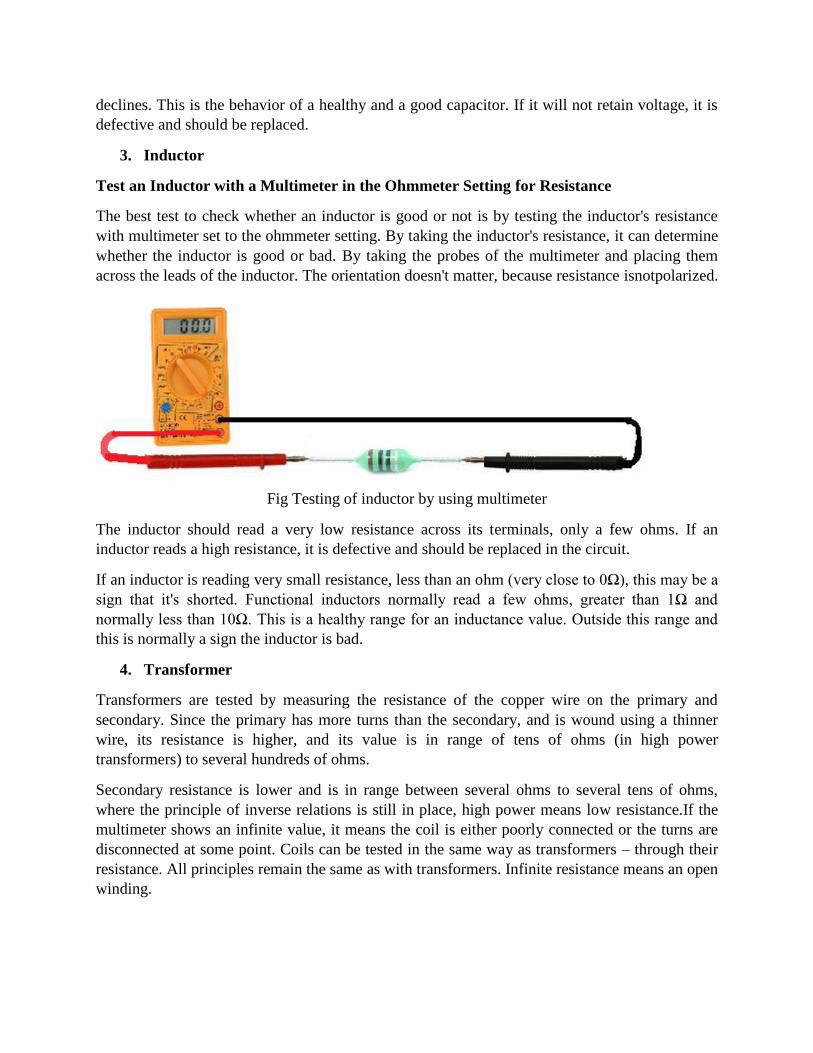
The best test to check whether an inductor is good or not is by testing the inductor's resistance
with multimeter set to the ohmmeter setting. By taking the inductor's resistance, it can determine
whether the inductor is good or bad. By taking the probes of the multimeter and placing them
across the leads of the inductor. The orientation doesn't matter, because resistance isnotpolarized.
Fig Testing of inductor by using multimeter
The inductor should read a very low resistance across its terminals, only a few ohms. If an
inductor reads a high resistance, it is defective and should be replaced in the circuit.
If an inductor is reading very small resistance, less than an ohm (very close to 0Ω), this may be a
sign that it's shorted. Functional inductors normally read a few ohms, greater than 1Ω and
normally less than 10Ω. This is a healthy range for an inductance value. Outside this range and
this is normally a sign the inductor is bad.
4. Transformer
Transformers are tested by measuring the resistance of the copper wire on the primary and
secondary. Since the primary has more turns than the secondary, and is wound using a thinner
wire, its resistance is higher, and its value is in range of tens of ohms (in high power
transformers) to several hundreds of ohms.
Secondary resistance is lower and is in range between several ohms to several tens of ohms,
where the principle of inverse relations is still in place, high power means low resistance.If the
multimeter shows an infinite value, it means the coil is either poorly connected or the turns are
disconnected at some point. Coils can be tested in the same way as transformers – through their
resistance. All principles remain the same as with transformers. Infinite resistance means an open
winding.
II. Testing of active components
1. diode
A very good test to check a diode with multimeter set to the ohmmeter setting.This is a simple
test to check whether it is good, open, or shorted. So we take the ohmmeter and place it across
the leads of the diode. The orientation is very important.
Anode-Cathode Diode Resistance Test
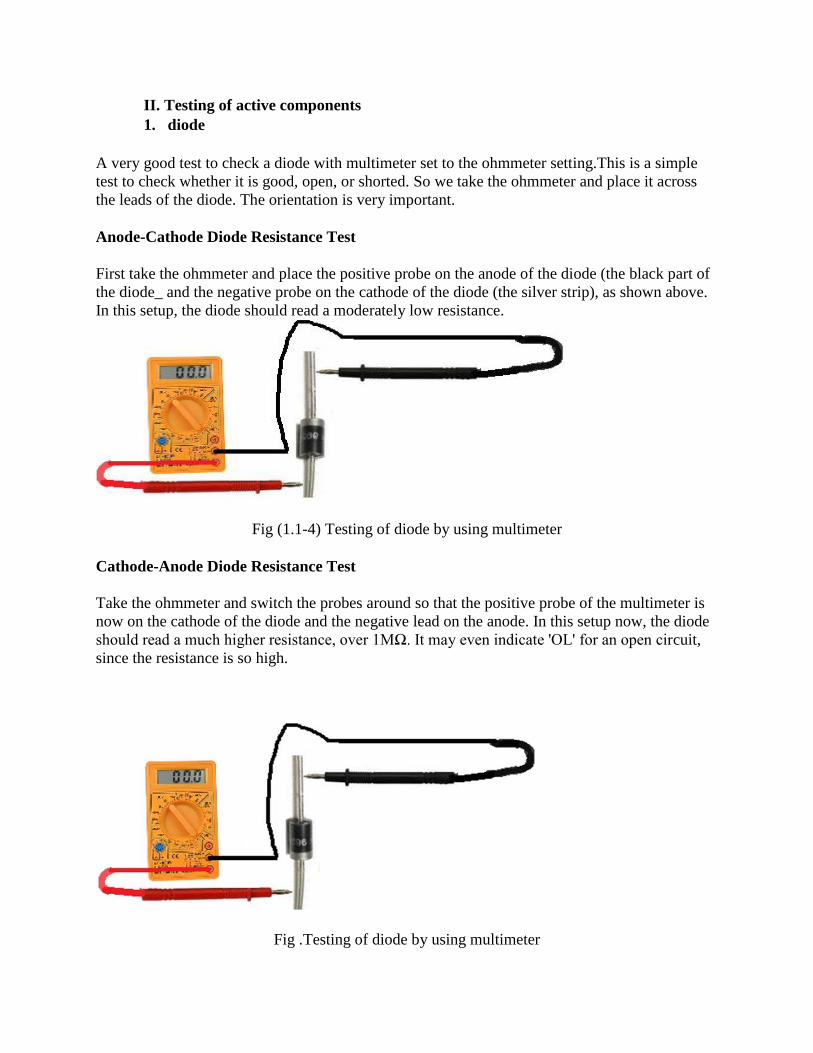
First take the ohmmeter and place the positive probe on the anode of the diode (the black part of
the diode_ and the negative probe on the cathode of the diode (the silver strip), as shown above.
In this setup, the diode should read a moderately low resistance.
Fig (1.1-4) Testing of diode by using multimeter
Cathode-Anode Diode Resistance Test
Take the ohmmeter and switch the probes around so that the positive probe of the multimeter is
now on the cathode of the diode and the negative lead on the anode. In this setup now, the diode
should read a much higher resistance, over 1MΩ. It may even indicate 'OL' for an open circuit,
since the resistance is so high.
Fig .Testing of diode by using multimeter
If you read a moderately low resistance with the leads on the diode one way and a high resistance
with the leads the other, this is a sign that the diode is good. A diode should read relatively low
resistance in the forward biased direction and very high resistance in the reverse biased direction.
Open Diode: If the diode reads high resistance in both directions, this is a sign that the diode is
open. A diode should not measure very high resistance in the forward biased direction. The diode
should be replaced in the circuit.
Shorted Diode: If the diode reads low resistances in both directions, this is a sign that the diode is
shorted. A diode should not measure low resistance in the reverse biased direction. The diode
should be replaced in the circuit.
2. LED
In order to check an LED, turn the dial to the diode symbol on the multimeter. This allows for
electric current to travel in one direction (the arrow) and not the other. Turn the multimeter on.
The display window should indicate either 0L or OPEN. Connect the black probe to the cathode
end of the LED, which usually is the shorter end and/or cut flat at its bottom. Connect the red
probe to the anode end of the LED. The LED will glow if it is good, else if replace it.
3. Transistor:
A transistor, internally, is basically a component made up of different diode junctions. NPN and
PNP Transistors are made up two pn junctions sandwiched together. These pn junctions are
diodes. A transistor, internally, is basically a component made up of different diode junctions.
NPN and PNP Transistors are made up two pn junctions sandwiched together. These pn
junctions are diodes.Knowing that transistors are essentially diodes sandwiched together (placed
back-to-back), we can exploit this principle and test the leads of transistors as if they are separate
diodes.
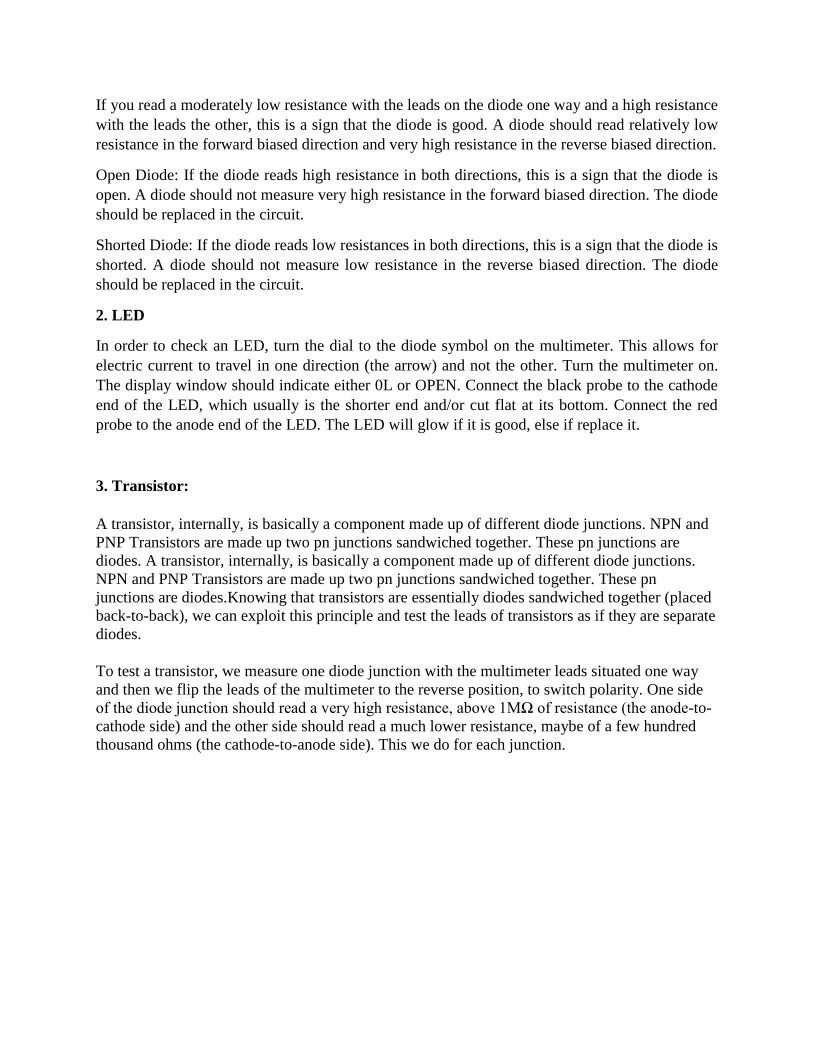
To test a transistor, we measure one diode junction with the multimeter leads situated one way
and then we flip the leads of the multimeter to the reverse position, to switch polarity. One side
of the diode junction should read a very high resistance, above 1MΩ of resistance (the anode-to-
cathode side) and the other side should read a much lower resistance, maybe of a few hundred
thousand ohms (the cathode-to-anode side). This we do for each junction.
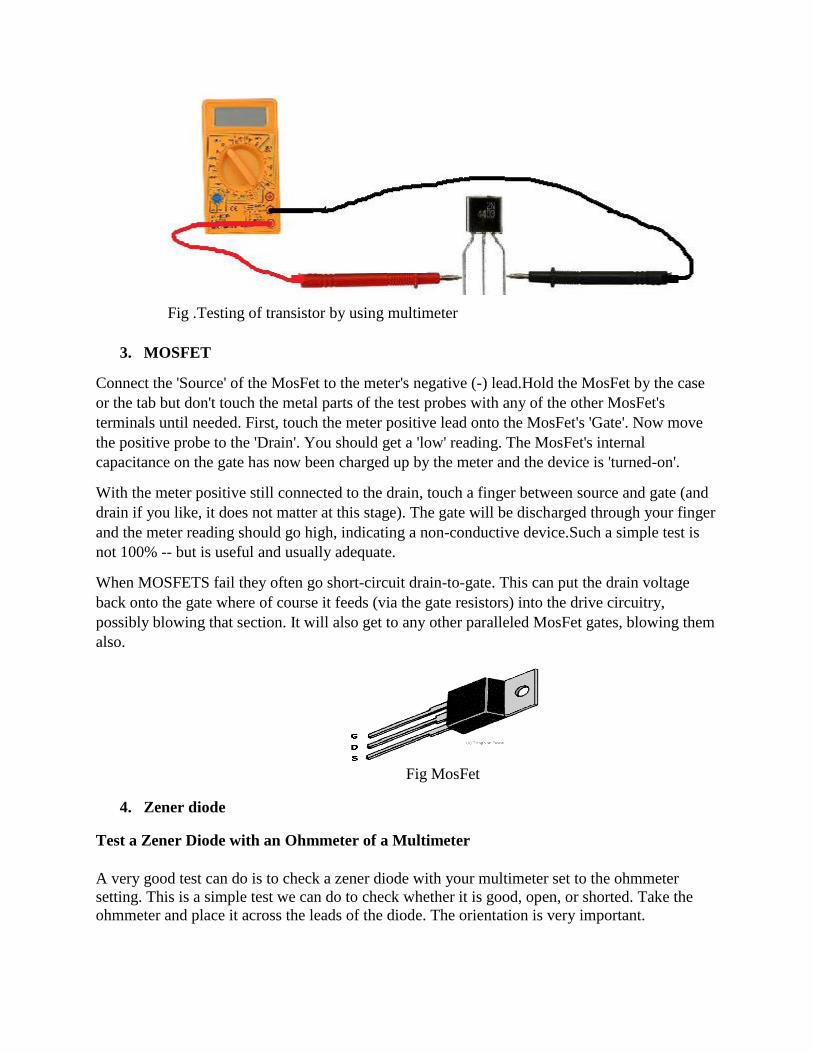
Fig .Testing of transistor by using multimeter
3. MOSFET
Connect the 'Source' of the MosFet to the meter's negative (-) lead.Hold the MosFet by the case
or the tab but don't touch the metal parts of the test probes with any of the other MosFet's
terminals until needed. First, touch the meter positive lead onto the MosFet's 'Gate'. Now move
the positive probe to the 'Drain'. You should get a 'low' reading. The MosFet's internal
capacitance on the gate has now been charged up by the meter and the device is 'turned-on'.
With the meter positive still connected to the drain, touch a finger between source and gate (and
drain if you like, it does not matter at this stage). The gate will be discharged through your finger
and the meter reading should go high, indicating a non-conductive device.Such a simple test is
not 100% -- but is useful and usually adequate.
When MOSFETS fail they often go short-circuit drain-to-gate. This can put the drain voltage
back onto the gate where of course it feeds (via the gate resistors) into the drive circuitry,
possibly blowing that section. It will also get to any other paralleled MosFet gates, blowing them
also.
Fig MosFet
4. Zener diode
Test a Zener Diode with an Ohmmeter of a Multimeter
A very good test can do is to check a zener diode with your multimeter set to the ohmmeter
setting. This is a simple test we can do to check whether it is good, open, or shorted. Take the
ohmmeter and place it across the leads of the diode. The orientation is very important.
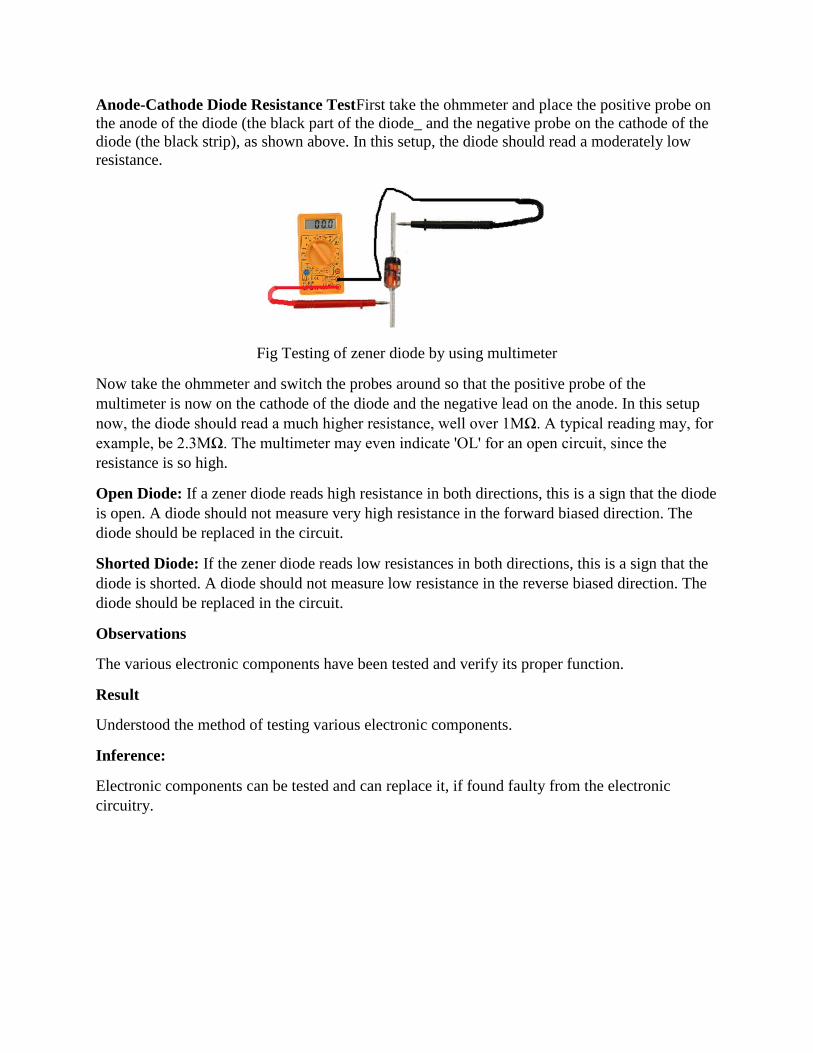
Anode-Cathode Diode Resistance TestFirst take the ohmmeter and place the positive probe on
the anode of the diode (the black part of the diode_ and the negative probe on the cathode of the
diode (the black strip), as shown above. In this setup, the diode should read a moderately low
resistance.
Fig Testing of zener diode by using multimeter
Now take the ohmmeter and switch the probes around so that the positive probe of the
multimeter is now on the cathode of the diode and the negative lead on the anode. In this setup
now, the diode should read a much higher resistance, well over 1MΩ. A typical reading may, for
example, be 2.3MΩ. The multimeter may even indicate 'OL' for an open circuit, since the
resistance is so high.
Open Diode: If a zener diode reads high resistance in both directions, this is a sign that the diode
is open. A diode should not measure very high resistance in the forward biased direction. The
diode should be replaced in the circuit.
Shorted Diode: If the zener diode reads low resistances in both directions, this is a sign that the
diode is shorted. A diode should not measure low resistance in the reverse biased direction. The
diode should be replaced in the circuit.
Observations
The various electronic components have been tested and verify its proper function.
Result
Understood the method of testing various electronic components.
Inference:
Electronic components can be tested and can replace it, if found faulty from the electronic
circuitry.

Experiment No. 1.2
TO FAMILIARIZE TROUBLESHOOTING TOOLS AND ITS
PROCEDURES
Aim: To familiarise troubleshooting tools and its procedure
Objective: After completion of this experiment student will be able to understand various
trouble shooting tools and its procedure.
Equipment/Components:
Sl no Name and Specification Quantity required
1 Ammeter 1
2 Voltmeter 1
3 Continuity tester 1
4 LCR Meter 1
5 Multimeter 1
Principle/theory
Test equipments are used to create signals and capture responses from electronic Devices
Under Test (DUTs). In this way, the proper operation of the DUT can be proven or faults in the
device can be traced. Use of electronic test equipment is essential to any serious work on
electronics systems.
Procedure
I. Sketch the front and back panel of the given instruments and identify their controls.
II.
1. Ammeter
An ammeter is a measuring instrument used to measure the current in a circuit. Electric
currents are measured in amperes (A), hence the name. Instruments used to measure
smaller currents, in the milliampere or microampere range, are designated as
milliammeters or microammeters
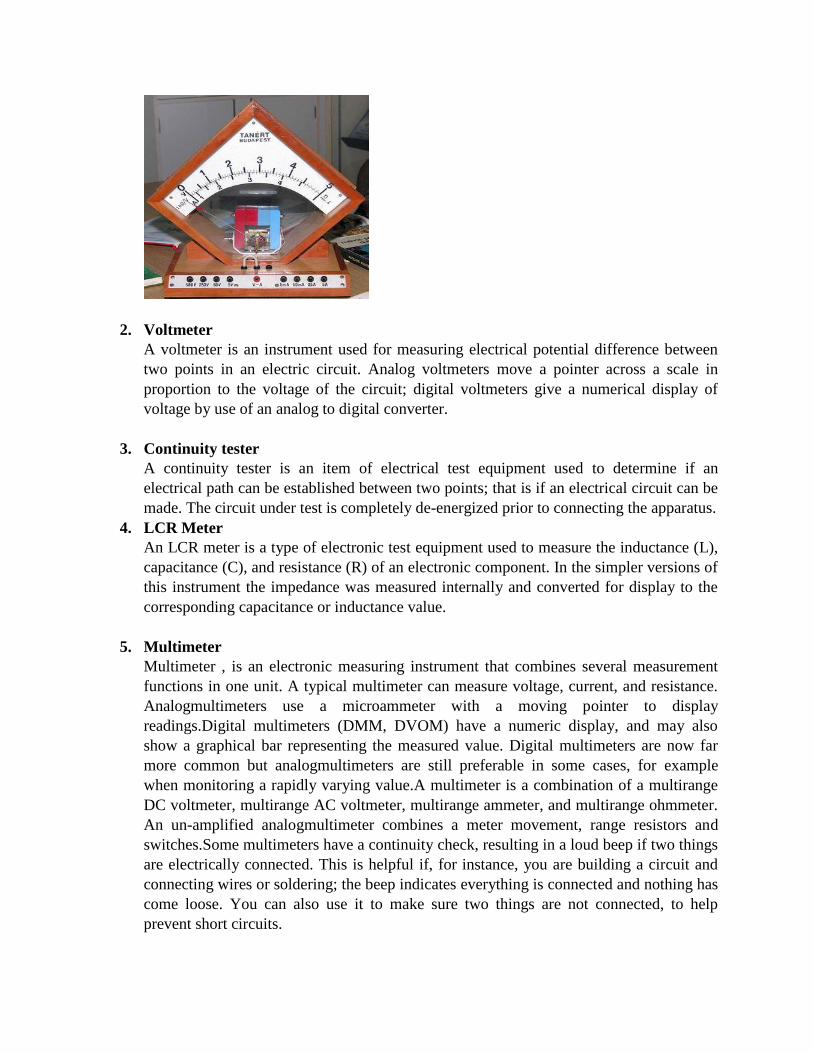
2. Voltmeter
A voltmeter is an instrument used for measuring electrical potential difference between
two points in an electric circuit. Analog voltmeters move a pointer across a scale in
proportion to the voltage of the circuit; digital voltmeters give a numerical display of
voltage by use of an analog to digital converter.
3. Continuity tester
A continuity tester is an item of electrical test equipment used to determine if an
electrical path can be established between two points; that is if an electrical circuit can be
made. The circuit under test is completely de-energized prior to connecting the apparatus.
4. LCR Meter
An LCR meter is a type of electronic test equipment used to measure the inductance (L),
capacitance (C), and resistance (R) of an electronic component. In the simpler versions of
this instrument the impedance was measured internally and converted for display to the
corresponding capacitance or inductance value.
5. Multimeter
Multimeter , is an electronic measuring instrument that combines several measurement
functions in one unit. A typical multimeter can measure voltage, current, and resistance.
Analogmultimeters use a microammeter with a moving pointer to display
readings.Digital multimeters (DMM, DVOM) have a numeric display, and may also
show a graphical bar representing the measured value. Digital multimeters are now far
more common but analogmultimeters are still preferable in some cases, for example
when monitoring a rapidly varying value.A multimeter is a combination of a multirange
DC voltmeter, multirange AC voltmeter, multirange ammeter, and multirange ohmmeter.
An un-amplified analogmultimeter combines a meter movement, range resistors and
switches.Some multimeters have a continuity check, resulting in a loud beep if two things
are electrically connected. This is helpful if, for instance, you are building a circuit and
connecting wires or soldering; the beep indicates everything is connected and nothing has
come loose. You can also use it to make sure two things are not connected, to help
prevent short circuits.
Some multimeters also have a diode check function. A diode is like a one-way valve that
only lets electricity flow in one direction. The exact function of the diode check can vary
from multimeter to multimeter. If you're working with a diode and can't tell which way it
goes in the circuit, or if you're not sure the diode is working properly, the check feature
can be quite handy. If your multimeter has a diode check function, read the manual to
find out exactly how it works.
Advanced multimeters might have other functions, such as the ability to measure and
identify other electrical components, like transistors or capacitors. Since not all
multimeters have these features, we will not cover them in this tutorial. You can read
your multimeter's manual if you need to use these features.
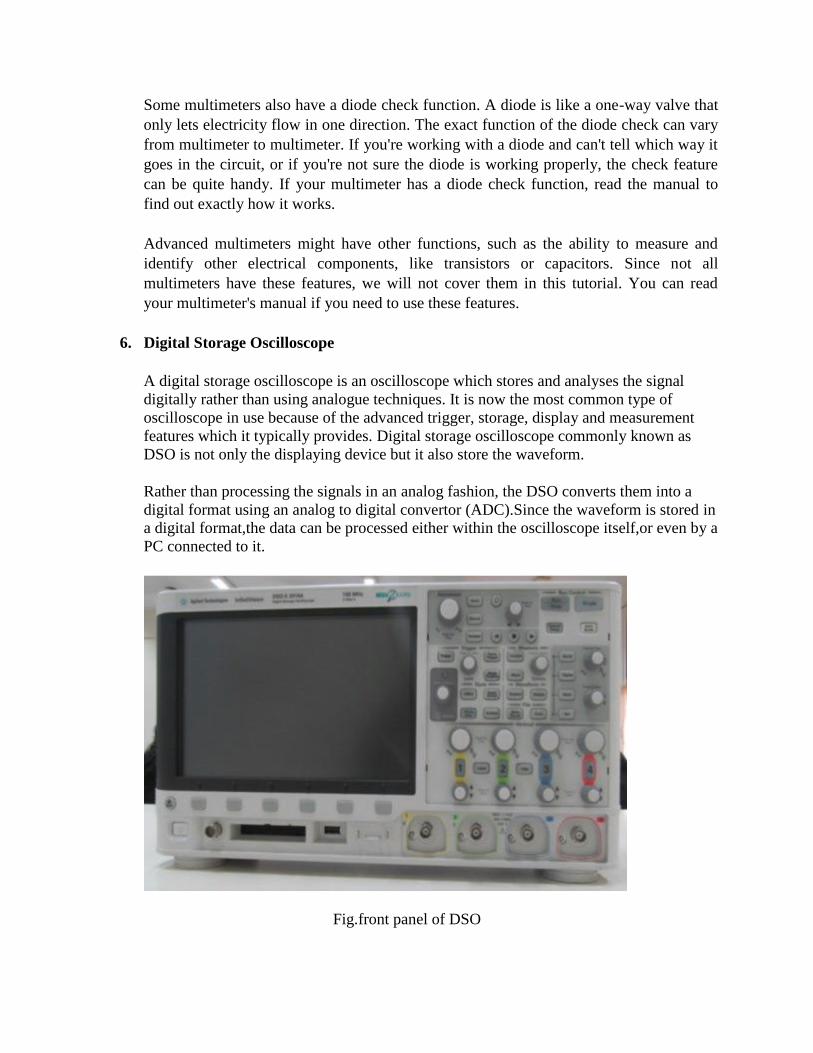
6. Digital Storage Oscilloscope
A digital storage oscilloscope is an oscilloscope which stores and analyses the signal
digitally rather than using analogue techniques. It is now the most common type of
oscilloscope in use because of the advanced trigger, storage, display and measurement
features which it typically provides. Digital storage oscilloscope commonly known as
DSO is not only the displaying device but it also store the waveform.
Rather than processing the signals in an analog fashion, the DSO converts them into a
digital format using an analog to digital convertor (ADC).Since the waveform is stored in
a digital format,the data can be processed either within the oscilloscope itself,or even by a
PC connected to it.
Fig.front panel of DSO

Controls
Vertical controls:
CH 1, CH 2, CH 3 & CH 4 MENU: Displays the vertical menu selections which move
the waveform vertically.
VOLTS/DIV (CH 1, CH 2, CH 3 & CH 4): Selects vertical scale factors.
Horizontal controls:
POSITION: Adjust the horizontal position of waveform. The resolution of horizontal
control is a time function.
HORIZ MENU: Sets the horizontal position to zero.
SEC/DIV: Selects the horizontal time/div(scale factor) which set the horizontal gain
Trigger controls:
The trigger determines at what time should Oscilloscope starts to acquire data and to a display a
waveform. The trigger must set properly other wise the wave form display is not stable and some
times the screen goes blank due to synchronization of trigger pulse.
Run and stop button
Run button: With the help run and stop button the experimenter can stop the wave which
enhance the accuracy of fluctuating wave.
Auto scale key:This button is used to automatic adjustment of waveform on display panel of
DSO.
Digital storage oscilloscope is employed to measure:
Voltage of the applied signal,
Frequency of the applied signal,
Time period of applied signal,
Amplitude of applied signal,
Average RMS value of applied signal, &
Duty cycle of applied signal.
Observations
Various troubleshooting tools and its procedures have been familiarised.
Result

Understood various troubleshooting tools and its procedures have been verified .
Inference:
Electronic testing equipment are used in the laboratory for testing and troubleshooting the
electronic components and circuitry.

Experiment No. 1.3
TROUBLE SHOOT FAULT BY CIRCUIT TRACING
Aim: To familiarize with trouble shooting procedure.
Objectives: After completion of this experiment student will be able to trace, find and rectify
fault in electronic circuit and board.
Equipment/Components:
Sl no Name and Specification Quantity required
1 Line continuity tester 1
2 Digital multimeter 1
3 CRO/DSO 1
4 PCB 1
5 Soldering Station 1
Theory:
Troubleshooting is the process of tracing and rectifying faults in electric/electronics circuit. If
there is a problem in electric circuit then possible causes may be;
1. Open Circuit - A connection may be broken i.e. open circuited. This fault can be traced with
continuity test.
2. Short Circuit - A connection that may be closed is called short circuited. This leads to flow of
excessive current in circuit resulting in the damage of components. Short circuit problems are
normally caused by weak/damaged insulation which can be detected by insulation test.
To troubleshoot a circuit for fault, all following things should be checked.
• Channel resistance
• Potential difference between two points
• Flow of current
Guide to electrical troubleshooting using schematics and meter
• Check supply input voltage
• Check the voltage at different test points on PCB

• Check all protection devices are operating as they should be
Generally an electrical circuit has two main sections namely as follows:
1. Power circuit
2. Control circuit
Check List for Power Circuit
So first we will check that power supply circuit is properly delivering power. Things that should
be checked for power supply circuit are listed below.
• Check input voltage
• Check protection devices are functional
• Check channel resistance
• Check that all the components are physically OK and not damaged by excessive heat
Check List for Control Circuit
• Input voltage to control circuit
• Relays, switches and timers health
• Cable continuity
• Check contact switches are logically operating
• Timing of switching circuit
Continuity Test
Continuity of circuit can be checked by two ways
1. Dead continuity test
2. Power ON continuity test
Dead continuity test: The continuity is checked while keeping power off. This reduces the risk of
any shock to person performing the test. Similarly insulation test is performed. To check the
circuit continuity while power is off, the multi-meter knob is set on beep sound. The beep
confirms that electrical path is complete. If path is discontinuous then there will be no beep.
Sometime an LED can also be used for visual confirmation
Procedure:
1. Draw the circuit by tracing the given board starting from the higher order component.
Which means locate the major components first like IC or transistors present in the circuit
and connect them with the lower order components.
2.In a system with identical or parallel subsystems, swap components between those subsystems
and see whether or not the problem moves with the swapped component. If it does, you‟ve just
swapped the faulty component; if it doesn‟t, keep searching!
This is a powerful troubleshooting method, because it gives you both a positive and a negative
indication of the swapped component‟s fault: when the bad part is exchanged between identical
systems, the formerly broken subsystem will start working again and the formerly good
subsystem will fail.
3.If a system is composed of several parallel or redundant components which can be removed
without crippling the whole system, start removing these components (one at a time) and see if
things start to work again.
4.In a system with multiple sections or stages, carefully measure the variables going in and out of
each stage until you find a stage where things don‟t look right.
5.Closely related to the strategy of dividing a system into sections, this is actually a design and
fabrication technique useful for new circuits, machines, or systems. It‟s always easier begin the
design and construction process in little steps, leading to larger and larger steps, rather than to
build the whole thing at once and try to troubleshoot it as a whole.
6.Set up instrumentation (such as a datalogger, chart recorder, or multimeter set on “record”
mode) to monitor a signal over a period of time. This is especially helpful when tracking down
intermittent problems, which have a way of showing up the moment you‟ve turned your back
and walked away.
Observations:
Fault has been identified by tracing the circuit.
Result:
Understood various trouble shooting methods by circuit tracing.
Inference:
Circuit tracing can identify the fault in a circuit and can trouble shoot it there by the machineries
can be repaired.

Experiment No. 1.4
TROUBLESHOOTING OF ECG RECORDER
Aim: To trouble shoot ECG Recorder.
Objectives: After completion of this experiment student will be able to understand various
troubleshooting method related to an ECG Recorder.
Equipment/Components:
Sl no Name and Specification Quantity required
1 ECG Recorder 1
2 Digital multimeter 1
3 CRO/DSO 1
4 ECG simulator 1
5 Soldering Station 1
Theory:
The electrocardiogram (ECG) is a graphical record of electric potentials generated by the heart
muscle during each cardiac cycle. These potentials are detected on the surface of the body using
electrodes attached to the extremities and chest wall, and are then amplified by the
electrocardiograph machine and displayed on special graph paper. ECG Machine consists of the
ECG unit, electrodes, and cables. The 12-lead system includes three different types of leads:
bipolar, augmented and unipolar. Each of the 12 standard leads presents a different perspective
of the heart‟s electrical activity; producing ECG waveforms in which the P waves, QRS
complex, and T waves vary in amplitude and polarity. Single-channel ECGs record the electric
signals from only one lead configuration at a time, although they may receive electric signals
from as many as 12 leads. Non interpretive multichannel electrocardiographs only record the
electric signals from the electrodes (leads) and do not use any internal procedure for their
interpretation. Interpretive multichannel electrocardiographs acquire and analyse the electrical
signals

Procedure:
1. Sketch the front and back panel of the given machine.
2. Common fault found on Battery charging and power supply circuit
Indication Possible causes Check points
Battery charging
indicator not lit.
Power supply not ok.
Cable between main & key
PCB is faulty.
Check the battery charger adaptor.
Check the cable harness
Battery does not get
charged.
Battery is faulty or end of
battery life cycle
Battery charging current is not
ok.
Check battery is leaky or swollen.
Check if battery current is as per the
design
Unit does not switch
ON.
Battery protection fuse burnt
out.
Microcontroller not
functioning.
ON / OFF circuit is not ok.
Check the fuse & check for any
overloading in the path.
Check for the presence of supply
voltages
Check if the reset circuit of the
controller is ok.
Check the cable between main & key
PCB.
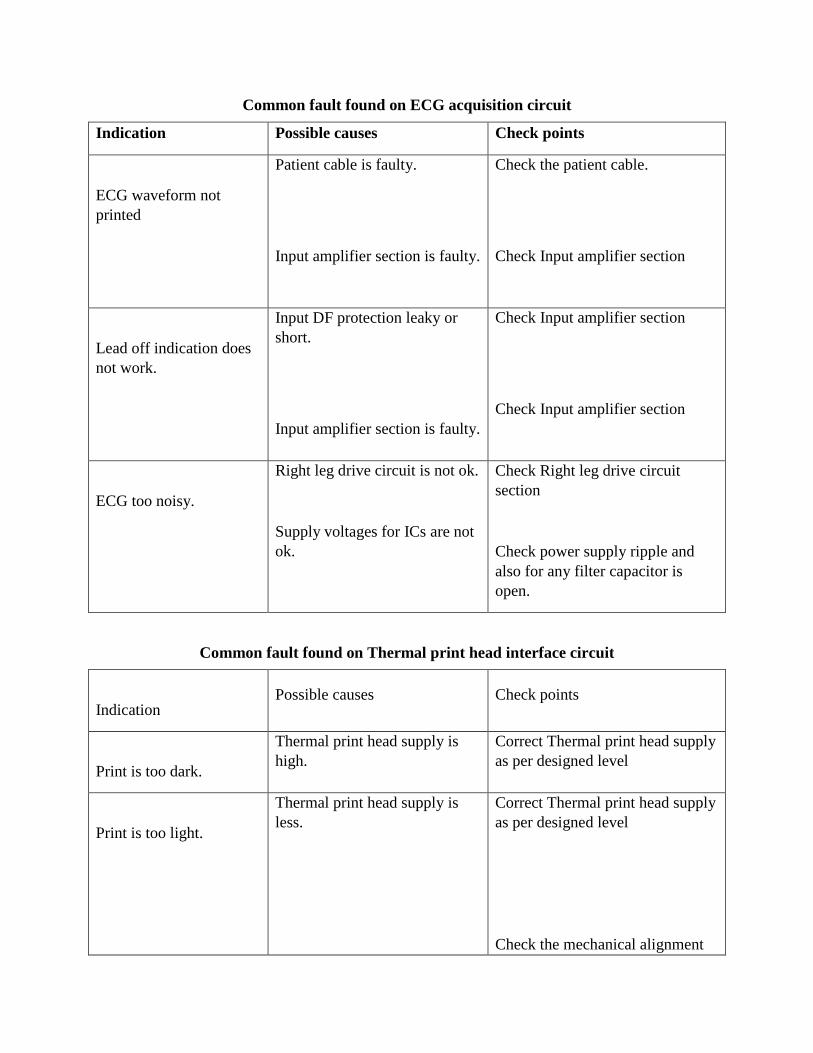
Common fault found on ECG acquisition circuit
Indication Possible causes Check points
ECG waveform not
printed
Patient cable is faulty.
Input amplifier section is faulty.
Check the patient cable.
Check Input amplifier section
Lead off indication does
not work.
Input DF protection leaky or
short.
Input amplifier section is faulty.
Check Input amplifier section
Check Input amplifier section
ECG too noisy.
Right leg drive circuit is not ok.
Supply voltages for ICs are not
ok.
Check Right leg drive circuit
section
Check power supply ripple and
also for any filter capacitor is
open.
Common fault found on Thermal print head interface circuit
Indication Possible causes Check points
Print is too dark.
Thermal print head supply is
high.
Correct Thermal print head supply
as per designed level
Print is too light.
Thermal print head supply is
less.
Correct Thermal print head supply
as per designed level
Check the mechanical alignment

Thermal print head assembly,
not ok.
Fault in the cable assembly.
Thermal head has failed.
of thermal head assembly
Check whether the paper transport
roller is eccentric.
Check the cable assembly.
If all the signals and above points
are ok, then replace the thermal
head.
Print is discontinuous or
the print quality is not ok
across the entire width or
length of the paper.
Fault in cable harness
Mechanical alignment is not ok.
Some elements of thermal print
head have failed.
Check the cable assembly.
Check the alignment of thermal
head, gear mechanism and roller
in the lid.
If supply voltage and signals are
ok at the print head then replace it.
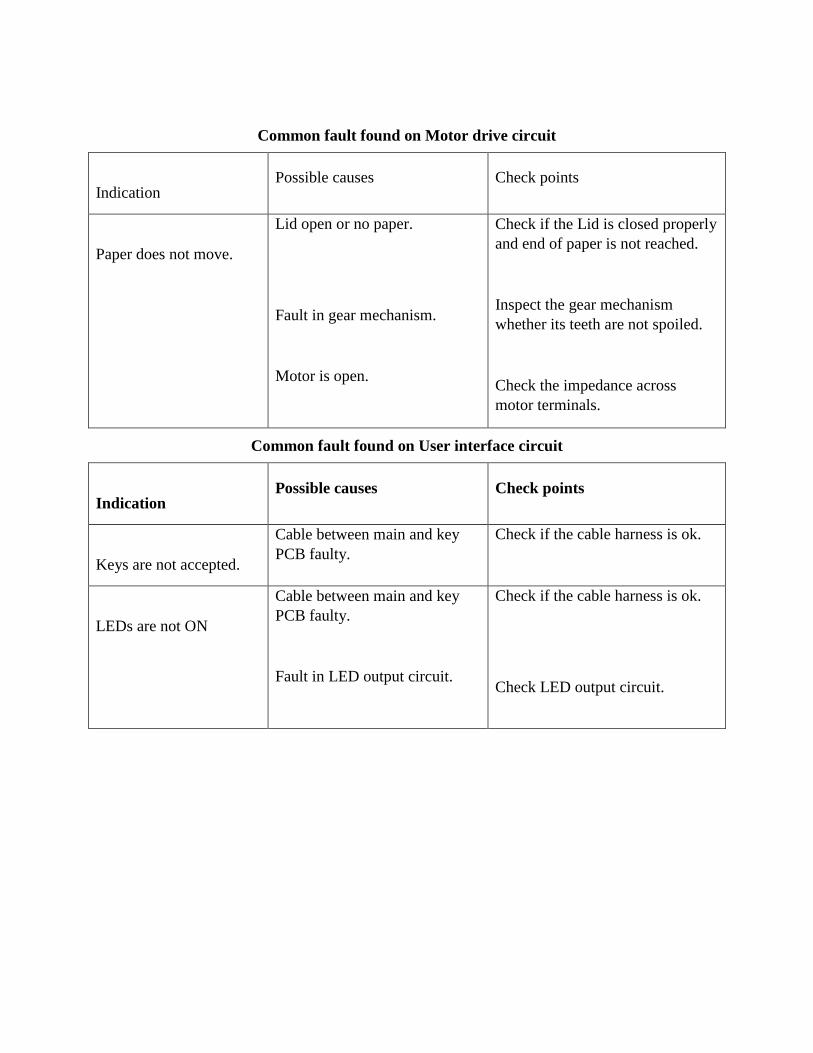
Common fault found on Motor drive circuit
Indication Possible causes Check points
Paper does not move.
Lid open or no paper.
Fault in gear mechanism.
Motor is open.
Check if the Lid is closed properly
and end of paper is not reached.
Inspect the gear mechanism
whether its teeth are not spoiled.
Check the impedance across
motor terminals.
Common fault found on User interface circuit
Indication Possible causes Check points
Keys are not accepted.
Cable between main and key
PCB faulty.
Check if the cable harness is ok.
LEDs are not ON
Cable between main and key
PCB faulty.
Fault in LED output circuit.
Check if the cable harness is ok.
Check LED output circuit.

Block Diagram
Observation:
After rectifying above mentioned problems if any, restart the machine and perform one complete
ECG recording as per the designer recommendation which is specified in the user manual, and
make sure that the problem fixed.
Result:
Understood various troubleshooting technics related ECG Recorder, and rectified the problem.
Inference:
ECG is powerful diagnostic tool in field of health care and is used in the hospitals for diagnosing
the cardiac disorders.
Experiment No. 1.5
TROUBLESHOOTING OF pH METER
Aim: To study the servicing and maintenance of pH meter.
Objectives: After completion of this experiment student will be able to understand various
problems and troubleshooting method related to a pH meter.
Equipment/Components:
Sl no Name and Specification Quantity required
1 pH meter 1
2 User manual 1
3 Digital multimeter 1
4 Soldering Station 1
Theory:
If two solutions are separated by pH glass, an electrical potential will be developed across the
membrane .If the solution inside the bulb contains hydrogen ion concentration, the membrane
potential will change as the hydrogen ion concentration, of the other solution varies. If electrical
connections are made to these solutions inside the glass by the pH electrode„s internal element
and outside the glass by a “reference electrode”, the membrane potential can be measured by a
high impedance voltmeter. When two electrodes (glass and reference) are sloped in a solution
they generate e.m.f which is proportional to the pH of that solution. The magnitude of e.m.f is
proportional to the magnitude of the solution. The e.m.f is also dependent on temperature. The
pH sensitive surface is glass. Hence the internal resistance of the e.m.f generating combination is
very high. The gain of amplifier is adjusted by temperature control for temperature
compensation.
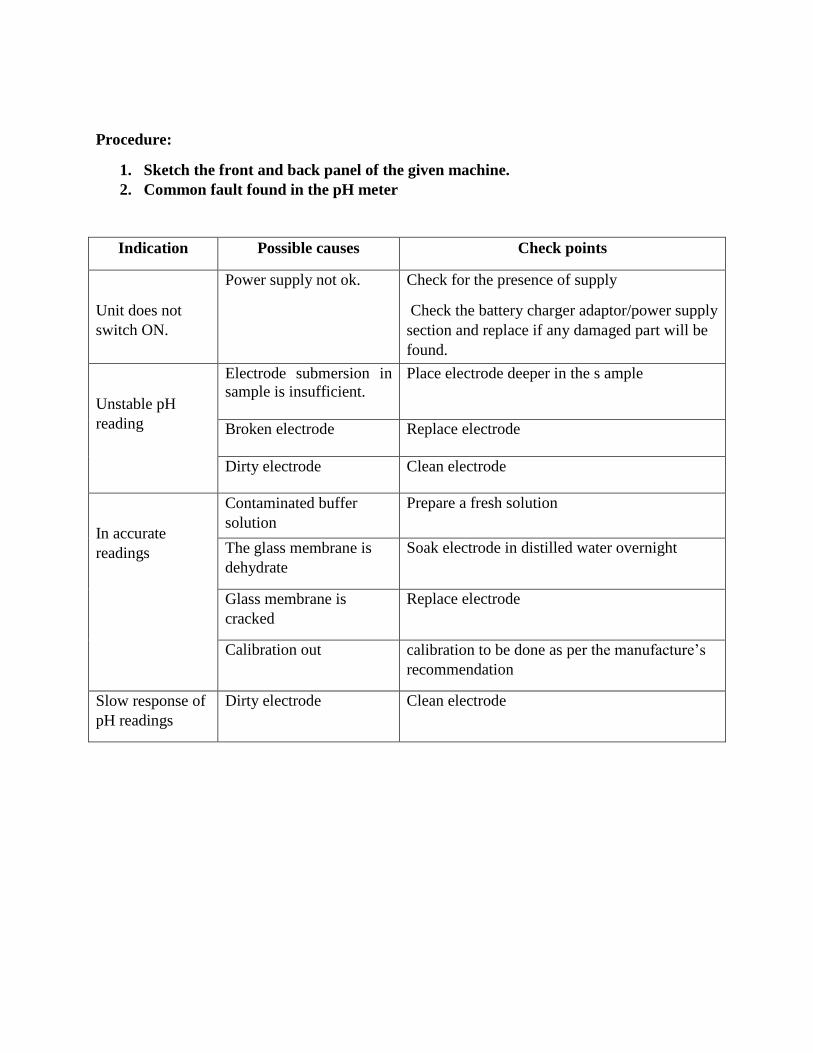
Procedure:
1. Sketch the front and back panel of the given machine.
2. Common fault found in the pH meter
Indication Possible causes Check points
Unit does not
switch ON.
Power supply not ok.
Check for the presence of supply
Check the battery charger adaptor/power supply
section and replace if any damaged part will be
found.
Unstable pH
reading
Electrode submersion in
sample is insufficient.
Place electrode deeper in the s ample
Broken electrode
Replace electrode
Dirty electrode Clean electrode
In accurate
readings
Contaminated buffer
solution
Prepare a fresh solution
The glass membrane is
dehydrate
Soak electrode in distilled water overnight
Glass membrane is
cracked
Replace electrode
Calibration out calibration to be done as per the manufacture‟s
recommendation
Slow response of
pH readings
Dirty electrode Clean electrode
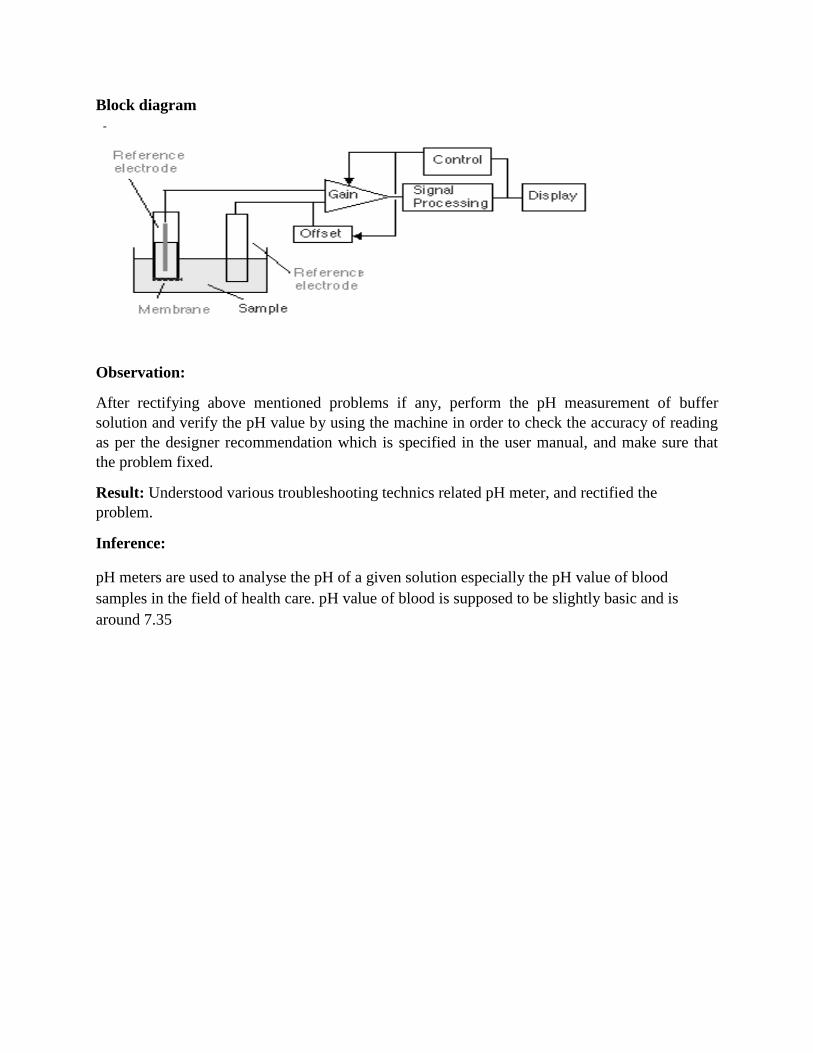
Block diagram
Observation:
After rectifying above mentioned problems if any, perform the pH measurement of buffer
solution and verify the pH value by using the machine in order to check the accuracy of reading
as per the designer recommendation which is specified in the user manual, and make sure that
the problem fixed.
Result: Understood various troubleshooting technics related pH meter, and rectified the
problem.
Inference:
pH meters are used to analyse the pH of a given solution especially the pH value of blood
samples in the field of health care. pH value of blood is supposed to be slightly basic and is
around 7.35

Experiment No. 1.6
TROUBLESHOOTING OF COLORIMETER
Aim: To study service and maintenance of colorimeter.
Objectives: After completion of this experiment student will be able to understand various
troubleshooting method related to a colorimeter.
Equipment/Components:
Sl no Name and Specification Quantity required
1 Colorimeter 1
2 User manual 1
3 Digital multimeter 1
4 Soldering Station 1
Theory:colorimeter is a device used in colorimetry. The device that measures the absorbance of
particular wavelengths of light by a specific solution. This device is most commonly used to
determine the concentration of a known solute in a given solution by the application of the Beer-
Lambert law, which states that the concentration of a solute is proportional to the absorbance.
measurement of the wavelength and the intensity of electromagnetic radiation in the visible
region of the spectrum. It is used extensively for identification and determination of
concentrations of substances that absorb light. Two fundamental laws are applied: that of a
French scientist, Pierre Bouguer, which is also known as Lambert‟s law, relates the amount of
light absorbed and the distance it travels through an absorbing medium; and Beer‟s law relates
light absorption and the concentration of the absorbing substance. The two laws may be
combined and expressed by the equation log I0/I = kcd, where I0 = intensity of the incident beam
of light, I = transmitted intensity, c = the concentration of absorbing substance, d = the distance
through the absorbing solution, and k = a constant, dependent upon the absorbing substance, the
wavelength of light used, and the units used to specify c and d.
Procedure:
1. Sketch the front and back panel of the given machine.
2. common fault found in the colorimeter
Indication Possible causes Check points
Unit does not switch ON.
Power supply not
ok.
Check for the presence of supply
Check the battery charger
adaptor/power supply section and
replace if any damaged part will be
found.
Insufficient sensitivity to bring
display to Zero optical density
with „Blank solution‟
Faulty LED Place the LED
Faulty photocell Replace the photo cell
Inconsistent readings
Faulty or loose
contacts in LED or
photocell
Inspect for any loose contact and change
LED, if necessary.
In accurate readings Sampling procedure
may be wrong
Check the sampling procedure
Calibration out Calibration to be done as per the
manufacture‟s recommendation
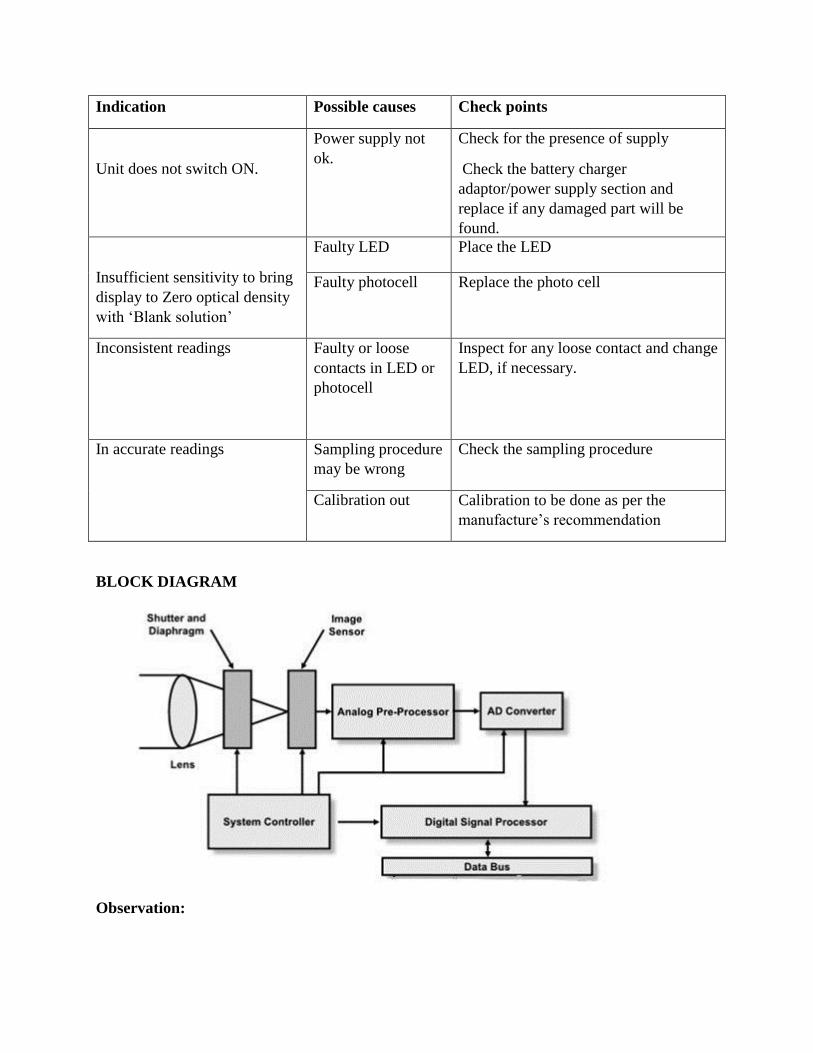
BLOCK DIAGRAM
Observation:

After rectifying above mentioned problems if any, perform the measurement of known solution
and verify the optical density value by using the machine in order to check the accuracy of
reading as per the designer recommendation which is specified in the user manual, and make
sure that the problem fixed.
Result:
Studied the service and maintenance of colorimeter.
Inference:
Colorimeter is a highly stable& accurate ideal clinical instruments for blood & chemical analysis
and is used in medical laboratories.

Experiment No. 1.7
TROUBLESHOOTING OF HAEMOGLOBIN METER
Aim:To study the servicing and maintenance of Haemoglobin meter.
Objectives: After completion of this experiment student will be able to understand various
troubleshooting method related to Haemoglobin meter.
Equipment/Components:
Sl no Name and Specification Quantity required
1 Haemoglobin meter 1
2 User manual 1
3 Digital multimeter 1
4 Soldering Station 1
Theory:
The meter uses a photometric method to determine the haemoglobin concentration in the
sample.Using state of the art L.E.D. technology the meter produces three distinct wavelengths of
light each of which is projected through the sample and measured by a sensitive photovoltaic
cell.
A microprocessor compares these values against stored measurements obtained from a reference
cuvette during the zero/calibration procedure and calculates the percentage transmission at each
wavelength. These are used in a mathematical model to determine the haemoglobin
concentration. This is then displayed on the screen.
Procedure:
1. Sketch the front and back panel of the given machine
2. Common fault found in the haemoglobin meter
Indication Possible causes Check points
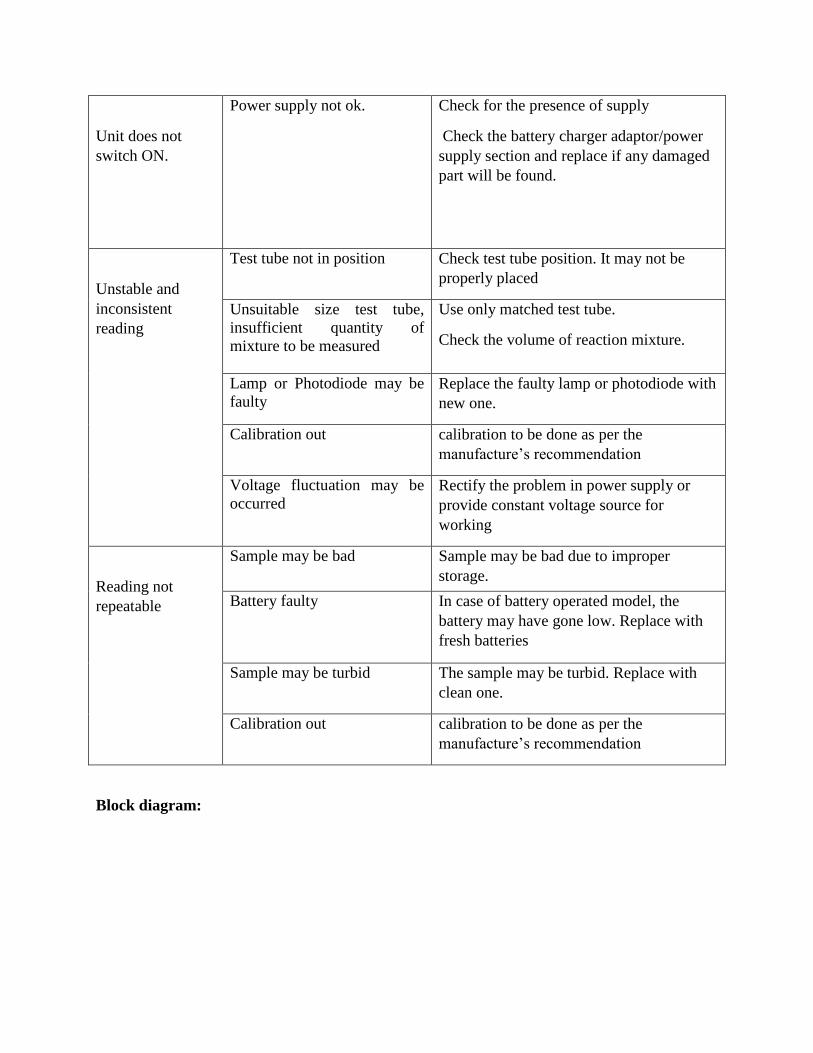
Unit does not
switch ON.
Power supply not ok.
Check for the presence of supply
Check the battery charger adaptor/power
supply section and replace if any damaged
part will be found.
Unstable and
inconsistent
reading
Test tube not in position
Check test tube position. It may not be
properly placed
Unsuitable size test tube,
insufficient quantity of
mixture to be measured
Use only matched test tube.
Check the volume of reaction mixture.
Lamp or Photodiode may be
faulty
Replace the faulty lamp or photodiode with
new one.
Calibration out calibration to be done as per the
manufacture‟s recommendation
Voltage fluctuation may be
occurred
Rectify the problem in power supply or
provide constant voltage source for
working
Reading not
repeatable
Sample may be bad Sample may be bad due to improper
storage.
Pipette may not be properly calibrated Battery faulty In case of battery operated model, the
battery may have gone low. Replace with
fresh batteries
Sample may be turbid The sample may be turbid. Replace with
clean one.
Calibration out calibration to be done as per the
manufacture‟s recommendation
Block diagram:
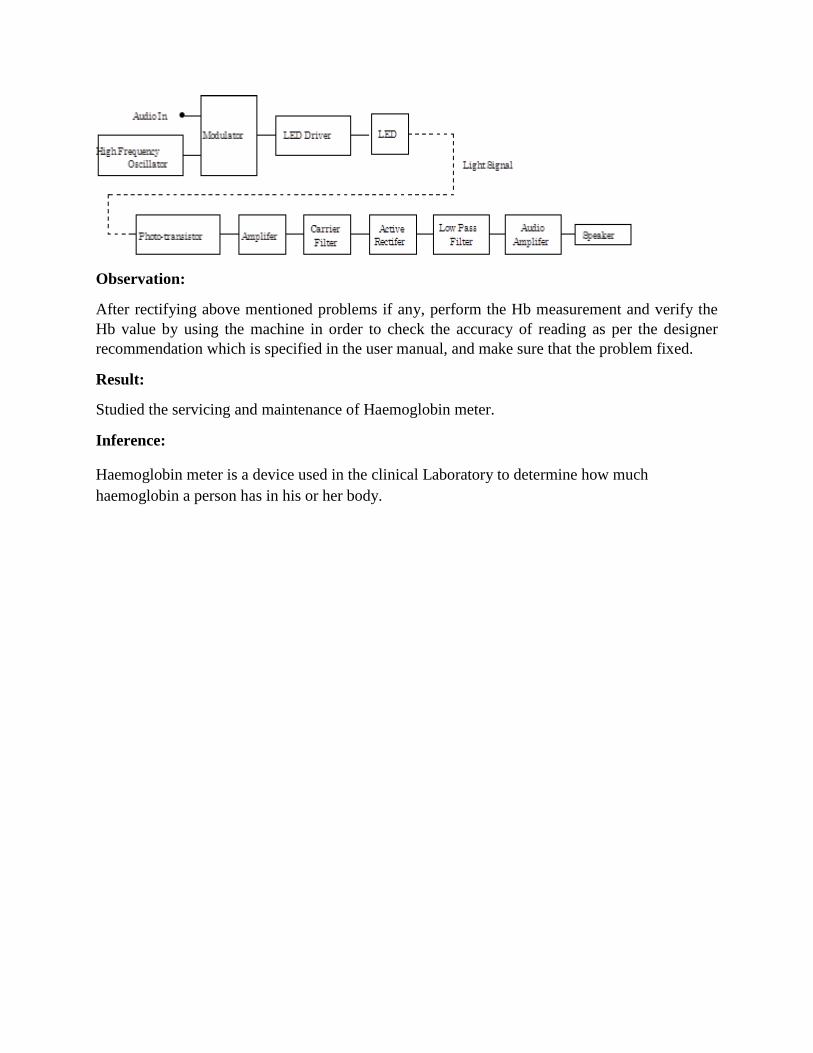
Observation:
After rectifying above mentioned problems if any, perform the Hb measurement and verify the
Hb value by using the machine in order to check the accuracy of reading as per the designer
recommendation which is specified in the user manual, and make sure that the problem fixed.
Result:
Studied the servicing and maintenance of Haemoglobin meter.
Inference:
Haemoglobin meter is a device used in the clinical Laboratory to determine how much
haemoglobin a person has in his or her body.

Experiment No. 1.8
TROUBLESHOOTING OF PULSE OXIMETER
Aim: To study the service and maintenance of pulse oximeter.
Objectives: After completion of this experiment student will be able to understand various
problems and troubleshooting method related to pulse oximeter.
Equipment/Components:
Sl no Name and Specification Quantity required
1 Pulseoximeter 1
2 User manual 1
3 Digital multimeter 1
4 CRO/DSO 1
5 Soldering Station 1
Theory:
Pulse Oximeter is a non-invasive medical diagnostic device used to detect the oxygen saturation
of the blood. Heart rate meter detects the number of beats per minute of the patient, normally
referred to as bpm. The pulse oximeter is designed using an infrared and a red LED, projected
alternatively on the finger and detection of the transmitted light by a photodiode/phototransistor.
The output of the photodiode is given to a trans impedance amplifier, and further amplified and
filtered before giving to the microcontroller. The ADC in the microcontroller will convert it into
digital form, and later display the value of SpO2 and heart rate on a LCD screen
The oxygen saturation of the blood can quickly and accurately be monitored non-invasively
using pulse oximeter. Pulse oximeter works on the principal of absorption and
reflectance/transmittance of light by multiple components like skin, muscle and blood vessel.
Absorption due to tissue, skin or muscle remains fairly constant, whereas absorption due to
arterial blood varies. Arteries expand due to the pumping of the heart, expanding the arteries and
inturn increasing the tissue between the LEDs and the photodiode, thus increasing the light
absorption. Using this principle, heart rate can be detected. Absorption of oxyhaemoglobin and
the deoxygenated haemoglobin form differs significantly with wavelengths (i.e.) oxygen is
transported in the blood by haemoglobin, and, depending on the binding of oxygen to the
haemoglobin, absorption of light takes place at two wavelengths as shown below
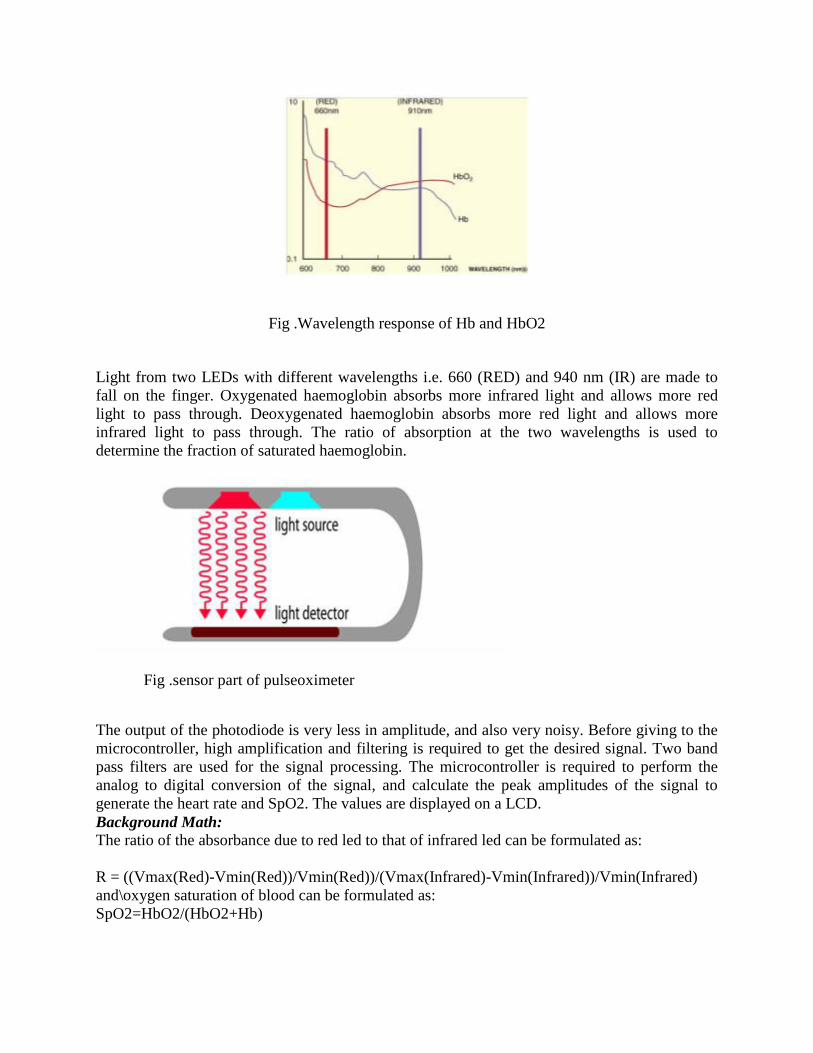
Fig .Wavelength response of Hb and HbO2
Light from two LEDs with different wavelengths i.e. 660 (RED) and 940 nm (IR) are made to
fall on the finger. Oxygenated haemoglobin absorbs more infrared light and allows more red
light to pass through. Deoxygenated haemoglobin absorbs more red light and allows more
infrared light to pass through. The ratio of absorption at the two wavelengths is used to
determine the fraction of saturated haemoglobin.
Fig .sensor part of pulseoximeter
The output of the photodiode is very less in amplitude, and also very noisy. Before giving to the
microcontroller, high amplification and filtering is required to get the desired signal. Two band
pass filters are used for the signal processing. The microcontroller is required to perform the
analog to digital conversion of the signal, and calculate the peak amplitudes of the signal to
generate the heart rate and SpO2. The values are displayed on a LCD.
Background Math:
The ratio of the absorbance due to red led to that of infrared led can be formulated as:
R = ((Vmax(Red)-Vmin(Red))/Vmin(Red))/(Vmax(Infrared)-Vmin(Infrared))/Vmin(Infrared)
and\oxygen saturation of blood can be formulated as:
SpO2=HbO2/(HbO2+Hb)

Procedure:
1. Sketch the front and back panel of the given machine
2. Common fault found on Battery charging and power supply circuit
Indication Possible causes Check points/ Corrective Action
Battery charging
indicator not lit.
Power supply not ok.
Cable between main & key
PCB is faulty.
Check the battery charger adaptor.
Check the cable harness
Battery does not get
charged.
Battery is faulty or end of
battery life cycle
Battery charging current is not
ok.
Check battery is leaky or swollen.
Check if battery current is as per the
design
Unit does not switch
ON.
Battery protection fuse burnt
out.
Microcontroller not
functioning.
ON / OFF circuit is not ok.
Check the fuse & check for any
overloading in the path.
Check for the presence of supply
voltages
Check if the reset circuit of the
controller is ok.
Check the cable between main & key
PCB.

Common fault found on pulse acquisition circuit
Indication Possible causes Check points/ Corrective Action
Plethysmograph
waveform not printed
Patient cable is faulty.
Input amplifier section is faulty.
ADC reference Voltage change
Module suppy may fail
Check the patient cable.
Check Input amplifier section
Check ADC Reference voltage as
per designer level
Check Module supply
Probe off does not work.
Input amplifier section is faulty
Main board defective
Check Input amplifier section
Check mother board
Plethysmograph
waveform saturated
ADC reference Voltage change.
Spo2 module supply may high.
Check ADC Reference voltage as
per designer level
Check Spo2 module supply
voltage as per designer level

Common fault found on Display Failures
Indication Possible causes Check points/ Corrective Action
Integrated display is
blank
but the patient monitor
still
works correctly.
Cables defective or poorly
connected..
Backlight board Defective
Display defective
Check that cables from the display
to the main
Check that the cables and
connectors are not damaged.
Replace the backlight board.
Replace the display.
Image overlapped or
distorted
Cables defective or poorly
connected.
Main board defective
Check that the cable between the
display and main board is
correctly connected.
Check that the cables and
connectors are not damaged.
Replace the main board.
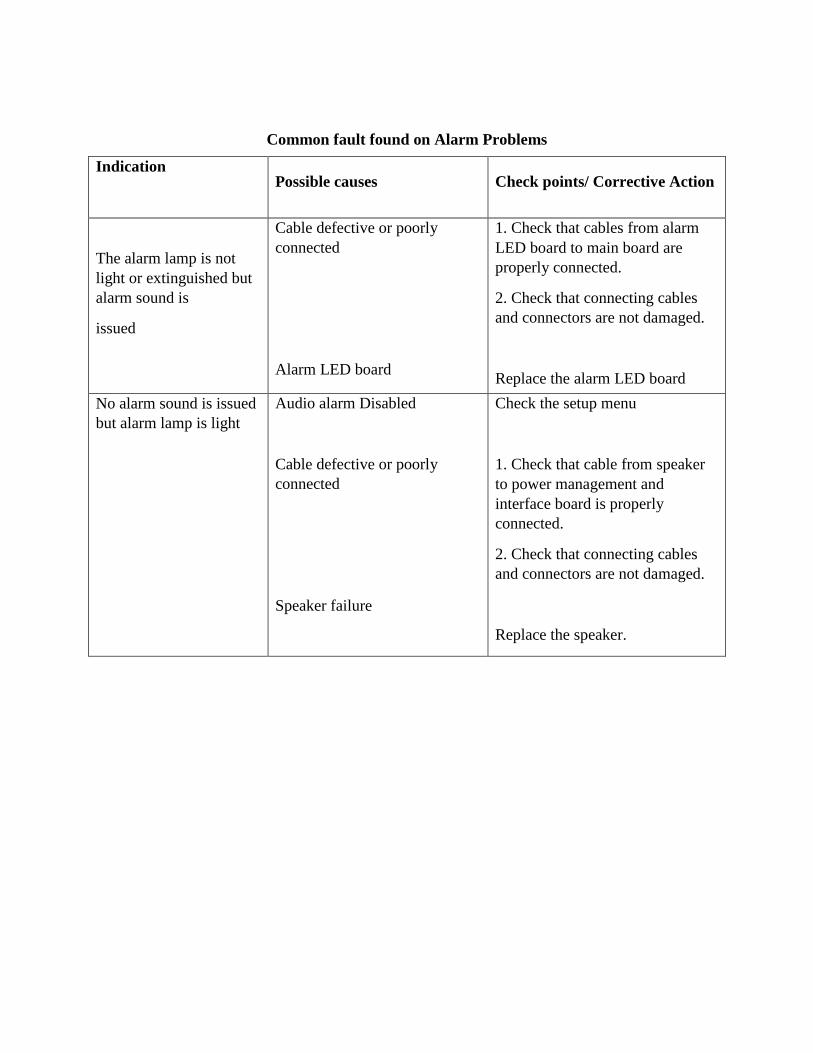
Common fault found on Alarm Problems
Indication
Possible causes Check points/ Corrective Action
The alarm lamp is not
light or extinguished but
alarm sound is
issued
Cable defective or poorly
connected
Alarm LED board
failure
1. Check that cables from alarm
LED board to main board are
properly connected.
2. Check that connecting cables
and connectors are not damaged.
Replace the alarm LED board
No alarm sound is issued
but alarm lamp is light
Audio alarm Disabled
Cable defective or poorly
connected
Speaker failure
Check the setup menu
1. Check that cable from speaker
to power management and
interface board is properly
connected.
2. Check that connecting cables
and connectors are not damaged.
Replace the speaker.
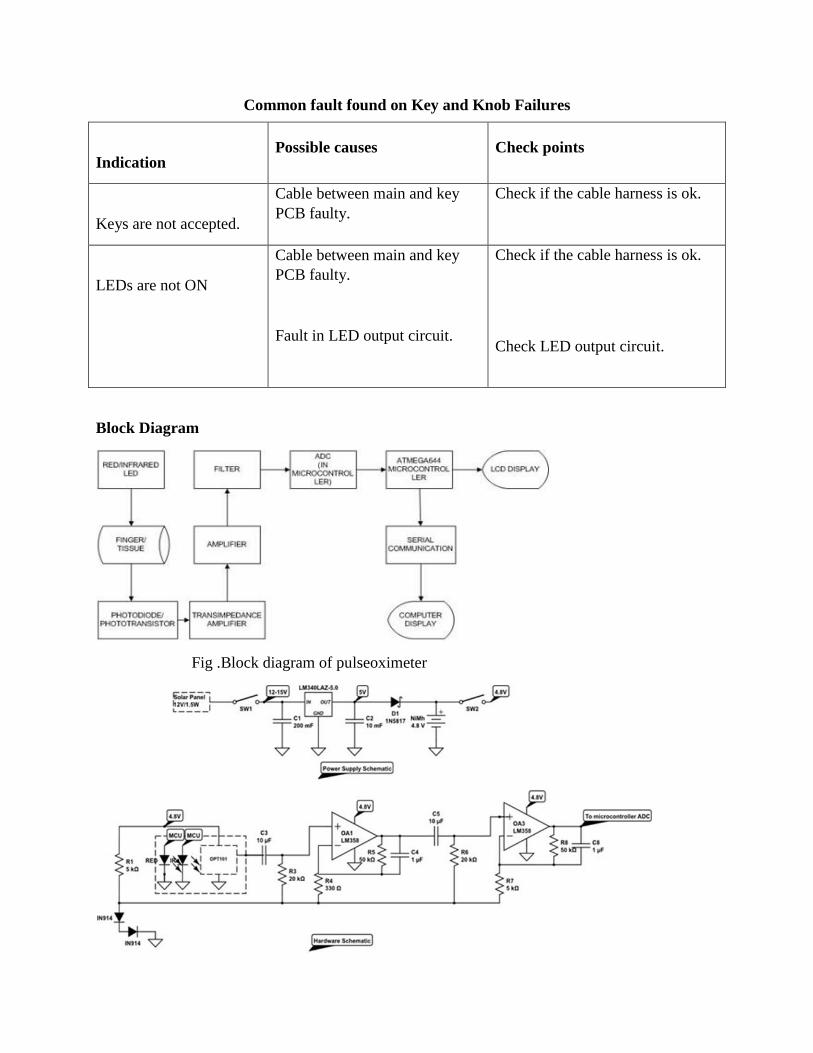
Common fault found on Key and Knob Failures
Indication Possible causes Check points
Keys are not accepted.
Cable between main and key
PCB faulty.
Check if the cable harness is ok.
LEDs are not ON
Cable between main and key
PCB faulty.
Fault in LED output circuit.
Check if the cable harness is ok.
Check LED output circuit.
Block Diagram
Fig .Block diagram of pulseoximeter

Fig .sensing and preamplifier section
Observation:
After rectifying above mentioned problems if any, restart the machine and perform monitoring as
per the designer guideline which is specified in the user manual, and make sure that the problem
fixed.
Result:
Studied the servicing and maintenance of pulseoximeter.
Inference:
Pulseoximeters are used in patient monitoring in the clinic and gives vital parameter about the
concentration of oxygen present in the blood.

Experiment No. 1.9
TROUBLESHOOTING OF DIGITAL BP METER
Aim: To study the serving and maintenance of digital BP meter.
Objectives: After completion of this experiment student will be able to understand various
problems and troubleshooting method related to digital BP meter.
Equipment/Components:
Sl no Name and Specification Quantity required
1 DIGITAL BP meter 1
2 User manual 1
2 Digital multimeter 1
3 CRO/DSO 1
5 Soldering Station 1
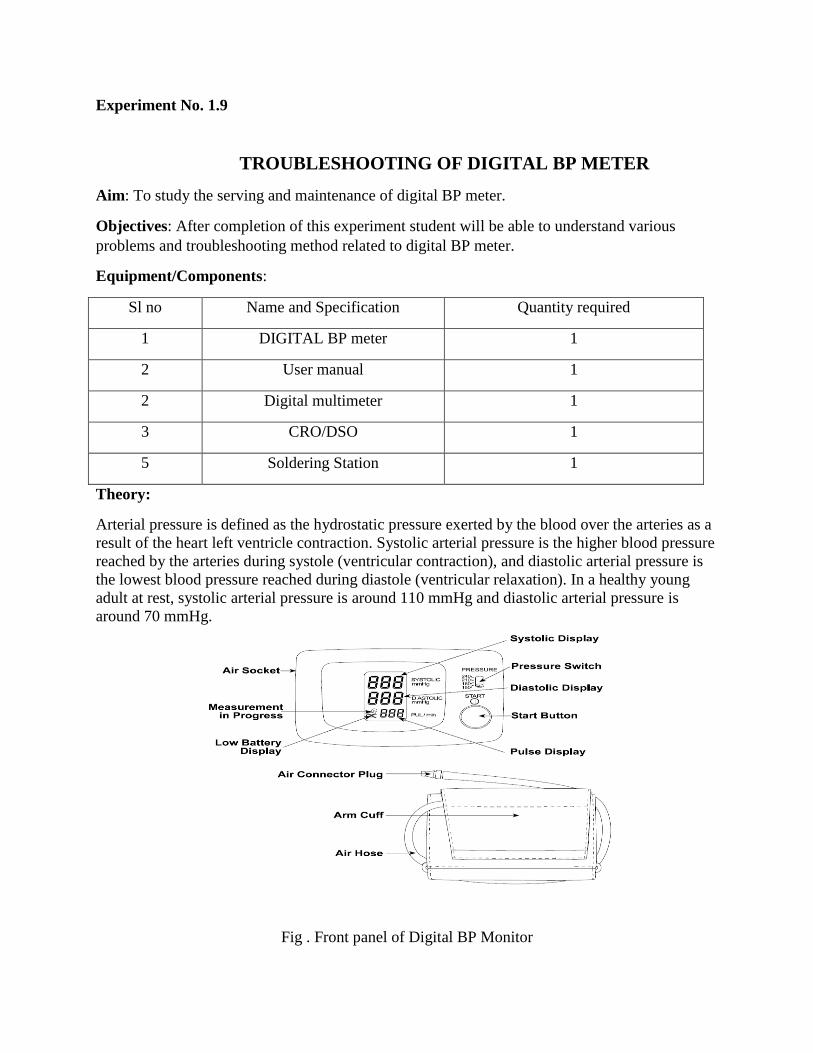
Theory:
Arterial pressure is defined as the hydrostatic pressure exerted by the blood over the arteries as a
result of the heart left ventricle contraction. Systolic arterial pressure is the higher blood pressure
reached by the arteries during systole (ventricular contraction), and diastolic arterial pressure is
the lowest blood pressure reached during diastole (ventricular relaxation). In a healthy young
adult at rest, systolic arterial pressure is around 110 mmHg and diastolic arterial pressure is
around 70 mmHg.
Fig . Front panel of Digital BP Monitor
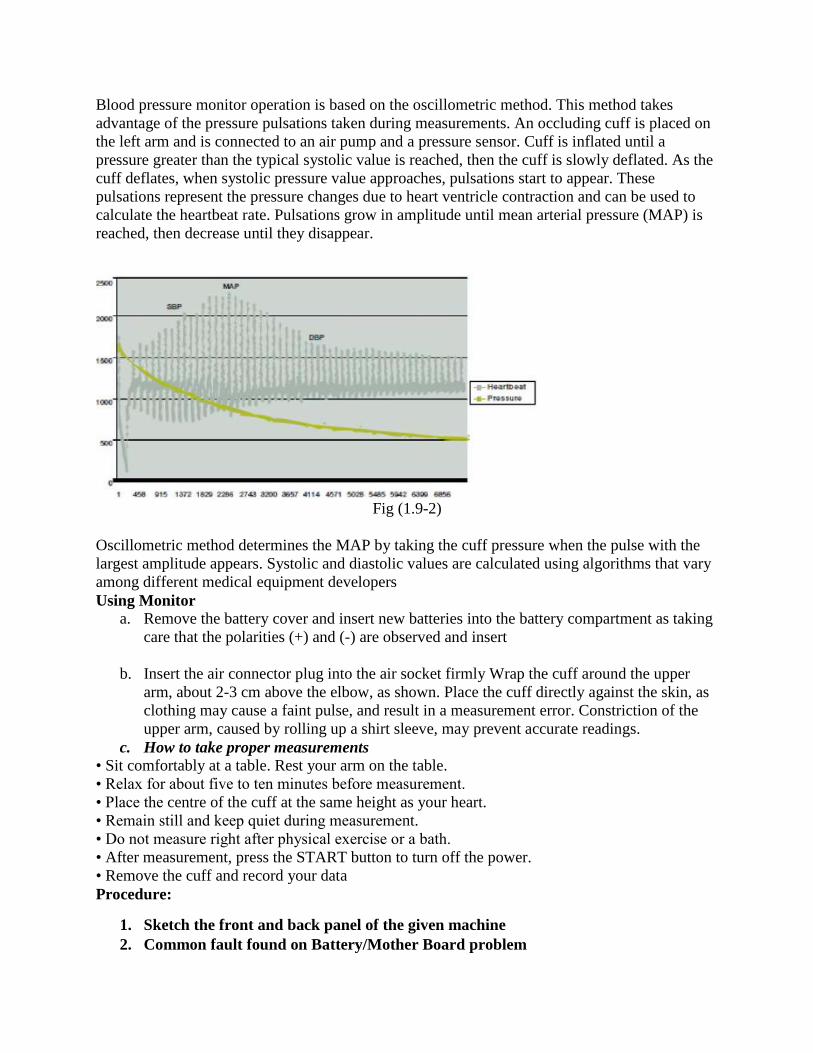
Blood pressure monitor operation is based on the oscillometric method. This method takes
advantage of the pressure pulsations taken during measurements. An occluding cuff is placed on
the left arm and is connected to an air pump and a pressure sensor. Cuff is inflated until a
pressure greater than the typical systolic value is reached, then the cuff is slowly deflated. As the
cuff deflates, when systolic pressure value approaches, pulsations start to appear. These
pulsations represent the pressure changes due to heart ventricle contraction and can be used to
calculate the heartbeat rate. Pulsations grow in amplitude until mean arterial pressure (MAP) is
reached, then decrease until they disappear.
Fig (1.9-2)
Oscillometric method determines the MAP by taking the cuff pressure when the pulse with the
largest amplitude appears. Systolic and diastolic values are calculated using algorithms that vary
among different medical equipment developers
Using Monitor
a. Remove the battery cover and insert new batteries into the battery compartment as taking
care that the polarities (+) and (-) are observed and insert
b. Insert the air connector plug into the air socket firmly Wrap the cuff around the upper
arm, about 2-3 cm above the elbow, as shown. Place the cuff directly against the skin, as
clothing may cause a faint pulse, and result in a measurement error. Constriction of the
upper arm, caused by rolling up a shirt sleeve, may prevent accurate readings.
c. How to take proper measurements
• Sit comfortably at a table. Rest your arm on the table.
• Relax for about five to ten minutes before measurement.
• Place the centre of the cuff at the same height as your heart.
• Remain still and keep quiet during measurement.
• Do not measure right after physical exercise or a bath.
• After measurement, press the START button to turn off the power.
• Remove the cuff and record your data
Procedure:
1. Sketch the front and back panel of the given machine
2. Common fault found on Battery/Mother Board problem
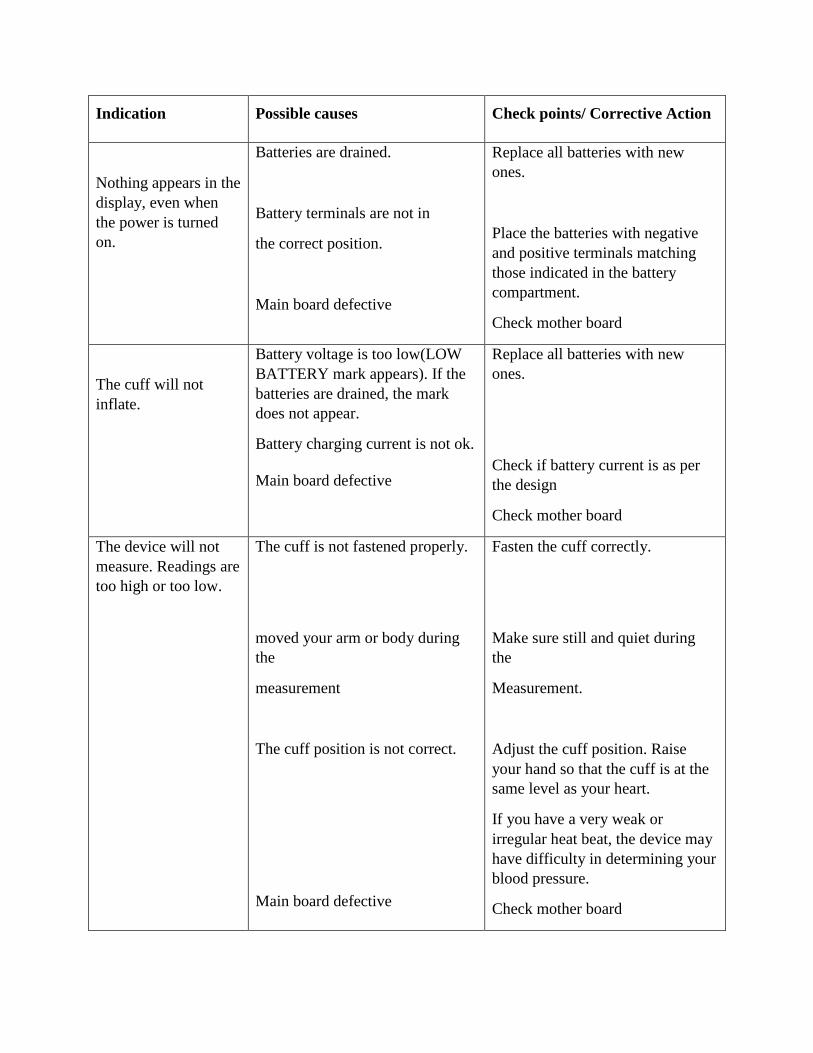
Indication Possible causes Check points/ Corrective Action
Nothing appears in the
display, even when
the power is turned
on.
Batteries are drained.
Battery terminals are not in
the correct position.
Main board defective
Replace all batteries with new
ones.
Place the batteries with negative
and positive terminals matching
those indicated in the battery
compartment.
Check mother board
The cuff will not
inflate.
Battery voltage is too low(LOW
BATTERY mark appears). If the
batteries are drained, the mark
does not appear.
Battery charging current is not ok.
Main board defective
Replace all batteries with new
ones.
Check if battery current is as per
the design
Check mother board
The device will not
measure. Readings are
too high or too low.
The cuff is not fastened properly.
moved your arm or body during
the
measurement
The cuff position is not correct.
Main board defective
Fasten the cuff correctly.
Make sure still and quiet during
the
Measurement.
Adjust the cuff position. Raise
your hand so that the cuff is at the
same level as your heart.
If you have a very weak or
irregular heat beat, the device may
have difficulty in determining your
blood pressure.
Check mother board
Common fault found on display failures
Indication Possible causes Check points/ Corrective Action
Integrated display is
blank
but the patient monitor
still
works correctly.
Cables defective or poorly
connected..
Display defective
Check that cables from the display
to the main
Replace the display.
Block Diagram
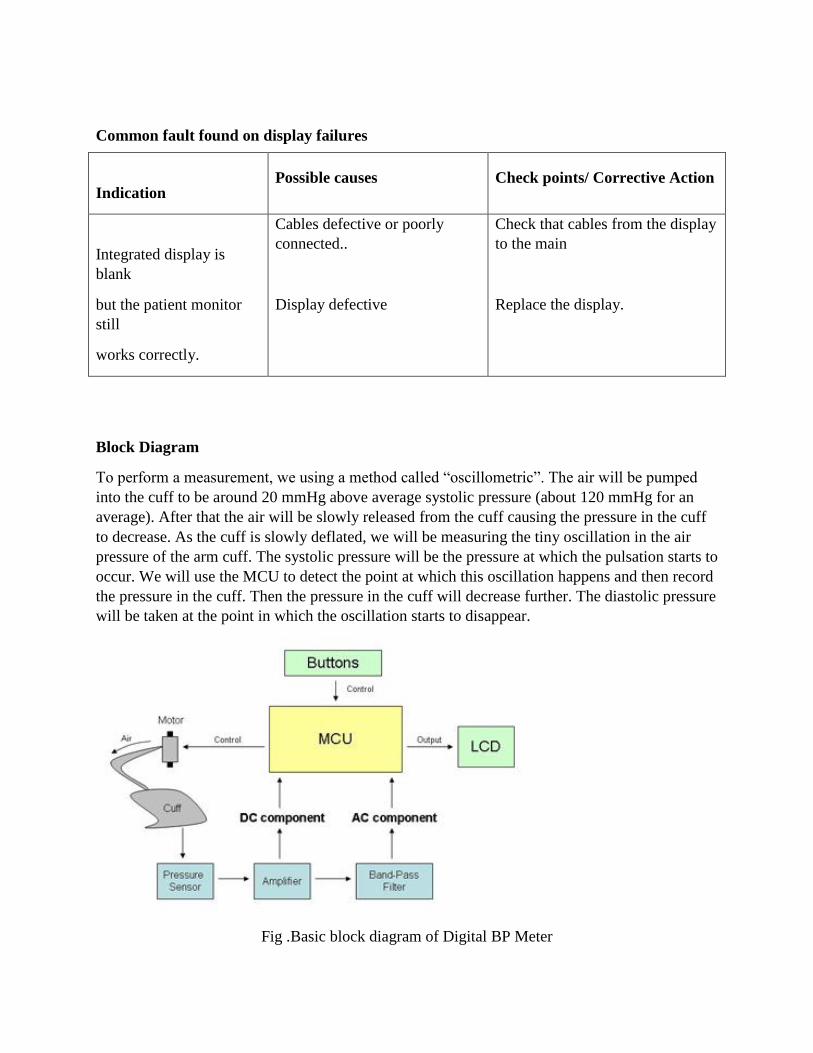
To perform a measurement, we using a method called “oscillometric”. The air will be pumped
into the cuff to be around 20 mmHg above average systolic pressure (about 120 mmHg for an
average). After that the air will be slowly released from the cuff causing the pressure in the cuff
to decrease. As the cuff is slowly deflated, we will be measuring the tiny oscillation in the air
pressure of the arm cuff. The systolic pressure will be the pressure at which the pulsation starts to
occur. We will use the MCU to detect the point at which this oscillation happens and then record
the pressure in the cuff. Then the pressure in the cuff will decrease further. The diastolic pressure
will be taken at the point in which the oscillation starts to disappear.
Fig .Basic block diagram of Digital BP Meter

The diagram above shows how our device is operated. The user will use buttons to control the
operations of the whole system. The MCU is the main component that controls all the operations
such as motor and valve control, A/D conversion, and calculation, until the measurement is
completed. The results then are output through and LCD screen for the user to see.
The analog circuit is used to amplify both the DC and AC components of the output signal of
pressure transducer so that we can use the MCU to process the signal and obtain useful
information about the health of the user. The pressure transducer produces the output voltage
proportional to the applied differential input pressure. The output voltage of the pressure
transducer ranges from 0 to 40 mV. But for our application, we want to pump the arm cuff to
only 160 mmHg (approximately 21.33 kPa). This corresponds to the output voltage of
approximately 18 mV. Thus, we choose to amplify the voltage so that the DC output voltage of
DC amplifier has an output range from 0 to 4V. Thus, we need a gain of approximately 200.
Then the signal from the DC amplifier will be passed on to the band-pass filter. The DC
amplifier amplifies both DC and AC component of the signal (it's just a regular amplifier). The
filter is designed to have large gain at around 1-4 Hz and to attenuate any signal that is out of the
pass band. The AC component from the band-pass filter is the most important factor to determine
when to capture the systolic/diastolic pressures and when to determine the heart rate of the user.
The final stage is the AC coupling stage. We use two identical resistors to provide a DC bias
level at approximately 2.5 volts. The 47 uF capacitor is used to coupling only AC component of
the signal so that we can provide the DC bias level independently
MPX2050 pressure transducer from Motorola to sense the pressure from the arm cuff. The
pressure transducer produces the output voltage proportional to the applied differential input
pressure. We connect the tube from the cuff to one of the inputs and we leave another input open.
By this way, the output voltage will be proportional to the difference between the pressure in the
cuff and the air pressure in the room. The transfer characteristic is shown in figure

Since the output voltage of the pressure transducer is very small, we have to amplify the signal
for further processing. We use the instrumentation amplifier AD620 from Analog Devices. Since
we need the gain of approximately 200, we choose the resistor R G to be 240 ohms.
The band-pass filter stage is designed as a cascade of the two active band-pass filters. The
reason for using two stages is that the overall band-pass stage would provide a large gain and the
frequency response of the filter will have sharper cut off than using only single stage. This
method will improve the signal to noise ratio of the output. The schematics for both filters are
shown in figure
The ac coupling stage is used to provide the DC bias level. We want the DC level of the
waveform to locate at approximately half Vdd, which is 2.5 V. The schematic for AC coupling
stage is shown in figure 4. Given this bias level, it is easier for us to process the AC signal using
the on-chip ADC in the microcontroller.
Observation:
After rectifying above mentioned problems if any, restart the machine and perform monitoring as
per the designer guideline which is specified in the user manual, and make sure that the problem
fixed.
Result:
Understood various troubleshooting technics related digital BP meter, and rectified the problem.
Inference:

Digital BP meters are common instrument found in clinics, hospitals and even with people for
their personal use.

Experiment No. 1.10
TROUBLESHOOTING OF DEFIBRILLATOR
Aim: To study the servicing and maintenance of Defibrillator.
Objectives: After completion of this experiment student will be able to understand various
troubleshooting method related to Defibrillator.
Equipment/Components:
Sl no Name and Specification Quantity required
1 Defibrillator (Monophasic or
Biphasic)
1
2 User manual 1
2 Digital multimeter 1
3 CRO/DSO 1
4 ECG simulator 1
5 Soldering Station 1
Theory:
Defibrillation is a common treatment for life-threatening cardiac dysrhythmias and ventricular
fibrillation. Defibrillation consists of delivering a therapeutic dose of electrical current to the
heart with a device called a defibrillator. This depolarizes a critical mass of the heart muscle,
terminates the dysrhythmia and allows normal sinus rhythm to be reestablished by the body's
natural pacemaker, in the sinoatrial node of the heart.
Most defibrillators are energy-based, meaning that the device charges a capacitor to a
selectedvoltage and then delivers a prespecified amount of energy in joules. The amount
ofenergy which arrives at the myocardium is dependent on the selected voltage and
thetransthoracic impedance (which varies by patient).
Monophasic waveform: Defibrillators with this type of waveform deliver current in onepolarity
and were the first to be introduced
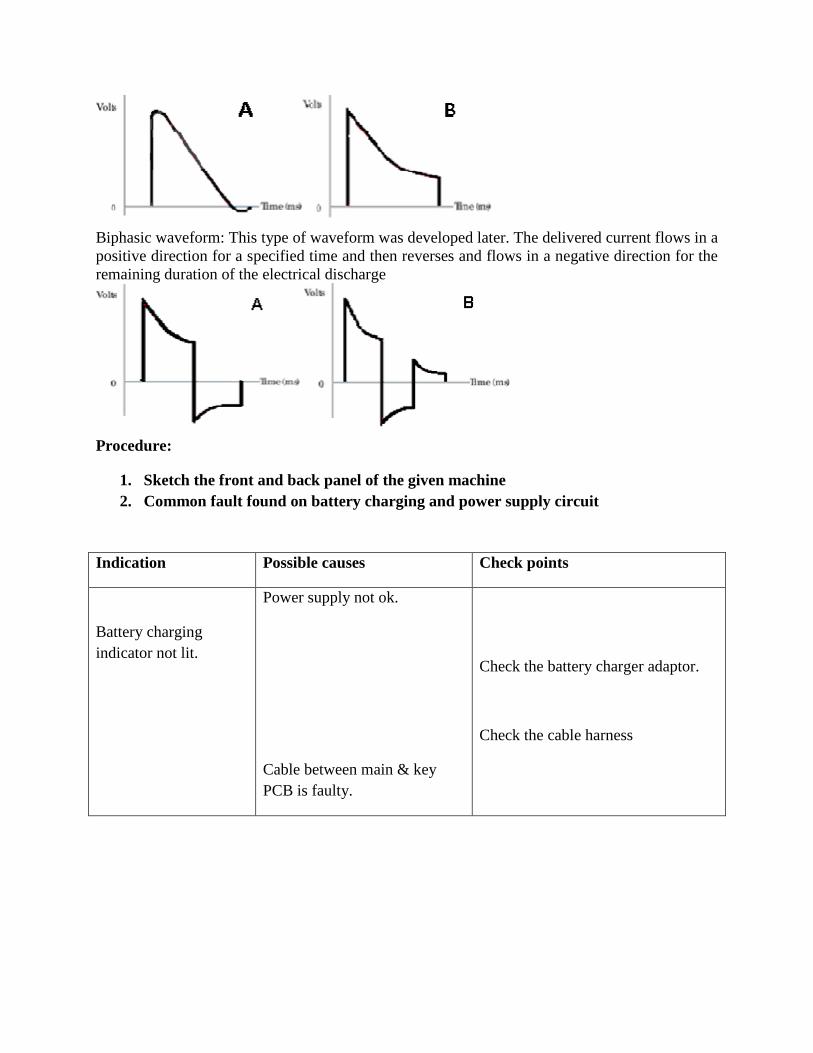
Biphasic waveform: This type of waveform was developed later. The delivered current flows in a
positive direction for a specified time and then reverses and flows in a negative direction for the
remaining duration of the electrical discharge
Procedure:
1. Sketch the front and back panel of the given machine
2. Common fault found on battery charging and power supply circuit
Indication Possible causes Check points
Battery charging
indicator not lit.
Power supply not ok.
Cable between main & key
PCB is faulty.
Check the battery charger adaptor.
Check the cable harness

Battery does not get
charged.
Battery is faulty or end of
battery life cycle
Battery charging current is not
ok.
Check battery is leaky or swollen.
Check if battery current is as per the
design
Unit does not switch
ON.
Battery protection fuse burnt
out.
Microcontroller not
functioning.
ON / OFF circuit is not ok.
Check the fuse & check for any
overloading in the path.
Check for the presence of supply
voltages
Check if the reset circuit of the
controller is ok.
Check the cable between main & key
PCB.
Common fault found on ECG acquisition circuit
Indication Possible causes Check points
ECG waveform not
printed
Patient cable is faulty.
Input amplifier section is faulty.
Check the patient cable.
Check Input amplifier section
Open Lead indication
does not work.
Input DF protection leaky or
short.
Input amplifier section is faulty.
Check Input amplifier section
Check Input amplifier section
ECG too noisy.
Right leg drive circuit is not ok.
Supply voltages for ICs are not
ok.
Check Right leg drive circuit
section
Check power supply ripple and
also for any filter capacitor is
open.
Common fault found on Microcontroller Section
Symptom Cause Check Points
No display on switch
on.
Microcontroller power
supply not present
Clock not OK
Check for the presence
Microcontroller power supply
Check Crystals, Microcontroller.
Display not clean LCD signals are not OK Check LCD Signals as per designer
recommendation.
Remote charging and
shock keys not
working(Not present in
Signal from paddles not
reaching Microcontroller
Check paddles wiring

all types)
No QRS beep Audio circuit not working
Speaker not connected or
failed
Check audio circuitry
Check Speaker connection or replace
speaker
Stored events/Trend
not retained after
switching OFF / ON
unit
SRAM supply is not ok Check SRAM supply as per designer
recommendation.
LCD contrast related
problems
LCD bias voltage not
present
Check LCD bias voltage as per
recommendation
No action for
CHARGE key
Connector loose
Keypad contact not good
Battery Low
Check Connector connection
Clean Keypad and PCB contact area
Check battery voltage as per
recommendation
PADDLES related
Error message
PADDLESConnector may
loose
Check PADDLES Connector
connection
Higher Charging time Battery Low Check battery voltage as per
recommendation
SHOCK not delivering Paddle contact not good
Shock relay failed
HV supply is not ok
Clean Paddle contact
Check shock relay testing procedure
recommendation
Check HV supply as per designer
recommendation.
Synchronized Cardio
version in not working
ECG peak is not detecting
Key cable faulty
R wave not detecting
correctly
Follow ECG acquisition trouble
shooting procedure
Check keyboard cable to
microcontroller
Adjust gain section in ECG Board
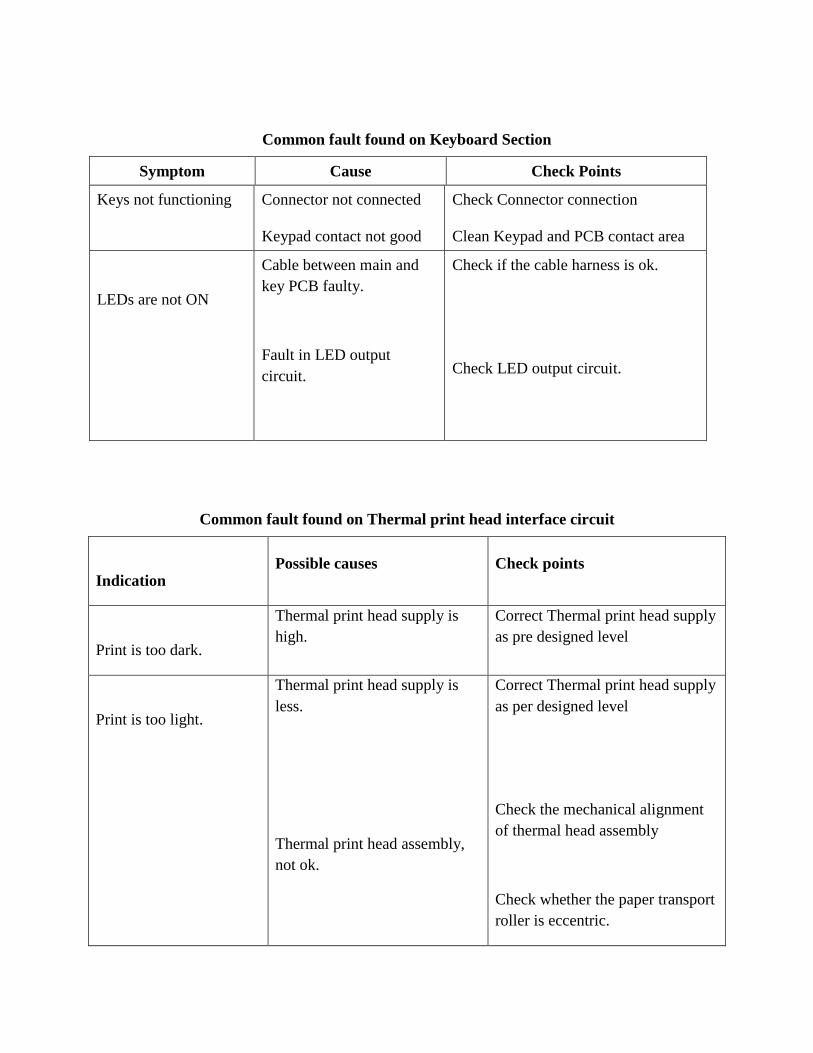
Common fault found on Keyboard Section
Symptom Cause Check Points
Keys not functioning
Connector not connected
Keypad contact not good
Check Connector connection
Clean Keypad and PCB contact area
LEDs are not ON
Cable between main and
key PCB faulty.
Fault in LED output
circuit.
Check if the cable harness is ok.
Check LED output circuit.
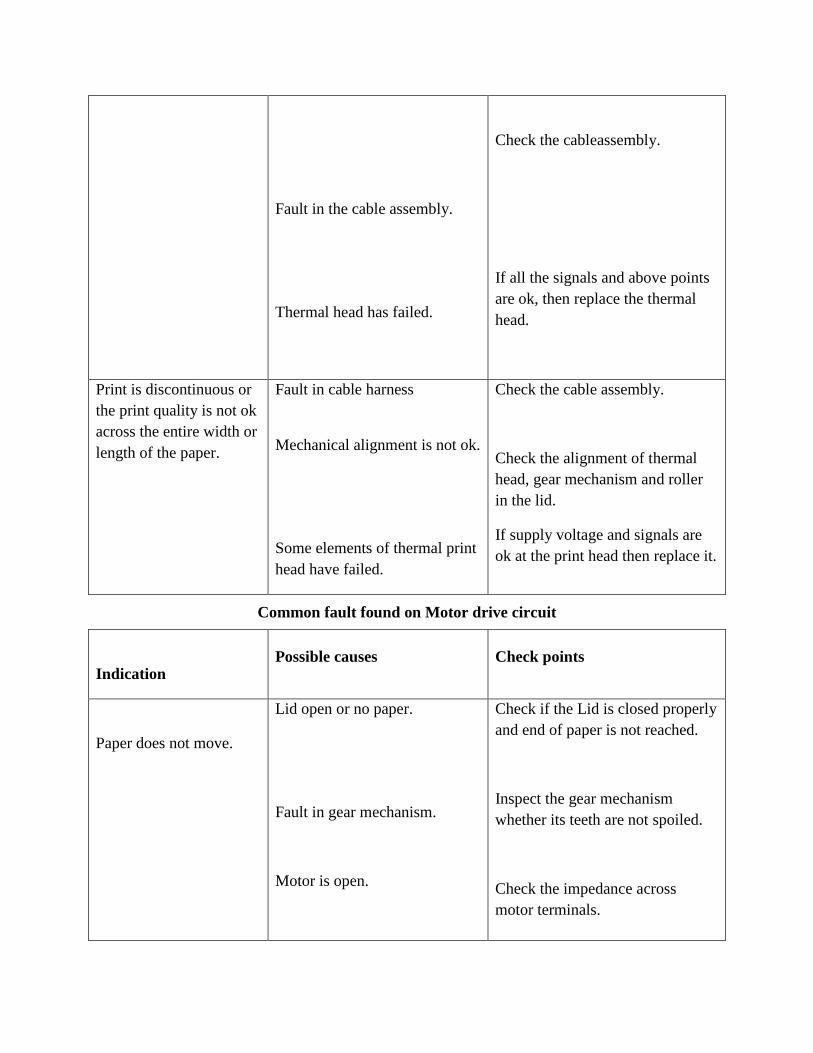
Common fault found on Thermal print head interface circuit
Indication Possible causes Check points
Print is too dark.
Thermal print head supply is
high.
Correct Thermal print head supply
as pre designed level
Print is too light.
Thermal print head supply is
less.
Thermal print head assembly,
not ok.
Correct Thermal print head supply
as per designed level
Check the mechanical alignment
of thermal head assembly
Check whether the paper transport
roller is eccentric.
Fault in the cable assembly.
Thermal head has failed.
Check the cableassembly.
If all the signals and above points
are ok, then replace the thermal
head.
Print is discontinuous or
the print quality is not ok
across the entire width or
length of the paper.
Fault in cable harness
Mechanical alignment is not ok.
Some elements of thermal print
head have failed.
Check the cable assembly.
Check the alignment of thermal
head, gear mechanism and roller
in the lid.
If supply voltage and signals are
ok at the print head then replace it.
Common fault found on Motor drive circuit
Indication Possible causes Check points
Paper does not move.
Lid open or no paper.
Fault in gear mechanism.
Motor is open.
Check if the Lid is closed properly
and end of paper is not reached.
Inspect the gear mechanism
whether its teeth are not spoiled.
Check the impedance across
motor terminals.
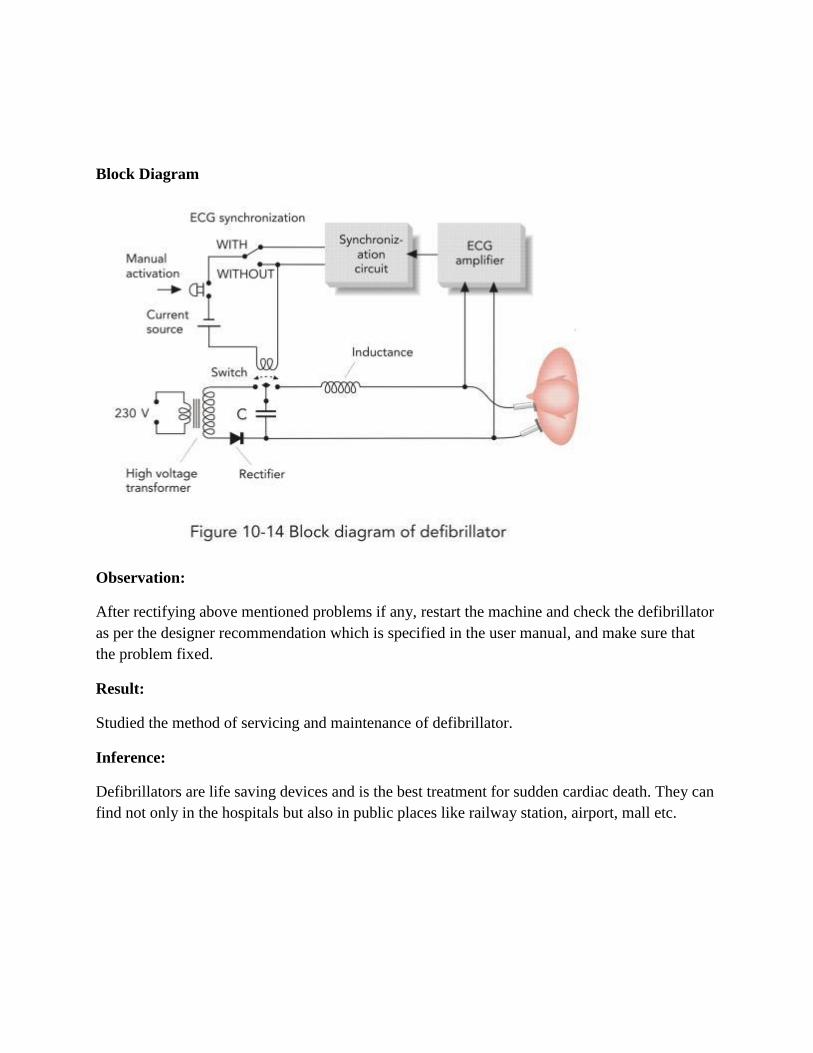
Block Diagram
Observation:
After rectifying above mentioned problems if any, restart the machine and check the defibrillator
as per the designer recommendation which is specified in the user manual, and make sure that
the problem fixed.
Result:
Studied the method of servicing and maintenance of defibrillator.
Inference:
Defibrillators are life saving devices and is the best treatment for sudden cardiac death. They can
find not only in the hospitals but also in public places like railway station, airport, mall etc.
Experiment No. 1.11
DEMONSTRATION OF BEDSIDE MONITOR
Aim: To study the working of Bed Monitor.
Objectives: After completion of this experiment student will be able to understand how to use
and demonstrate a Bed Monitor
Equipment/Components:
Sl no Name and Specification Quantity required
1 Bed Monitor 1
2 ECG simulator 1
3 User manual 1
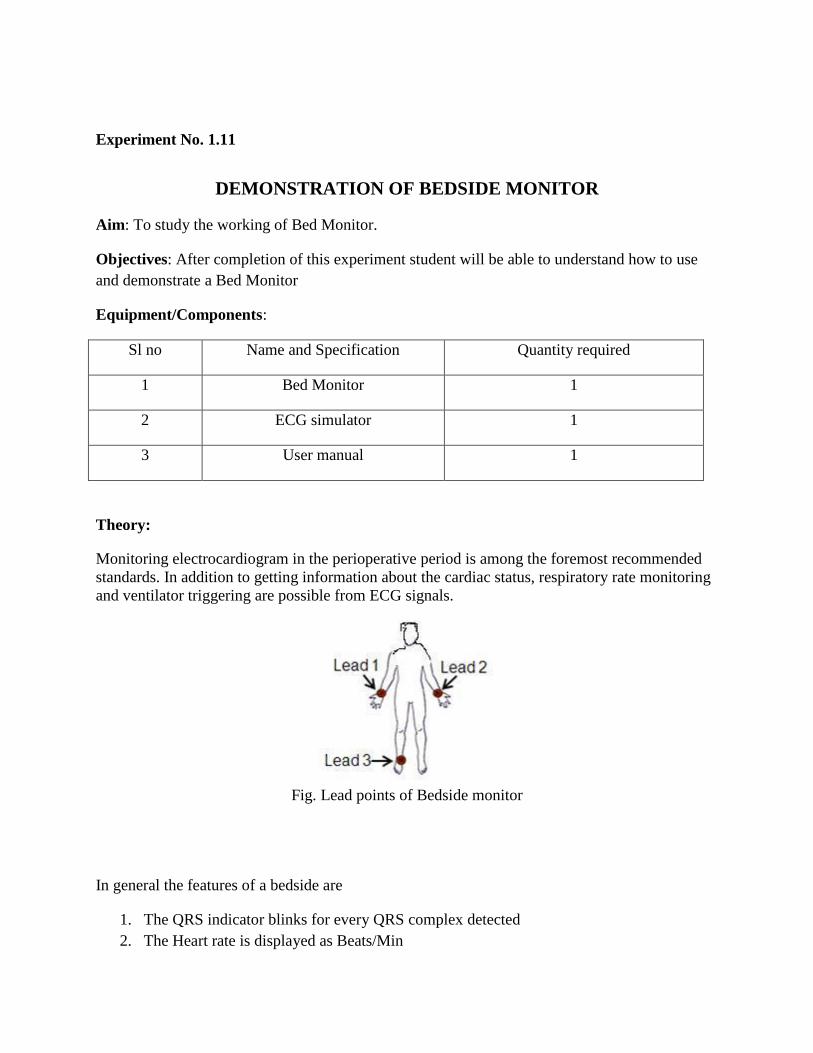
Theory:
Monitoring electrocardiogram in the perioperative period is among the foremost recommended
standards. In addition to getting information about the cardiac status, respiratory rate monitoring
and ventilator triggering are possible from ECG signals.
Fig. Lead points of Bedside monitor
In general the features of a bedside are
1. The QRS indicator blinks for every QRS complex detected
2. The Heart rate is displayed as Beats/Min
3. By entering the alarm selection mode the high and low limit can be set to generate alarm
condition. An audio alarm may be present if the value exceeds the higher limit or goes
lower than the lower limit
4. The gain indicator indicate the present gain selection with respect to the amplitude
5. The real time ECG is displayed in the first channel and delayed ECG displayed in the
second channel
Procedure:
1. Sketch the front and back panel of the given machine
2. Study the front and back panel key control from the device manual
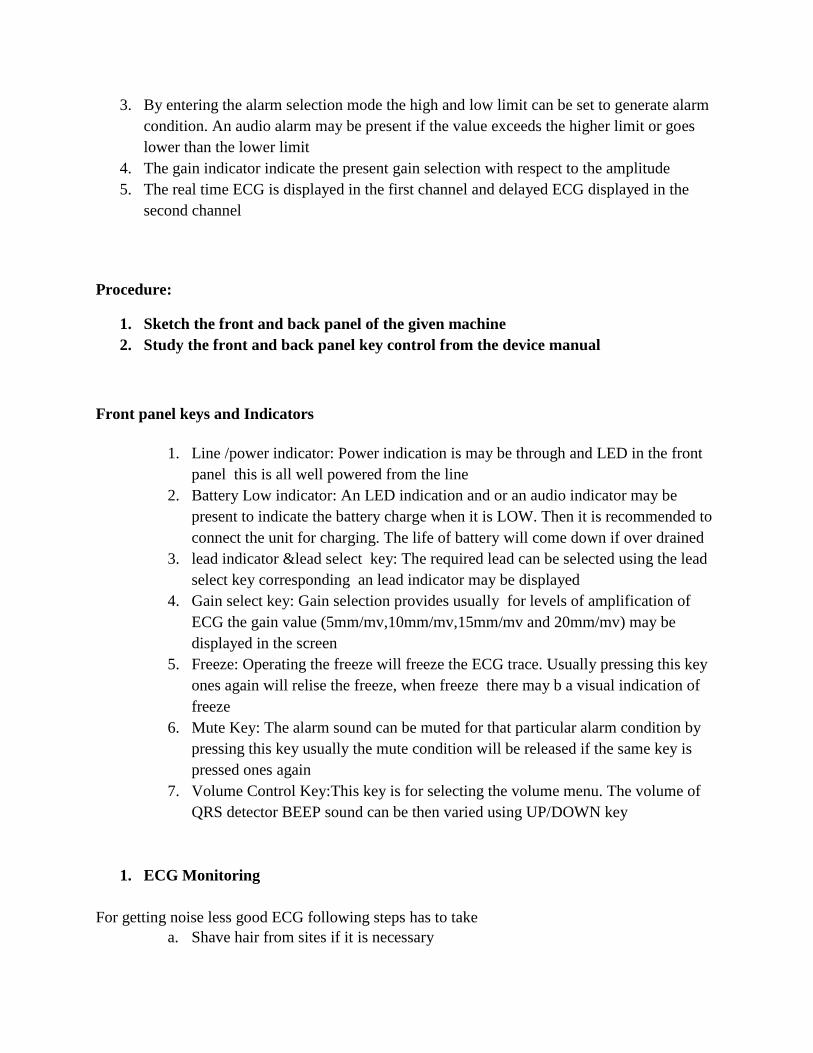
Front panel keys and Indicators
1. Line /power indicator: Power indication is may be through and LED in the front
panel this is all well powered from the line
2. Battery Low indicator: An LED indication and or an audio indicator may be
present to indicate the battery charge when it is LOW. Then it is recommended to
connect the unit for charging. The life of battery will come down if over drained
3. lead indicator &lead select key: The required lead can be selected using the lead
select key corresponding an lead indicator may be displayed
4. Gain select key: Gain selection provides usually for levels of amplification of
ECG the gain value (5mm/mv,10mm/mv,15mm/mv and 20mm/mv) may be
displayed in the screen
5. Freeze: Operating the freeze will freeze the ECG trace. Usually pressing this key
ones again will relise the freeze, when freeze there may b a visual indication of
freeze
6. Mute Key: The alarm sound can be muted for that particular alarm condition by
pressing this key usually the mute condition will be released if the same key is
pressed ones again
7. Volume Control Key:This key is for selecting the volume menu. The volume of
QRS detector BEEP sound can be then varied using UP/DOWN key
1. ECG Monitoring
For getting noise less good ECG following steps has to take
a. Shave hair from sites if it is necessary

b. Wash sites thoroughly with soap and water
c. Rub the skin to increase capillary blood flow
d. Attach electrode to the patient
e. Connect electrode lead to the patient cable
RED-electrode be placed near right shoulder directly below clavicle
YELLOW(L) electrode-near left shoulder directly below clavicle
BLACK (N)-on left hypogastrium
GREEN(F)-on left hypogastrium
Block Diagram
Fig. Block diagram of Bedside monitor
Figure 1shows the block diagram of the proposed system. Basically, the system consists of an Ag
/ Cl sticking electrode or a sensor,. The second stage is an Instrumentation amplifier (IA), which
has a high gain (1000) .The output of IA, is passed through the low pass filter with a cut off
frequency of 150Hz. The amplifier block is used to saturate the ECG signals to obtain square
waveform. Cathode Ray Oscilloscope (CRO) is used to display the ECG. Microcontroller is used
to perform the counting of pulses. LCD is used to display the heart rate
A. Electrode: It converts physical signals into electrical voltage. The voltage is in the range of 1
mV ~ 5 mV. The sensor pair is stuck on the right arm (RA), left arm (LA) and right leg (RL) of
the subject.Wilson Electrode System: In our project we have used Wilson Electrode system. This
system uses the right leg of the patient as “driven right leg lead”. This involves a summing
network to obtain the sum of the voltages from all other electrodes and driving amplifier, the
output of which is connected to the right leg of the patient. This arrangement is known as Wilson
electrode system. The effect of this arrangement is to force the reference connection at the right
leg of the patient to assume a voltage level equal to the sum of the voltages at the other leads.
This arrangement increases the common mode rejection ratio of the overall system and reduces
noise interference. It also has the effect of reducing the current flow in to the right leg electrode.
B. Instrumentation Amplifier:Many industrial and medical applications use instrumentation
amplifiers (INAs) to condition small signals in the presence of large common-mode voltages and
DC potentials so we choose Analog instrumentation amplifier to amplify the ECG voltage from
electrodes, which is in the range of 1mV to 5mV.

Fig. Instrument amplifier of Bedside monitor
C. Low pass filter: This block is used to remove the unwanted signals like noise, the frequency
range of ECG is 0.04HZ to 150 Hz, and so the low pass filter is designed with the cut off
frequency of 150HZ.
Fig. Lowpass filter of Bedside monitor
D. Amplifier:It consists of a simple non inverting amplifier which is designed to saturate the
ECG signals, and the output of amplifier is fed to the microcontroller to count the heart rate.
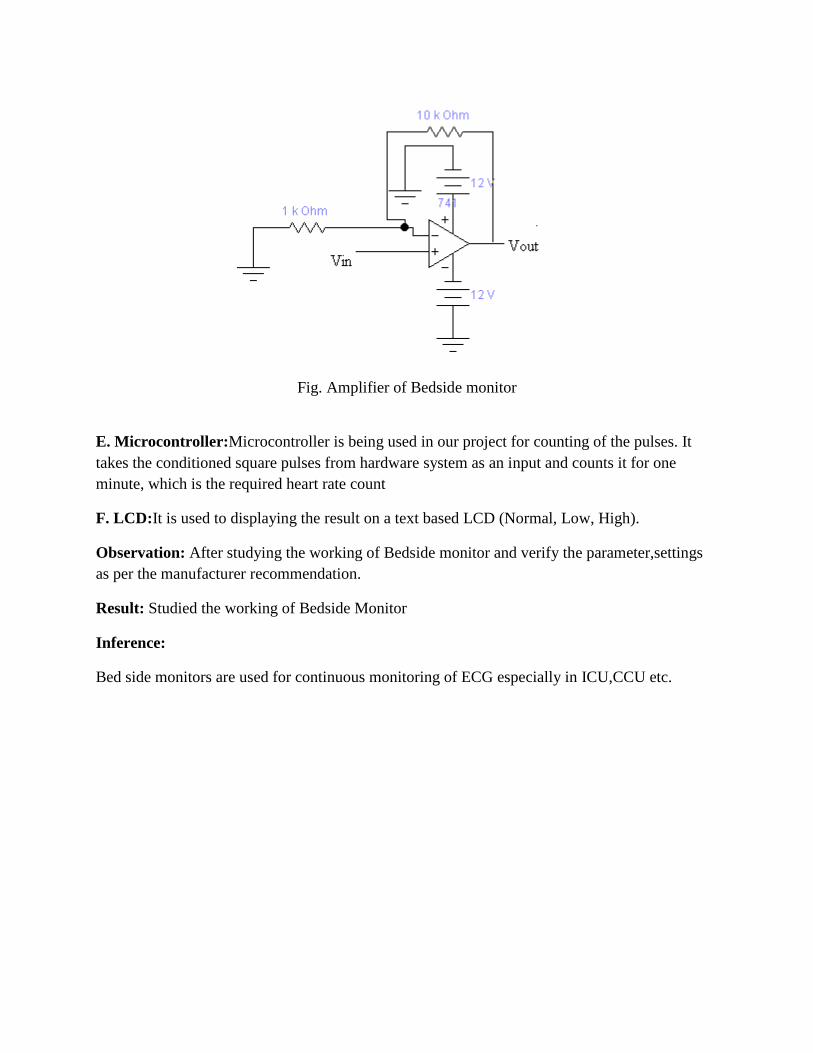
Fig. Amplifier of Bedside monitor
E. Microcontroller:Microcontroller is being used in our project for counting of the pulses. It
takes the conditioned square pulses from hardware system as an input and counts it for one
minute, which is the required heart rate count
F. LCD:It is used to displaying the result on a text based LCD (Normal, Low, High).
Observation: After studying the working of Bedside monitor and verify the parameter,settings
as per the manufacturer recommendation.
Result: Studied the working of Bedside Monitor
Inference:
Bed side monitors are used for continuous monitoring of ECG especially in ICU,CCU etc.

Experiment No. 1.12
DEMONSTRATE MULTIPARA MONITOR
Aim:To study working of Multipara Monitor.
Objectives: After completion of this experiment student will be able to understand how to use
and demonstrate a Multipara Monitor
Equipment/Components:
Sl no Name and Specification Quantity required
1 Multipara Monitor 1
2 ECG simulator 1
3 User manual 1
Theory:
Patient Monitoring units are designed to monitor different parameter such as heart rate,
pulse,temperature,respiration rate, oxygen saturation,ETcO2,NIBP,IBP etc.Monitoring of vital
parameters can include several of the ones mentioned above, and most commonly include at least
blood pressure and heart rate, and preferably also pulse oximetry and respiratory rate.
Multimodal monitors that simultaneously measure and display the relevant vital parameters are
commonly integrated into the bedside monitors in critical care units, and the anesthetic machines
in operating rooms. These allow for continuous monitoring of a patient, with medical staff being
continuously informed of the changes in general condition of a patient. Some monitors can even
warn of pending fatal cardiac conditions before visible signs are noticeable to clinical staff, such
as atrial fibrillation or premature ventricular contraction (PVC).
The system consists of the pulse oximeter probe, the ECG surface electrodes and the blood
pressure measuring occlusion cuff and their respective signal conditioning and amplification
circuits. The analog signals are fed to the microcontroller. A few parameters like ECG, SpO2,
heart rate, body temperature and blood pressure and have been selected here which are
considered to be vital parameters for a patient monitoring system. The parameters monitored by
this system and the sensors used for measuring them are described in this section.
pulseoximeterconsists of two narrow band LEDs as sources of light. One is red LED of 660 nm
wavelength and other one is an infrared LED of 940 nm wavelength, placed on one side and a
photo detector placed on opposite side of the probe. The output of the photo-detector is given to

the signal conditioning and amplification circuitry. Fig.2. shows the block diagram of the signal
conditioning and amplification circuitry.
Fig. Front panel of multiparameter monitor
Procedure:
1. Sketch the front and back panel of the given machine
2. Study the front and back panel key control from the device manual
2. Button Functions
All the operations to the monitor are through buttons and rottory knob
1. Power button: This button is used for to switch on and switch off the machine
2. Freeze: By pressing this button user can access freeze status of current parameter, and
also some monitor frozen waveform can be printed out. For exit from this status Press
ones more same button
3. Silence: By pushing this button user can suspend alarm for maximum X minutes(here X
is in minute which is selectable in menu ),the alarm pause status symbol appears in the
message area. By Pushing this button for more than 1 sec can mute all kinds of
sound(alarm, heartbeat, pulse tone ,key sound).push this button ones again to restore
normal function
4. Print: In most of the machines this key is optional, this is used for to start real time
recording. press ones more same key will stop, recording
5. NIBP: Press to inflate the cuff to start blood pressure measurement pressing ones again
the same button is to cancel the measurement and deflate the cuff(may change
manufacturer)

6. Menu: This button for call up the system menu, in which the user can perform various
settings
7. Rotatory knob: The user can use rotatory knob to select menu item and modify setup it
can rotate clock and counter clock wise and pressed like other buttons.
3. Monitoring
ECG/RESP Monitoring
For getting noise less good ECG following steps has to take
1. Shave hair from sites if its necessary
2. Wash sites thoroughly with soap and water
3. Rub the skin to increase capillary blood flow
4. Attach electrode to the patient
5. Connect electrode lead to the patient cable Red electrode be placed near right shoulder
directly below clavicle
6. YELLOW(L) electrode-near left shoulder directly below clavicle
BLACK (N)-on left hypogastrium
GREEN(F)-on left hypogastrium
WHITE(C)-on chest
ECG Menu
ECG menu is accessed by pressing menu key and select ECG by rotary switch mainly in this
menu contains
HR ALARM: for HR alarm(ON-enable HR alarm,OFF-disable HR alarm)
ALARM LEV- indicate sound level (HIGH,MEDIUM,LOW)
ALARM HI-used to setup upper limit HR alarm
ALARM LOW- used to setup lower of ECG alarm
HR CHANEL-CH1-chanel 1 is used to count HR
CH2- channel 2 is used to count HR
LEAD TYPE: used to select either 3,5(depend on manufacturer)
SWEEP: Indicates SWEEP speed
25mm/sec(print ECG 25mm/sec)
12.5mm/sec
50mm/sec
Respiration
The monitor measures respiration
From the amount of thoracic impedance between two electrode the change of impedance
between two electrode produce respiratory waveform on the screen
a) Prepare the patient skin prior to placing electrode
b) Attach snap or clip to the electrode and attach electrode to the patient
c) Switch on the monitor
SPO2 Monitoring
SPO2 plethysmographmeasurement is employed to determine O2 saturation of Hb in the arterial
blood .the arterial oxygen saturation.
It is measured the method called oximetry. It is continuesnon invasive method based on different
absorption spectra produced Hb and Oxy Hb
a) Monitoring procedure
b) Switch on monitor
c) Attach sensor to the appropriate site of patient finger
d) Plug the connector extension cable to the SPO2 socket on the portable patient monitor
SPO2 Setup menu
Pick the SPO2 hot key on the screento call up SPO2 set up menu
Temperature monitoring
a) Plug temperature cable in socket and connect it to the patient
b) Switch on system
Temperature setup menu
Pick the temperature the hot key on the screen to call up temperature setup menu
NIBP Monitoring
Plug the airhose and switch on the system
a) Apply the blood pressure to the patient arm
b) Ensure the cuff is completely deflate
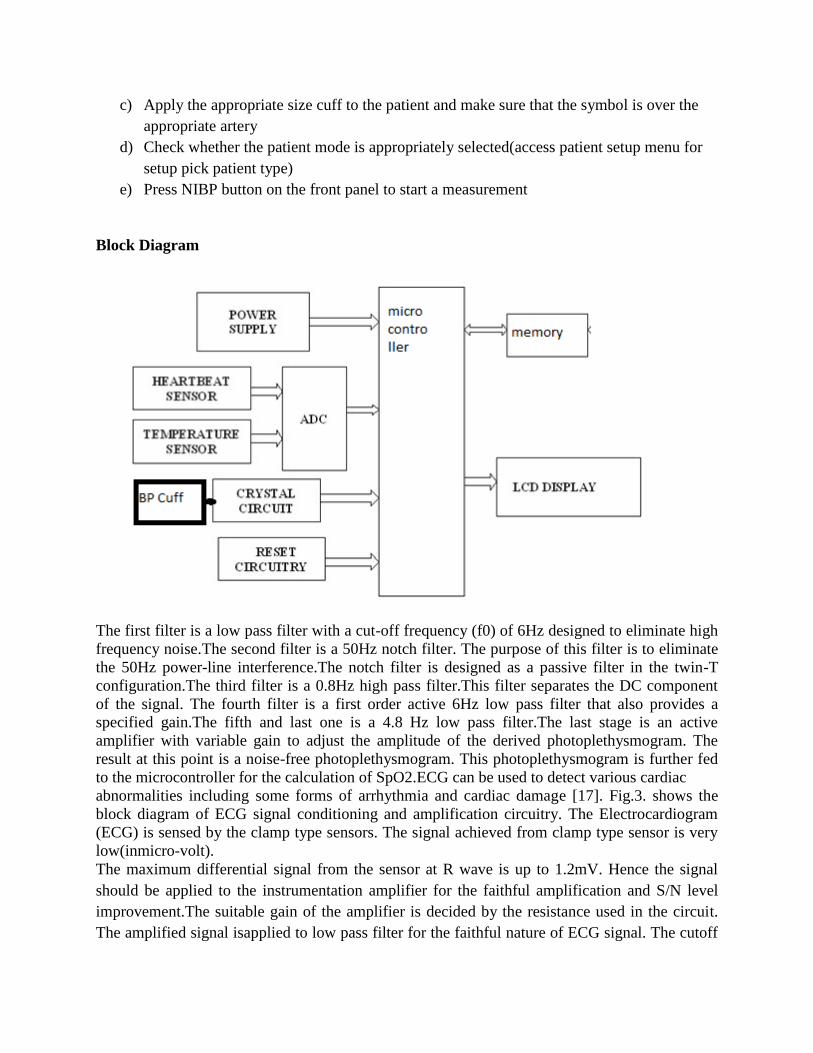
c) Apply the appropriate size cuff to the patient and make sure that the symbol is over the
appropriate artery
d) Check whether the patient mode is appropriately selected(access patient setup menu for
setup pick patient type)
e) Press NIBP button on the front panel to start a measurement
Block Diagram
The first filter is a low pass filter with a cut-off frequency (f0) of 6Hz designed to eliminate high
frequency noise.The second filter is a 50Hz notch filter. The purpose of this filter is to eliminate
the 50Hz power-line interference.The notch filter is designed as a passive filter in the twin-T
configuration.The third filter is a 0.8Hz high pass filter.This filter separates the DC component
of the signal. The fourth filter is a first order active 6Hz low pass filter that also provides a
specified gain.The fifth and last one is a 4.8 Hz low pass filter.The last stage is an active
amplifier with variable gain to adjust the amplitude of the derived photoplethysmogram. The
result at this point is a noise-free photoplethysmogram. This photoplethysmogram is further fed
to the microcontroller for the calculation of SpO2.ECG can be used to detect various cardiac
abnormalities including some forms of arrhythmia and cardiac damage [17]. Fig.3. shows the
block diagram of ECG signal conditioning and amplification circuitry. The Electrocardiogram
(ECG) is sensed by the clamp type sensors. The signal achieved from clamp type sensor is very
low(inmicro-volt).
The maximum differential signal from the sensor at R wave is up to 1.2mV. Hence the signal
should be applied to the instrumentation amplifier for the faithful amplification and S/N level
improvement.The suitable gain of the amplifier is decided by the resistance used in the circuit.
The amplified signal isapplied to low pass filter for the faithful nature of ECG signal. The cutoff
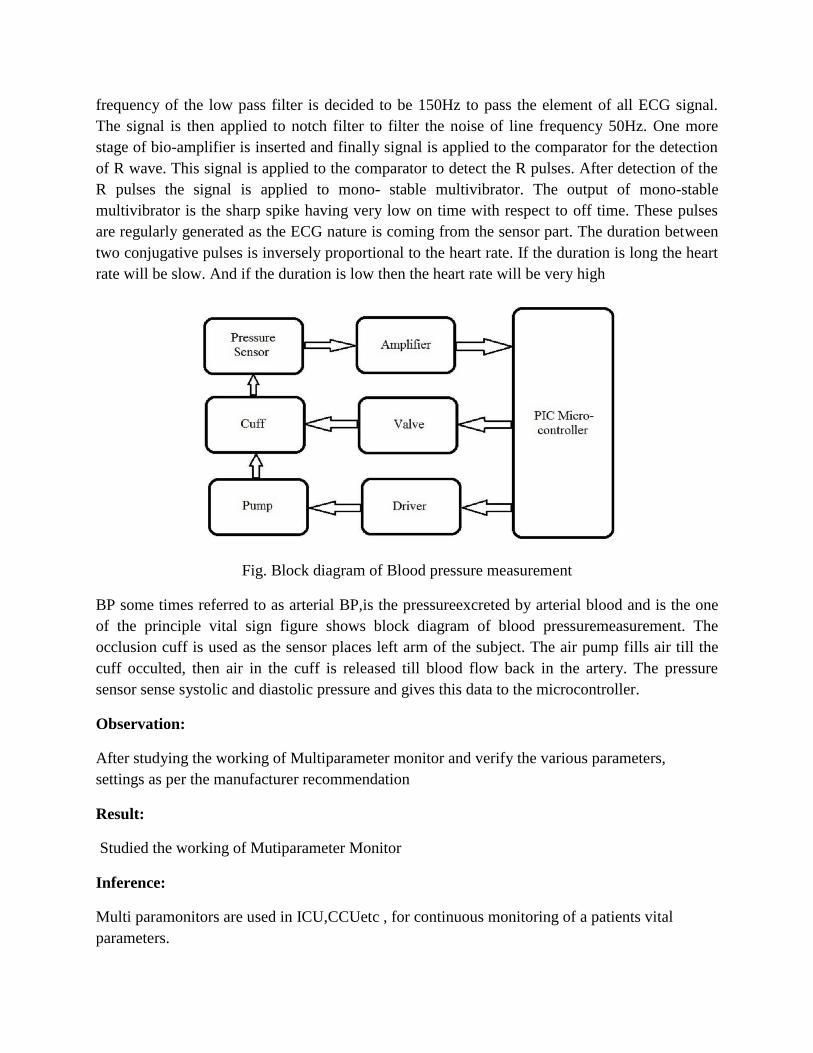
frequency of the low pass filter is decided to be 150Hz to pass the element of all ECG signal.
The signal is then applied to notch filter to filter the noise of line frequency 50Hz. One more
stage of bio-amplifier is inserted and finally signal is applied to the comparator for the detection
of R wave. This signal is applied to the comparator to detect the R pulses. After detection of the
R pulses the signal is applied to mono- stable multivibrator. The output of mono-stable
multivibrator is the sharp spike having very low on time with respect to off time. These pulses
are regularly generated as the ECG nature is coming from the sensor part. The duration between
two conjugative pulses is inversely proportional to the heart rate. If the duration is long the heart
rate will be slow. And if the duration is low then the heart rate will be very high
Fig. Block diagram of Blood pressure measurement
BP some times referred to as arterial BP,is the pressureexcreted by arterial blood and is the one
of the principle vital sign figure shows block diagram of blood pressuremeasurement. The
occlusion cuff is used as the sensor places left arm of the subject. The air pump fills air till the
cuff occulted, then air in the cuff is released till blood flow back in the artery. The pressure
sensor sense systolic and diastolic pressure and gives this data to the microcontroller.
Observation:
After studying the working of Multiparameter monitor and verify the various parameters,
settings as per the manufacturer recommendation
Result:
Studied the working of Mutiparameter Monitor
Inference:
Multi paramonitors are used in ICU,CCUetc , for continuous monitoring of a patients vital
parameters.


Experiment No. 1.13
DEMONSTRATE AUDIOMETER
Aim: To study working of Audiometer.
Objectives: After completion of this experiment student will be able to understand how to use
and demonstrate an Audiometer
Equipment/Components:
Sly no Name and Specification Quantity required
1 Audiometer 1
2 Head phone 1
3 Marker switch 1
4 User manual 1
Theory:
An audiometer is a machine used for evaluating hearing acuity. They usually consist of an
embedded hardware unit connected to a pair of headphones and a test subject feedback button,
sometimes controlled by a standard PC. Such systems can also be used with bone vibrators, to
test conductive hearing mechanisms.
Audiometers are standard equipment at ENT (ear, nose, throat) clinics and in audiology centers.
An alternative to hardware audiometers are software audiometers, which are available in many
different configurations. Screening PC-based audiometers use a standard computer. Clinical PC-
based audiometers are generally more expensive than software audiometers, but are much more
accurate and efficient. They are most commonly used in hospitals, audiology centers and
research communities. These audiometers are also used to conduct industrial audiometric testing.
Some audiometers even provide a software developer's kit that provides researchers with the
capability to create their own diagnostic tests.
Procedure:
1. Sketch the front and back panel of the given machine
2. Study the front and back panel key control from the device manual

3. Perform the following test
20dB Test: This performs a quick automatic screening test with fixed sound pressure of 20 dB.
The test chooses 1000 Hz, the sound pressure will be set to 20 dB and increase in step of 5 dB
until the patient response. Immediately after the frequency changes and the sound pressure starts
at 20 dB again.
20 dB random test: - It starts by selecting 1000 Hz .First at the left then the right ear. It then
randomlyselects frequency and channel in the rest of the test until all frequencies has been tested
at both channels, and thereby makes ithard for the patient to cheat. In both the 20 dB and the 20
dB random test there is a slight variation in the duration of thetones presented, and the pause
between the tones. These variations are also chosenrandomly.
Variable automatic test: - the frequency is set to 1000 Hz and a tone is automatically given to
the left ear at an intensity of 30 dB. As long as there is no response from the patient to the tone,
the intensity will increase 10dB each time the tone is present, until the patient signal button is
pressed. For each response the intensity is reduced 5dB and converselyincreased 5 dB when
there is no answer.
When the softwareprogram has accepted the answer, the frequency is automatically changed to
the next level and the procedure is repeated until all frequencies have been tested for both left
and the right ear. When the test is completed, the audiometer gives a indication.
Short increment sensitivity index: - The test has three pulse amplitudes it operates at which can
be selected while it turns. The three amplitude modes are as follows
5dB:- The test starts in this mode and is intendant only for familiarizing the patient with the test
method. The patient responses and pulses are not counted in this 5 dB mode, and the mode
continuous until the next mode is selected or the test is terminated.
2dB:- This mode present twenty pulses of 2dB increments before it continuous to the 1 dB
mode. It counts the patient responses, but does not store the count in memory. If the patient has
responded to every pulse, or did not respond to any of them after ten pulses the test will continue
to 1 dB mode.
1dB:- This presents twenty pulses of 1 dB increments. It also counts the patient responses, but
this time it is stored in memory as the test result in percent. This happens when twenty pulses has
been presented, or if there was either zero percentage of hundred percentage responses to the first
ten pulses.
Block diagram
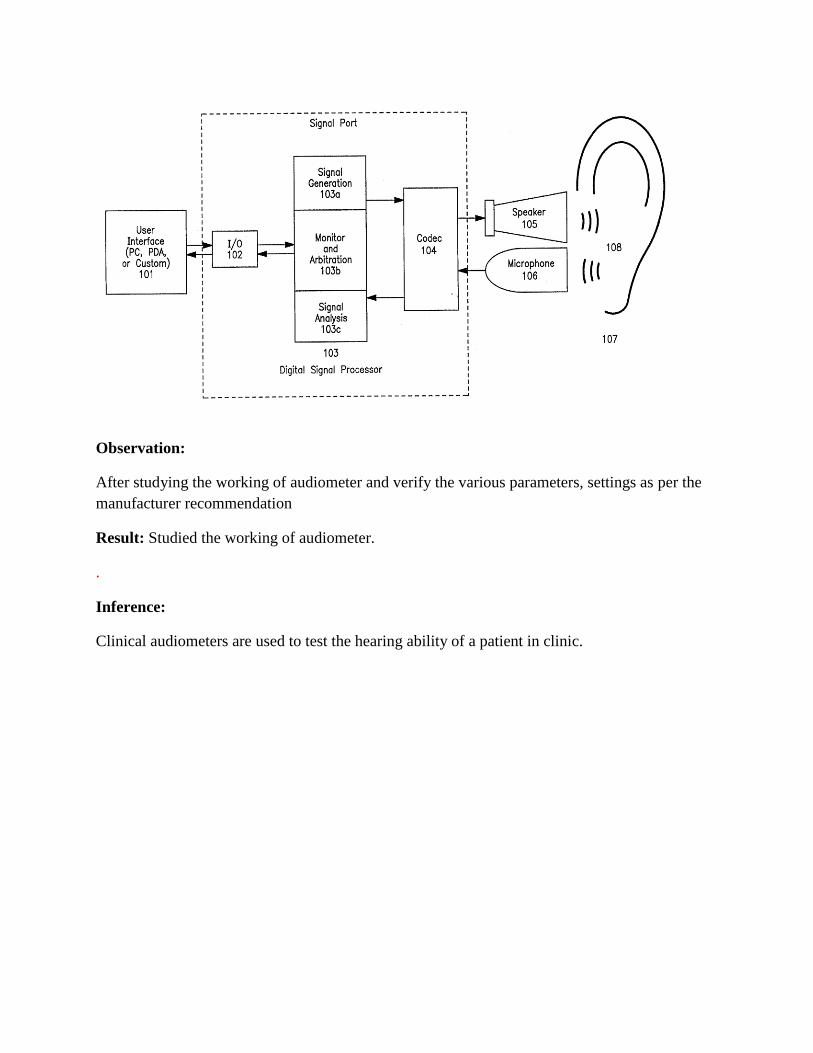
Observation:
After studying the working of audiometer and verify the various parameters, settings as per the
manufacturer recommendation
Result: Studied the working of audiometer.
.
Inference:
Clinical audiometers are used to test the hearing ability of a patient in clinic.

Experiment No. 1.14
FETAL MONITOR
Aim: To demonstrate the working of Fetal Monitor.
Objectives: After completion of this experiment student will be able to understand how to use
and demonstrate a Foetal Monitor
Equipment/Components:
Sl no Name and Specification Quantity required
1 Foetal monitor 1
2 User manual 1
Theory:
Doppler fetal heart rate monitor is a hand-held ultrasound transducer used to detect the fetal
heartbeat for prenatal care. It uses the Doppler effect to provide an audible simulation of the
heartbeat. Some models also display the heart rate in beats per minute. Use of this monitor is
sometimes known as Doppler auscultation. One advantage of the Doppler fetal monitor over a
(purely acoustic) fetal stethoscope is the electronic audio output, which allows people other than
the user to hear the heartbeat. Fetal Doppler technology is based on the Doppler shift principle.
Doppler discovered that sound waves from a moving source would be compressed or expanded,
or that the frequency would change.
Doppler work on the principle of listening to reflections of small, high frequency sound waves
(ultrasound). These ultrasound waves are generated by microscopic vibrations of piezoelectric
crystals. When the waves are reflected from moving objects, such as a fetal heart the frequency
changes slightly. It is this change that is analyzed by the electronics of the Doppler and
converted into a sound that you can hear or a digital display of the heart rate.
Procedure
1. Sketch the front and back panel of the given machine
2. Study the front and back panel key control from the device manual
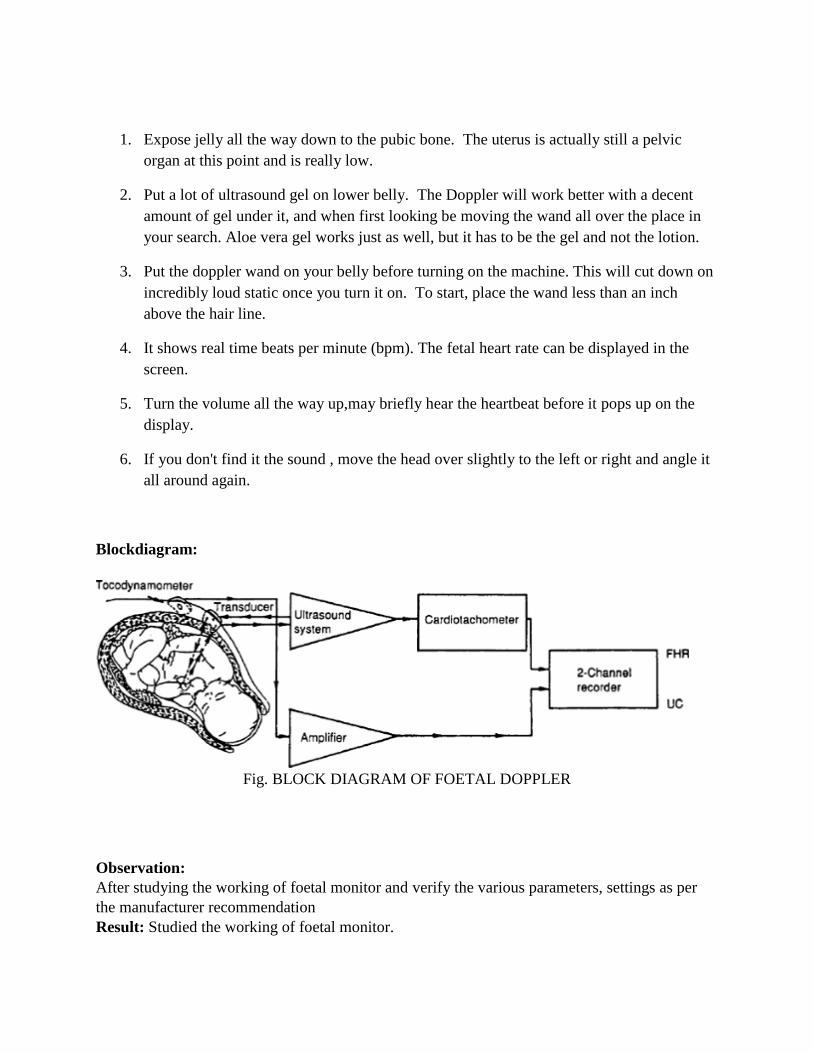
1. Expose jelly all the way down to the pubic bone. The uterus is actually still a pelvic
organ at this point and is really low.
2. Put a lot of ultrasound gel on lower belly. The Doppler will work better with a decent
amount of gel under it, and when first looking be moving the wand all over the place in
your search. Aloe vera gel works just as well, but it has to be the gel and not the lotion.
3. Put the doppler wand on your belly before turning on the machine. This will cut down on
incredibly loud static once you turn it on. To start, place the wand less than an inch
above the hair line.
4. It shows real time beats per minute (bpm). The fetal heart rate can be displayed in the
screen.
5. Turn the volume all the way up,may briefly hear the heartbeat before it pops up on the
display.
6. If you don't find it the sound , move the head over slightly to the left or right and angle it
all around again.
Blockdiagram:
Fig. BLOCK DIAGRAM OF FOETAL DOPPLER
Observation:
After studying the working of foetal monitor and verify the various parameters, settings as per
the manufacturer recommendation
Result: Studied the working of foetal monitor.

Inference:
Fetal Doppler is widely used in gynecology and neonatology to diagnose fetal heart sound. Since
it is based on ultrasound principle it is seldom harmful to the fetus.


Experiment No. 1.15
CHARACTERISTICS OF ELECTRODE AND TRANSDUCERS
Aim: To familiarize characteristics of electrode and transducer.
Objectives: After completion of this experiment student will be able to understand the different
electrodes and transducer used in the medical field.
Equipment/Components:
Sl no Name and Specification Quantity required
1 ECG Electrode, EEG electrode and
EMG electrode
1
2 Resistors, Op Amp 1
3 DSO,DMM, Function generator 1
Principle
In most of the electrical systems, the input signal will not be an electrical signal, but a non-
electrical signal. This will have to be converted into its corresponding electrical signal if its value
is to be measured using electrical methods.
The block diagram of a transducer is given below.
Transducer Block Diagram
A transducer will have basically two main components. They are
1. Sensing Element
The physical quantity or its rate of change is sensed and responded to by this part of the
transistor.
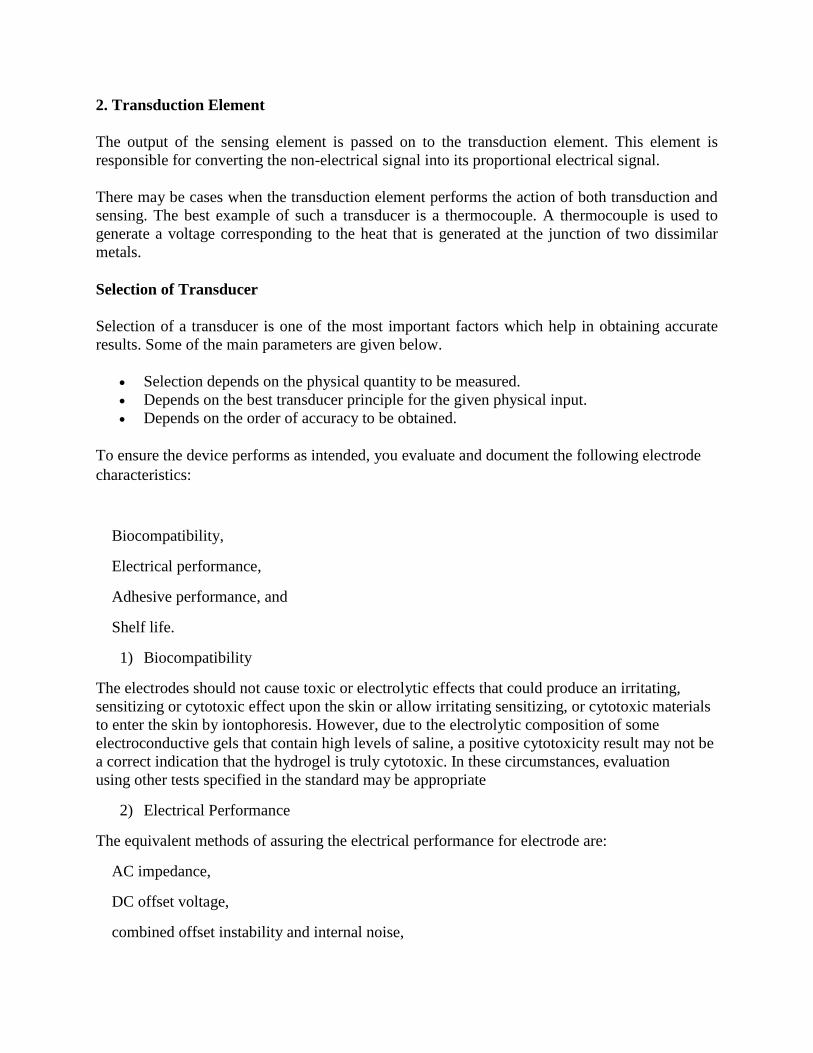
2. Transduction Element
The output of the sensing element is passed on to the transduction element. This element is
responsible for converting the non-electrical signal into its proportional electrical signal.
There may be cases when the transduction element performs the action of both transduction and
sensing. The best example of such a transducer is a thermocouple. A thermocouple is used to
generate a voltage corresponding to the heat that is generated at the junction of two dissimilar
metals.
Selection of Transducer
Selection of a transducer is one of the most important factors which help in obtaining accurate
results. Some of the main parameters are given below.
Selection depends on the physical quantity to be measured.
Depends on the best transducer principle for the given physical input.
Depends on the order of accuracy to be obtained.
To ensure the device performs as intended, you evaluate and document the following electrode
characteristics:
Biocompatibility,
Electrical performance,
Adhesive performance, and
Shelf life.
1) Biocompatibility
The electrodes should not cause toxic or electrolytic effects that could produce an irritating,
sensitizing or cytotoxic effect upon the skin or allow irritating sensitizing, or cytotoxic materials
to enter the skin by iontophoresis. However, due to the electrolytic composition of some
electroconductive gels that contain high levels of saline, a positive cytotoxicity result may not be
a correct indication that the hydrogel is truly cytotoxic. In these circumstances, evaluation
using other tests specified in the standard may be appropriate
2) Electrical Performance
The equivalent methods of assuring the electrical performance for electrode are:
AC impedance,
DC offset voltage,
combined offset instability and internal noise,
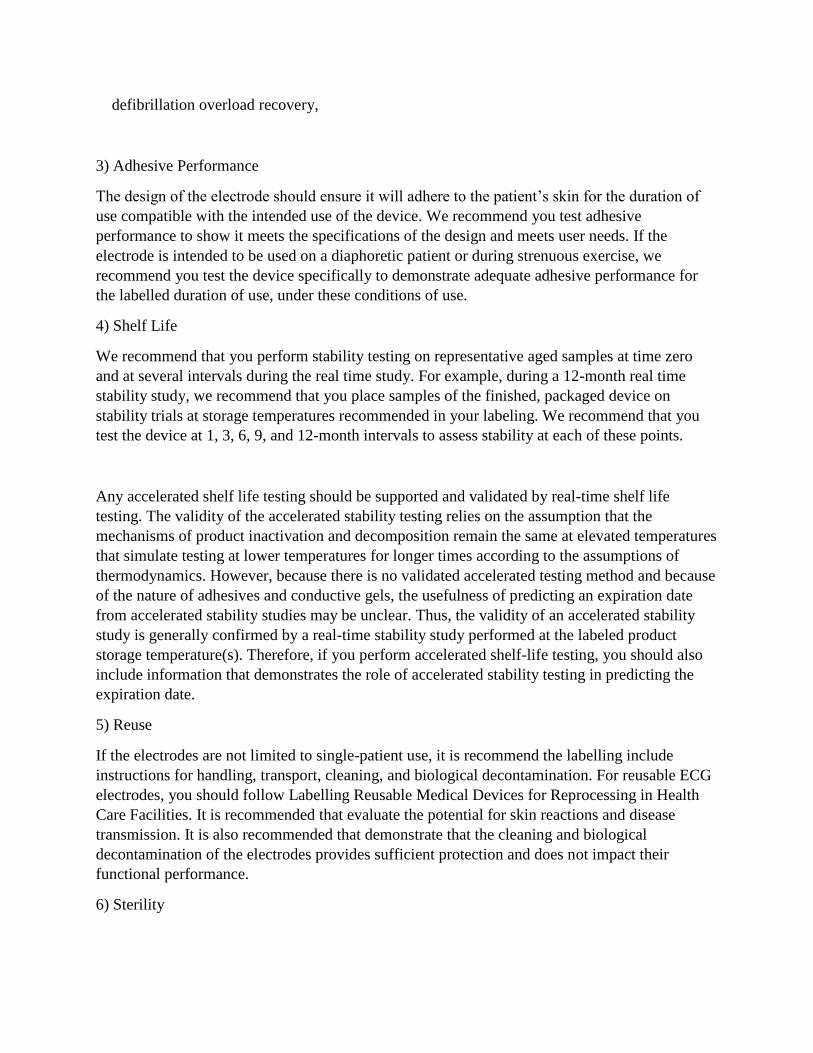
defibrillation overload recovery,
3) Adhesive Performance
The design of the electrode should ensure it will adhere to the patient‟s skin for the duration of
use compatible with the intended use of the device. We recommend you test adhesive
performance to show it meets the specifications of the design and meets user needs. If the
electrode is intended to be used on a diaphoretic patient or during strenuous exercise, we
recommend you test the device specifically to demonstrate adequate adhesive performance for
the labelled duration of use, under these conditions of use.
4) Shelf Life
We recommend that you perform stability testing on representative aged samples at time zero
and at several intervals during the real time study. For example, during a 12-month real time
stability study, we recommend that you place samples of the finished, packaged device on
stability trials at storage temperatures recommended in your labeling. We recommend that you
test the device at 1, 3, 6, 9, and 12-month intervals to assess stability at each of these points.
Any accelerated shelf life testing should be supported and validated by real-time shelf life
testing. The validity of the accelerated stability testing relies on the assumption that the
mechanisms of product inactivation and decomposition remain the same at elevated temperatures
that simulate testing at lower temperatures for longer times according to the assumptions of
thermodynamics. However, because there is no validated accelerated testing method and because
of the nature of adhesives and conductive gels, the usefulness of predicting an expiration date
from accelerated stability studies may be unclear. Thus, the validity of an accelerated stability
study is generally confirmed by a real-time stability study performed at the labeled product
storage temperature(s). Therefore, if you perform accelerated shelf-life testing, you should also
include information that demonstrates the role of accelerated stability testing in predicting the
expiration date.
5) Reuse
If the electrodes are not limited to single-patient use, it is recommend the labelling include
instructions for handling, transport, cleaning, and biological decontamination. For reusable ECG
electrodes, you should follow Labelling Reusable Medical Devices for Reprocessing in Health
Care Facilities. It is recommended that evaluate the potential for skin reactions and disease
transmission. It is also recommended that demonstrate that the cleaning and biological
decontamination of the electrodes provides sufficient protection and does not impact their
functional performance.
6) Sterility
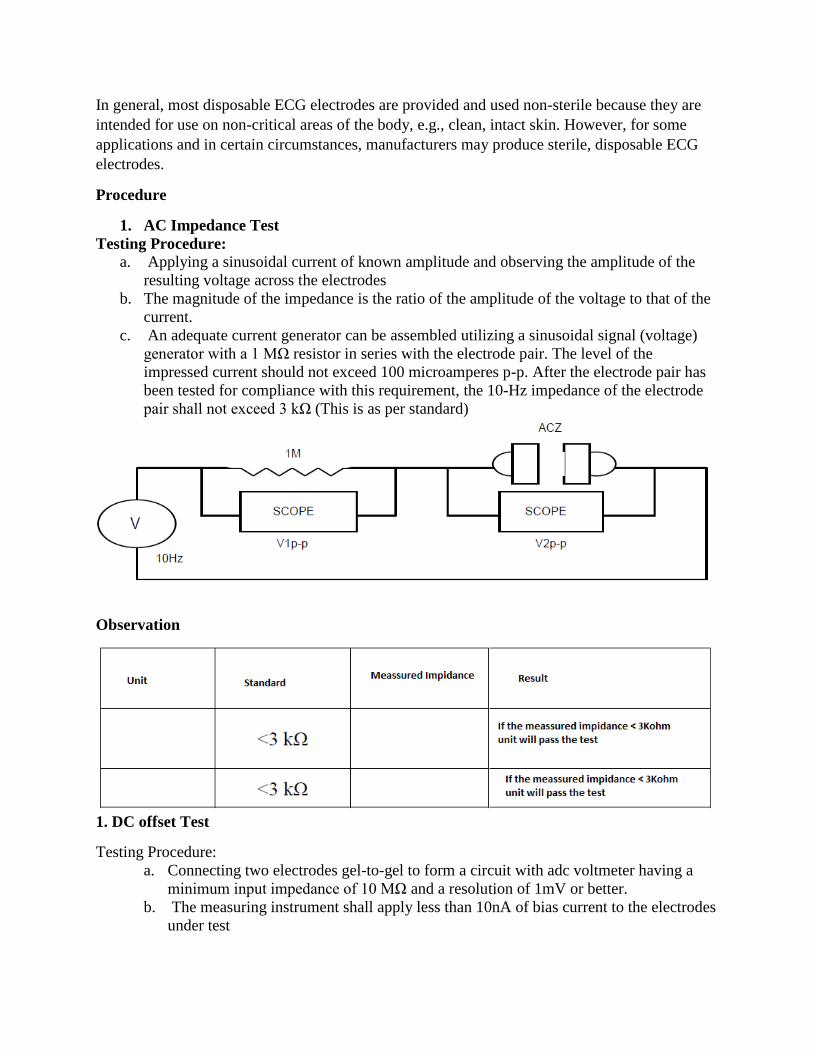
In general, most disposable ECG electrodes are provided and used non-sterile because they are
intended for use on non-critical areas of the body, e.g., clean, intact skin. However, for some
applications and in certain circumstances, manufacturers may produce sterile, disposable ECG
electrodes.
Procedure
1. AC Impedance Test
Testing Procedure:
a. Applying a sinusoidal current of known amplitude and observing the amplitude of the
resulting voltage across the electrodes
b. The magnitude of the impedance is the ratio of the amplitude of the voltage to that of the
current.
c. An adequate current generator can be assembled utilizing a sinusoidal signal (voltage)
generator with a 1 MΩ resistor in series with the electrode pair. The level of the
impressed current should not exceed 100 microamperes p-p. After the electrode pair has
been tested for compliance with this requirement, the 10-Hz impedance of the electrode
pair shall not exceed 3 kΩ (This is as per standard)
Observation
1. DC offset Test
Testing Procedure:
a. Connecting two electrodes gel-to-gel to form a circuit with adc voltmeter having a
minimum input impedance of 10 MΩ and a resolution of 1mV or better.
b. The measuring instrument shall apply less than 10nA of bias current to the electrodes
under test
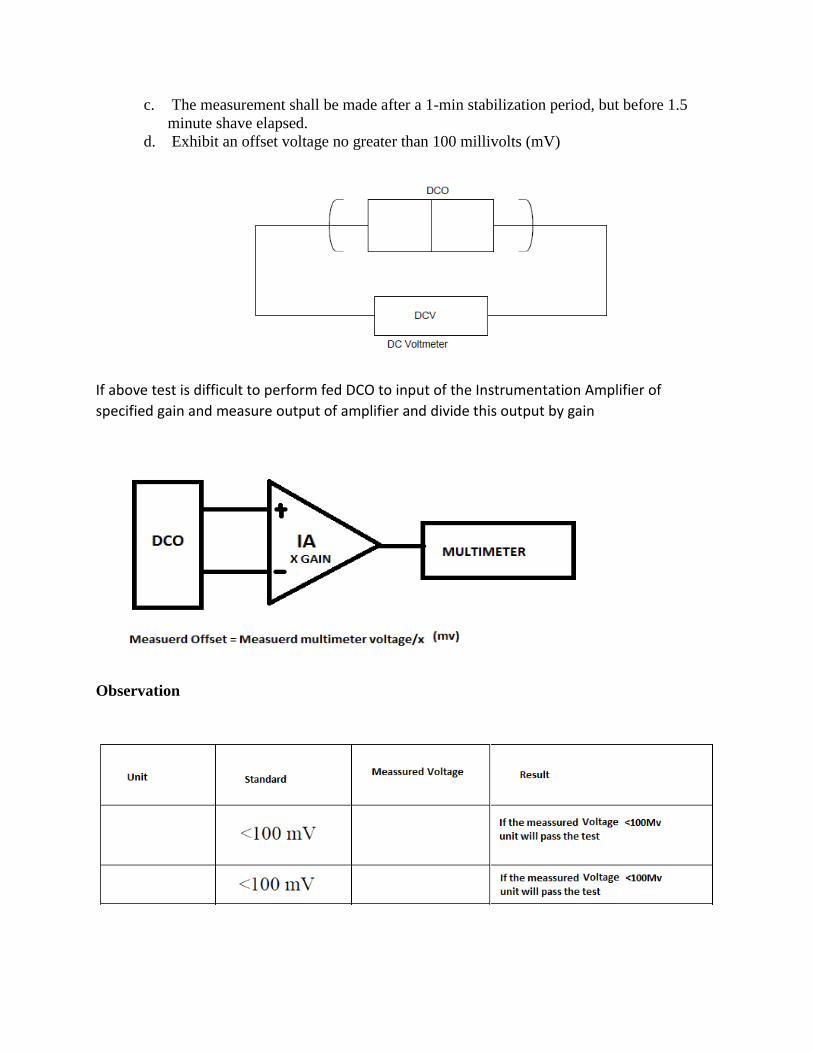
c. The measurement shall be made after a 1-min stabilization period, but before 1.5
minute shave elapsed.
d. Exhibit an offset voltage no greater than 100 millivolts (mV)
If above test is difficult to perform fed DCO to input of the Instrumentation Amplifier of
specified gain and measure output of amplifier and divide this output by gain
Observation
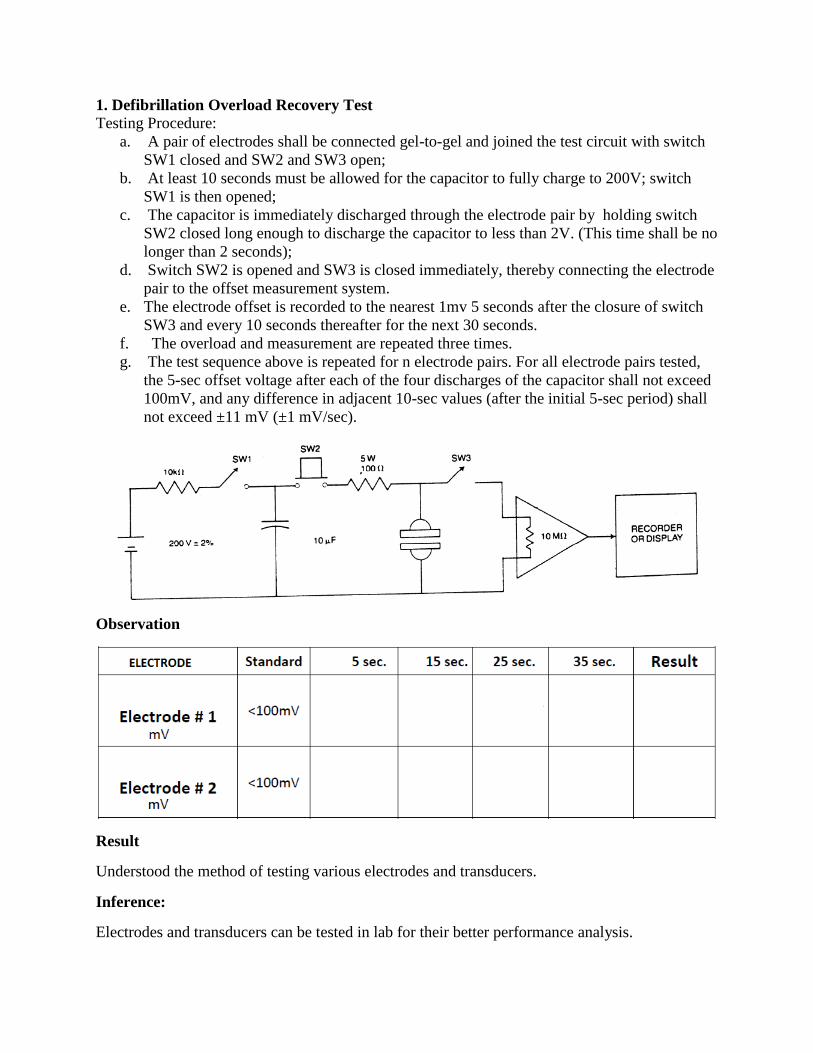
1. Defibrillation Overload Recovery Test
Testing Procedure:
a. A pair of electrodes shall be connected gel-to-gel and joined the test circuit with switch
SW1 closed and SW2 and SW3 open;
b. At least 10 seconds must be allowed for the capacitor to fully charge to 200V; switch
SW1 is then opened;
c. The capacitor is immediately discharged through the electrode pair by holding switch
SW2 closed long enough to discharge the capacitor to less than 2V. (This time shall be no
longer than 2 seconds);
d. Switch SW2 is opened and SW3 is closed immediately, thereby connecting the electrode
pair to the offset measurement system.
e. The electrode offset is recorded to the nearest 1mv 5 seconds after the closure of switch
SW3 and every 10 seconds thereafter for the next 30 seconds.
f. The overload and measurement are repeated three times.
g. The test sequence above is repeated for n electrode pairs. For all electrode pairs tested,
the 5-sec offset voltage after each of the four discharges of the capacitor shall not exceed
100mV, and any difference in adjacent 10-sec values (after the initial 5-sec period) shall
not exceed ±11 mV (±1 mV/sec).
Observation
Result
Understood the method of testing various electrodes and transducers.
Inference:
Electrodes and transducers can be tested in lab for their better performance analysis.