Embed Size (px)
Citation preview
BULLETIN OF THE POLISH ACADEMY OF SCIENCES
TECHNICAL SCIENCES, Vol. 59, No. 2, 2011
DOI: 10.2478/v10175-011-0020-3
Lab-on-a-chip fluorescence detection with image sensor
and software-based image conditioning
R. WALCZAK1,2∗
1 Faculty of Microsystem Electronics and Photonics, Wrocław University of Technology, 11/17 Janiszewski St., 50-372 Wrocław, Poland2 Institute of Electron Technology, 32/46 Lotników Ave., 02-668 Warszawa, Poland
Abstract. The fluorometric detection in lab-on-a-chip devices for life-sciences is one of the main detection methods. Well know from
“large-scale” analytical chemistry methodologies and instrumentation has been applied in lab-on-a-chip solutions. In most cases, optical
instrumentation for fluorescence induction and detection is based on configuration and components borrowed from large laboratory instru-
ments. As a result, optical instrumentation surrounding lab-on-a-chip is bulky, expensive and dedicated for operation only inside laboratory.
In this paper a discussion on fluorescence detection in lab-on-a-chip is carried out. A novel image sensor – based detection instrumentation
co-working with a “clever” software is described. Instrumentation is dedicated for operation in portable and low-cost devices for different
life-science applications. Examples of applications of the novel method and instrumentation co-working with various lab-on-a-chips are
presented on the base of author’s works.
Key words: fluorescence, microfluidics, lab-on-a-chip, point-of-care.
1. Introduction
Lab-on-a-chip (LOC) integrates on single substrate (chip) one
or more laboratory steps well known in an analytical chem-
istry, like sample handling, analysis and detection, but car-
ried out on a few picoliters to hundreds of nanolioters range
of sample volume. Compared with macroscale devices for
analytical chemistry, LOC systems engender significant ad-
vantages in terms of speed, throughput, yield, selectivity and
control. In spite of many advantages of LOC, some issues will
arise while analytical systems are miniaturized. One of them
is microscale detection in LOC. Effective detection within
LOC is clearly defined by a close interrelationship of fac-
tors such as volume of detected sample, detector sensitivity,
response times, detection limits and information content. Ap-
plication of LOC leads to decrease of analyte available for
detection. Reduction of analyzed volume means reduction in
detection volume and making it more difficult to detect [1].
For example, with 10 µL volume of detection volume it is
possible to reach concentration detection limit in order of
10−10 mol/L, whereas for 10 pL of detection volume, detec-
tion limit decreases to 10−4 mol/L [1]. Therefore, only high
sensitivity and expensive sensing instrumentation have to be
applied to ensure proper detection of various signals from
nano- and picoliter volumes of analyte. What more, sensing
problems arise while LOC is a part of point-of-care (POC)
device, where portability, sensitivity, power requirements and
price are major challenging factors.
One of the most commonly applied detection method in
both macroscale analytical chemistry and LOC is based on
fluorescence readout. LOC co-working with fluorescence de-
tection systems are widely applied at laboratory level in many
fields of life-sciences – for example in separation and de-
tection of biological material by electrophoresis [2] or ana-
lyze of genetic material by polymerase chain reaction (PCR)
with real-time analyze of amplification kinetics (real-time
PCR) [3]. However, it is obvious that “conventional” laborato-
ry fluorescence detection systems are too bulky and expensive
to be applied in POC devices. Therefore, new methodologies
and technical solutions must be used to fulfill requirements
of LOC POC devices.
2. Detection of fluorescence in LOC
Two main issues have to be taken into account while fluores-
cence detection in LOC is considered: (1) construction and
material of LOC and (2) fluorescence induction and detection
methodology and instrumentation.
Construction of LOC is very often forced by the materi-
al of LOC. From point of view of LOC material, two main
requirements have to be fulfilled: (1) optical transparency nec-
essary for introduction of the fluorescence excitation light and
collection of the fluorescence light from an area of interest
within the chip, and (2) low autofluorescence of LOC’s ma-
terial to minimize optical background signal. The chips can
be whole made as multilayer construction of light-transparent
materials – like glass, PDMS, SU-8, COC or other polymers,
or only a top cover of the chip is made of these materials
whereas body of the chip is made of silicon or ceramic [4–
11]. It is also possible to make LOC from non-transparent
materials like low-temperature co-fired ceramics (LTCC) but
an integration of optical waveguides enabling introduction of
the fluorescence inducing light into a detection chamber and
covered with glass or PDMS is necessary [12]. Technology
of LOC involves many microengineering and microelectronic
techniques enabling selective etching, deposition and bond-
∗e-mail: [email protected]
157
R. Walczak
ing of few layers [13, 14]. While choosing LOC material, the
autofluorescence effect of polymers have to be considered.
The lowest autofluorescence signal is observed for borosil-
icate glass, PDMS or COC [15], the highest for PMMA or
SU-8 [15, 16]. It is also confirmed that longer excitation wave-
length causes lower autofluorescence signal. Therefore, in vis-
ible light region fluorescence detection, “red” light sources for
fluorescence induction are preferred.
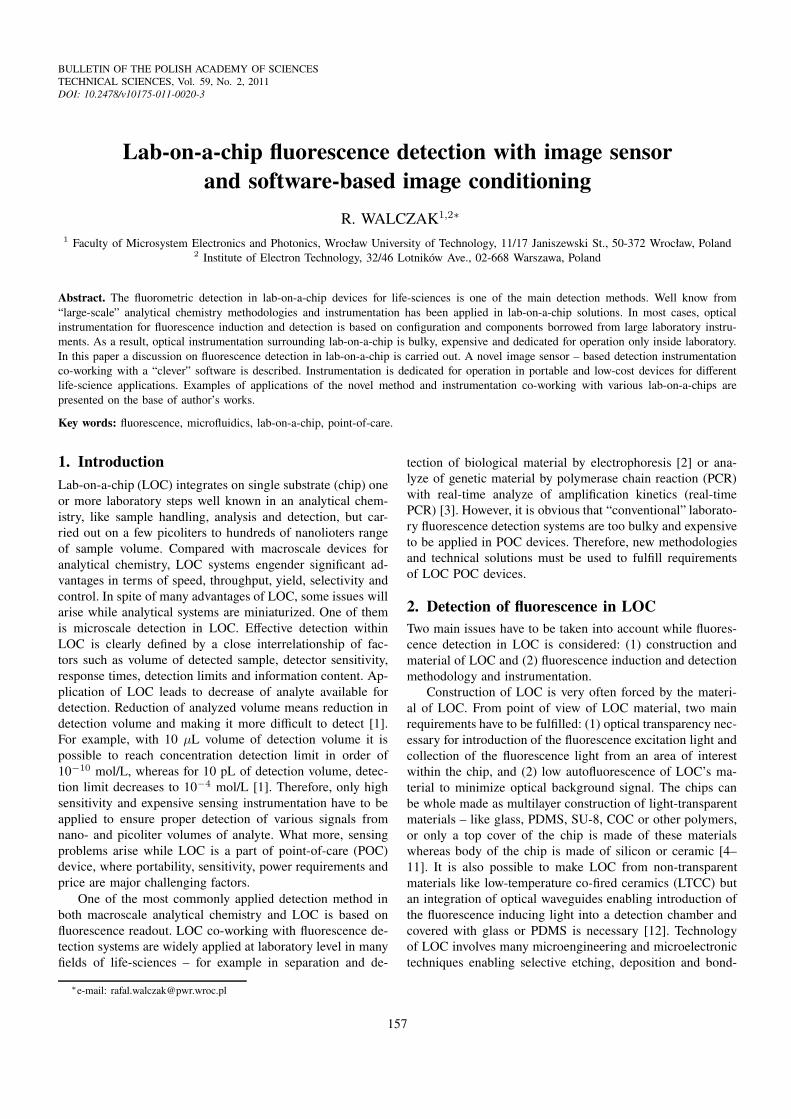
Commonly used compact apparatus for fluorescence in-
duction and detection in LOC is an epifluorescence micro-
scope or devices with configuration of the optical paths sim-
ilar to applied in this microscope (Fig. 1).
Fig. 1. Scheme of the typical optical path for fluorescence excitation
and detection co-working with lab-on-a-chip
In these devices, two optical channels are distinguished:
the fluorescence induction channel and the fluorescence de-
tection channel. Fluorescence induction light, usually in a
visible light range, comes from halogen, tungsten or xenon
lamp, rather light emitting diode (LED) or a laser. The light
is restricted to a narrow range of wavelengths that can ef-
fectively excitate the fluorochrome and be strongly excluded
by the detection channel. The narrow wavelength range is
ensured by one or more interference filter(s) and a dichroic
mirror(s). In the detection channel, fluorescence light emitted
by the fluorochrome is collected by the microscope objective
with proper magnification, and guided to a photodetector by
passing through filter(s) and dichroic mirror(s) to exclude the
excitation light. Common detectors are cooled photomultiplier
tubes (PMT) [5, 6, 11], semiconductor photodiodes [7, 9, 10],
rather cooled charge coupled devices (CCD) as sensing matrix
in video cameras [4] or lines in spectrophotometers [8].
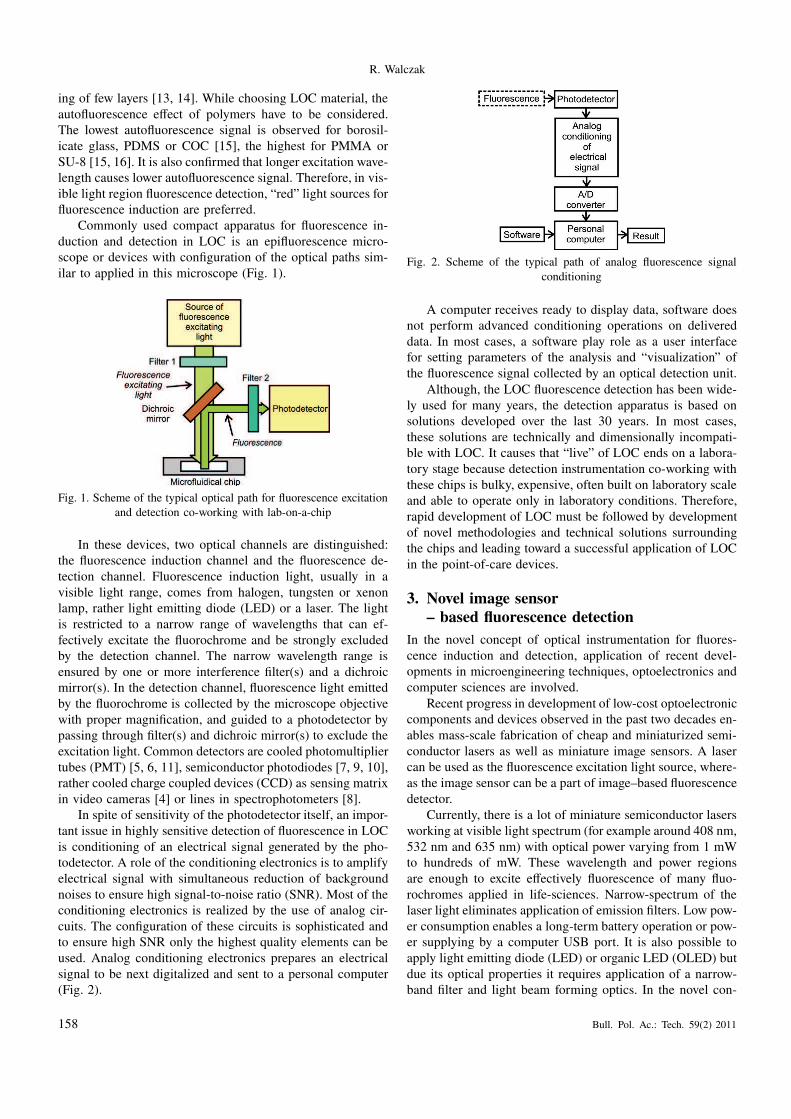
In spite of sensitivity of the photodetector itself, an impor-
tant issue in highly sensitive detection of fluorescence in LOC
is conditioning of an electrical signal generated by the pho-
todetector. A role of the conditioning electronics is to amplify
electrical signal with simultaneous reduction of background
noises to ensure high signal-to-noise ratio (SNR). Most of the
conditioning electronics is realized by the use of analog cir-
cuits. The configuration of these circuits is sophisticated and
to ensure high SNR only the highest quality elements can be
used. Analog conditioning electronics prepares an electrical
signal to be next digitalized and sent to a personal computer
(Fig. 2).
Fig. 2. Scheme of the typical path of analog fluorescence signal
conditioning
A computer receives ready to display data, software does
not perform advanced conditioning operations on delivered
data. In most cases, a software play role as a user interface
for setting parameters of the analysis and “visualization” of
the fluorescence signal collected by an optical detection unit.
Although, the LOC fluorescence detection has been wide-
ly used for many years, the detection apparatus is based on
solutions developed over the last 30 years. In most cases,
these solutions are technically and dimensionally incompati-
ble with LOC. It causes that “live” of LOC ends on a labora-
tory stage because detection instrumentation co-working with
these chips is bulky, expensive, often built on laboratory scale
and able to operate only in laboratory conditions. Therefore,
rapid development of LOC must be followed by development
of novel methodologies and technical solutions surrounding
the chips and leading toward a successful application of LOC
in the point-of-care devices.
3. Novel image sensor
– based fluorescence detection
In the novel concept of optical instrumentation for fluores-
cence induction and detection, application of recent devel-
opments in microengineering techniques, optoelectronics and
computer sciences are involved.
Recent progress in development of low-cost optoelectronic
components and devices observed in the past two decades en-
ables mass-scale fabrication of cheap and miniaturized semi-
conductor lasers as well as miniature image sensors. A laser
can be used as the fluorescence excitation light source, where-
as the image sensor can be a part of image–based fluorescence
detector.
Currently, there is a lot of miniature semiconductor lasers
working at visible light spectrum (for example around 408 nm,
532 nm and 635 nm) with optical power varying from 1 mW
to hundreds of mW. These wavelength and power regions
are enough to excite effectively fluorescence of many fluo-
rochromes applied in life-sciences. Narrow-spectrum of the
laser light eliminates application of emission filters. Low pow-
er consumption enables a long-term battery operation or pow-
er supplying by a computer USB port. It is also possible to
apply light emitting diode (LED) or organic LED (OLED) but
due its optical properties it requires application of a narrow-
band filter and light beam forming optics. In the novel con-
158 Bull. Pol. Ac.: Tech. 59(2) 2011
Lab-on-a-chip fluorescence detection with image sensor and software-based image conditioning
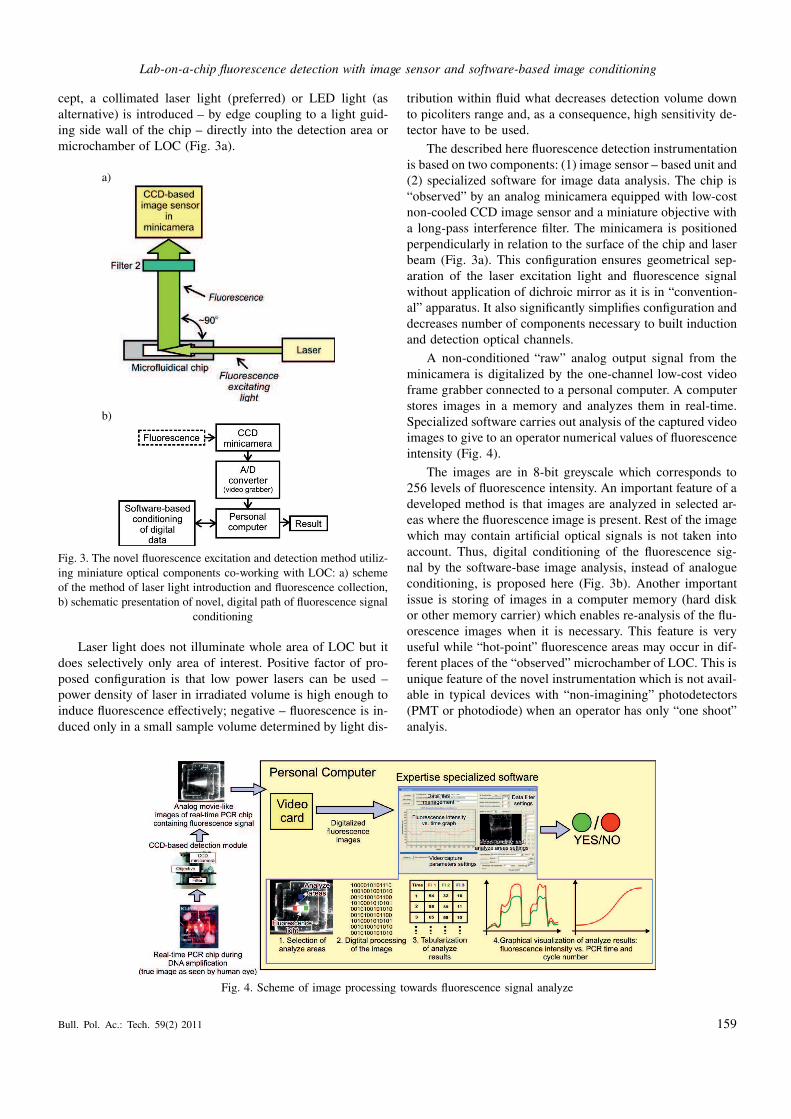
cept, a collimated laser light (preferred) or LED light (as
alternative) is introduced – by edge coupling to a light guid-
ing side wall of the chip – directly into the detection area or
microchamber of LOC (Fig. 3a).
a)
b)
Fig. 3. The novel fluorescence excitation and detection method utiliz-
ing miniature optical components co-working with LOC: a) scheme
of the method of laser light introduction and fluorescence collection,
b) schematic presentation of novel, digital path of fluorescence signal
conditioning
Laser light does not illuminate whole area of LOC but it
does selectively only area of interest. Positive factor of pro-
posed configuration is that low power lasers can be used –
power density of laser in irradiated volume is high enough to
induce fluorescence effectively; negative – fluorescence is in-
duced only in a small sample volume determined by light dis-
tribution within fluid what decreases detection volume down
to picoliters range and, as a consequence, high sensitivity de-
tector have to be used.
The described here fluorescence detection instrumentation
is based on two components: (1) image sensor – based unit and
(2) specialized software for image data analysis. The chip is
“observed” by an analog minicamera equipped with low-cost
non-cooled CCD image sensor and a miniature objective with
a long-pass interference filter. The minicamera is positioned
perpendicularly in relation to the surface of the chip and laser
beam (Fig. 3a). This configuration ensures geometrical sep-
aration of the laser excitation light and fluorescence signal
without application of dichroic mirror as it is in “convention-
al” apparatus. It also significantly simplifies configuration and
decreases number of components necessary to built induction
and detection optical channels.
A non-conditioned “raw” analog output signal from the
minicamera is digitalized by the one-channel low-cost video
frame grabber connected to a personal computer. A computer
stores images in a memory and analyzes them in real-time.
Specialized software carries out analysis of the captured video
images to give to an operator numerical values of fluorescence
intensity (Fig. 4).
The images are in 8-bit greyscale which corresponds to
256 levels of fluorescence intensity. An important feature of a
developed method is that images are analyzed in selected ar-
eas where the fluorescence image is present. Rest of the image
which may contain artificial optical signals is not taken into
account. Thus, digital conditioning of the fluorescence sig-
nal by the software-base image analysis, instead of analogue
conditioning, is proposed here (Fig. 3b). Another important
issue is storing of images in a computer memory (hard disk
or other memory carrier) which enables re-analysis of the flu-
orescence images when it is necessary. This feature is very
useful while “hot-point” fluorescence areas may occur in dif-
ferent places of the “observed” microchamber of LOC. This is
unique feature of the novel instrumentation which is not avail-
able in typical devices with “non-imagining” photodetectors
(PMT or photodiode) when an operator has only “one shoot”
analyis.
Fig. 4. Scheme of image processing towards fluorescence signal analyze
Bull. Pol. Ac.: Tech. 59(2) 2011 159
R. Walczak
The comparison of main technical features of fluorescence
induction and detection by “conventional” apparatus and pre-
sented here novel instrumentation are shown in Table 1.
Table 1
FeatureInstrumentation based
on epifluorescencemicroscope
Novel
instrumentation
Optical
channels
configuration
Dual channels with optical
and geometrical separation by
so called “filter/mirror cube”
Dual channels with op-
tical and geometrical or-
thogonal separation
Components
of fluorescence
induction
channel
1) High power and bulky
lamp or laser, rather LED
2) Set of filter, dichroic mirror
and light beam forming lenses
1) Semiconductor minia-
turized low-power laser
with collimating lens
Components
of fluorescence
induction
channel
1) Cooled PMT, silicon pho-
todiode, rather cooled CCD
matrix or line
2) Set of filter, dichroic mirror
and lenses
1) Miniature CCD im-
age sensor-based mini-
camera
2) Miniobjective with
filter
Signal
conditioning
Analog, no software condi-
tioning
Digital, advanced soft-
ware-based analyze
Power
requirements
High power light sources and
cooling facilities, tenths to
hundreds of Watts necessary
for power supplying
Power consumption be-
low 2.5 W all compo-
nents can be supplied by
USB port
Size,
portability
Desktop size works as non-
portable instruments
Hand-held size, dedicat-
ed for portable instru-
ments
4. Examples of applications
of novel fluorescence readout instrumentation
A novel fluorescence detection instrumentation co-working
with various LOC has been successfully applied in some
life-science applications, recently. Some examples are pre-
sented here: starting with portable real-time PCR DNA an-
alyzer, than on-chip DNA gel electrophoresis setup, minia-
ture microcytometer for optical characterization of biosam-
ples, LOC for apoptosis detection in mouse embryos, finishing
with a portable reader for cocaine detection in human’s sweat.
4.1. DNA analyzer by real-time PCR – detection of food
pathogens. Described here optical instrumentation became
a part of device for food pathogens detection developed under
European 6. Framework Programme OPTOLABCARD [17].
The goal of the project was to develop LOC-based compact
instrumentation enabling detection of Salmonella spp. in hu-
man samples and Campylobacter j. in broiler chicken farms,
by utilizing the real-time PCR technique [18, 19].
The disposable LOC (1× 1 cm2), made of negative pho-
toresist SU-8 and glass, has integrated a heater and a tem-
perature sensor [2]. LOC is placed in a plastic chip holder
(2.8 × 2.8 × 0.5 cm3) with integrated electrical contacts to
the chip and some electronic circuits for temperature manage-
ment of 2.5 µl in volume PCR microchamber of LOC. The
chip holder has a miniature electrical connection to the spe-
cialized PCR temperature controller connected to computer.
The holder with ready to use LOC is positioned in a docking
station (15× 5× 7 cm3) in the way ensuring the direct laser
light introduction into PCR microchamber and fluorescence
light collection [20]. The laser light (636 nm) does not il-
luminate whole PCR microchamber but it does only part of
the chamber which corresponds to the laser light cone distri-
bution. Therefore, fluorescence is induced and emitted from
volume in the pL range. A view of the chip and hand-held
docking station with a positioned chip holder just before start
of PCR process is shown in Fig. 5.
a) b)
Fig. 5. Portable real-time PCR DNA analyzer: a) SU-8/glass LOC
in comparison to a paper clip, b) view of docking station ready to
work at Food Laboratory of Danish Technical University
The pre-validation tests of LOC – based system for de-
tection of Campylobacter j. were carried out with 48 chicken
fecal samples [19]. All the steps – from sample preparation
to final result – were performed in the single chip with 2.5 µl
volume of reagents. The ratio of PCR efficiencies between on-
chip and on-tube was up to 300%. The sensitivity of on-chip
PCR was determined as 0.7–7 ng/ml of template DNA. It is
on the same level as on-tube PCR. The real-time PCR process
took 30 min – at least 4 times shorter than PCR on-tube.
a)
b)
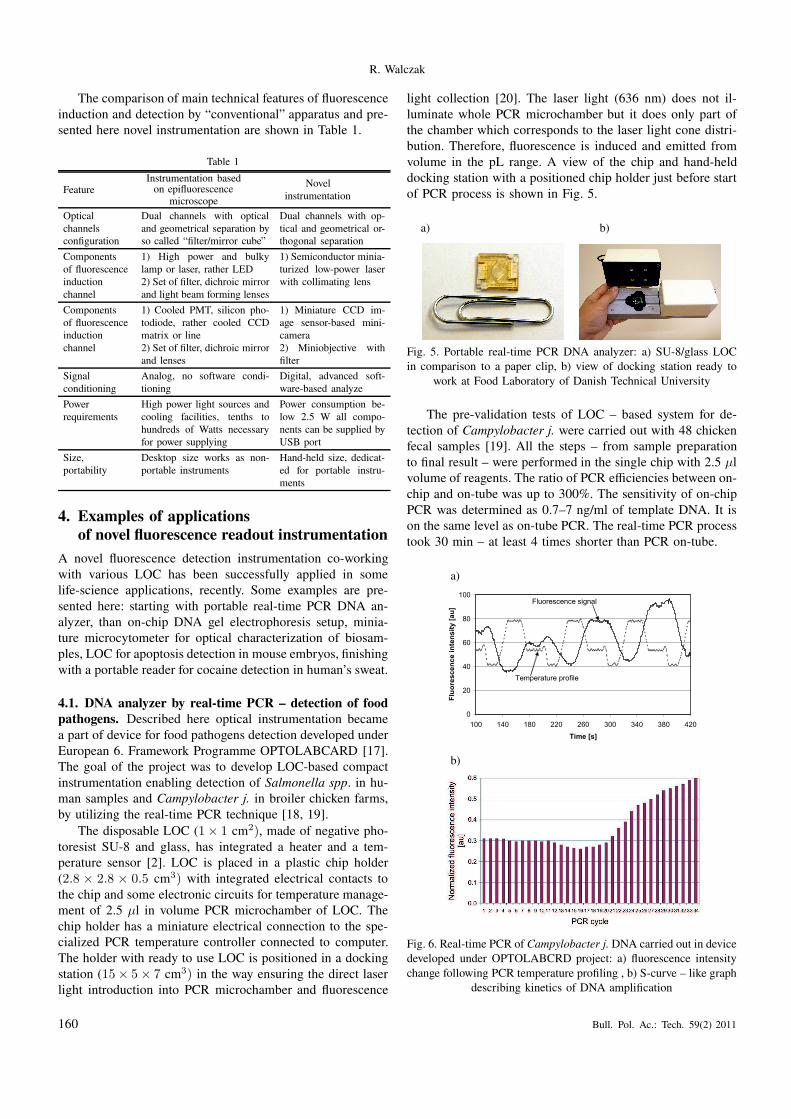
Fig. 6. Real-time PCR of Campylobacter j. DNA carried out in device
developed under OPTOLABCRD project: a) fluorescence intensity
change following PCR temperature profiling , b) S-curve – like graph
describing kinetics of DNA amplification
160 Bull. Pol. Ac.: Tech. 59(2) 2011
Lab-on-a-chip fluorescence detection with image sensor and software-based image conditioning
An example of the fluorescence intensity change of TO-
PRO 3 fluorochrome (BioScience, USA) and DNA complex
following temperature profiling is shown in Fig. 6a. S-curve
graph of real-time PCR process, describing DNA amplifica-
tion kinetics, has been compiled on the base of average flu-
orescence intensity during extension step of each PCR cycle
(Fig. 6b). The obtained S-curve is similar to the characteristic
achieved by the use of the chip observed under epifluores-
cence microscope equipped with PMT as the reference.
Carried out pre-validation tests confirmed usefulness of
the developed optical instrumentation, as well as the whole
LOC-based system, for a real-time PCR detection of Campy-
lobacter j. Further tests of similar LOC-based solutions car-
ried out by under Polish projects gave us real-time PCR posi-
tive results with detection of E. Coli or complementary DNA
of genetic material from woman breast cancer [21].
4.2. DNA analyze by on-chip gel electrophoresis separa-
tion. In spite of the real-time specific detection of DNA am-
plified during real-time PCR, the post-PCR DNA detection
and identification by electrophoresis are also commonly used.
A miniature system for gel electrophoresis of DNA with a flu-
orometric detection consists of LOC placed in a plastic chip
holder, a fluorescence detection unit and high voltage elec-
trophoresis driving a power supplier [22]. A chip holder en-
ables introduction of fluids into the chip and electrical con-
nections of fluid reservoirs to the high voltage power supplier.
The construction of the holder ensures proper introduction of
the red (636 nm) laser light into a detection area of the mi-
crochannel and the collection of the fluorescence light by the
CCD minicamera-based detection unit (Fig. 7a).
a)
b)
Fig. 7. DNA gel electrophoresis with on-chip real-time fluoromet-
ric detection: a) scheme of the measurement set-up, b) view of the
all-glass LOC for gel electrophoresis in comparison to a paper clip
The microfluidical chip is as a whole made of borosilicate
glass (Fig. 7b). One of the glass substrates is micromachined
by wet etching to obtain T-shape cross-section of 560 µm
wide and 30 µm deep microchannels. The second substrate
has drilled holes for gel and fluids introduction. Both sub-
strates together with glass reservoirs are bonded in one process
by the use of high temperature direct bonding. After fabrica-
tion, the microchannels are filled with 10% polyakryloamid
gel according to procedure proposed by von Heeren’a [23].
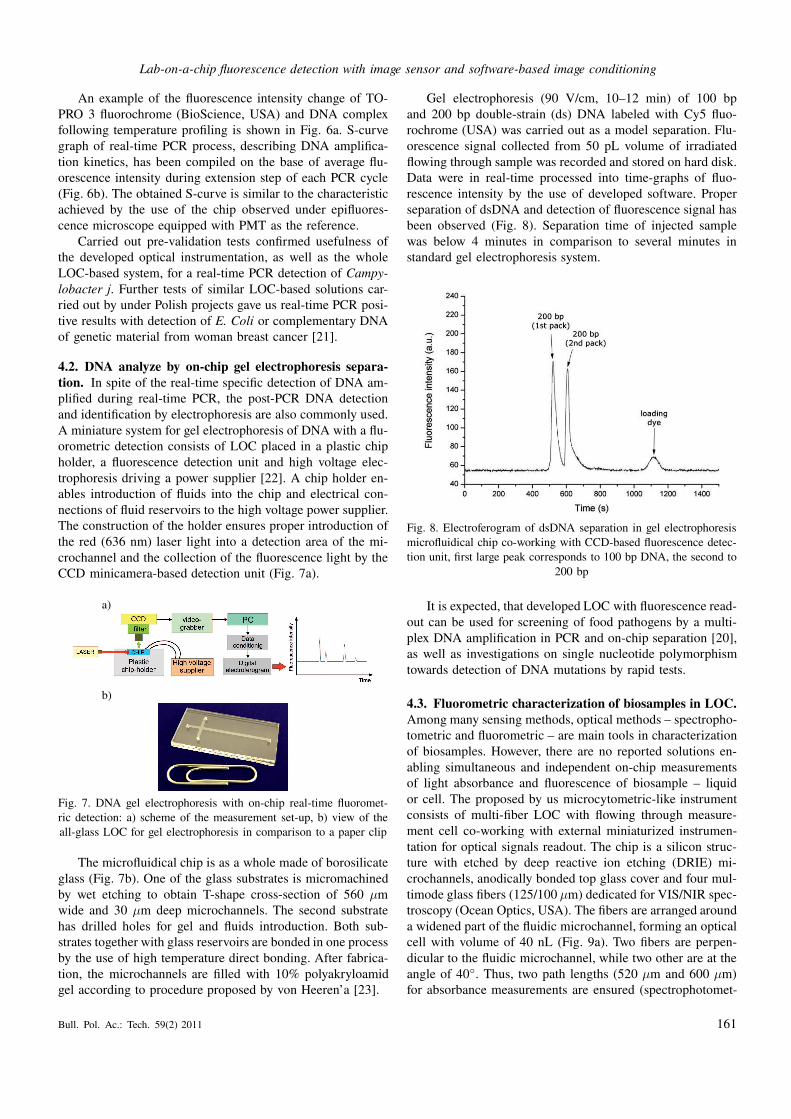
Gel electrophoresis (90 V/cm, 10–12 min) of 100 bp
and 200 bp double-strain (ds) DNA labeled with Cy5 fluo-
rochrome (USA) was carried out as a model separation. Flu-
orescence signal collected from 50 pL volume of irradiated
flowing through sample was recorded and stored on hard disk.
Data were in real-time processed into time-graphs of fluo-
rescence intensity by the use of developed software. Proper
separation of dsDNA and detection of fluorescence signal has
been observed (Fig. 8). Separation time of injected sample
was below 4 minutes in comparison to several minutes in
standard gel electrophoresis system.
Fig. 8. Electroferogram of dsDNA separation in gel electrophoresis
microfluidical chip co-working with CCD-based fluorescence detec-
tion unit, first large peak corresponds to 100 bp DNA, the second to
200 bp
It is expected, that developed LOC with fluorescence read-
out can be used for screening of food pathogens by a multi-
plex DNA amplification in PCR and on-chip separation [20],
as well as investigations on single nucleotide polymorphism
towards detection of DNA mutations by rapid tests.
4.3. Fluorometric characterization of biosamples in LOC.
Among many sensing methods, optical methods – spectropho-
tometric and fluorometric – are main tools in characterization
of biosamples. However, there are no reported solutions en-
abling simultaneous and independent on-chip measurements
of light absorbance and fluorescence of biosample – liquid
or cell. The proposed by us microcytometric-like instrument
consists of multi-fiber LOC with flowing through measure-
ment cell co-working with external miniaturized instrumen-
tation for optical signals readout. The chip is a silicon struc-
ture with etched by deep reactive ion etching (DRIE) mi-
crochannels, anodically bonded top glass cover and four mul-
timode glass fibers (125/100 µm) dedicated for VIS/NIR spec-
troscopy (Ocean Optics, USA). The fibers are arranged around
a widened part of the fluidic microchannel, forming an optical
cell with volume of 40 nL (Fig. 9a). Two fibers are perpen-
dicular to the fluidic microchannel, while two other are at the
angle of 40◦. Thus, two path lengths (520 µm and 600 µm)
for absorbance measurements are ensured (spectrophotomet-
Bull. Pol. Ac.: Tech. 59(2) 2011 161
R. Walczak
ric measurements are described in [24]). During the fluores-
cence measurements, the excitation light – emitted by LED
or laser – os coupled into a chosen fiber and transmitted to
the measurement cell of LOC. Fluorescence light emitted by
the fluorochrome labeled sample is collected by described
here fluorescence detection system based on CCD image sen-
sor co-working with miniobjective with ×20 magnifications
and interference filters: long-pass 500 nm for fluorescein or
650 nm for TO-PRO 3 fluorochromes (Fig. 9b). Collected
images are conditioned in the same way as in real-time PCR
application described earlier.
a)
b)
Fig. 9. Multi-fiber microcytometer: a) image of the optical cell with
4 integrated fibers, b) view of the test setup with CCD minicamera
as fluorescence detector on the top of packaged microcytometer
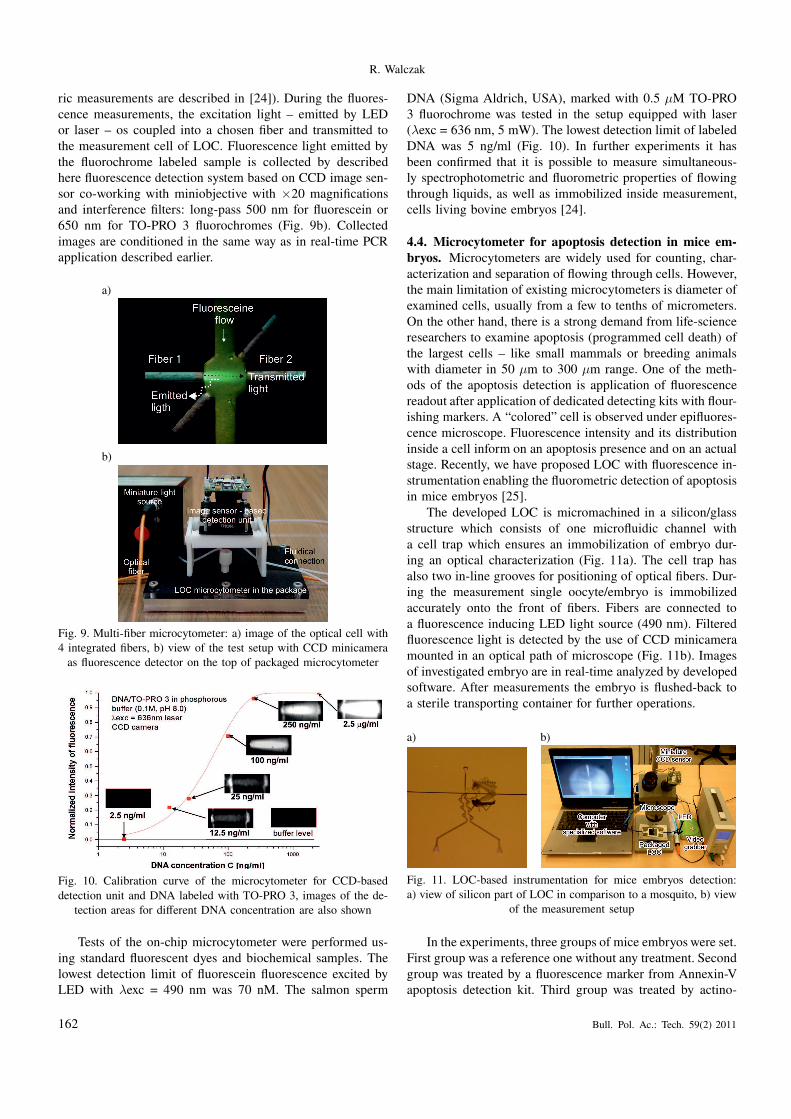
Fig. 10. Calibration curve of the microcytometer for CCD-based
detection unit and DNA labeled with TO-PRO 3, images of the de-
tection areas for different DNA concentration are also shown
Tests of the on-chip microcytometer were performed us-
ing standard fluorescent dyes and biochemical samples. The
lowest detection limit of fluorescein fluorescence excited by
LED with λexc = 490 nm was 70 nM. The salmon sperm
DNA (Sigma Aldrich, USA), marked with 0.5 µM TO-PRO
3 fluorochrome was tested in the setup equipped with laser
(λexc = 636 nm, 5 mW). The lowest detection limit of labeled
DNA was 5 ng/ml (Fig. 10). In further experiments it has
been confirmed that it is possible to measure simultaneous-
ly spectrophotometric and fluorometric properties of flowing
through liquids, as well as immobilized inside measurement,
cells living bovine embryos [24].
4.4. Microcytometer for apoptosis detection in mice em-
bryos. Microcytometers are widely used for counting, char-
acterization and separation of flowing through cells. However,
the main limitation of existing microcytometers is diameter of
examined cells, usually from a few to tenths of micrometers.
On the other hand, there is a strong demand from life-science
researchers to examine apoptosis (programmed cell death) of
the largest cells – like small mammals or breeding animals
with diameter in 50 µm to 300 µm range. One of the meth-
ods of the apoptosis detection is application of fluorescence
readout after application of dedicated detecting kits with flour-
ishing markers. A “colored” cell is observed under epifluores-
cence microscope. Fluorescence intensity and its distribution
inside a cell inform on an apoptosis presence and on an actual
stage. Recently, we have proposed LOC with fluorescence in-
strumentation enabling the fluorometric detection of apoptosis
in mice embryos [25].
The developed LOC is micromachined in a silicon/glass
structure which consists of one microfluidic channel with
a cell trap which ensures an immobilization of embryo dur-
ing an optical characterization (Fig. 11a). The cell trap has
also two in-line grooves for positioning of optical fibers. Dur-
ing the measurement single oocyte/embryo is immobilized
accurately onto the front of fibers. Fibers are connected to
a fluorescence inducing LED light source (490 nm). Filtered
fluorescence light is detected by the use of CCD minicamera
mounted in an optical path of microscope (Fig. 11b). Images
of investigated embryo are in real-time analyzed by developed
software. After measurements the embryo is flushed-back to
a sterile transporting container for further operations.
a) b)
Fig. 11. LOC-based instrumentation for mice embryos detection:
a) view of silicon part of LOC in comparison to a mosquito, b) view
of the measurement setup
In the experiments, three groups of mice embryos were set.
First group was a reference one without any treatment. Second
group was treated by a fluorescence marker from Annexin-V
apoptosis detection kit. Third group was treated by actino-
162 Bull. Pol. Ac.: Tech. 59(2) 2011
Lab-on-a-chip fluorescence detection with image sensor and software-based image conditioning
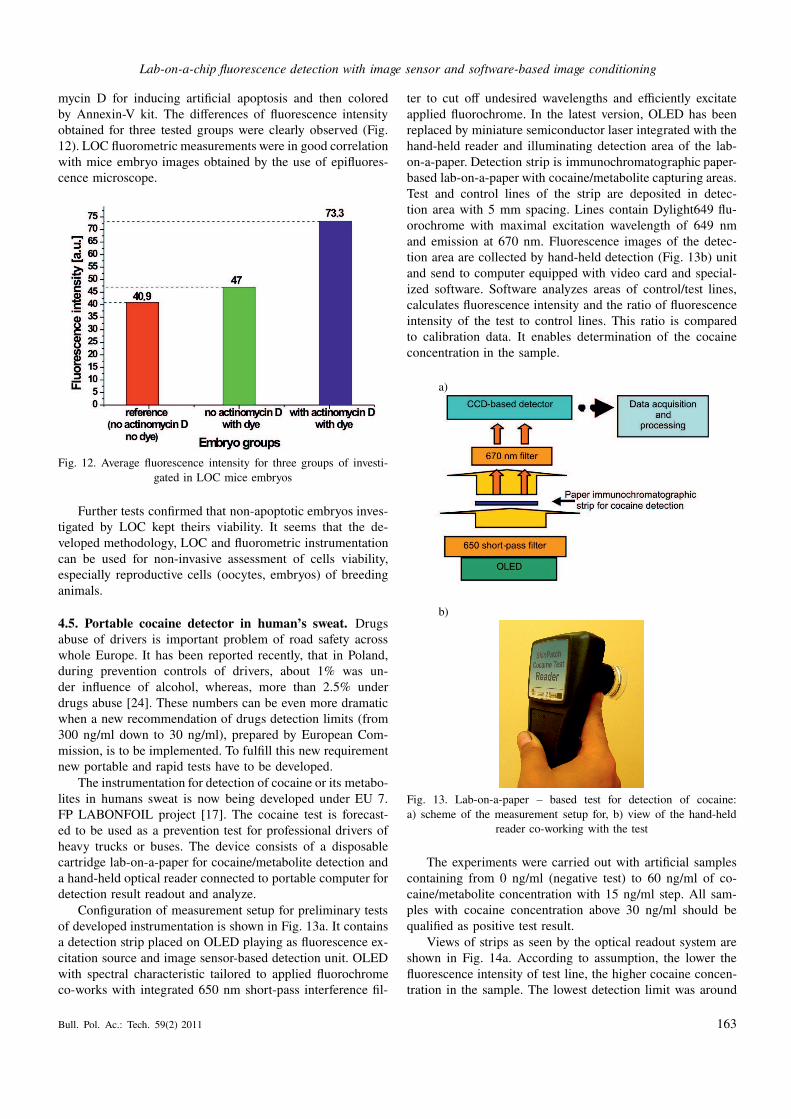
mycin D for inducing artificial apoptosis and then colored
by Annexin-V kit. The differences of fluorescence intensity
obtained for three tested groups were clearly observed (Fig.
12). LOC fluorometric measurements were in good correlation
with mice embryo images obtained by the use of epifluores-
cence microscope.
Fig. 12. Average fluorescence intensity for three groups of investi-
gated in LOC mice embryos
Further tests confirmed that non-apoptotic embryos inves-
tigated by LOC kept theirs viability. It seems that the de-
veloped methodology, LOC and fluorometric instrumentation
can be used for non-invasive assessment of cells viability,
especially reproductive cells (oocytes, embryos) of breeding
animals.
4.5. Portable cocaine detector in human’s sweat. Drugs
abuse of drivers is important problem of road safety across
whole Europe. It has been reported recently, that in Poland,
during prevention controls of drivers, about 1% was un-
der influence of alcohol, whereas, more than 2.5% under
drugs abuse [24]. These numbers can be even more dramatic
when a new recommendation of drugs detection limits (from
300 ng/ml down to 30 ng/ml), prepared by European Com-
mission, is to be implemented. To fulfill this new requirement
new portable and rapid tests have to be developed.
The instrumentation for detection of cocaine or its metabo-
lites in humans sweat is now being developed under EU 7.
FP LABONFOIL project [17]. The cocaine test is forecast-
ed to be used as a prevention test for professional drivers of
heavy trucks or buses. The device consists of a disposable
cartridge lab-on-a-paper for cocaine/metabolite detection and
a hand-held optical reader connected to portable computer for
detection result readout and analyze.
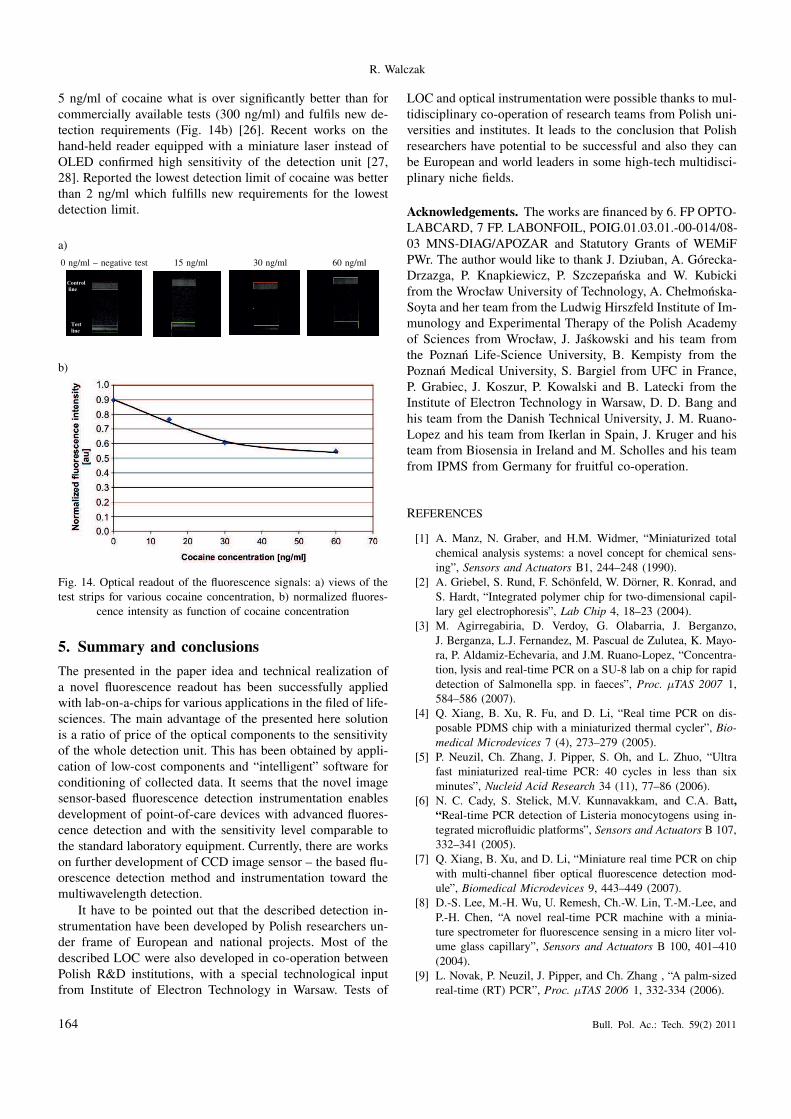
Configuration of measurement setup for preliminary tests
of developed instrumentation is shown in Fig. 13a. It contains
a detection strip placed on OLED playing as fluorescence ex-
citation source and image sensor-based detection unit. OLED
with spectral characteristic tailored to applied fluorochrome
co-works with integrated 650 nm short-pass interference fil-
ter to cut off undesired wavelengths and efficiently excitate
applied fluorochrome. In the latest version, OLED has been
replaced by miniature semiconductor laser integrated with the
hand-held reader and illuminating detection area of the lab-
on-a-paper. Detection strip is immunochromatographic paper-
based lab-on-a-paper with cocaine/metabolite capturing areas.
Test and control lines of the strip are deposited in detec-
tion area with 5 mm spacing. Lines contain Dylight649 flu-
orochrome with maximal excitation wavelength of 649 nm
and emission at 670 nm. Fluorescence images of the detec-
tion area are collected by hand-held detection (Fig. 13b) unit
and send to computer equipped with video card and special-
ized software. Software analyzes areas of control/test lines,
calculates fluorescence intensity and the ratio of fluorescence
intensity of the test to control lines. This ratio is compared
to calibration data. It enables determination of the cocaine
concentration in the sample.
a)
b)
Fig. 13. Lab-on-a-paper – based test for detection of cocaine:
a) scheme of the measurement setup for, b) view of the hand-held
reader co-working with the test
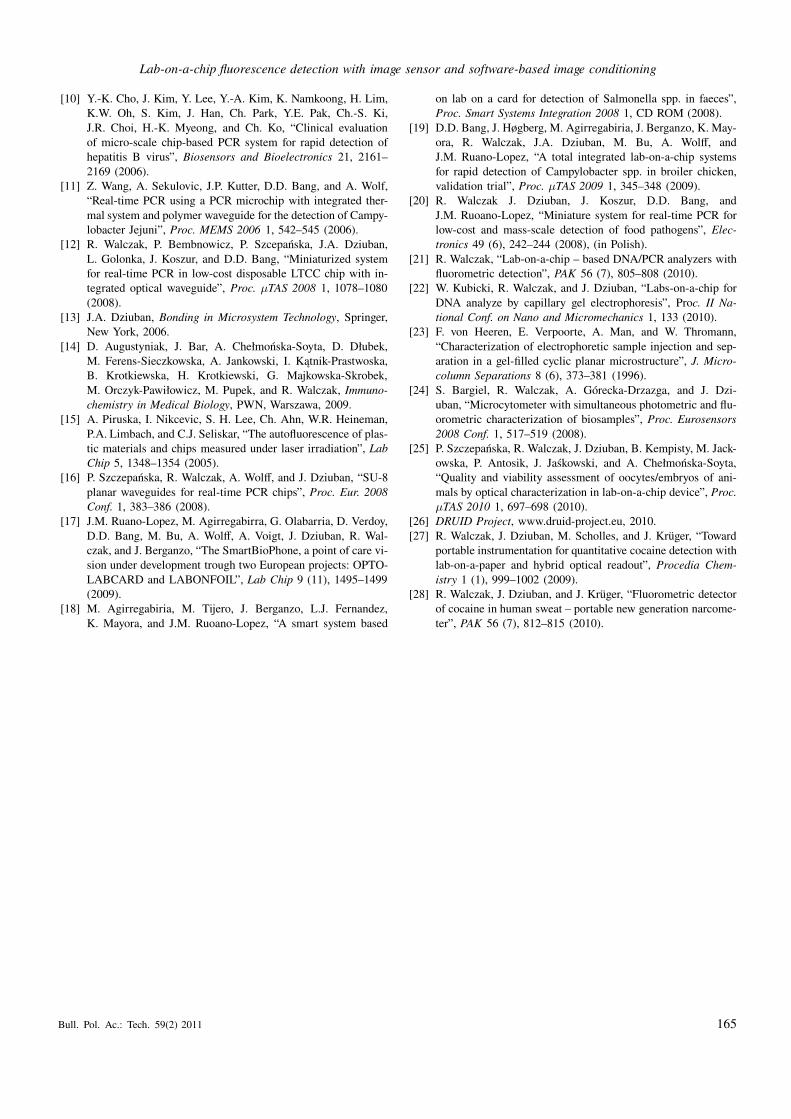
The experiments were carried out with artificial samples
containing from 0 ng/ml (negative test) to 60 ng/ml of co-
caine/metabolite concentration with 15 ng/ml step. All sam-
ples with cocaine concentration above 30 ng/ml should be
qualified as positive test result.
Views of strips as seen by the optical readout system are
shown in Fig. 14a. According to assumption, the lower the
fluorescence intensity of test line, the higher cocaine concen-
tration in the sample. The lowest detection limit was around
Bull. Pol. Ac.: Tech. 59(2) 2011 163
R. Walczak
5 ng/ml of cocaine what is over significantly better than for
commercially available tests (300 ng/ml) and fulfils new de-
tection requirements (Fig. 14b) [26]. Recent works on the
hand-held reader equipped with a miniature laser instead of
OLED confirmed high sensitivity of the detection unit [27,
28]. Reported the lowest detection limit of cocaine was better
than 2 ng/ml which fulfills new requirements for the lowest
detection limit.
a)
0 ng/ml – negative test 15 ng/ml 30 ng/ml 60 ng/ml
b)
Fig. 14. Optical readout of the fluorescence signals: a) views of the
test strips for various cocaine concentration, b) normalized fluores-
cence intensity as function of cocaine concentration
5. Summary and conclusions
The presented in the paper idea and technical realization of
a novel fluorescence readout has been successfully applied
with lab-on-a-chips for various applications in the filed of life-
sciences. The main advantage of the presented here solution
is a ratio of price of the optical components to the sensitivity
of the whole detection unit. This has been obtained by appli-
cation of low-cost components and “intelligent” software for
conditioning of collected data. It seems that the novel image
sensor-based fluorescence detection instrumentation enables
development of point-of-care devices with advanced fluores-
cence detection and with the sensitivity level comparable to
the standard laboratory equipment. Currently, there are works
on further development of CCD image sensor – the based flu-
orescence detection method and instrumentation toward the
multiwavelength detection.
It have to be pointed out that the described detection in-
strumentation have been developed by Polish researchers un-
der frame of European and national projects. Most of the
described LOC were also developed in co-operation between
Polish R&D institutions, with a special technological input
from Institute of Electron Technology in Warsaw. Tests of
LOC and optical instrumentation were possible thanks to mul-
tidisciplinary co-operation of research teams from Polish uni-
versities and institutes. It leads to the conclusion that Polish
researchers have potential to be successful and also they can
be European and world leaders in some high-tech multidisci-
plinary niche fields.
Acknowledgements. The works are financed by 6. FP OPTO-
LABCARD, 7 FP. LABONFOIL, POIG.01.03.01.-00-014/08-
03 MNS-DIAG/APOZAR and Statutory Grants of WEMiF
PWr. The author would like to thank J. Dziuban, A. Górecka-
Drzazga, P. Knapkiewicz, P. Szczepańska and W. Kubicki
from the Wrocław University of Technology, A. Chełmońska-
Soyta and her team from the Ludwig Hirszfeld Institute of Im-
munology and Experimental Therapy of the Polish Academy
of Sciences from Wrocław, J. Jaśkowski and his team from
the Poznań Life-Science University, B. Kempisty from the
Poznań Medical University, S. Bargiel from UFC in France,
P. Grabiec, J. Koszur, P. Kowalski and B. Latecki from the
Institute of Electron Technology in Warsaw, D. D. Bang and
his team from the Danish Technical University, J. M. Ruano-
Lopez and his team from Ikerlan in Spain, J. Kruger and his
team from Biosensia in Ireland and M. Scholles and his team
from IPMS from Germany for fruitful co-operation.
REFERENCES
[1] A. Manz, N. Graber, and H.M. Widmer, “Miniaturized total
chemical analysis systems: a novel concept for chemical sens-
ing”, Sensors and Actuators B1, 244–248 (1990).
[2] A. Griebel, S. Rund, F. Schonfeld, W. Dorner, R. Konrad, and
S. Hardt, “Integrated polymer chip for two-dimensional capil-
lary gel electrophoresis”, Lab Chip 4, 18–23 (2004).
[3] M. Agirregabiria, D. Verdoy, G. Olabarria, J. Berganzo,
J. Berganza, L.J. Fernandez, M. Pascual de Zulutea, K. Mayo-
ra, P. Aldamiz-Echevaria, and J.M. Ruano-Lopez, “Concentra-
tion, lysis and real-time PCR on a SU-8 lab on a chip for rapid
detection of Salmonella spp. in faeces”, Proc. µTAS 2007 1,
584–586 (2007).
[4] Q. Xiang, B. Xu, R. Fu, and D. Li, “Real time PCR on dis-
posable PDMS chip with a miniaturized thermal cycler”, Bio-
medical Microdevices 7 (4), 273–279 (2005).
[5] P. Neuzil, Ch. Zhang, J. Pipper, S. Oh, and L. Zhuo, “Ultra
fast miniaturized real-time PCR: 40 cycles in less than six
minutes”, Nucleid Acid Research 34 (11), 77–86 (2006).
[6] N. C. Cady, S. Stelick, M.V. Kunnavakkam, and C.A. Batt,
“Real-time PCR detection of Listeria monocytogens using in-
tegrated microfluidic platforms”, Sensors and Actuators B 107,
332–341 (2005).
[7] Q. Xiang, B. Xu, and D. Li, “Miniature real time PCR on chip
with multi-channel fiber optical fluorescence detection mod-
ule”, Biomedical Microdevices 9, 443–449 (2007).
[8] D.-S. Lee, M.-H. Wu, U. Remesh, Ch.-W. Lin, T.-M.-Lee, and
P.-H. Chen, “A novel real-time PCR machine with a minia-
ture spectrometer for fluorescence sensing in a micro liter vol-
ume glass capillary”, Sensors and Actuators B 100, 401–410
(2004).
[9] L. Novak, P. Neuzil, J. Pipper, and Ch. Zhang , “A palm-sized
real-time (RT) PCR”, Proc. µTAS 2006 1, 332-334 (2006).
164 Bull. Pol. Ac.: Tech. 59(2) 2011
Lab-on-a-chip fluorescence detection with image sensor and software-based image conditioning
[10] Y.-K. Cho, J. Kim, Y. Lee, Y.-A. Kim, K. Namkoong, H. Lim,
K.W. Oh, S. Kim, J. Han, Ch. Park, Y.E. Pak, Ch.-S. Ki,
J.R. Choi, H.-K. Myeong, and Ch. Ko, “Clinical evaluation
of micro-scale chip-based PCR system for rapid detection of
hepatitis B virus”, Biosensors and Bioelectronics 21, 2161–
2169 (2006).
[11] Z. Wang, A. Sekulovic, J.P. Kutter, D.D. Bang, and A. Wolf,
“Real-time PCR using a PCR microchip with integrated ther-
mal system and polymer waveguide for the detection of Campy-
lobacter Jejuni”, Proc. MEMS 2006 1, 542–545 (2006).
[12] R. Walczak, P. Bembnowicz, P. Szcepańska, J.A. Dziuban,
L. Golonka, J. Koszur, and D.D. Bang, “Miniaturized system
for real-time PCR in low-cost disposable LTCC chip with in-
tegrated optical waveguide”, Proc. µTAS 2008 1, 1078–1080
(2008).
[13] J.A. Dziuban, Bonding in Microsystem Technology, Springer,
New York, 2006.
[14] D. Augustyniak, J. Bar, A. Chełmońska-Soyta, D. Dłubek,
M. Ferens-Sieczkowska, A. Jankowski, I. Kątnik-Prastwoska,
B. Krotkiewska, H. Krotkiewski, G. Majkowska-Skrobek,
M. Orczyk-Pawiłowicz, M. Pupek, and R. Walczak, Immuno-
chemistry in Medical Biology, PWN, Warszawa, 2009.
[15] A. Piruska, I. Nikcevic, S. H. Lee, Ch. Ahn, W.R. Heineman,
P.A. Limbach, and C.J. Seliskar, “The autofluorescence of plas-
tic materials and chips measured under laser irradiation”, Lab
Chip 5, 1348–1354 (2005).
[16] P. Szczepańska, R. Walczak, A. Wolff, and J. Dziuban, “SU-8
planar waveguides for real-time PCR chips”, Proc. Eur. 2008
Conf. 1, 383–386 (2008).
[17] J.M. Ruano-Lopez, M. Agirregabirra, G. Olabarria, D. Verdoy,
D.D. Bang, M. Bu, A. Wolff, A. Voigt, J. Dziuban, R. Wal-
czak, and J. Berganzo, “The SmartBioPhone, a point of care vi-
sion under development trough two European projects: OPTO-
LABCARD and LABONFOIL”, Lab Chip 9 (11), 1495–1499
(2009).
[18] M. Agirregabiria, M. Tijero, J. Berganzo, L.J. Fernandez,
K. Mayora, and J.M. Ruoano-Lopez, “A smart system based
on lab on a card for detection of Salmonella spp. in faeces”,
Proc. Smart Systems Integration 2008 1, CD ROM (2008).
[19] D.D. Bang, J. Høgberg, M. Agirregabiria, J. Berganzo, K. May-
ora, R. Walczak, J.A. Dziuban, M. Bu, A. Wolff, and
J.M. Ruano-Lopez, “A total integrated lab-on-a-chip systems
for rapid detection of Campylobacter spp. in broiler chicken,
validation trial”, Proc. µTAS 2009 1, 345–348 (2009).
[20] R. Walczak J. Dziuban, J. Koszur, D.D. Bang, and
J.M. Ruoano-Lopez, “Miniature system for real-time PCR for
low-cost and mass-scale detection of food pathogens”, Elec-
tronics 49 (6), 242–244 (2008), (in Polish).
[21] R. Walczak, “Lab-on-a-chip – based DNA/PCR analyzers with
fluorometric detection”, PAK 56 (7), 805–808 (2010).
[22] W. Kubicki, R. Walczak, and J. Dziuban, “Labs-on-a-chip for
DNA analyze by capillary gel electrophoresis”, Proc. II Na-
tional Conf. on Nano and Micromechanics 1, 133 (2010).
[23] F. von Heeren, E. Verpoorte, A. Man, and W. Thromann,
“Characterization of electrophoretic sample injection and sep-
aration in a gel-filled cyclic planar microstructure”, J. Micro-
column Separations 8 (6), 373–381 (1996).
[24] S. Bargiel, R. Walczak, A. Górecka-Drzazga, and J. Dzi-
uban, “Microcytometer with simultaneous photometric and flu-
orometric characterization of biosamples”, Proc. Eurosensors
2008 Conf. 1, 517–519 (2008).
[25] P. Szczepańska, R. Walczak, J. Dziuban, B. Kempisty, M. Jack-
owska, P. Antosik, J. Jaśkowski, and A. Chełmońska-Soyta,
“Quality and viability assessment of oocytes/embryos of ani-
mals by optical characterization in lab-on-a-chip device”, Proc.
µTAS 2010 1, 697–698 (2010).
[26] DRUID Project, www.druid-project.eu, 2010.
[27] R. Walczak, J. Dziuban, M. Scholles, and J. Kruger, “Toward
portable instrumentation for quantitative cocaine detection with
lab-on-a-paper and hybrid optical readout”, Procedia Chem-
istry 1 (1), 999–1002 (2009).
[28] R. Walczak, J. Dziuban, and J. Kruger, “Fluorometric detector
of cocaine in human sweat – portable new generation narcome-
ter”, PAK 56 (7), 812–815 (2010).
Bull. Pol. Ac.: Tech. 59(2) 2011 165


![[Duality Inc.] Double Sided Padless Sensor Chip](https://img.pdfslide.net/doc/110x75/55b6badcbb61eb290d8b4824/duality-inc-double-sided-padless-sensor-chip.jpg)


![Bio—chip ] sensor](https://img.pdfslide.net/doc/110x75/58ae73bc1a28abea4f8b4759/biochip-sensor.jpg)