Embed Size (px)
Citation preview

Lab Review: 6-12
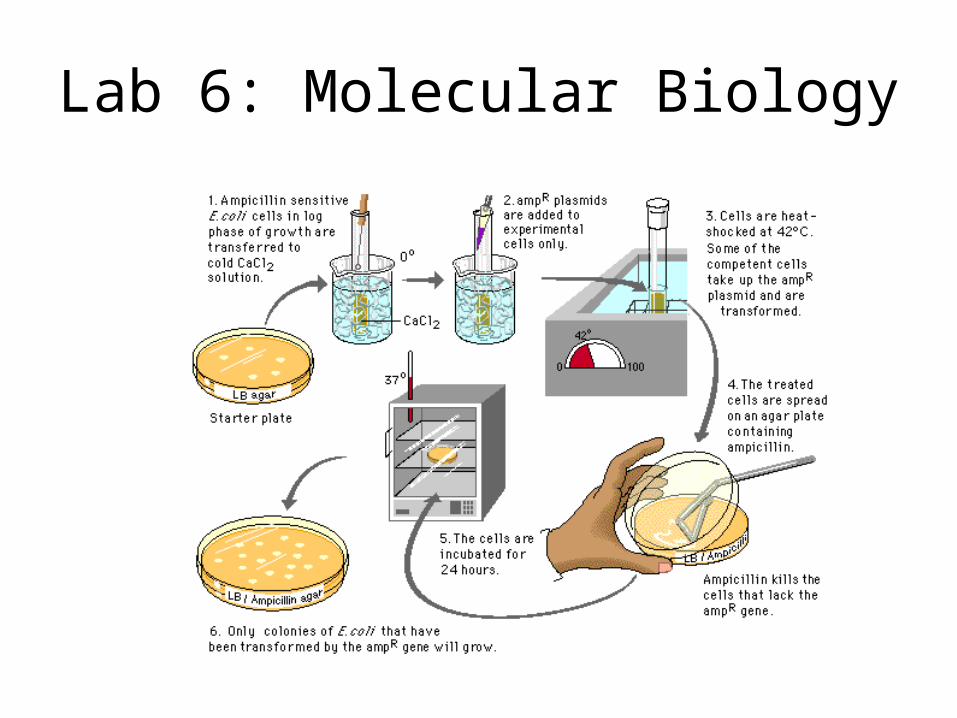
Lab 6: Molecular Biology
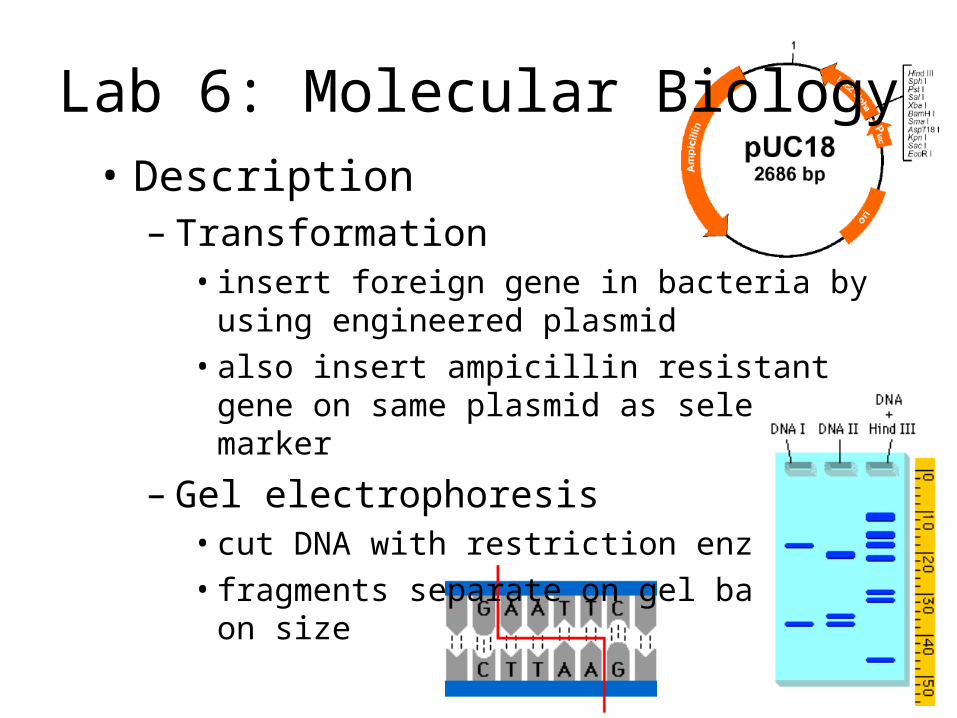
Lab 6: Molecular Biology• Description
– Transformation• insert foreign gene in bacteria by using
engineered plasmid• also insert ampicillin resistant gene on same
plasmid as selectable marker
– Gel electrophoresis• cut DNA with restriction enzyme• fragments separate on gel based
on size
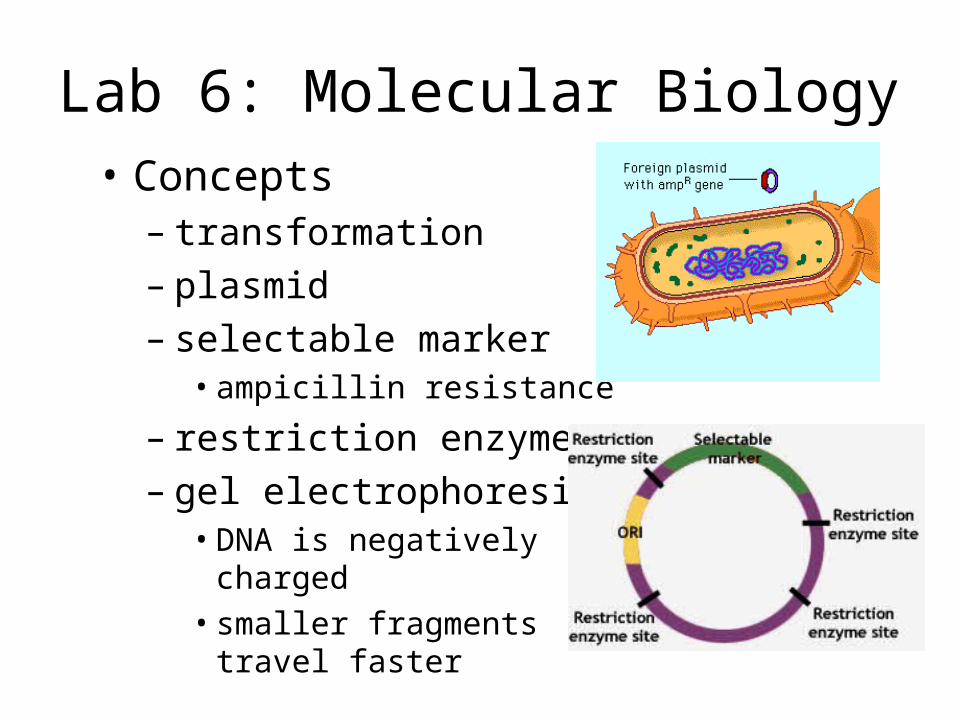
Lab 6: Molecular Biology• Concepts
– transformation– plasmid– selectable marker
• ampicillin resistance
– restriction enzyme– gel electrophoresis
• DNA is negatively charged
• smaller fragments travel faster
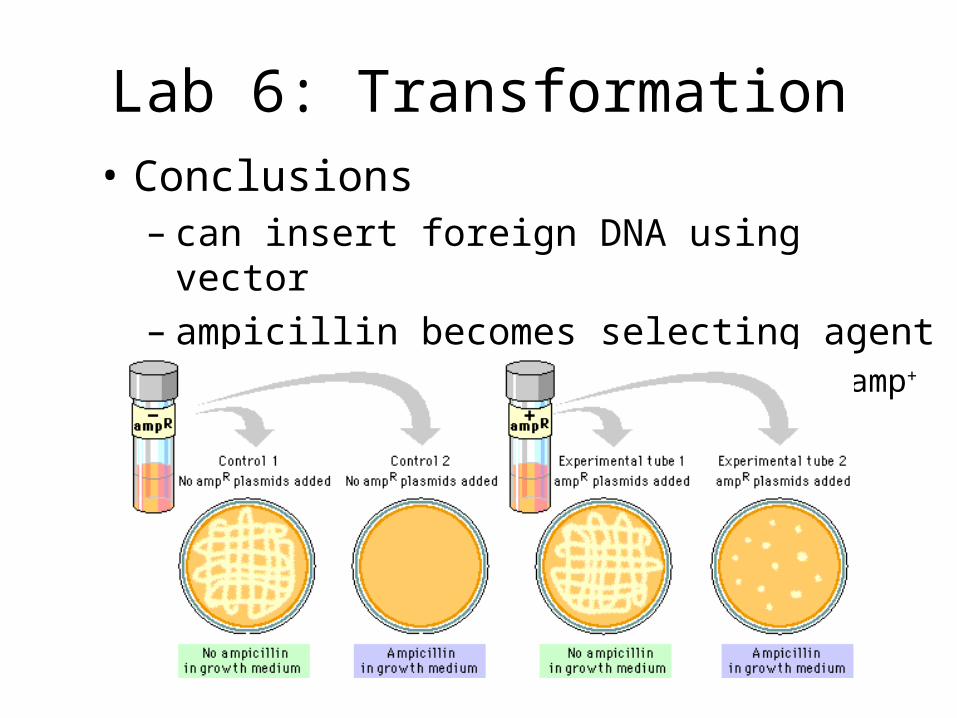
Lab 6: Transformation• Conclusions
– can insert foreign DNA using vector– ampicillin becomes selecting agent
• no transformation = no growth on amp+ plate
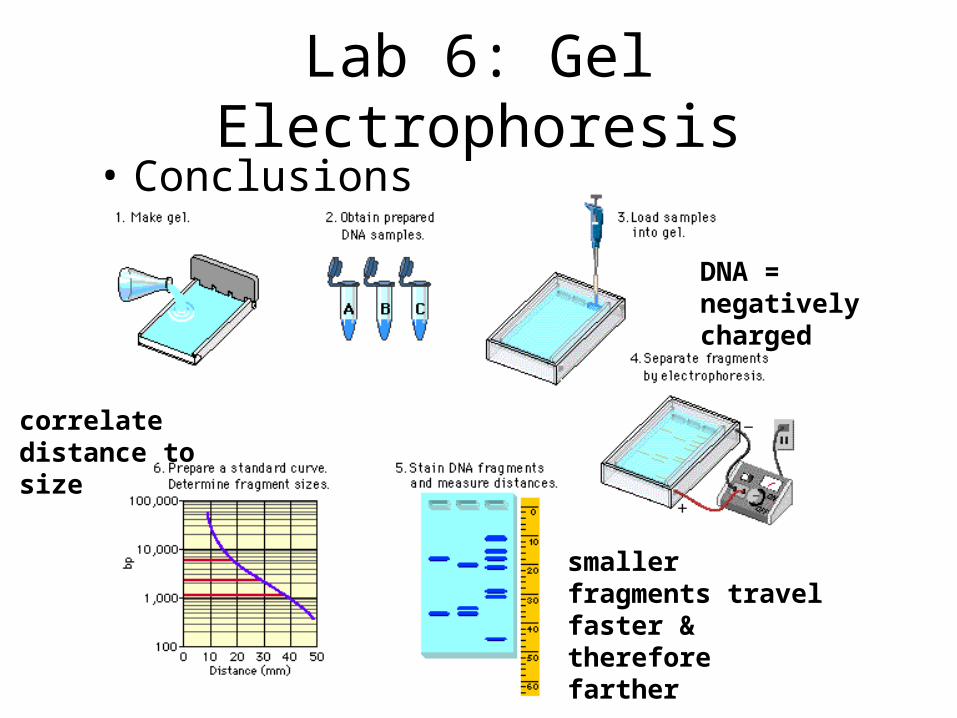
Lab 6: Gel Electrophoresis• Conclusions
DNA = negatively charged
smaller fragments travel faster & therefore farther
correlate distance to size
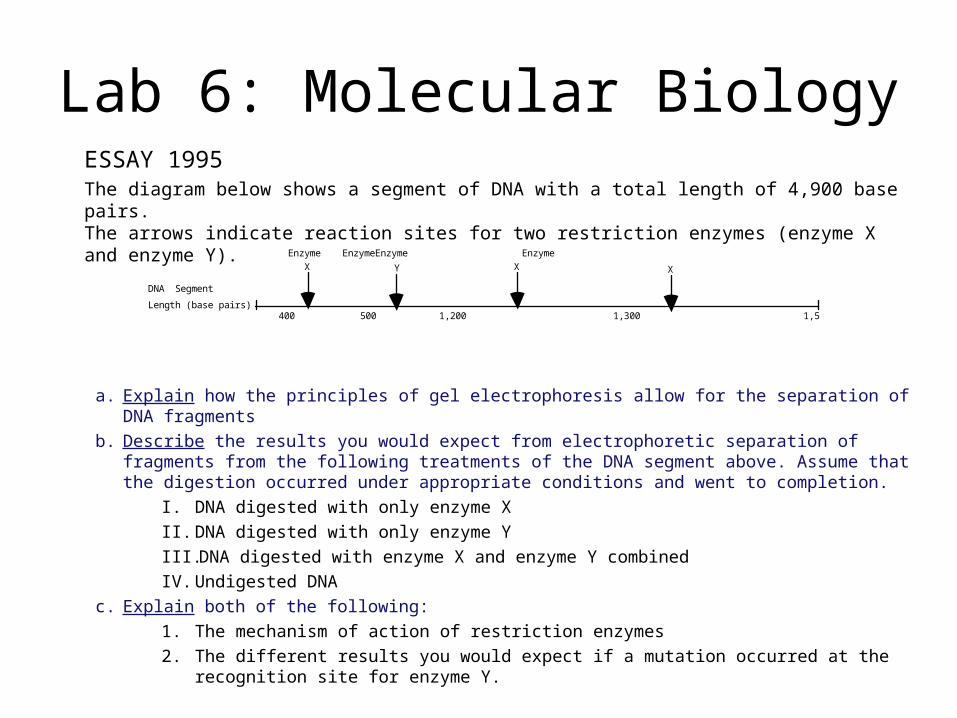
Lab 6: Molecular BiologyESSAY 1995The diagram below shows a segment of DNA with a total length of 4,900 base pairs. The arrows indicate reaction sites for two restriction enzymes (enzyme X and enzyme Y).
a. Explain how the principles of gel electrophoresis allow for the separation of DNA fragments
b. Describe the results you would expect from electrophoretic separation of fragments from the following treatments of the DNA segment above. Assume that the digestion occurred under appropriate conditions and went to completion.
I. DNA digested with only enzyme X
II. DNA digested with only enzyme Y
III. DNA digested with enzyme X and enzyme Y combined
IV. Undigested DNA
c. Explain both of the following:
1. The mechanism of action of restriction enzymes
2. The different results you would expect if a mutation occurred at the recognition site for enzyme Y.
DNA SegmentLength (base pairs)
400 500 1,200 1,300 1,500
X X X Enzyme EnzymeEnzyme Enzyme
Y
Lab 6: Molecular BiologyESSAY 2002The human genome illustrates both continuity and change.
a. Describe the essential features of two of the procedures/techniques below. For each of the procedures/techniques you describe, explain how its application contributes to understanding genetics.
The use of a bacterial plasmid to clone and sequence a human gene Polymerase chain reaction (PCR) Restriction fragment polymorphism (RFLP analysis)
b. All humans are nearly identical genetically in coding sequences and have many proteins that are identical in structure and function. Nevertheless, each human has a unique DNA fingerprint. Explain this apparent contradiction.
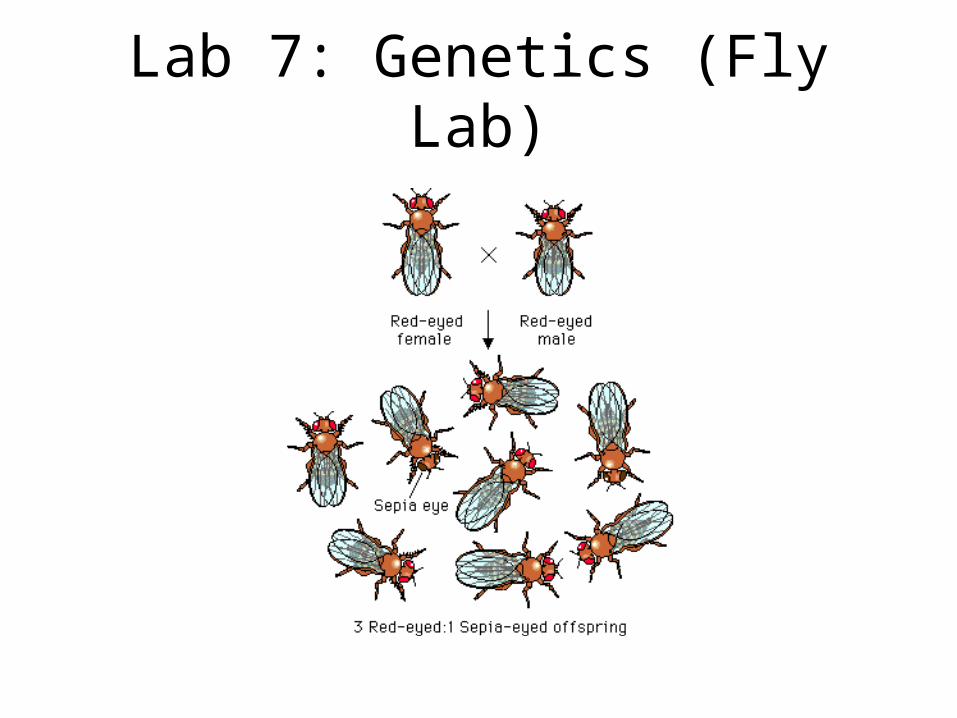
Lab 7: Genetics (Fly Lab)
Lab 7: Genetics (Fly Lab)
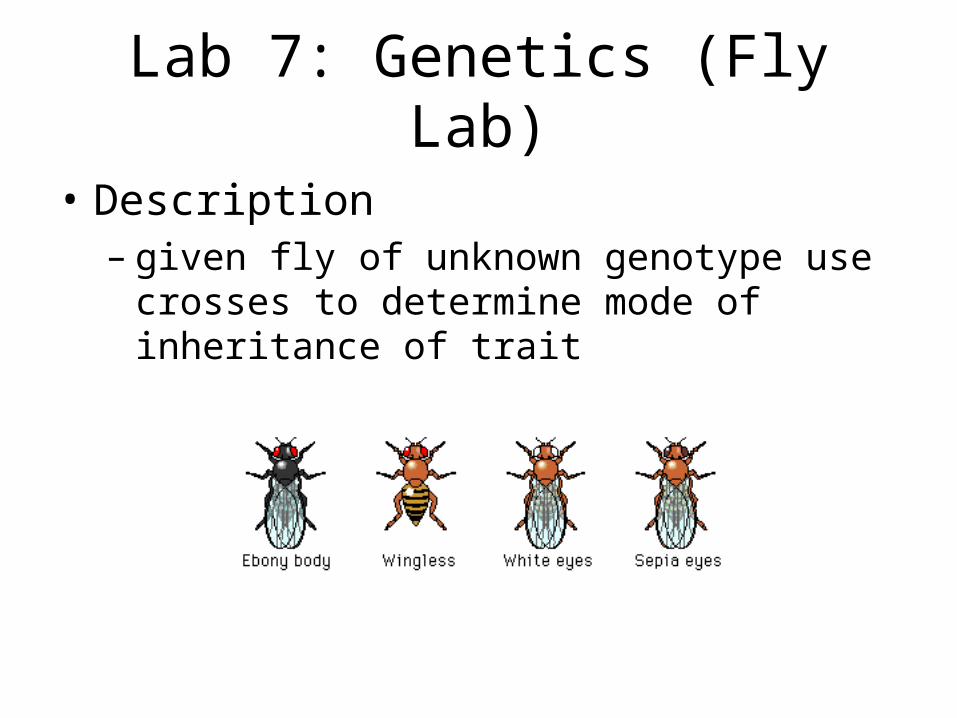
• Description– given fly of unknown genotype use crosses to
determine mode of inheritance of trait
Lab 7: Genetics (Fly Lab)• Concepts
– phenotype vs. genotype– dominant vs. recessive– P, F1, F2 generations– sex-linked– monohybrid cross– dihybrid cross– test cross– chi square
Lab 7: Genetics (Fly Lab)
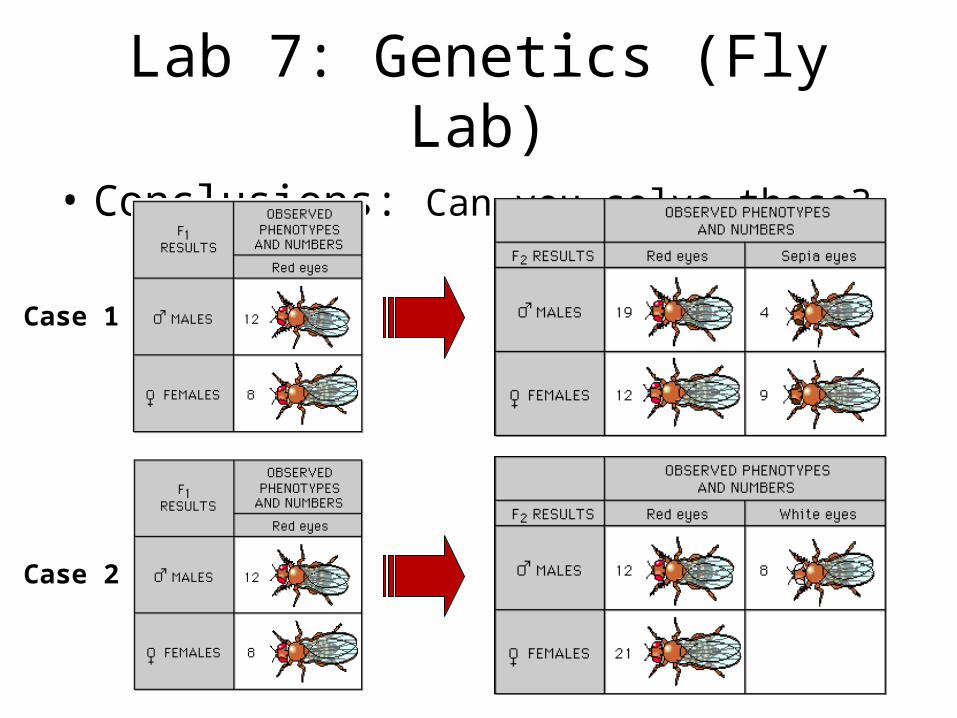
• Conclusions: Can you solve these?
Case 1
Case 2
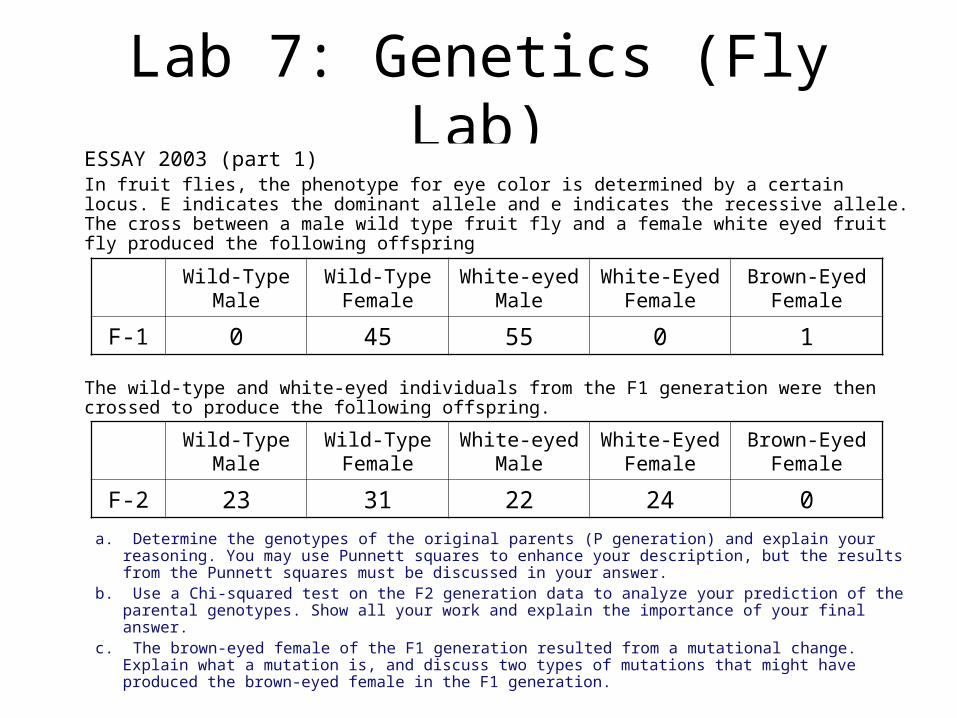
Lab 7: Genetics (Fly Lab)ESSAY 2003 (part 1)In fruit flies, the phenotype for eye color is determined by a certain locus. E indicates the dominant allele and e indicates the recessive allele. The cross between a male wild type fruit fly and a female white eyed fruit fly produced the following offspring
The wild-type and white-eyed individuals from the F1 generation were then crossed to produce the following offspring.
a. Determine the genotypes of the original parents (P generation) and explain your reasoning. You may use Punnett squares to enhance your description, but the results from the Punnett squares must be discussed in your answer.
b. Use a Chi-squared test on the F2 generation data to analyze your prediction of the parental genotypes. Show all your work and explain the importance of your final answer.
c. The brown-eyed female of the F1 generation resulted from a mutational change. Explain what a mutation is, and discuss two types of mutations that might have produced the brown-eyed female in the F1 generation.
Wild-Type Male
Wild-Type Female
White-eyed Male
White-Eyed Female
Brown-Eyed Female
F-1 0 45 55 0 1
Wild-Type Male
Wild-Type Female
White-eyed Male
White-Eyed Female
Brown-Eyed Female
F-2 23 31 22 24 0
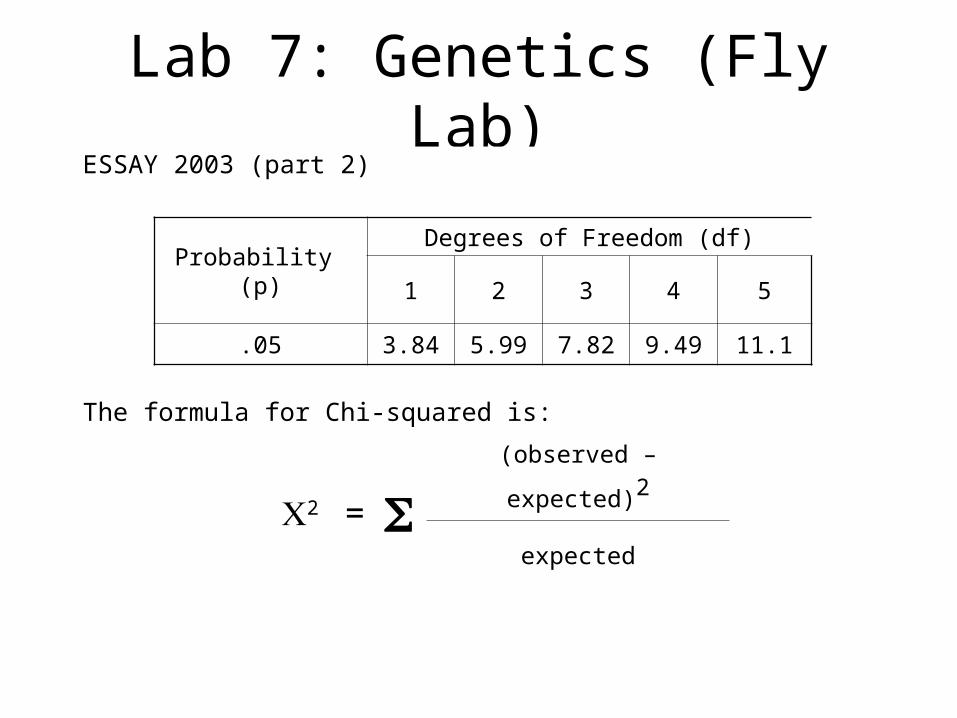
Lab 7: Genetics (Fly Lab)ESSAY 2003 (part 2)
The formula for Chi-squared is:
Probability (p)
Degrees of Freedom (df)
1 2 3 4 5
.05 3.84 5.99 7.82 9.49 11.1
2 = (observed – expected)2
expected
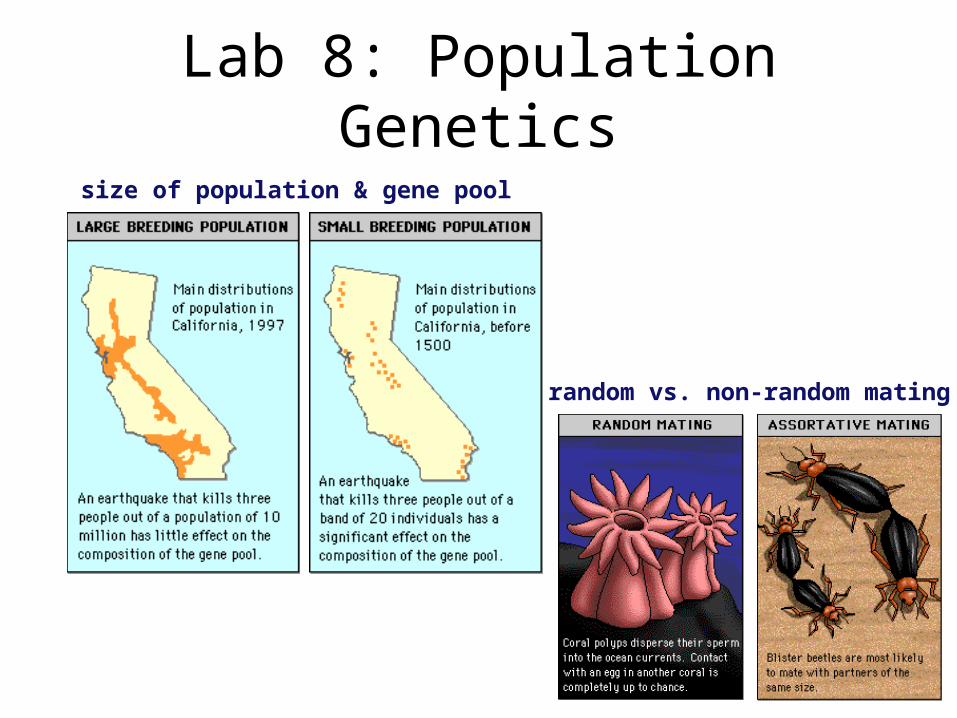
Lab 8: Population Genetics
random vs. non-random mating
size of population & gene pool
Lab 8: Population Genetics
• Description– simulations were used to study effects of
different parameters on frequency of alleles in a population
• selection• heterozygous advantage• genetic drift
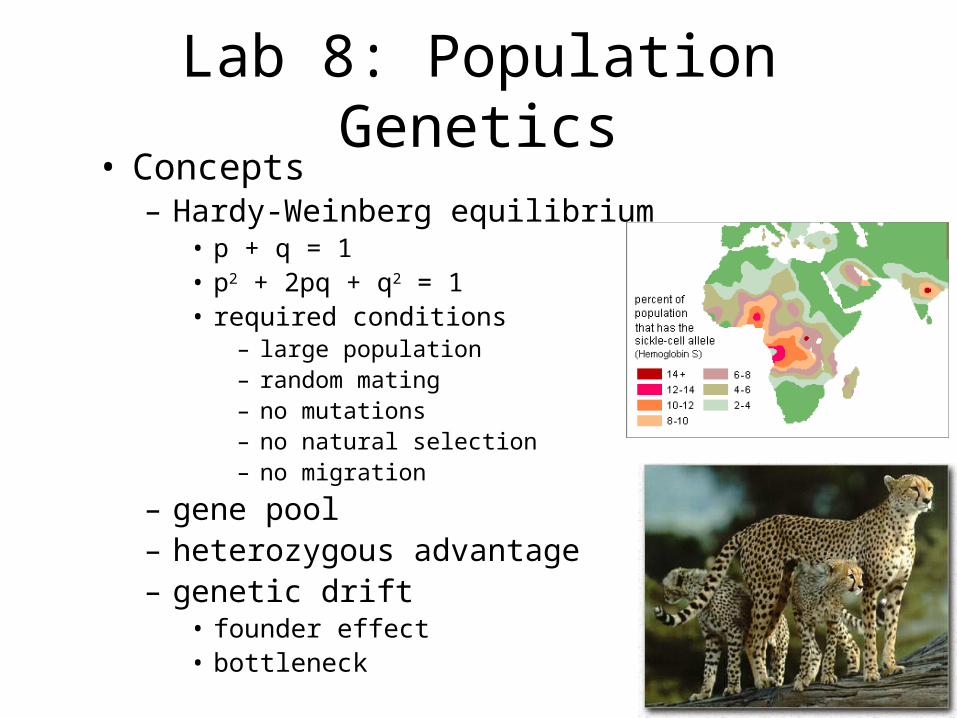
Lab 8: Population Genetics• Concepts
– Hardy-Weinberg equilibrium• p + q = 1• p2 + 2pq + q2 = 1• required conditions
– large population– random mating– no mutations– no natural selection– no migration
– gene pool– heterozygous advantage – genetic drift
• founder effect• bottleneck
Lab 8: Population Genetics
• Conclusions– recessive alleles remain hidden
in the pool of heterozygotes• even lethal recessive alleles are not completely
removed from population
– know how to solve H-W problems!• to calculate allele frequencies, use p + q = 1• to calculate genotype frequencies or how many
individuals, use, p2 + 2pq + q2 = 1
Lab 8: Population GeneticsESSAY 1989Do the following with reference to the Hardy-Weinberg model.
a. Indicate the conditions under which allele frequencies (p and q) remain constant from one generation to the next.
b. Calculate, showing all work, the frequencies of the alleles and frequencies of the genotypes in a population of 100,000 rabbits of which 25,000 are white and 75,000 are agouti. (In rabbits the white color is due to a recessive allele, w, and agouti is due to a dominant allele, W.)
c. If the homozygous dominant condition were to become lethal, what would happen to the allelic and genotypic frequencies in the rabbit population after two generations?
Lab 9: Transpiration
Lab 9: Transpiration
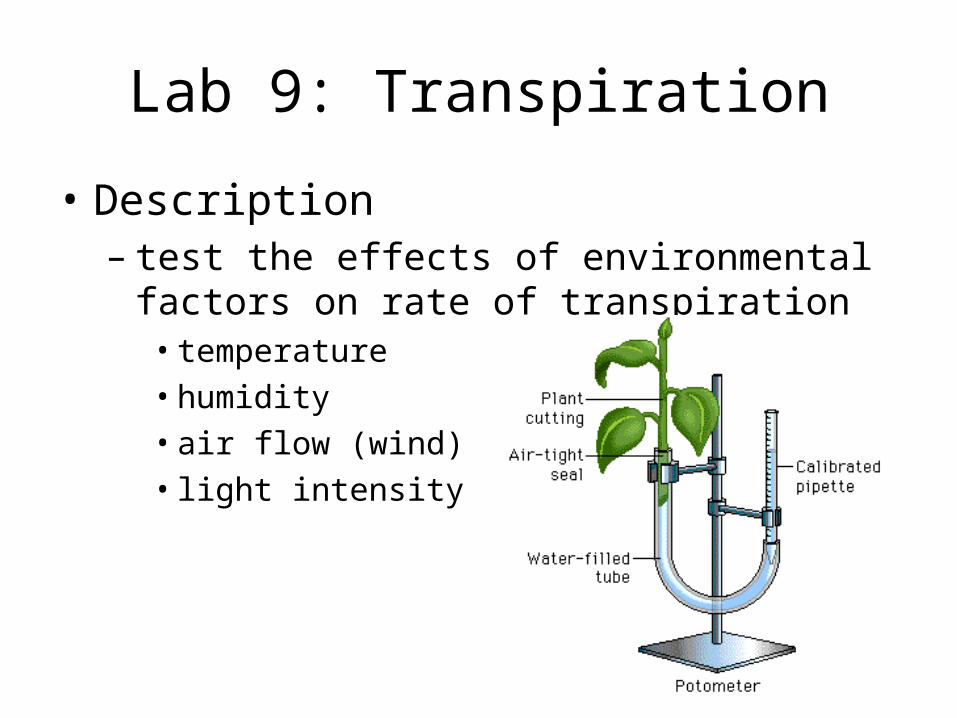
• Description– test the effects of environmental factors on
rate of transpiration• temperature• humidity• air flow (wind)• light intensity
Lab 9: Transpiration
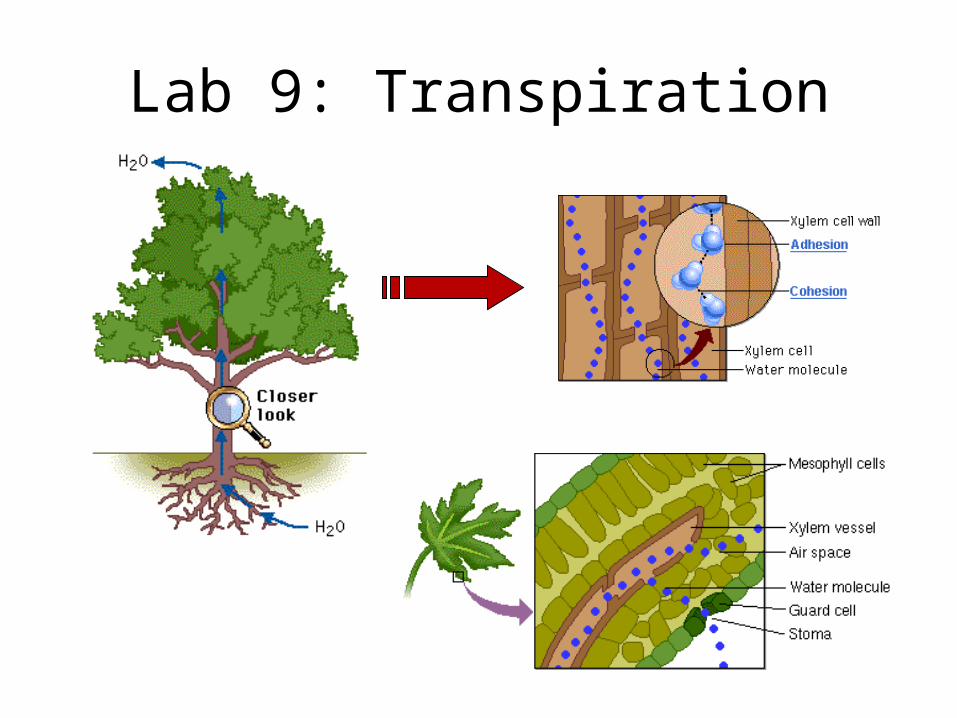
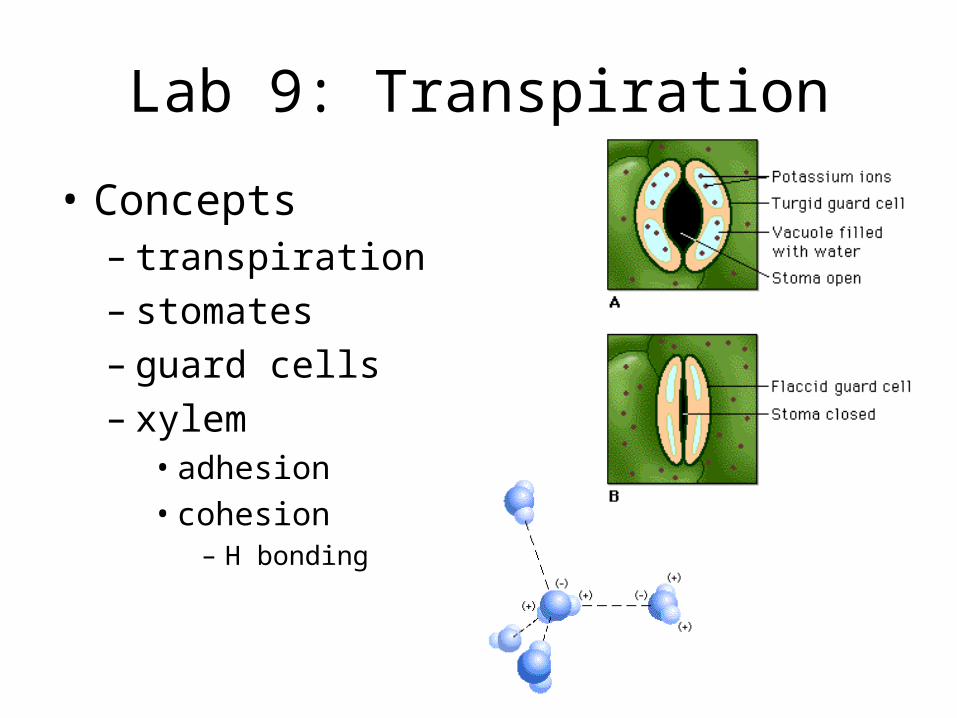
• Concepts– transpiration– stomates– guard cells– xylem
• adhesion• cohesion
– H bonding
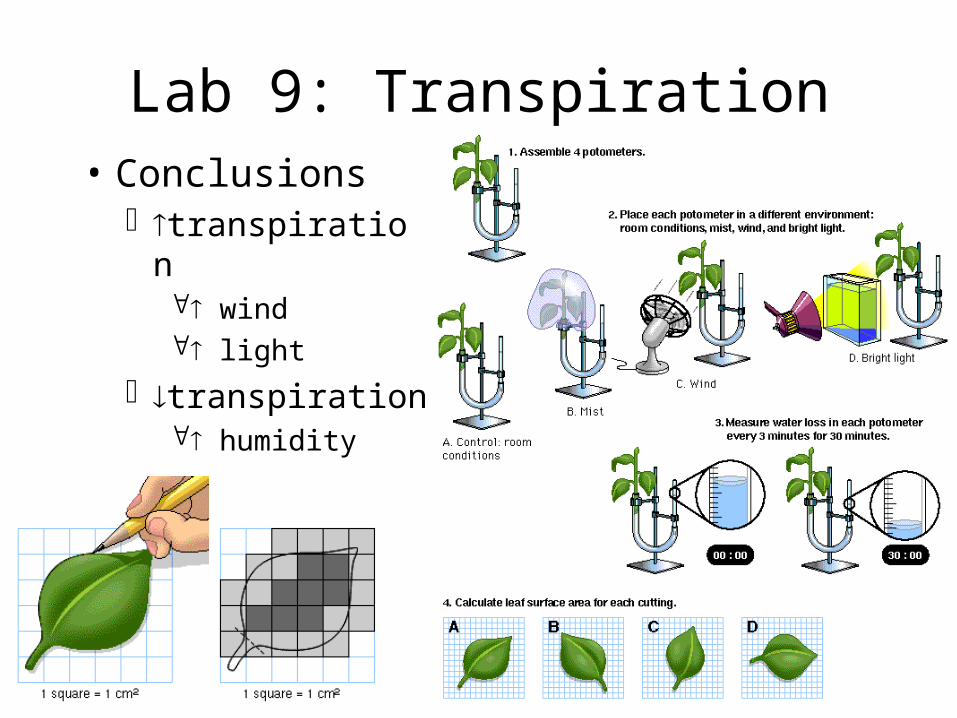
Lab 9: Transpiration• Conclusions
transpiration wind light
transpiration humidity
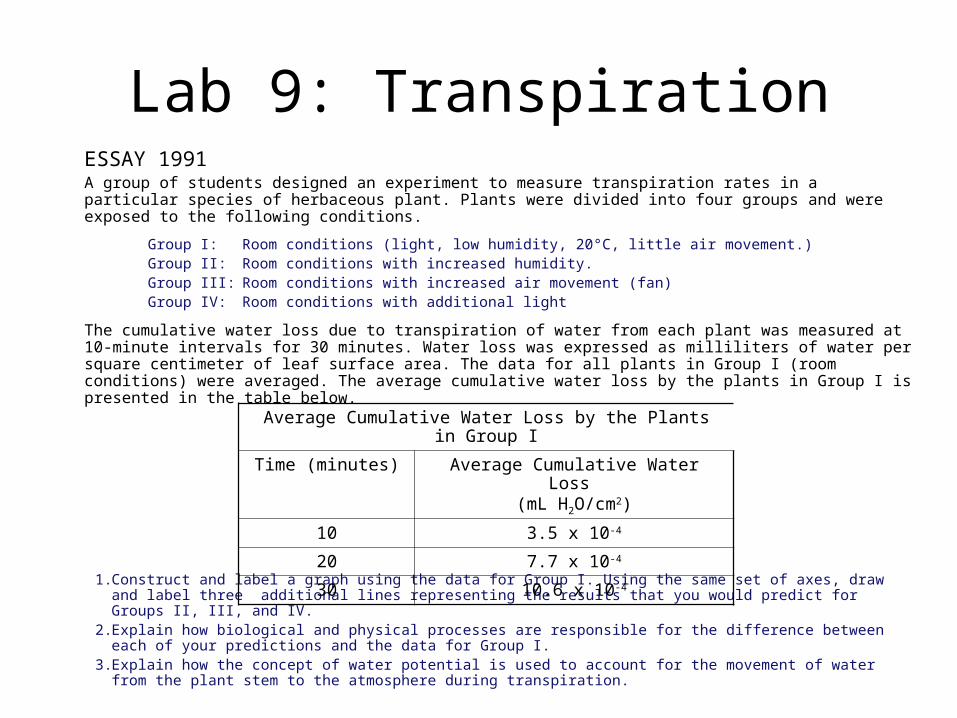
Lab 9: TranspirationESSAY 1991A group of students designed an experiment to measure transpiration rates in a particular species of herbaceous plant. Plants were divided into four groups and were exposed to the following conditions.
Group I: Room conditions (light, low humidity, 20°C, little air movement.) Group II: Room conditions with increased humidity. Group III: Room conditions with increased air movement (fan) Group IV: Room conditions with additional light
The cumulative water loss due to transpiration of water from each plant was measured at 10-minute intervals for 30 minutes. Water loss was expressed as milliliters of water per square centimeter of leaf surface area. The data for all plants in Group I (room conditions) were averaged. The average cumulative water loss by the plants in Group I is presented in the table below.
1. Construct and label a graph using the data for Group I. Using the same set of axes, draw and label three additional lines representing the results that you would predict for Groups II, III, and IV.
2. Explain how biological and physical processes are responsible for the difference between each of your predictions and the data for Group I.
3. Explain how the concept of water potential is used to account for the movement of water from the plant stem to the atmosphere during transpiration.
Average Cumulative Water Loss by the Plants in Group I
Time (minutes) Average Cumulative Water Loss (mL H2O/cm2)
10 3.5 x 10⁻⁴
20 7.7 x 10⁻⁴
30 10.6 x 10⁻⁴
Lab 10: Circulatory Physiology
Lab 10: Circulatory Physiology
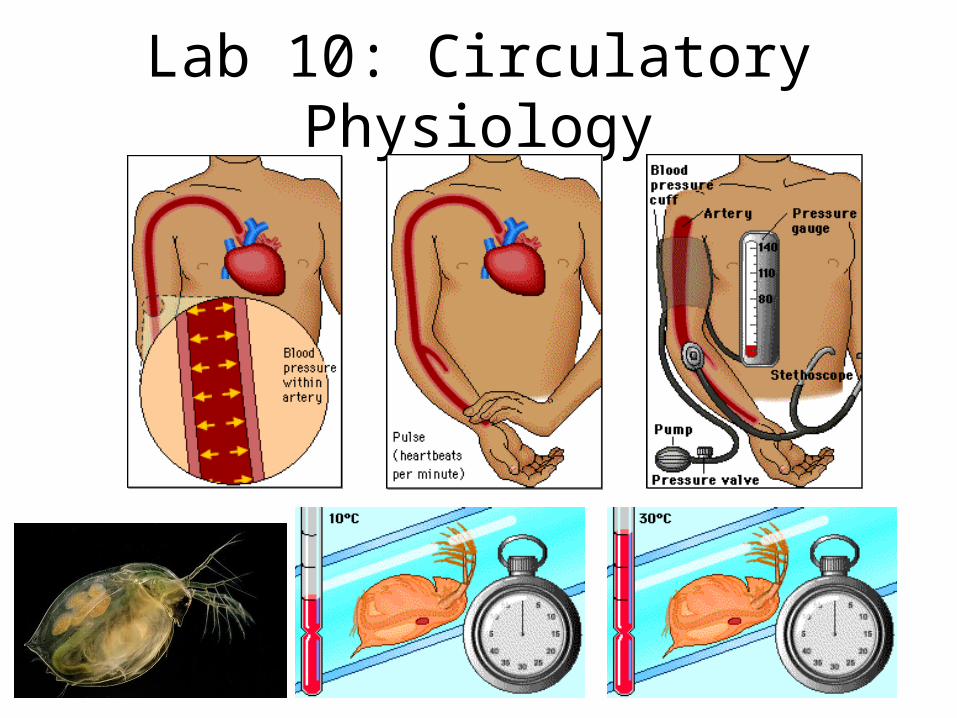
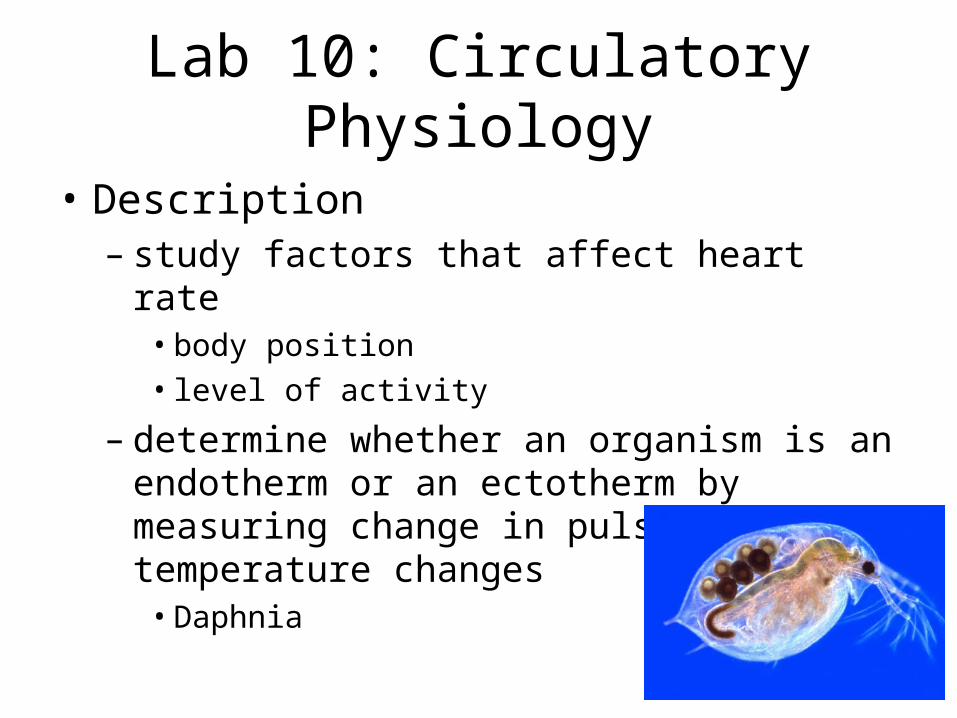
• Description– study factors that affect heart rate
• body position• level of activity
– determine whether an organism is an endotherm or an ectotherm by measuring change in pulse rate as temperature changes
• Daphnia
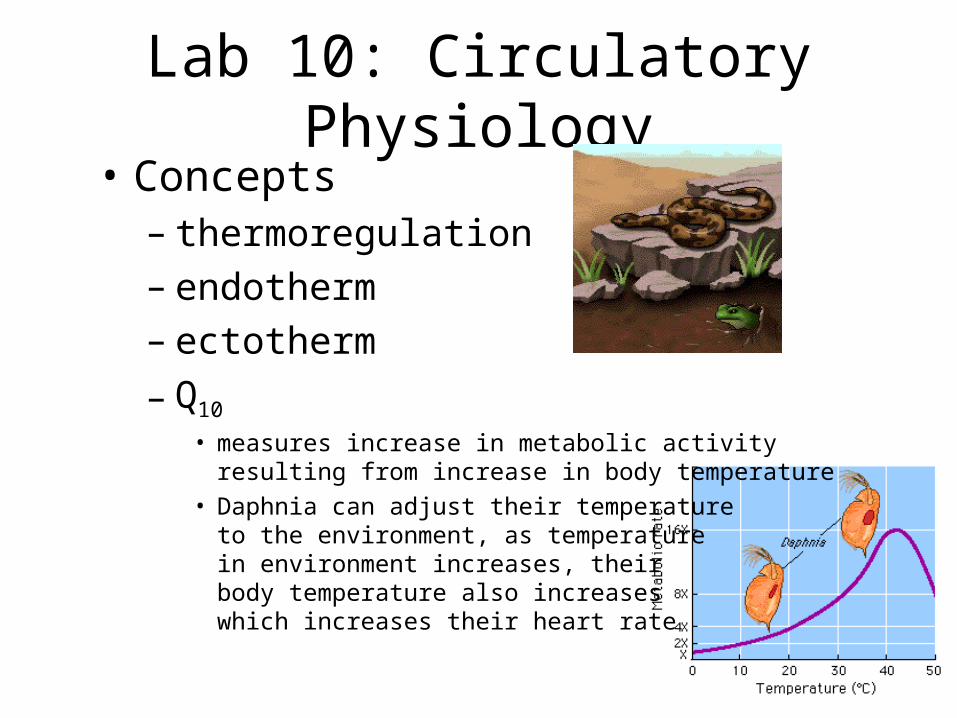
Lab 10: Circulatory Physiology• Concepts
– thermoregulation– endotherm– ectotherm
– Q10
• measures increase in metabolic activity resulting from increase in body temperature
• Daphnia can adjust their temperature to the environment, as temperature in environment increases, their body temperature also increases which increases their heart rate
Lab 10: Circulatory Physiology
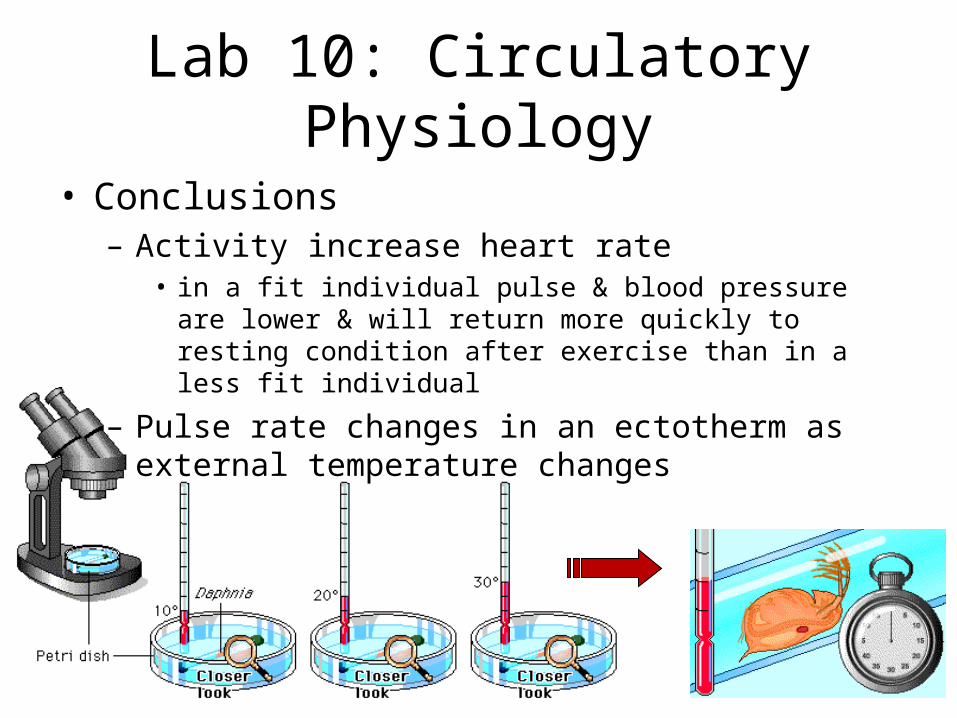
• Conclusions– Activity increase heart rate
• in a fit individual pulse & blood pressure are lower & will return more quickly to resting condition after exercise than in a less fit individual
– Pulse rate changes in an ectotherm as external temperature changes
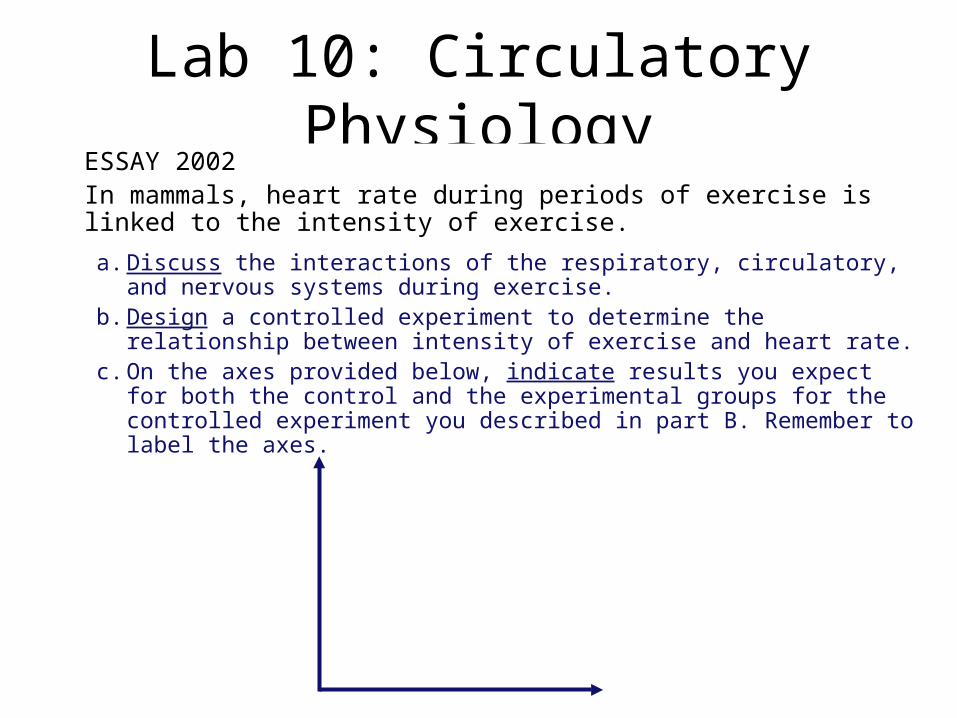
Lab 10: Circulatory PhysiologyESSAY 2002In mammals, heart rate during periods of exercise is linked to the intensity of exercise.
a. Discuss the interactions of the respiratory, circulatory, and nervous systems during exercise.
b. Design a controlled experiment to determine the relationship between intensity of exercise and heart rate.
c. On the axes provided below, indicate results you expect for both the control and the experimental groups for the controlled experiment you described in part B. Remember to label the axes.
Lab 11: Animal Behavior
Lab 11: Animal Behavior
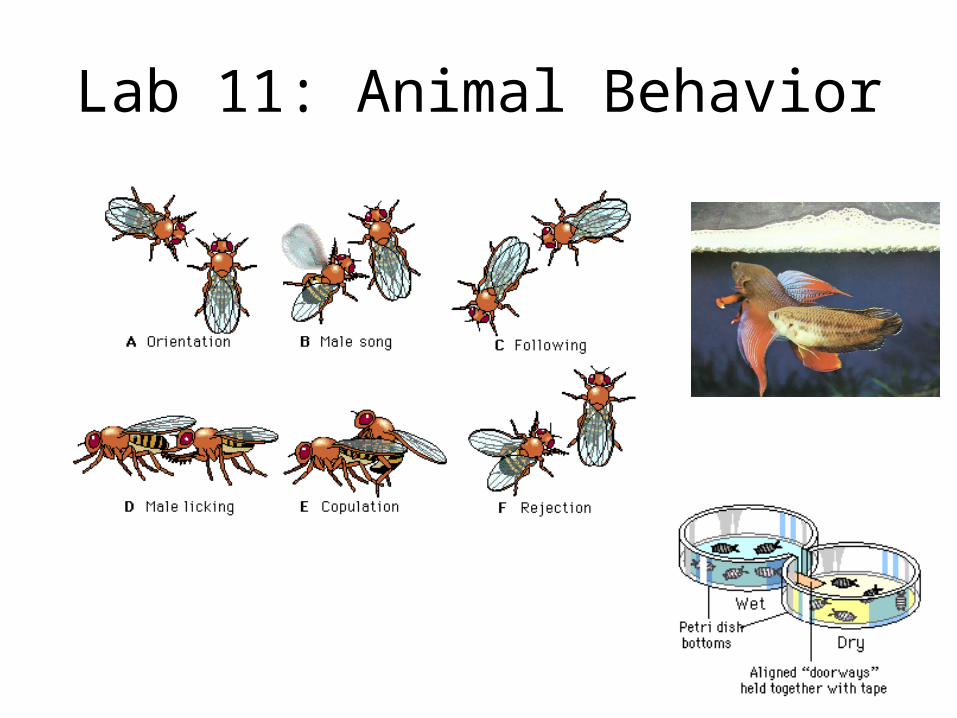
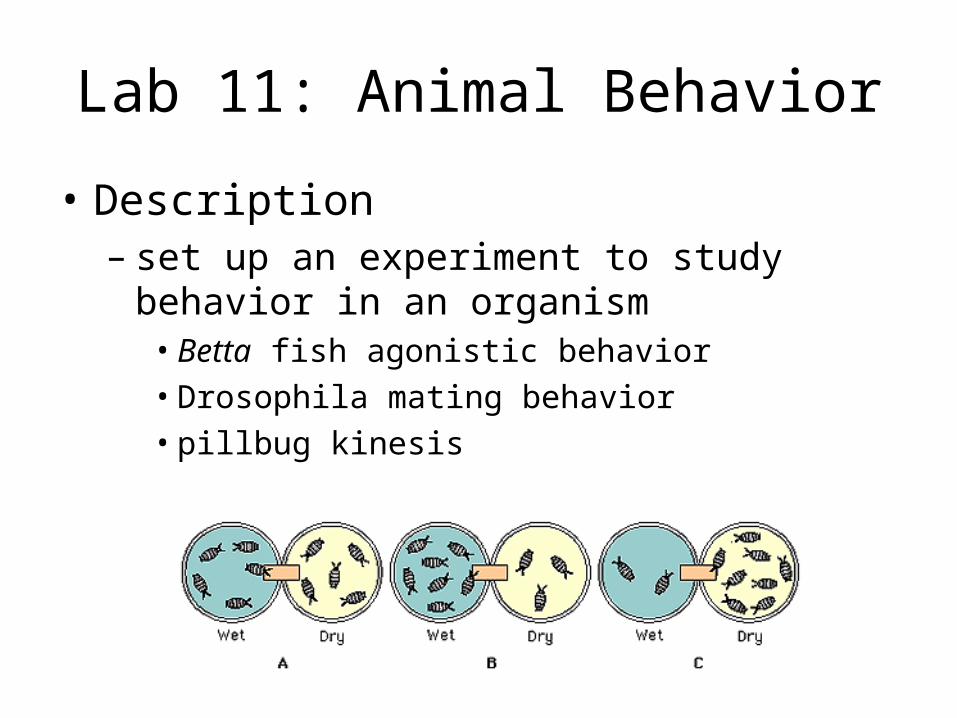
• Description– set up an experiment to study behavior in an
organism• Betta fish agonistic behavior• Drosophila mating behavior• pillbug kinesis
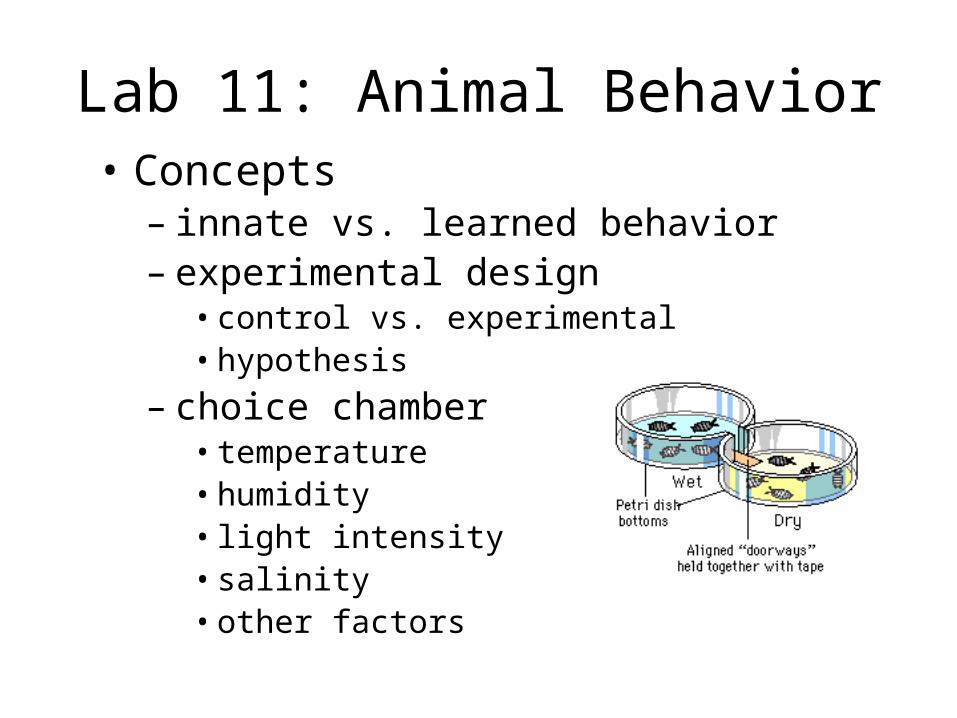
Lab 11: Animal Behavior• Concepts
– innate vs. learned behavior– experimental design
• control vs. experimental• hypothesis
– choice chamber• temperature• humidity• light intensity• salinity• other factors
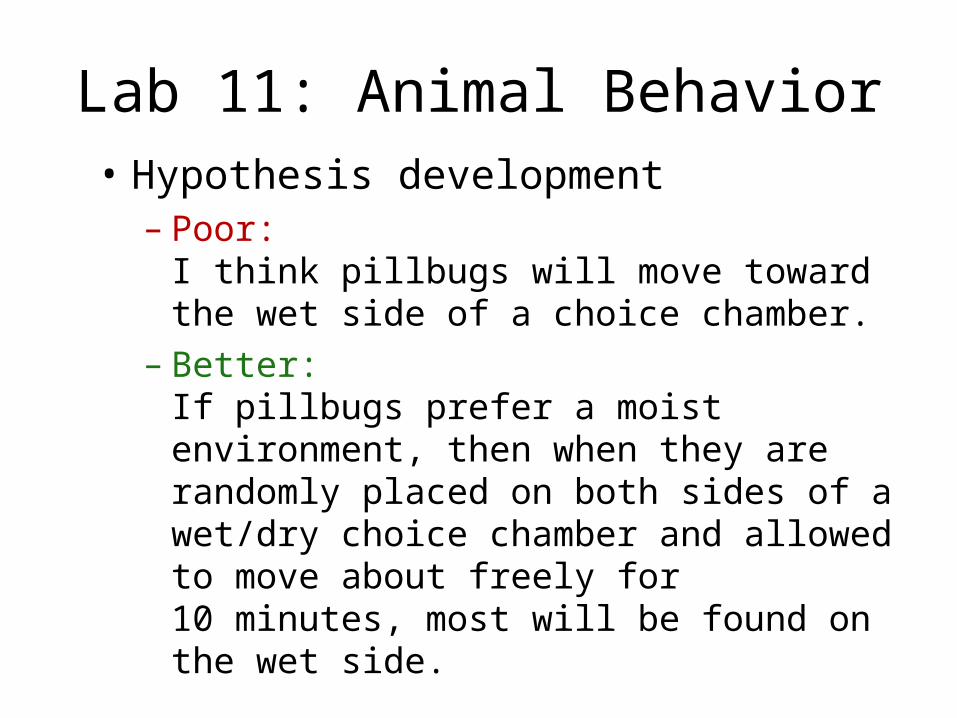
Lab 11: Animal Behavior• Hypothesis development
– Poor: I think pillbugs will move toward the wet side of a choice chamber.
– Better: If pillbugs prefer a moist environment, then when they are randomly placed on both sides of a wet/dry choice chamber and allowed to move about freely for 10 minutes, most will be found on the wet side.
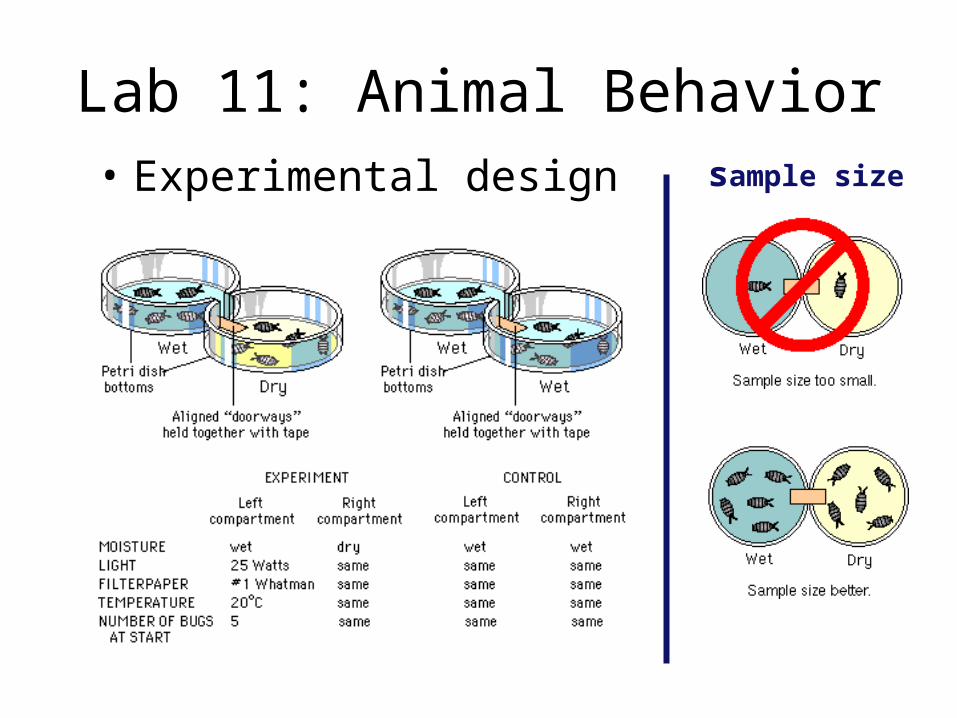
Lab 11: Animal Behavior• Experimental design sample size
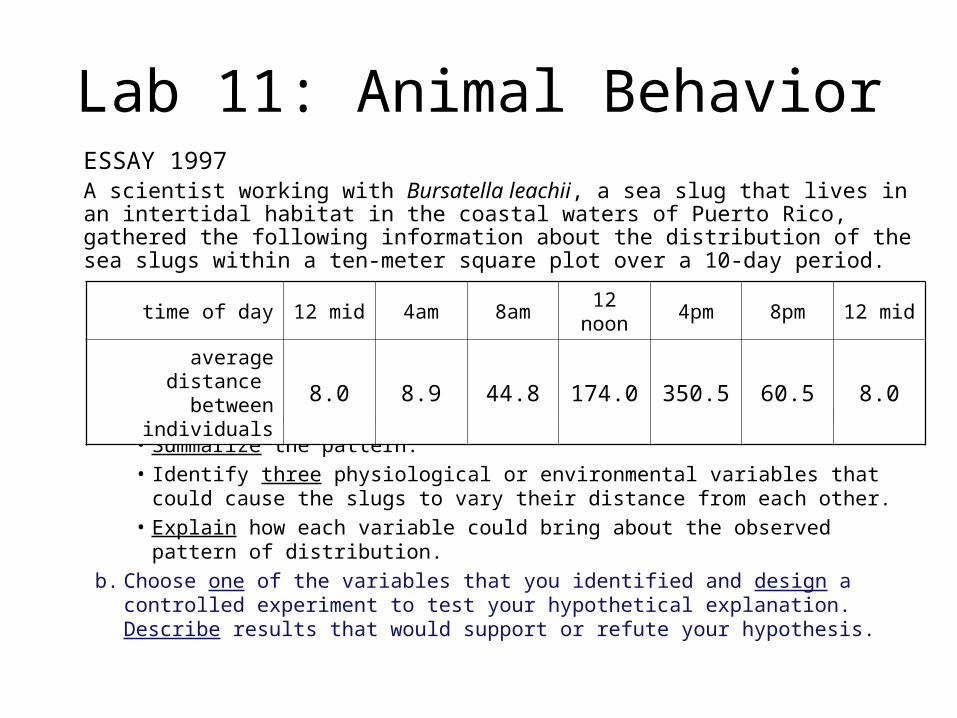
Lab 11: Animal BehaviorESSAY 1997A scientist working with Bursatella leachii, a sea slug that lives in an intertidal habitat in the coastal waters of Puerto Rico, gathered the following information about the distribution of the sea slugs within a ten-meter square plot over a 10-day period.
a. For the data above, provide information on each of the following:• Summarize the pattern.• Identify three physiological or environmental variables that could cause the slugs
to vary their distance from each other.• Explain how each variable could bring about the observed pattern of distribution.
b. Choose one of the variables that you identified and design a controlled experiment to test your hypothetical explanation. Describe results that would support or refute your hypothesis.
time of day 12 mid 4am 8am12
noon4pm 8pm 12 mid
average distance between individuals 8.0 8.9 44.8 174.0 350.5 60.5 8.0
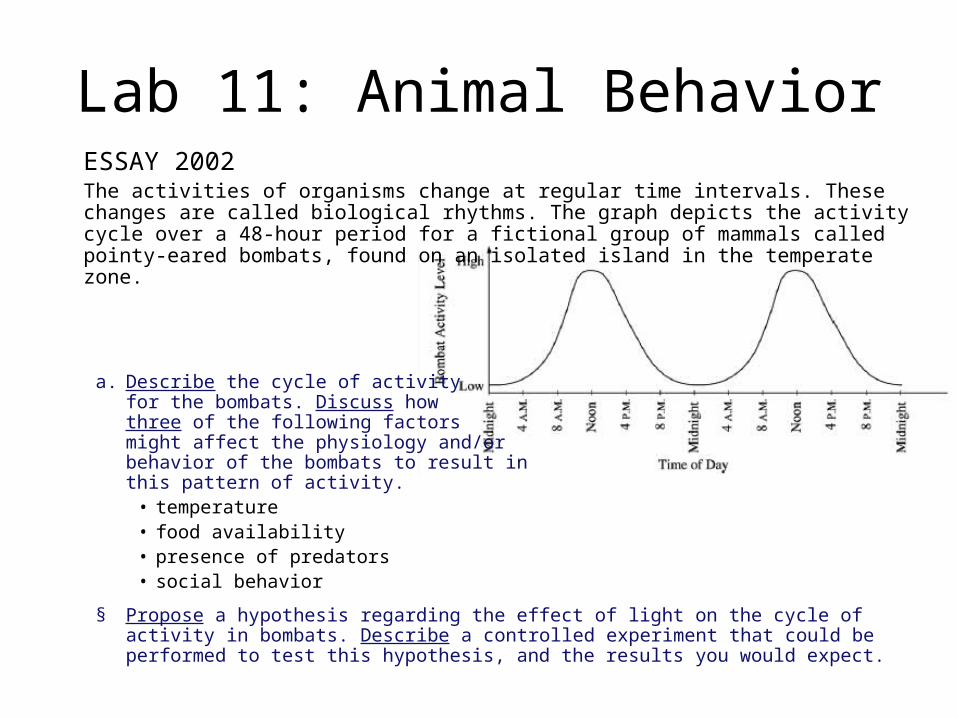
Lab 11: Animal BehaviorESSAY 2002The activities of organisms change at regular time intervals. These changes are called biological rhythms. The graph depicts the activity cycle over a 48-hour period for a fictional group of mammals called pointy-eared bombats, found on an isolated island in the temperate zone.
a. Describe the cycle of activity for the bombats. Discuss how three of the following factors might affect the physiology and/or behavior of the bombats to result in this pattern of activity.
• temperature• food availability• presence of predators• social behavior
§ Propose a hypothesis regarding the effect of light on the cycle of activity in bombats. Describe a controlled experiment that could be performed to test this hypothesis, and the results you would expect.
Lab 12: Dissolved Oxygen
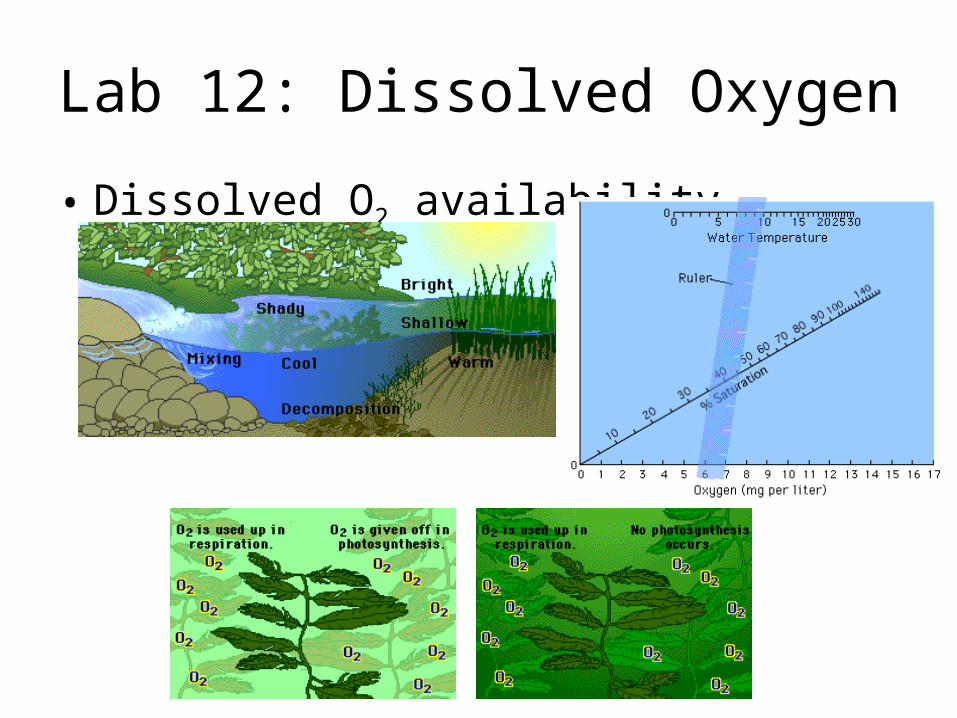
• Dissolved O2 availability
Lab 12: Dissolved Oxygen
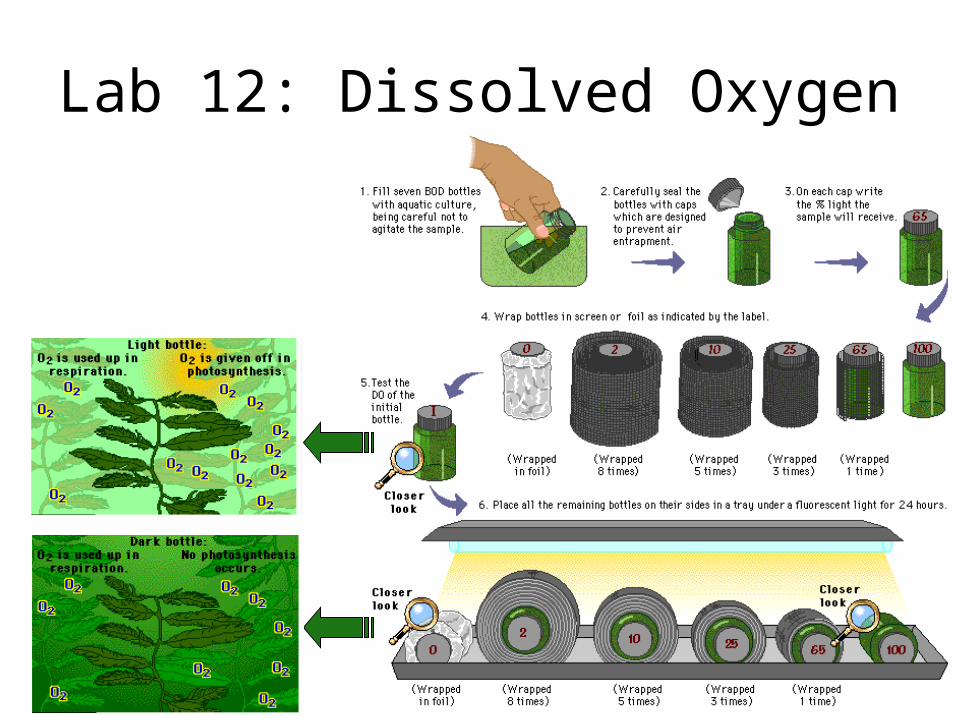
Lab 12: Dissolved Oxygen• Description
– measure primary productivity by measuring O2 production
– factors that affect amount of dissolved O2
• temperature– as water temperature, its ability to hold O2 decreases
• photosynthetic activity– in bright light, aquatic plants produce more O2
• decomposition activity– as organic matter decays, microbial respiration consumes O2
• mixing & turbulence– wave action, waterfalls & rapids aerate H2O & O2
• salinity– as water becomes more salty, its ability to hold O2 decreases
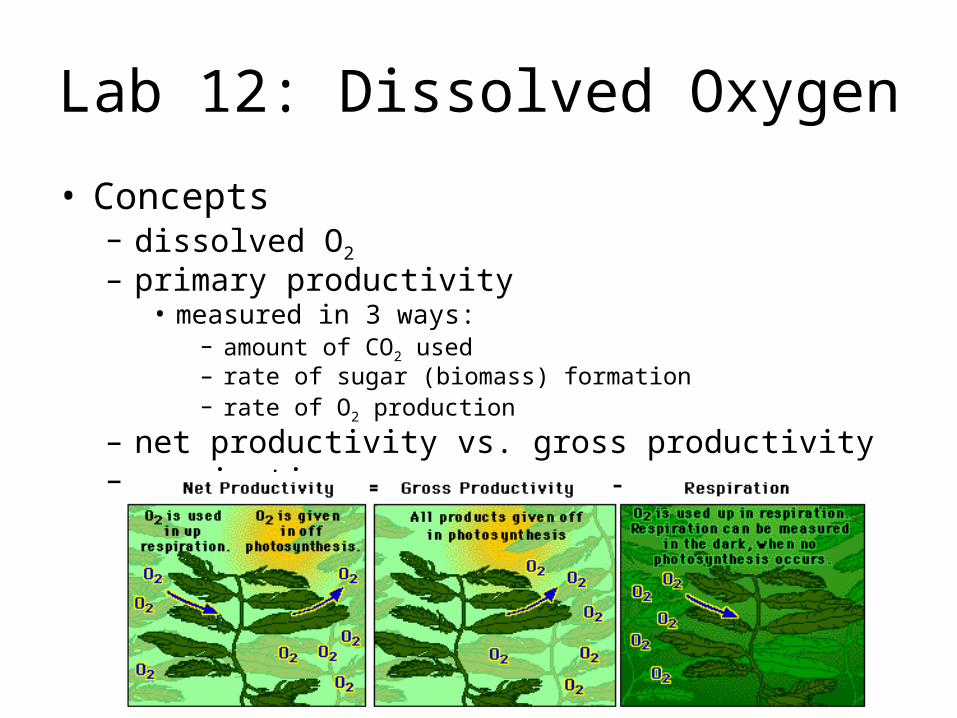
Lab 12: Dissolved Oxygen
• Concepts– dissolved O2
– primary productivity• measured in 3 ways:
– amount of CO2 used– rate of sugar (biomass) formation– rate of O2 production
– net productivity vs. gross productivity– respiration
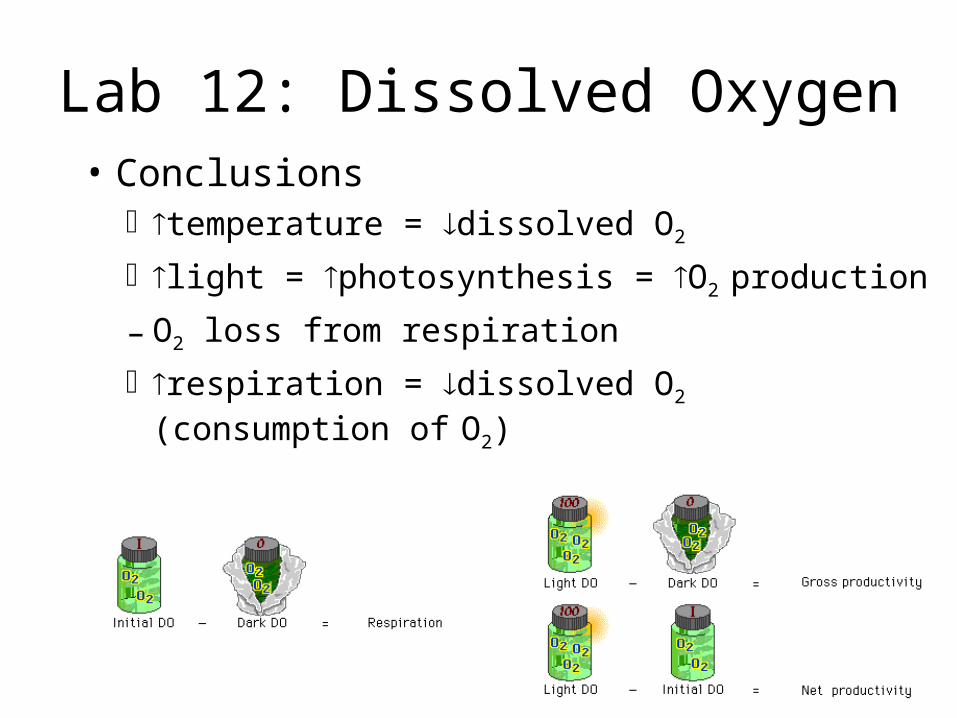
Lab 12: Dissolved Oxygen• Conclusions
temperature = dissolved O2
light = photosynthesis = O2 production
– O2 loss from respiration
respiration = dissolved O2
(consumption of O2)
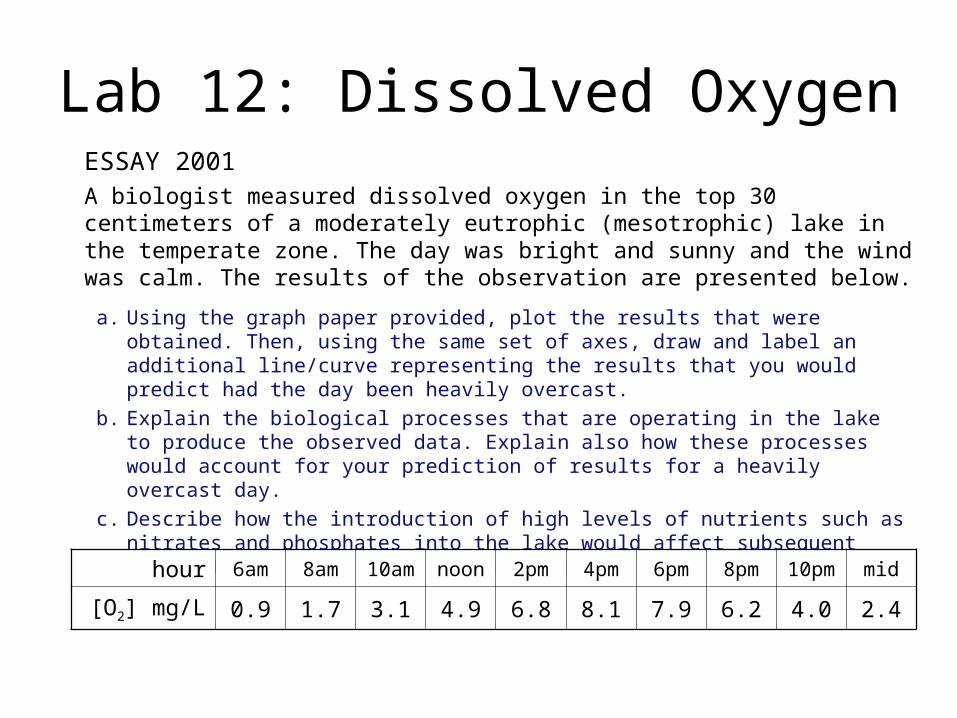
Lab 12: Dissolved OxygenESSAY 2001A biologist measured dissolved oxygen in the top 30 centimeters of a moderately eutrophic (mesotrophic) lake in the temperate zone. The day was bright and sunny and the wind was calm. The results of the observation are presented below.
a. Using the graph paper provided, plot the results that were obtained. Then, using the same set of axes, draw and label an additional line/curve representing the results that you would predict had the day been heavily overcast.
b. Explain the biological processes that are operating in the lake to produce the observed data. Explain also how these processes would account for your prediction of results for a heavily overcast day.
c. Describe how the introduction of high levels of nutrients such as nitrates and phosphates into the lake would affect subsequent observations. Explain your predictions.
hour 6am 8am 10am noon 2pm 4pm 6pm 8pm 10pm mid
[O2] mg/L 0.9 1.7 3.1 4.9 6.8 8.1 7.9 6.2 4.0 2.4
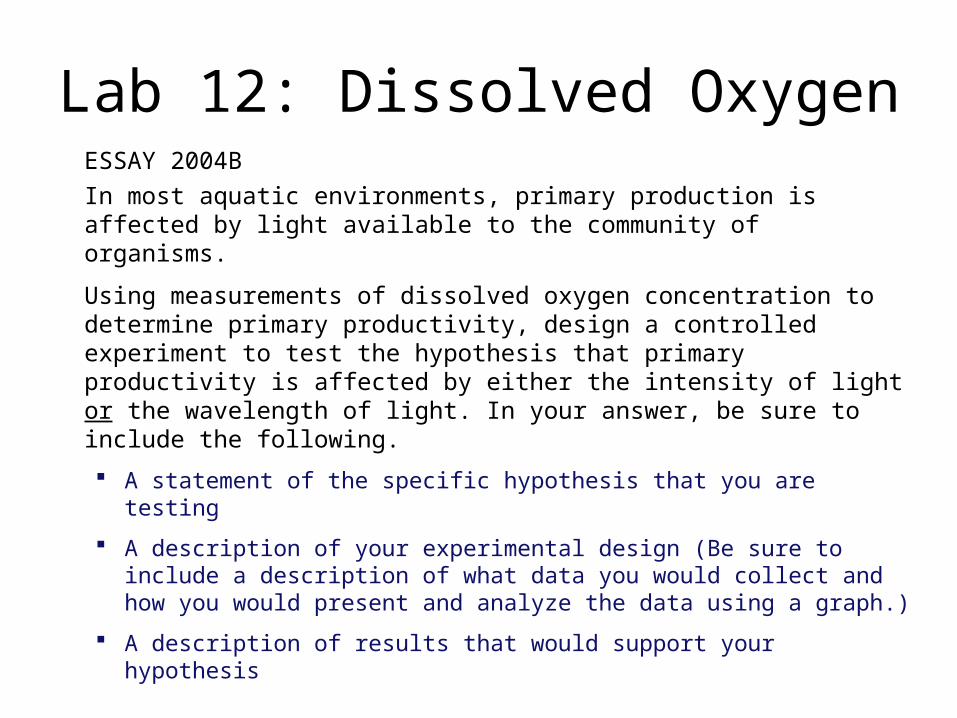
Lab 12: Dissolved OxygenESSAY 2004B
In most aquatic environments, primary production is affected by light available to the community of organisms.
Using measurements of dissolved oxygen concentration to determine primary productivity, design a controlled experiment to test the hypothesis that primary productivity is affected by either the intensity of light or the wavelength of light. In your answer, be sure to include the following.
A statement of the specific hypothesis that you are testing
A description of your experimental design (Be sure to include a description of what data you would collect and how you would present and analyze the data using a graph.)
A description of results that would support your hypothesis


![Environmental Top 10 (a.k.a. how to be environmentally friendly at [insert lab name]) [insert date]](https://img.pdfslide.net/doc/110x75/551827b1550346a7318b4cd9/environmental-top-10-aka-how-to-be-environmentally-friendly-at-insert-lab-name-insert-date.jpg)