Embed Size (px)
Citation preview
CS294-1 (RADS) Fall 200610/13/06
Andrew DahlJeremy SchiffJesse Trutna
Lab 4: Failover with HAProxy
Methods
In this lab we combined our best web farm configuration from Lab 3 with HAProxy tofacilitate both load balancing and failover. This required us adding HAProxy to the VM runningLighthttpd as well as a dedicated failover machine running a set of backup dispatchers,Memcached, and MySQL server. The final configuration consisted of the following:
VM51:• Lighthttpd• HAProxy
VM52 & VM 53:• 3x Dispatchers per server
VM54 & VM55:• MySQL server• Memcached
VM56 & VM57:• Load generators
VM50 (Backup):• 3x Dispatchers• MySQL server• Memcached
(See appendix from web farm configuration diagram)
To test the load balancing and failover mechanisms of HAProxy we started by loading ourweb farm with researchindex_load and successively bringing down each of the main dispatch anddatabase servers. After it was established HAProxy was running correctly we then ran a baselinetest using the same methods as in Lab3: researchindex_load was run on two load serverssimultaneously with a variable number of concurrent users: 1, 5, 10, 25, 50, 100, 500, 1000 (perload server). This run was then repeated twice, tfirst o simulate failure of a dispatch server and athen to simulate the failure of a database server, each being brought down after 25 concurrentusers.
Optimizations
Initially we were having troubles getting HAProxy to work correctly and were also gettinga large number of “500” errors from researchindex_load when trying to generate traffic. After(~10) hours of tweaking the system appeared to be operating in a relatively stable fashion. Thefollowing changes we made:
• Added garbage collection to the dispatchers located in “public/dispatch.fcgi” on alldispatch servers. This was accomplished by changing the following:
RailsFCGIHandler.process! ! RailsFCGIHandler.process! nil, 10
This appeared to solve many of the 500 errors generated and kept dispatchers alive. Infact, the opposite problem then arose. Occassionaly, under heavy load, the dispatchers wouldbecome unresponsive and unkillable.
• Turned off Ajax in the researchindex_load script, which was commented “#partiallyworking” by making the following change:
cfg_forms.use_ajax = true ! cfg_forms.use_ajax = false
• Tweaking HAProxy settings, especially timeout intervals and number of connectionretries. A copy of our HAProxy configuration file is presented in the appendix.
• Removed a call in researchindex_load to parse what it defined as “a partial page”, Thismethod was not defined in the file and when called generated an error. We don’t thismethod call participated in generating “500” errors, at least in most cases, but was fixedfor safety.
Results
HAProxy test
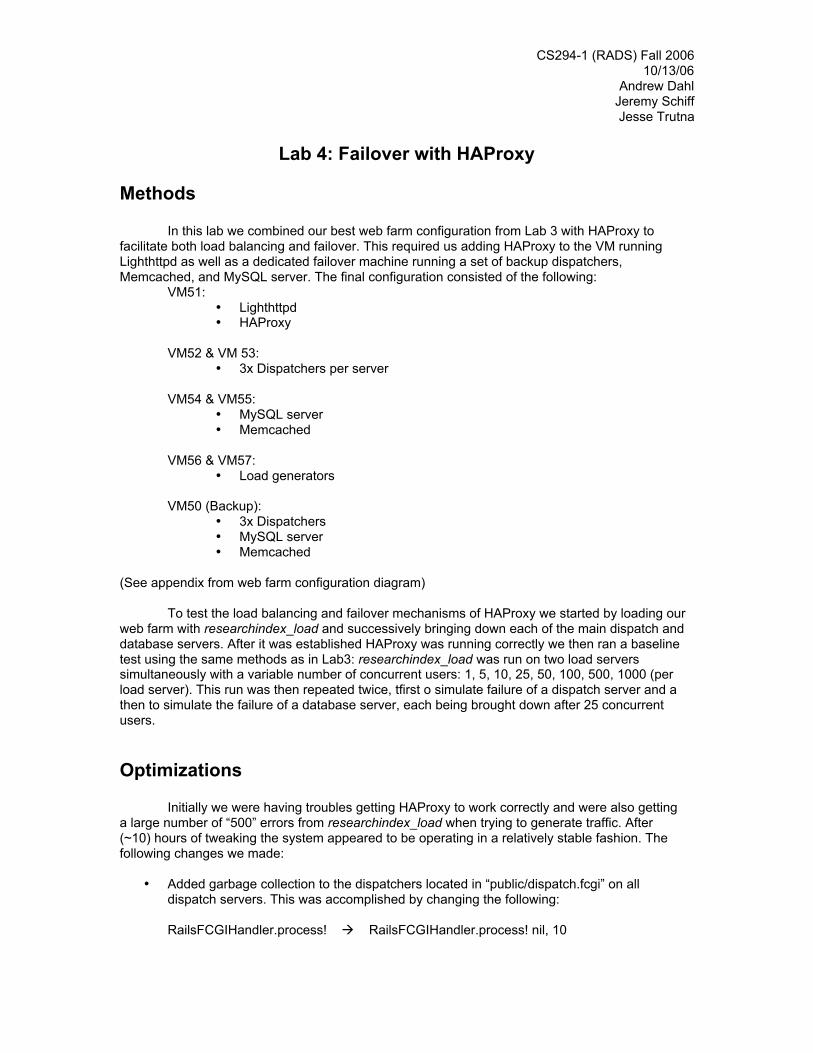
1) Normal operation
2)
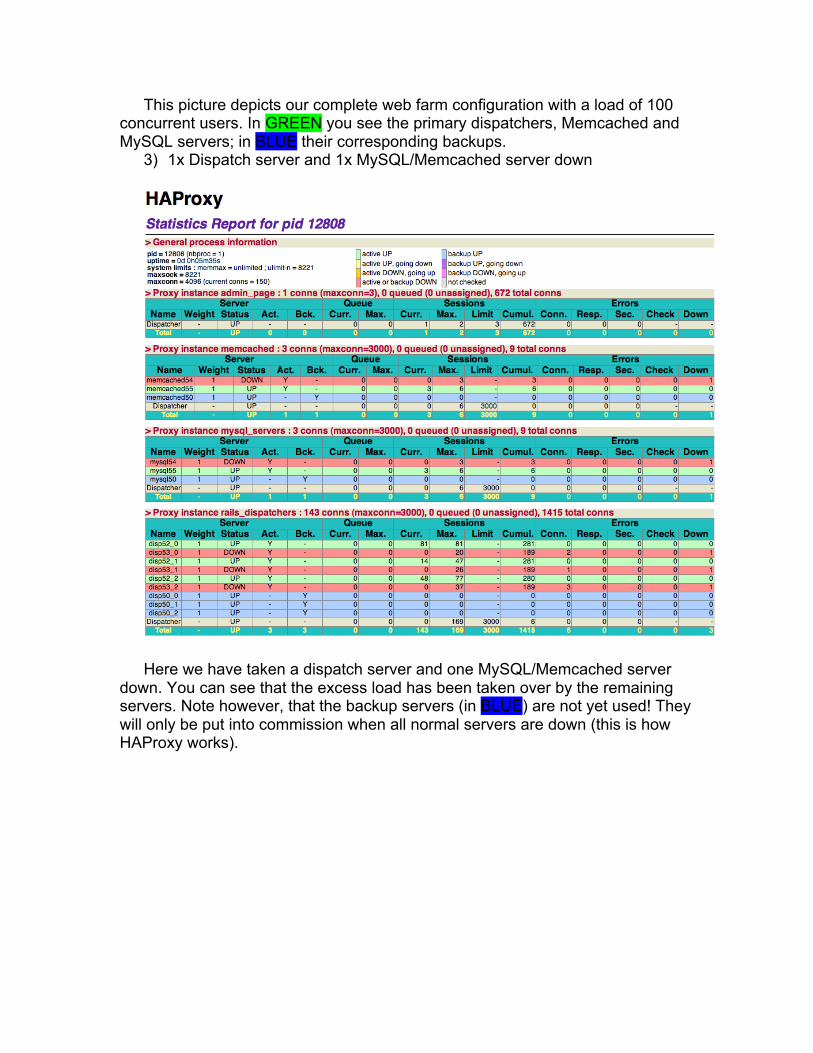
This picture depicts our complete web farm configuration with a load of 100concurrent users. In GREEN you see the primary dispatchers, Memcached andMySQL servers; in BLUE their corresponding backups.
3) 1x Dispatch server and 1x MySQL/Memcached server down
Here we have taken a dispatch server and one MySQL/Memcached serverdown. You can see that the excess load has been taken over by the remainingservers. Note however, that the backup servers (in BLUE) are not yet used! Theywill only be put into commission when all normal servers are down (this is howHAProxy works).
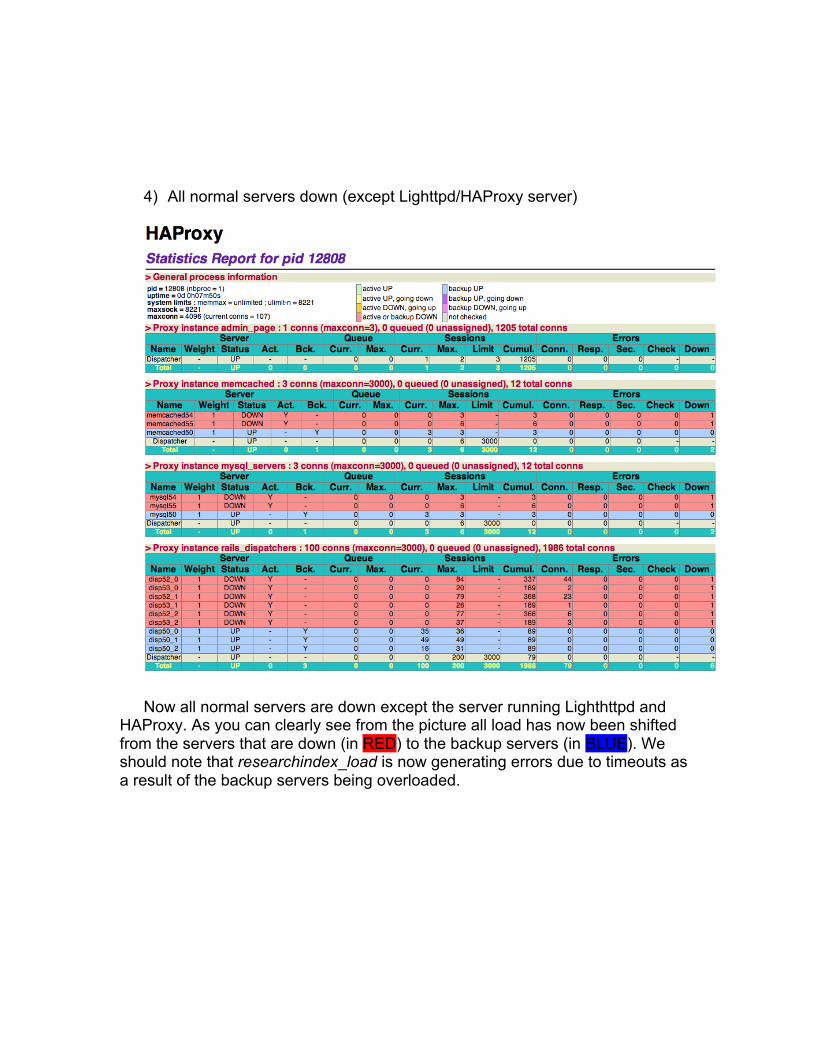
4) All normal servers down (except Lighttpd/HAProxy server)
Now all normal servers are down except the server running Lighthttpd andHAProxy. As you can clearly see from the picture all load has now been shiftedfrom the servers that are down (in RED) to the backup servers (in BLUE). Weshould note that researchindex_load is now generating errors due to timeouts asa result of the backup servers being overloaded.
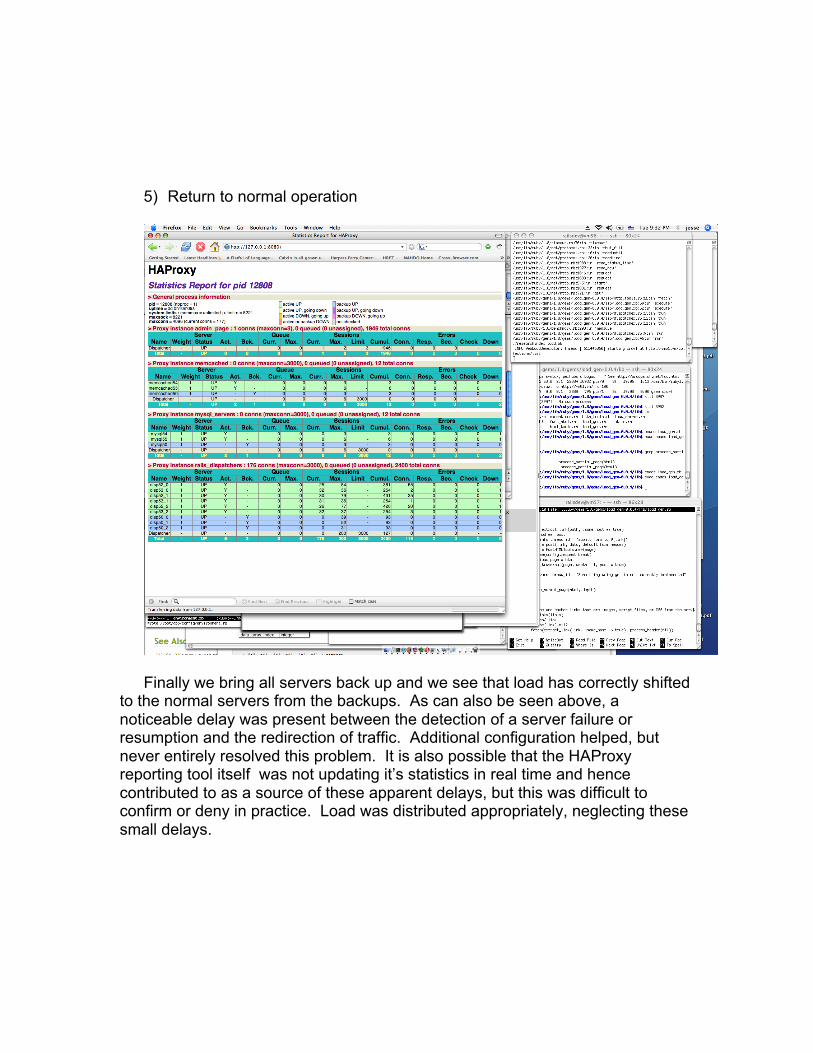
5) Return to normal operation
Finally we bring all servers back up and we see that load has correctly shiftedto the normal servers from the backups. As can also be seen above, anoticeable delay was present between the detection of a server failure orresumption and the redirection of traffic. Additional configuration helped, butnever entirely resolved this problem. It is also possible that the HAProxyreporting tool itself was not updating it’s statistics in real time and hencecontributed to as a source of these apparent delays, but this was difficult toconfirm or deny in practice. Load was distributed appropriately, neglecting thesesmall delays.
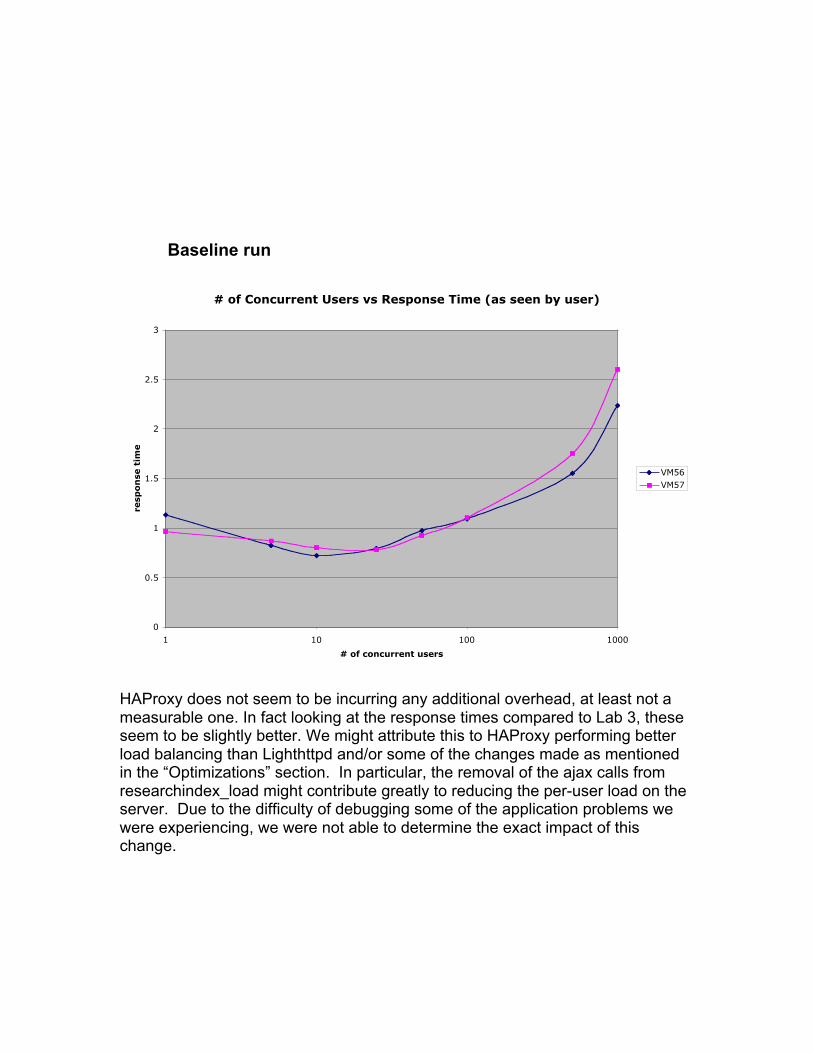
Baseline run
# of Concurrent Users vs Response Time (as seen by user)
0
0.5
1
1.5
2
2.5
3
1 10 100 1000
# of concurrent users
resp
on
se t
ime
VM56
VM57
HAProxy does not seem to be incurring any additional overhead, at least not ameasurable one. In fact looking at the response times compared to Lab 3, theseseem to be slightly better. We might attribute this to HAProxy performing betterload balancing than Lighthttpd and/or some of the changes made as mentionedin the “Optimizations” section. In particular, the removal of the ajax calls fromresearchindex_load might contribute greatly to reducing the per-user load on theserver. Due to the difficulty of debugging some of the application problems wewere experiencing, we were not able to determine the exact impact of thischange.
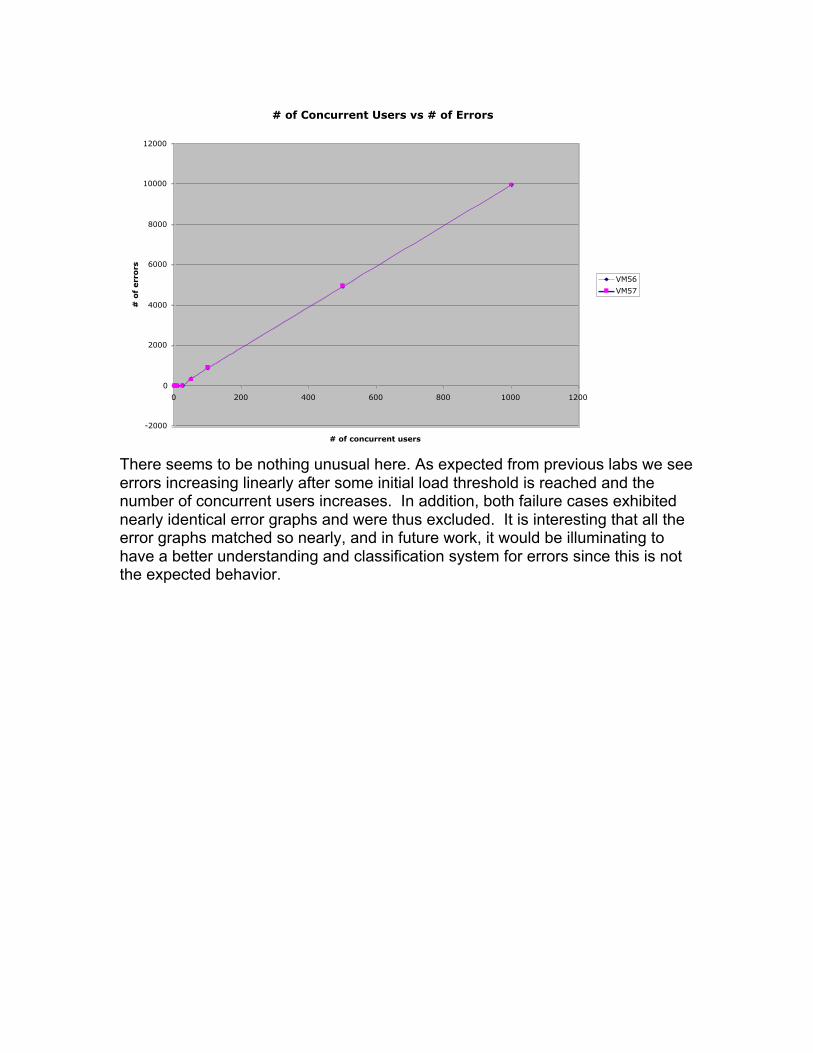
# of Concurrent Users vs # of Errors
-2000
0
2000
4000
6000
8000
10000
12000
0 200 400 600 800 1000 1200
# of concurrent users
# o
f e
rro
rs
VM56
VM57
There seems to be nothing unusual here. As expected from previous labs we seeerrors increasing linearly after some initial load threshold is reached and thenumber of concurrent users increases. In addition, both failure cases exhibitednearly identical error graphs and were thus excluded. It is interesting that all theerror graphs matched so nearly, and in future work, it would be illuminating tohave a better understanding and classification system for errors since this is notthe expected behavior.
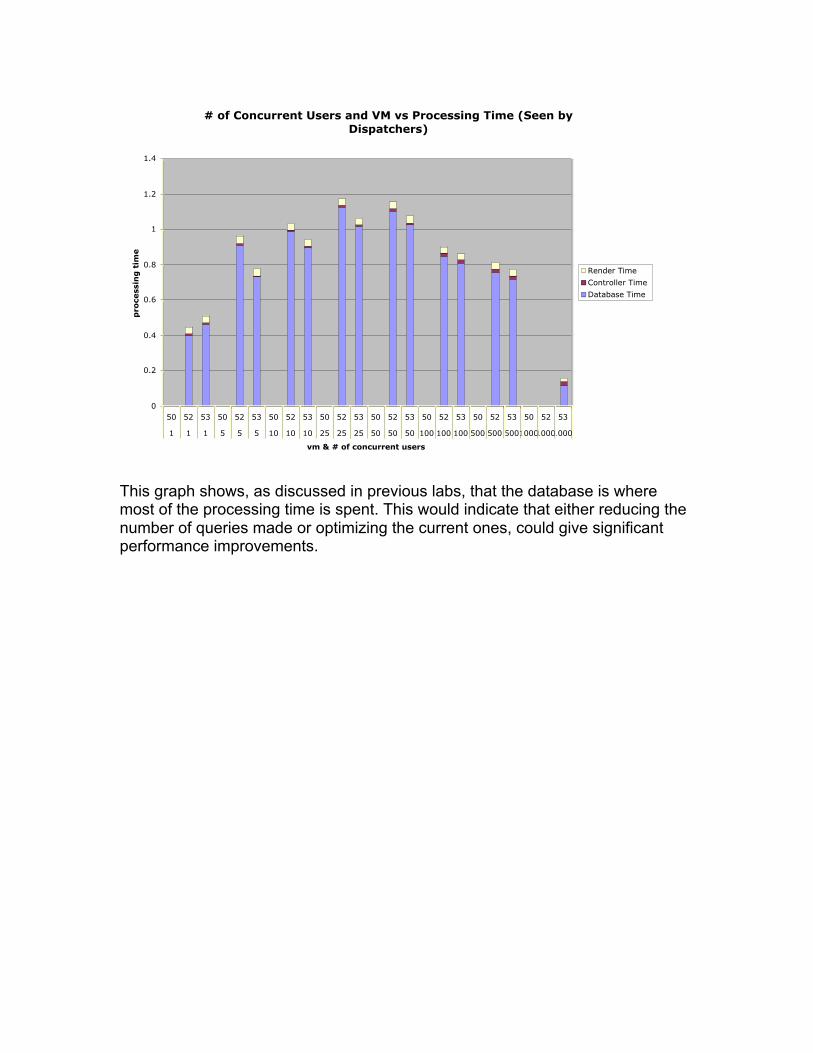
# of Concurrent Users and VM vs Processing Time (Seen by
Dispatchers)
0
0.2
0.4
0.6
0.8
1
1.2
1.4
50 52 53 50 52 53 50 52 53 50 52 53 50 52 53 50 52 53 50 52 53 50 52 53
1 1 1 5 5 5 10 10 10 25 25 25 50 50 50 100 100 100 500 500 500100010001000
vm & # of concurrent users
pro
cessin
g t
ime
Render Time
Controller Time
Database Time
This graph shows, as discussed in previous labs, that the database is wheremost of the processing time is spent. This would indicate that either reducing thenumber of queries made or optimizing the current ones, could give significantperformance improvements.
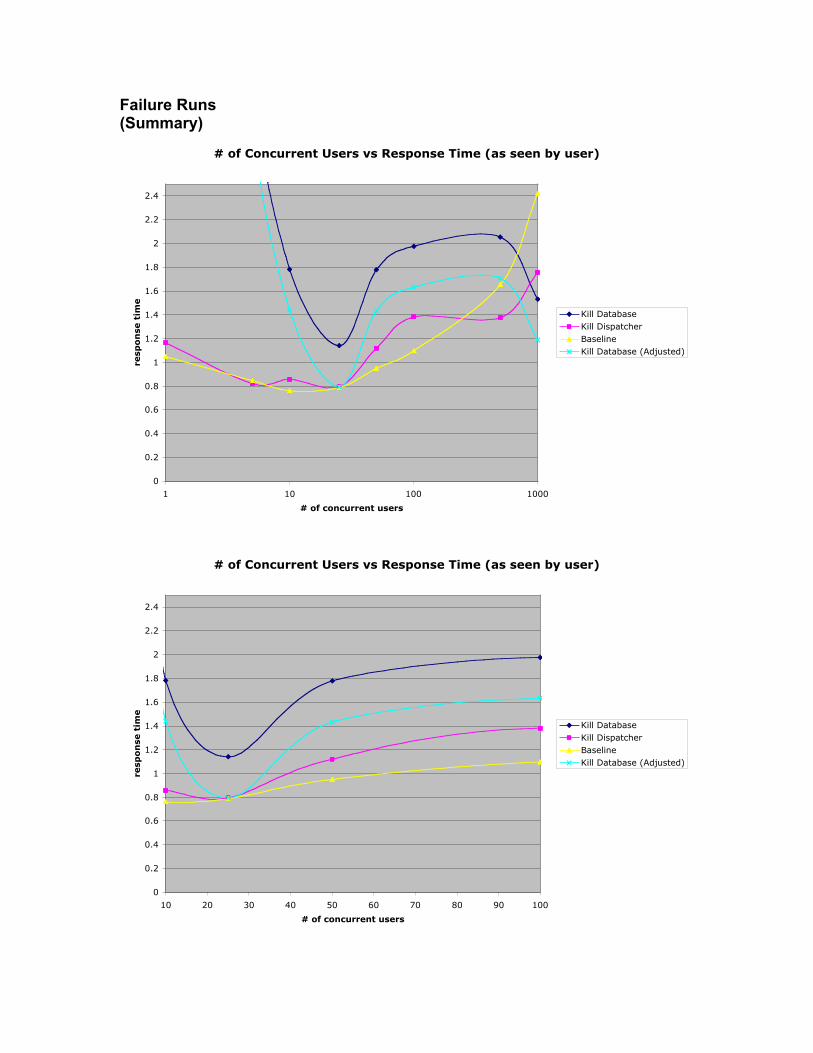
Failure Runs(Summary)
# of Concurrent Users vs Response Time (as seen by user)
0
0.2
0.4
0.6
0.8
1
1.2
1.4
1.6
1.8
2
2.2
2.4
1 10 100 1000
# of concurrent users
resp
on
se t
ime
Kill Database
Kill Dispatcher
Baseline
Kill Database (Adjusted)
# of Concurrent Users vs Response Time (as seen by user)
0
0.2
0.4
0.6
0.8
1
1.2
1.4
1.6
1.8
2
2.2
2.4
10 20 30 40 50 60 70 80 90 100
# of concurrent users
resp
on
se t
ime
Kill Database
Kill Dispatcher
Baseline
Kill Database (Adjusted)
In each of the failure runs, the failing server was killed after thecompletion of the 25 user run. The 50 user run was then started. As canbe seen in the above graphs, both failure cases show an approximatelyproportional increase in response time over the 25-100 user case, asexpected. Unexpected results for the database and dispatcher failurecases are explored further in the following sections. Due to the latency ofthe shutdown command, it is possible that some 50 user requests weredispatched to the failing server.
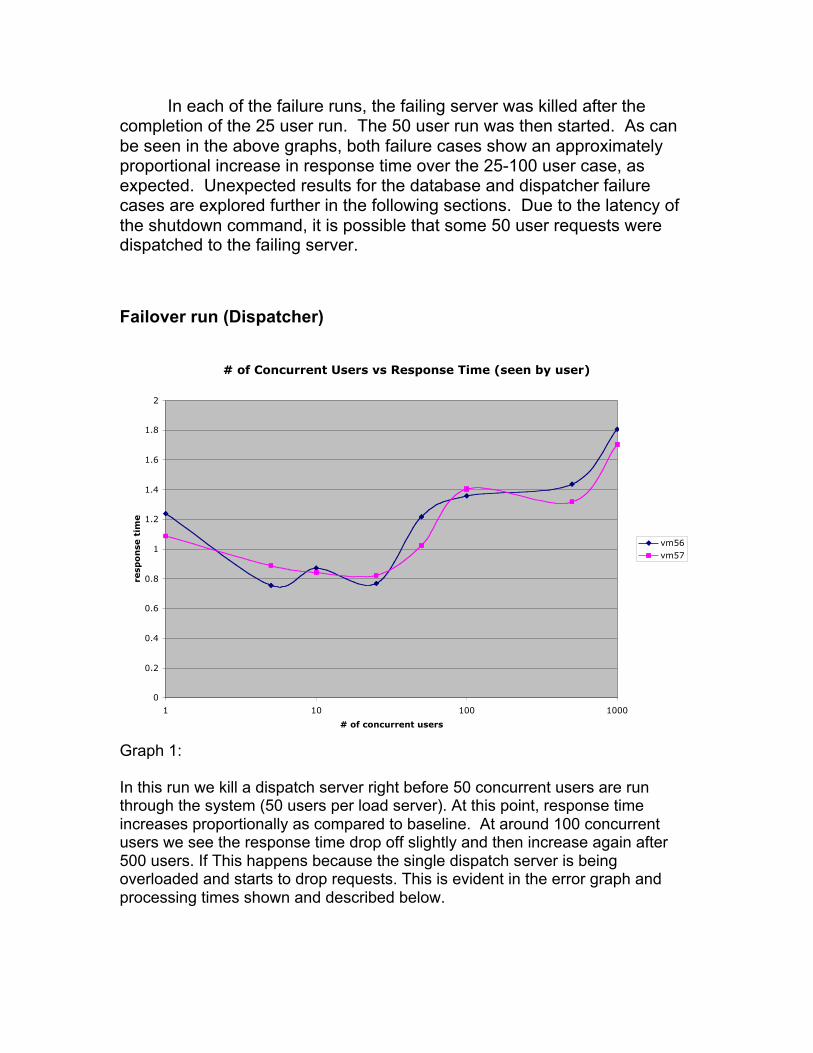
Failover run (Dispatcher)
# of Concurrent Users vs Response Time (seen by user)
0
0.2
0.4
0.6
0.8
1
1.2
1.4
1.6
1.8
2
1 10 100 1000
# of concurrent users
resp
on
se t
ime
vm56
vm57
Graph 1:
In this run we kill a dispatch server right before 50 concurrent users are runthrough the system (50 users per load server). At this point, response timeincreases proportionally as compared to baseline. At around 100 concurrentusers we see the response time drop off slightly and then increase again after500 users. If This happens because the single dispatch server is beingoverloaded and starts to drop requests. This is evident in the error graph andprocessing times shown and described below.
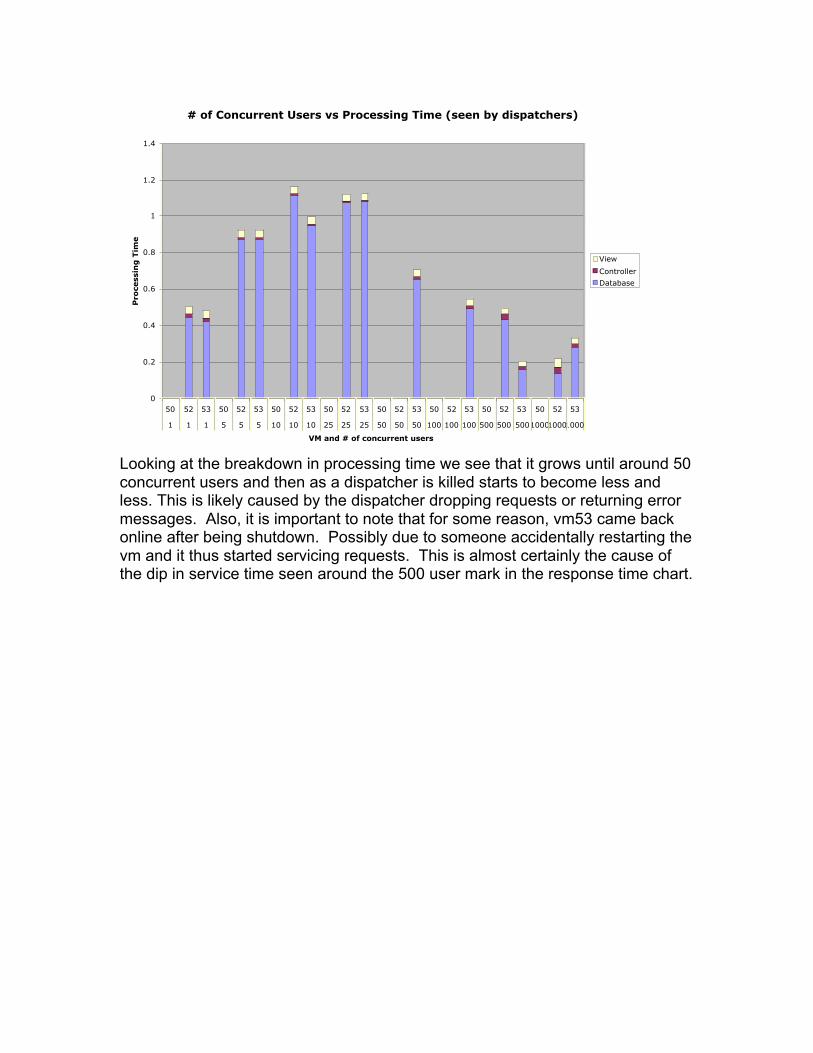
# of Concurrent Users vs Processing Time (seen by dispatchers)
0
0.2
0.4
0.6
0.8
1
1.2
1.4
50 52 53 50 52 53 50 52 53 50 52 53 50 52 53 50 52 53 50 52 53 50 52 53
1 1 1 5 5 5 10 10 10 25 25 25 50 50 50 100 100 100 500 500 500100010001000
VM and # of concurrent users
Pro
cessin
g T
ime
View
Controller
Database
Looking at the breakdown in processing time we see that it grows until around 50concurrent users and then as a dispatcher is killed starts to become less andless. This is likely caused by the dispatcher dropping requests or returning errormessages. Also, it is important to note that for some reason, vm53 came backonline after being shutdown. Possibly due to someone accidentally restarting thevm and it thus started servicing requests. This is almost certainly the cause ofthe dip in service time seen around the 500 user mark in the response time chart.
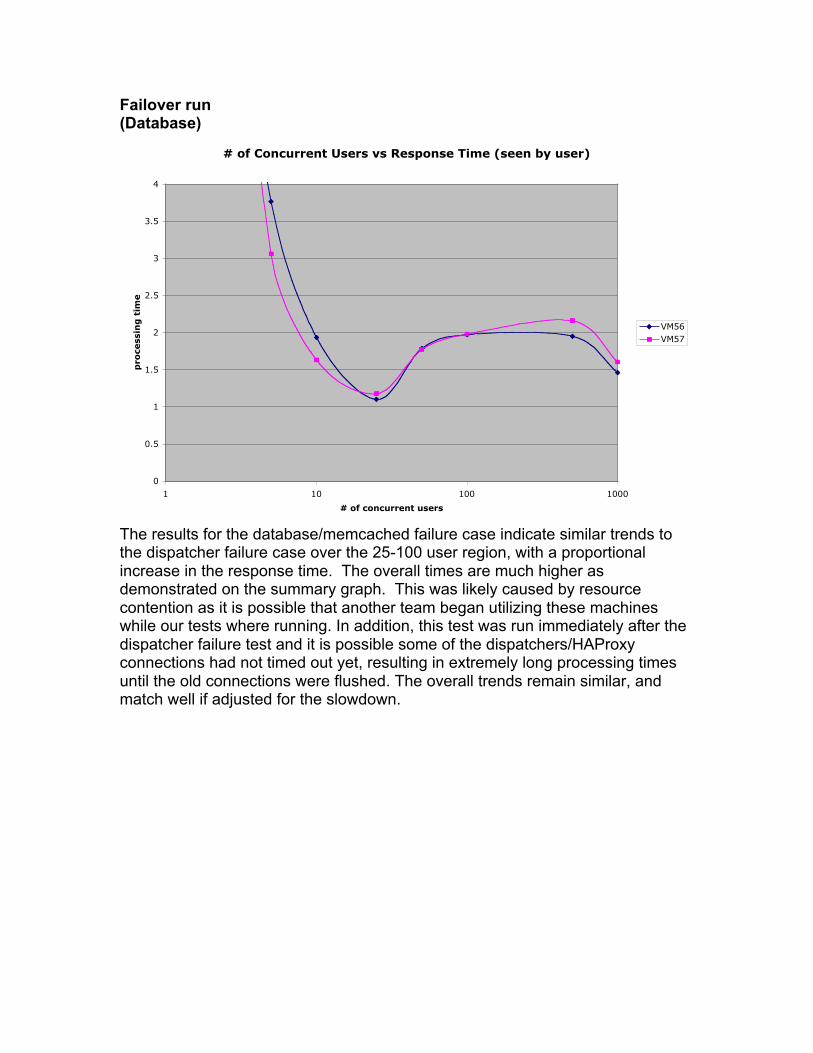
Failover run(Database)
# of Concurrent Users vs Response Time (seen by user)
0
0.5
1
1.5
2
2.5
3
3.5
4
1 10 100 1000
# of concurrent users
pro
cessin
g t
ime
VM56
VM57
The results for the database/memcached failure case indicate similar trends tothe dispatcher failure case over the 25-100 user region, with a proportionalincrease in the response time. The overall times are much higher asdemonstrated on the summary graph. This was likely caused by resourcecontention as it is possible that another team began utilizing these machineswhile our tests where running. In addition, this test was run immediately after thedispatcher failure test and it is possible some of the dispatchers/HAProxyconnections had not timed out yet, resulting in extremely long processing timesuntil the old connections were flushed. The overall trends remain similar, andmatch well if adjusted for the slowdown.
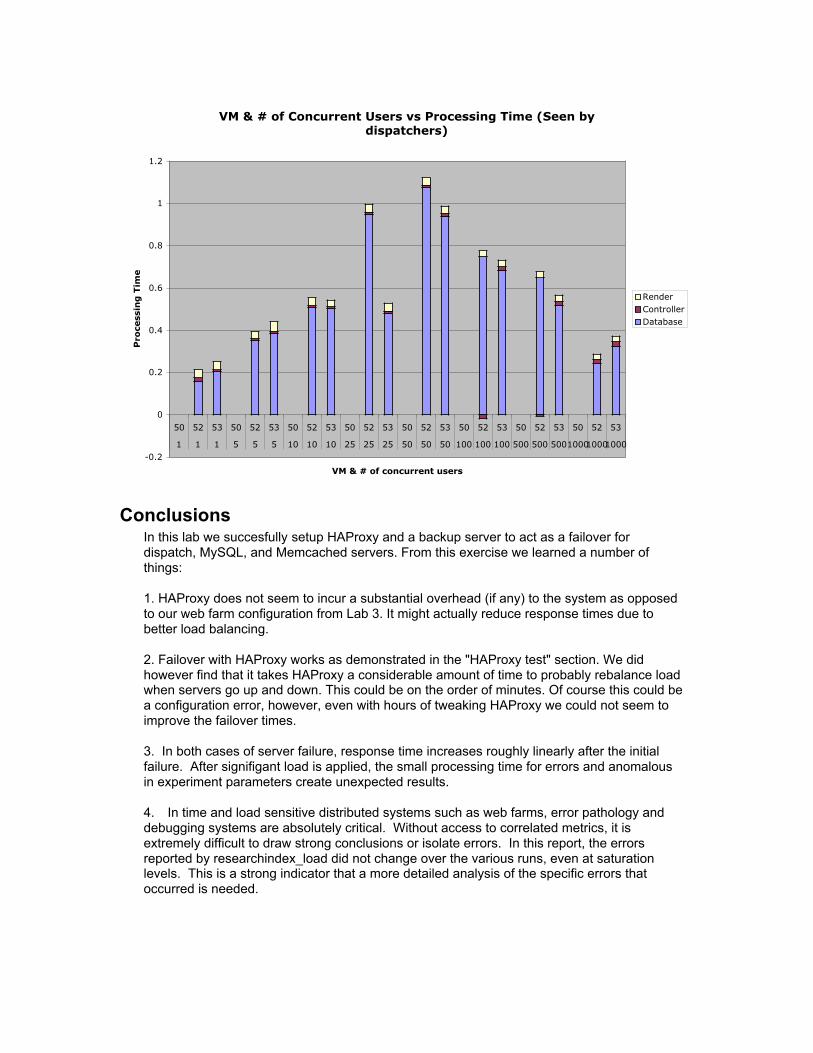
VM & # of Concurrent Users vs Processing Time (Seen by dispatchers)
-0.2
0
0.2
0.4
0.6
0.8
1
1.2
50 52 53 50 52 53 50 52 53 50 52 53 50 52 53 50 52 53 50 52 53 50 52 53
1 1 1 5 5 5 10 10 10 25 25 25 50 50 50 100 100 100 500 500 500100010001000
VM & # of concurrent users
Pro
cessin
g T
ime
Render
Controller
Database
ConclusionsIn this lab we succesfully setup HAProxy and a backup server to act as a failover fordispatch, MySQL, and Memcached servers. From this exercise we learned a number ofthings:
1. HAProxy does not seem to incur a substantial overhead (if any) to the system as opposedto our web farm configuration from Lab 3. It might actually reduce response times due tobetter load balancing.
2. Failover with HAProxy works as demonstrated in the "HAProxy test" section. We didhowever find that it takes HAProxy a considerable amount of time to probably rebalance loadwhen servers go up and down. This could be on the order of minutes. Of course this could bea configuration error, however, even with hours of tweaking HAProxy we could not seem toimprove the failover times.
3. In both cases of server failure, response time increases roughly linearly after the initialfailure. After signifigant load is applied, the small processing time for errors and anomalousin experiment parameters create unexpected results.
4. In time and load sensitive distributed systems such as web farms, error pathology anddebugging systems are absolutely critical. Without access to correlated metrics, it isextremely difficult to draw strong conclusions or isolate errors. In this report, the errorsreported by researchindex_load did not change over the various runs, even at saturationlevels. This is a strong indicator that a more detailed analysis of the specific errors thatoccurred is needed.
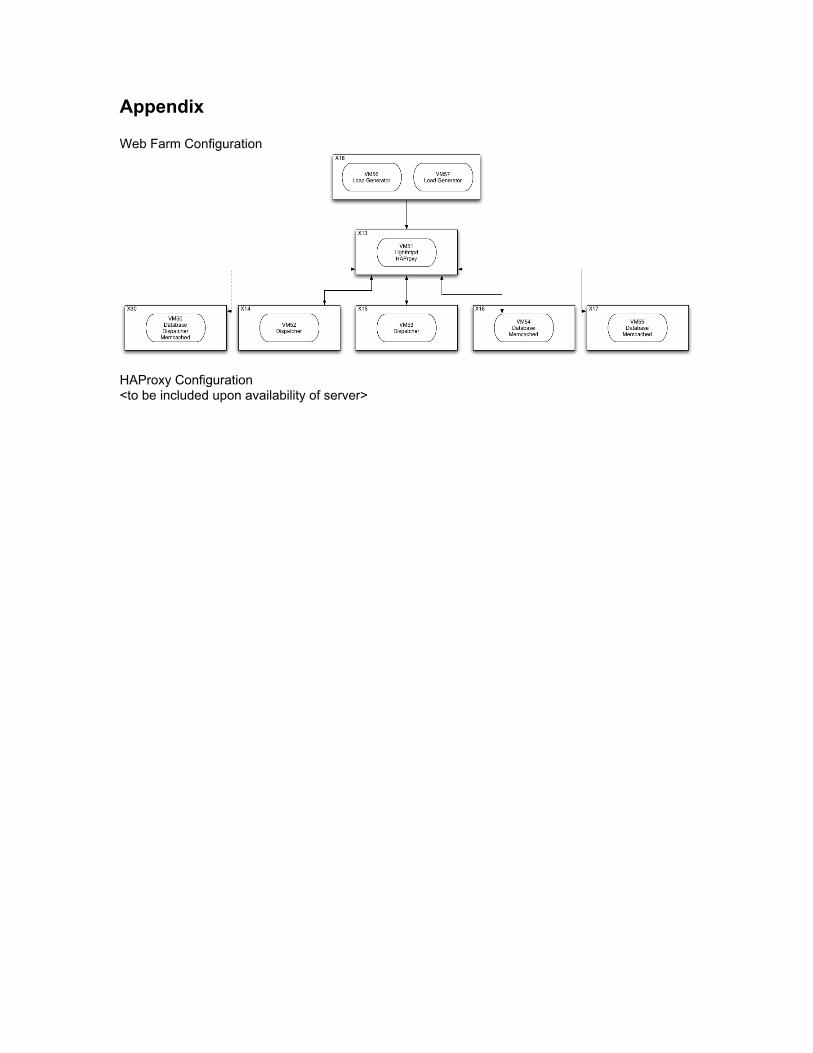
Appendix
Web Farm Configuration
HAProxy Configuration<to be included upon availability of server>