Embed Size (px)
Citation preview
Label-free DNA imaging in vivo with stimulated Ramanscattering microscopyFa-Ke Lua,1, Srinjan Basub,1,2, Vivien Igrasc, Mai P. Hoangd, Minbiao Jia, Dan Fua, Gary R. Holtoma, Victor A. Neele,Christian W. Freudigera,3, David E. Fisherc,4, and X. Sunney Xiea,4
aDepartment of Chemistry and Chemical Biology, Harvard University, Cambridge, MA 02138; bDepartment of Molecular and Cellular Biology, HarvardUniversity, Cambridge, MA 02138; cCutaneous Biology Research Center, Department of Dermatology, Massachusetts General Hospital, Harvard MedicalSchool, Charlestown, MA 02129; dDepartment of Pathology, Massachusetts General Hospital, Harvard Medical School, Boston, MA 02114; and eDepartmentof Dermatology, Massachusetts General Hospital, Harvard Medical School, Boston, MA 02114
Contributed by X. Sunney Xie, August 2, 2015 (sent for review April 16, 2015; reviewed by Daniel Côté and Hervé Rigneault)
Label-free DNA imaging is highly desirable in biology and medicine toperform live imaging without affecting cell function and to obtaininstant histological tissue examination during surgical procedures.Here we show a label-free DNA imaging method with stimulatedRaman scattering (SRS) microscopy for visualization of the cell nucleiin live animals and intact fresh human tissues with subcellularresolution. Relying on the distinct Raman spectral features of thecarbon-hydrogen bonds in DNA, the distribution of DNA is retrievedfrom the strong background of proteins and lipids by linear de-composition of SRS images at three optimally selected Raman shifts.Based on changes on DNA condensation in the nucleus, we were ableto capture chromosome dynamics during cell division both in vitroand in vivo. We tracked mouse skin cell proliferation, induced by drugtreatment, through in vivo counting of the mitotic rate. Furthermore,we demonstrated a label-free histology method for human skincancer diagnosis that provides comparable results to other conven-tional tissue staining methods such as H&E. Our approach exhibitshigher sensitivity than SRS imaging of DNA in the fingerprint spectralregion. Compared with spontaneous Raman imaging of DNA, ourapproach is three orders of magnitude faster, allowing both chroma-tin dynamic studies and label-free optical histology in real time.
stimulated Raman scattering microscopy | skin cancer | label-freehistology | cell division | mitotic rate
In vivo imaging of chromatin or chromosome structures anddynamics during vital cellular processes, such as cell division,
differentiation, apoptosis, and carcinogenesis, generally relies onthe use of either exogenous or endogenous fluorescent labels, thelatter of which often involves complicated transgenic organisms(1, 2). A label-free approach, however, allows the visualization ofthese processes in a noninvasive way in live organisms. In med-icine, visualization of nuclear morphology, architecture, size,shape, and mitotic figures provide the most important cytologicfeatures for rendering histologic diagnosis (3, 4). Conventionalhistology is heavily reliant on tissue biopsies and staining (suchas H&E or immunohistochemistry), whereas label-free imagingis able to reveal similar information as that from the stainedtissue, and in addition, it allows for a noninvasive characteriza-tion and diagnosis of human tissue in real time in vivo.Stimulated Raman scattering (SRS) microscopy offers a con-
trast mechanism based on Raman spectroscopy, probing the in-trinsic vibrational frequencies of chemical bonds or groups (5–8).In SRS microscopy, the collinear pump and Stokes laser beams,at frequencies of ωp and ωs, respectively, are tightly focused ontothe sample (Fig. 1A). When the frequency difference, ωp − ωs,matches a Raman-active molecular vibration, the SRS signal(attenuation to the pump beam or increase on the Stokes beam)is generated through a nonlinear process similar to the stimu-lated emission. With a highly sensitive detection scheme, involvingmegahertz modulation transfer, SRS microscopy exhibits orders ofmagnitude of shorter acquisition time than conventional Ramanmicroscopy (5). Being a nonlinear optical microscopy, it offers 3D
sectioning capability with a diffraction-limited spatial resolution. SRSmicroscopy has been extensively applied to image biomolecules incells and tissues (9–15).SRS imaging was initially carried out at one Raman shift at a
time (5). Recent developments on multiplex detection allow fordistinguishing various chemical species with overlapping Ramanbands by either broadband excitation (16, 17) or narrowbandscanning (18, 19). SRS at two specific Raman shifts within thebroadband of the carbon-hydrogen (CH) stretching vibrationalmode (2,800–3,050 cm−1) has been used to simultaneously mapprotein and lipid distribution in cells and tissues (20, 21). In par-ticular, protein and lipid imaging has been applied to delineatebrain tumor margins, providing images similar to conventionalH&E staining (11). However, SRS does not offer detailed nuclearmorphology and architecture, compared with the conventionalhistology, due to the lack of imaging contrast for DNA.SRS has been demonstrated to be valuable for DNA imaging in
cultured cells based on detection of the phosphate peaks withinthe fingerprint spectral region (22). However, imaging of DNA inthis spectral region is difficult for cells in interphase because ofthe lower DNA density, especially in live tissue. This challenge isalso the case for spontaneous Raman imaging (SI Text) (23).
Significance
Microscopic imaging of DNA has to rely on the use of fluores-cent staining, an exogenous labeling in biological and bio-medical studies, which often leads to uncertainty with respectto the quality and homogeneity of the staining. Label-freeimaging of DNA will enable noninvasive visualization of livecell nuclei in both human and animals. Spontaneous Ramanmicrospectroscopy offers label-free chemical contrast for DNAimaging; however, its slow imaging speed hampers its wideapplication for in vivo and dynamic studies. Here we developeda novel and simple approach with multicolor stimulated Ramanscattering microscopy to evaluate rapid DNA imaging, whichcan be applied to both in vivo DNA dynamic studies and instantlabel-free human skin cancer diagnosis.
Author contributions: F.L., S.B., C.W.F., D.E.F., and X.S.X. designed research; F.L., S.B., andV.I. performed research; M.J., D.F., and G.R.H. contributed new reagents/analytic tools;F.L., S.B., M.P.H., V.A.N., D.E.F., and X.S.X. analyzed data; and F.L., S.B., D.E.F., and X.S.X.wrote the paper.
Reviewers: D.C., Université Laval; and H.R., Institut Fresnel.
Conflict of interest statement: C.W.F and X.S.X are cofounders of Invenio Imaging, Inc.,USA. All other authors declare no conflict of interest.1F.L. and S.B. contributed equally to this work.2Present address: Department of Biochemistry, University of Cambridge, Cambridge CB21GA, United Kingdom.
3Present address: Invenio Imaging, Inc., Menlo Park, CA 94025.4To whom correspondence may be addressed. Email: [email protected] [email protected].
This article contains supporting information online at www.pnas.org/lookup/suppl/doi:10.1073/pnas.1515121112/-/DCSupplemental.
www.pnas.org/cgi/doi/10.1073/pnas.1515121112 PNAS Early Edition | 1 of 6
MED
ICALSC
IENCE
SAPP
LIED
PHYS
ICAL
SCIENCE
S
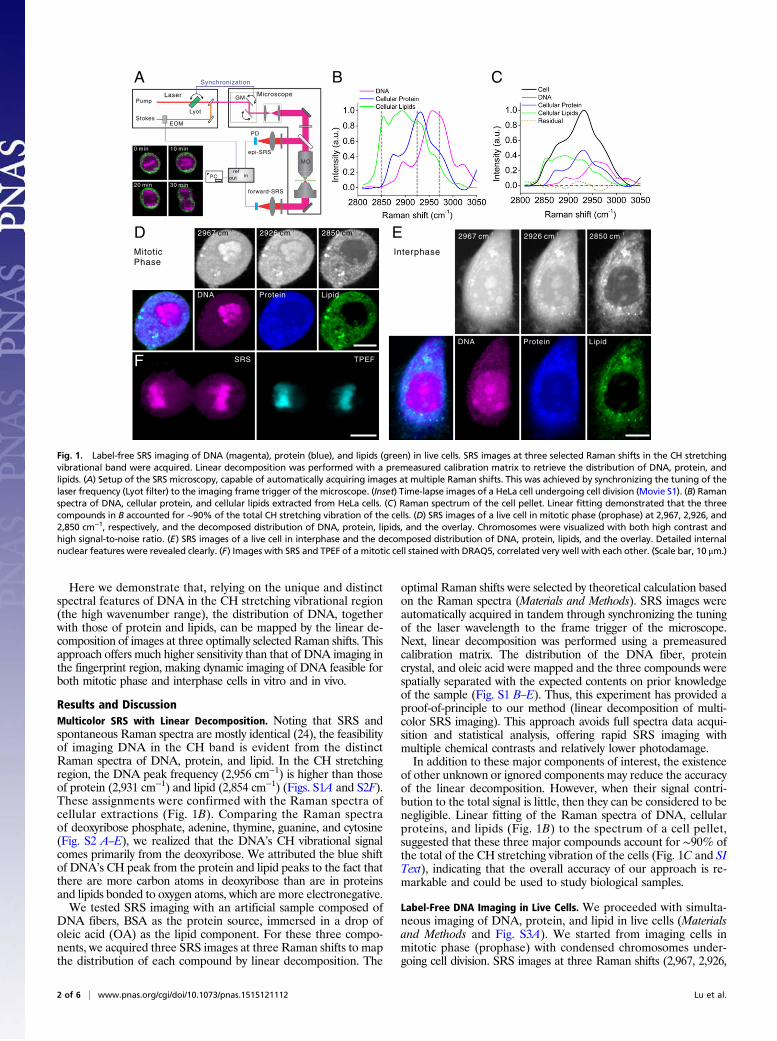
Here we demonstrate that, relying on the unique and distinctspectral features of DNA in the CH stretching vibrational region(the high wavenumber range), the distribution of DNA, togetherwith those of protein and lipids, can be mapped by the linear de-composition of images at three optimally selected Raman shifts. Thisapproach offers much higher sensitivity than that of DNA imaging inthe fingerprint region, making dynamic imaging of DNA feasible forboth mitotic phase and interphase cells in vitro and in vivo.
Results and DiscussionMulticolor SRS with Linear Decomposition. Noting that SRS andspontaneous Raman spectra are mostly identical (24), the feasibilityof imaging DNA in the CH band is evident from the distinctRaman spectra of DNA, protein, and lipid. In the CH stretchingregion, the DNA peak frequency (2,956 cm−1) is higher than thoseof protein (2,931 cm−1) and lipid (2,854 cm−1) (Figs. S1A and S2F).These assignments were confirmed with the Raman spectra ofcellular extractions (Fig. 1B). Comparing the Raman spectraof deoxyribose phosphate, adenine, thymine, guanine, and cytosine(Fig. S2 A–E), we realized that the DNA’s CH vibrational signalcomes primarily from the deoxyribose. We attributed the blue shiftof DNA’s CH peak from the protein and lipid peaks to the fact thatthere are more carbon atoms in deoxyribose than are in proteinsand lipids bonded to oxygen atoms, which are more electronegative.We tested SRS imaging with an artificial sample composed of
DNA fibers, BSA as the protein source, immersed in a drop ofoleic acid (OA) as the lipid component. For these three compo-nents, we acquired three SRS images at three Raman shifts to mapthe distribution of each compound by linear decomposition. The
optimal Raman shifts were selected by theoretical calculation basedon the Raman spectra (Materials and Methods). SRS images wereautomatically acquired in tandem through synchronizing the tuningof the laser wavelength to the frame trigger of the microscope.Next, linear decomposition was performed using a premeasuredcalibration matrix. The distribution of the DNA fiber, proteincrystal, and oleic acid were mapped and the three compounds werespatially separated with the expected contents on prior knowledgeof the sample (Fig. S1 B–E). Thus, this experiment has provided aproof-of-principle to our method (linear decomposition of multi-color SRS imaging). This approach avoids full spectra data acqui-sition and statistical analysis, offering rapid SRS imaging withmultiple chemical contrasts and relatively lower photodamage.In addition to these major components of interest, the existence
of other unknown or ignored components may reduce the accuracyof the linear decomposition. However, when their signal contri-bution to the total signal is little, then they can be considered to benegligible. Linear fitting of the Raman spectra of DNA, cellularproteins, and lipids (Fig. 1B) to the spectrum of a cell pellet,suggested that these three major compounds account for ∼90% ofthe total of the CH stretching vibration of the cells (Fig. 1C and SIText), indicating that the overall accuracy of our approach is re-markable and could be used to study biological samples.
Label-Free DNA Imaging in Live Cells. We proceeded with simulta-neous imaging of DNA, protein, and lipid in live cells (Materialsand Methods and Fig. S3A). We started from imaging cells inmitotic phase (prophase) with condensed chromosomes under-going cell division. SRS images at three Raman shifts (2,967, 2,926,
A B C
D E
F
Fig. 1. Label-free SRS imaging of DNA (magenta), protein (blue), and lipids (green) in live cells. SRS images at three selected Raman shifts in the CH stretchingvibrational band were acquired. Linear decomposition was performed with a premeasured calibration matrix to retrieve the distribution of DNA, protein, andlipids. (A) Setup of the SRS microscopy, capable of automatically acquiring images at multiple Raman shifts. This was achieved by synchronizing the tuning of thelaser frequency (Lyot filter) to the imaging frame trigger of the microscope. (Inset) Time-lapse images of a HeLa cell undergoing cell division (Movie S1). (B) Ramanspectra of DNA, cellular protein, and cellular lipids extracted from HeLa cells. (C) Raman spectrum of the cell pellet. Linear fitting demonstrated that the threecompounds in B accounted for ∼90% of the total CH stretching vibration of the cells. (D) SRS images of a live cell in mitotic phase (prophase) at 2,967, 2,926, and2,850 cm−1, respectively, and the decomposed distribution of DNA, protein, lipids, and the overlay. Chromosomes were visualized with both high contrast andhigh signal-to-noise ratio. (E) SRS images of a live cell in interphase and the decomposed distribution of DNA, protein, lipids, and the overlay. Detailed internalnuclear features were revealed clearly. (F) Images with SRS and TPEF of a mitotic cell stained with DRAQ5, correlated very well with each other. (Scale bar, 10 μm.)
2 of 6 | www.pnas.org/cgi/doi/10.1073/pnas.1515121112 Lu et al.

and 2,850 cm−1) were acquired following the approach describedabove. After linear decomposition, the distribution of nucleicacids, proteins, and lipids were mapped (Fig. 1D). ChromosomalDNAs were visualized based on nucleic acids contrast with a highsensitivity. By the optical sectioning capability of SRS, we re-constructed a 3D codistribution of DNA and lipids in a singlecell (Fig. S4A), showing that, although lipids are widely distrib-uted throughout the cell cytoplasm, their density within the cellnucleus is very low, as expected. Protein distribution appears tobe more uniform throughout the entire cell.We next imaged interphase cells and were able to obtain DNA
contrast with a high signal-to-noise ratio (Fig. 1E). Chromatin struc-tures within the cell nuclei such as nucleoli, heterochromatin, andeuchromatin were visualized at the optical diffraction-limited resolu-tion, demonstrating that SRS imaging of DNA in the CH band offershigher sensitivity than that of the fingerprint spectral region (22).We were also able to capture chromosome dynamics during
in vitro cell division by time-lapse SRS imaging. The chromosomesin a metaphase cell are organized along a line in the center of thecell and then are equally split into two parts as the cell enters inanaphase (Fig. 1A, Fig. S3A, and Movie S1). SRS imaging cap-tured these different chromosomal dynamics without inducingobvious photodamage to the live cells, as evidenced by the factthat metaphase cells could finish their natural division processwith successful passage through the critical M-checkpoint. Thisexperiment demonstrates that label-free live cell imaging with SRSis a powerful method to examine chromosome dynamics duringcell division. With this approach, it is also possible to observenucleolus disassembly and reassembly, to determine the conden-sation level of DNA, and to monitor the movement of the chro-mosome during cell division, as well as other crucial cellularprocesses (25).Noteworthy, we observed that there is minimal cross-talk among
the three decomposed images of DNA, protein, and lipid, demon-strating a good decomposition of molecular compounds. The cellnuclei are clearly visualized with a positive contrast from the DNAs,whereas the ribosomal RNAs are mainly distributed in the cyto-plasm, contributing only as a weak background (Fig. 1 D and E andSI Text). To verify the SRS chemical contrast for DNA, we firstimaged the cells with SRS and then labeled the cells with a DNAfluorescent dye (DRAQ5) for two-photon excited fluorescence(TPEF) imaging, showing that the paired images matched wellwith each other (Fig. 1F).
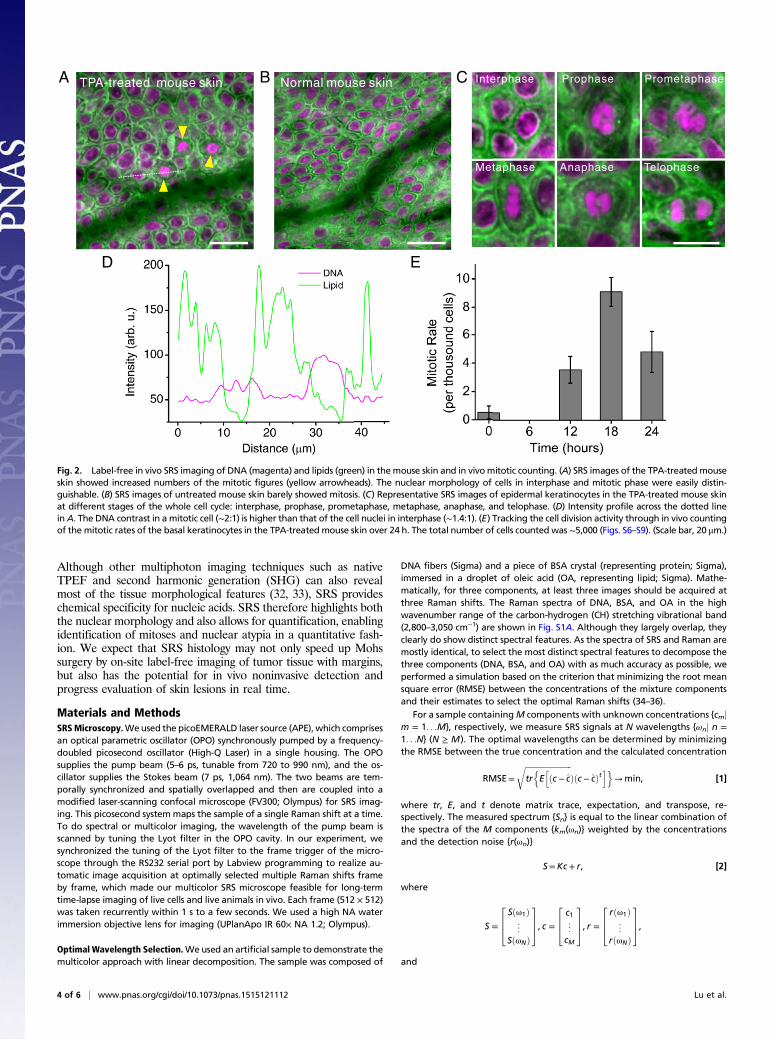
Label-Free DNA Imaging for in Vivo Mitotic Counting.We conductedin vivo SRS imaging of DNA in mouse skin to follow cell divisionactivity. 12-0-Tetradecanoylphorbol-13-acetate (TPA) is a potenttumor promoter that has been used to induce epidermal carci-nogenesis. Topical treatment of mouse skin with TPA inducesepidermal hyperplasia, characterized by significant increase in skinthickness and mass, total number of the cell nuclei, and mitotic rate(26), thus offering an ideal model to study chromosomal dynamicsduring cell division. Although the proliferative effect of TPA on themouse skin has been reported, detailed cell cycle kinetics of thisprocess has not yet been well studied due to the lack of propertools to visualize DNA in vivo.We therefore performed an in vivo imaging of TPA-treated
mouse skin using a skinfold chamber model (Materials and Methodsand Fig. S3 B and C). We found that the number of mitotic cellswas significantly increased in the epidermis (yellow arrowheads inFig. 2A) with respect to their control counterparts (Fig. 2B). Thismitotic cell state was easily identified based on stronger DNAsignals (Fig. 2D), as well as its distinctive morphology of condensedchromosomes, compared with a cell nucleus in interphase (Fig.S4B). Fig. 2C shows representative images of cell nuclei at differentstages of a complete cell cycle, in which nuclear morphology, in-cluding internal detailed structures, was clearly visualized. In ad-dition, unlike in vitro cultured cells, very few lipid droplets were
observed in live mouse skin tissue. Fluorescent staining was used toconfirm the DNA contrast of SRS in intact fresh skin tissue (Fig.S4C). We also captured the dynamic of a cancer cell during di-vision by recording an in vivo SRS movie with the same skinfoldchamber on an immune-deficient mice injected with human can-cer cells to create a xenograft model (Materials and Methods). Thesplitting of the chromosomes was easily seen when the cell wasentering anaphase, by using time-lapse SRS imaging based onDNA contrast (Movie S2).We then tracked the cell cycle kinetics during the proliferation
process through performing in vivo mitotic counting in TPA-treated mouse skin, by applying time-lapse SRS imaging basedon DNA contrast (Materials and Methods and Figs. S3D and S5).Fig. 2E shows the mitotic rates (number of mitotic cells perthousand cells) over a 24-h period with a 6-h interval. Our datashow that mitotic activity reached a peak at ∼18 h and thendecreased at ∼24 h (Figs. S6–S9). This result confirmed that asynchronized wave of basal cell proliferation is induced by TPAin adult mouse skin. We noted that in vivo SRS imaging of DNAmakes this type of dynamic studies possible because of its uniqueproficiencies, including label-free intrinsic chemical contrast, highsensitivity, and 3D sectioning capability, with no photo bleaching.In addition, SRS offers the possibility of label-free imaging of
live cancer cells from primary tumors, which is difficult to labelwith fluorescence without perturbing cell functions. We antici-pate important clinical applications of this approach, such asassessing and screening morphologic effects of antineoplasticagents in real time (27). For in vivo imaging of live animals, amodified skinfold chamber model was used, and a subskin im-plantation model was developed to minimize the breathingmotion artifacts in our experiments, which could also be appliedfor other microscopic imaging modalities. Future SRS technicaldevelopments, such as simultaneous multicolor imaging, videorate scanning, and the design of endoscopic or handheld probes,will further release the critical requirements to the animal im-mobilization strategies.
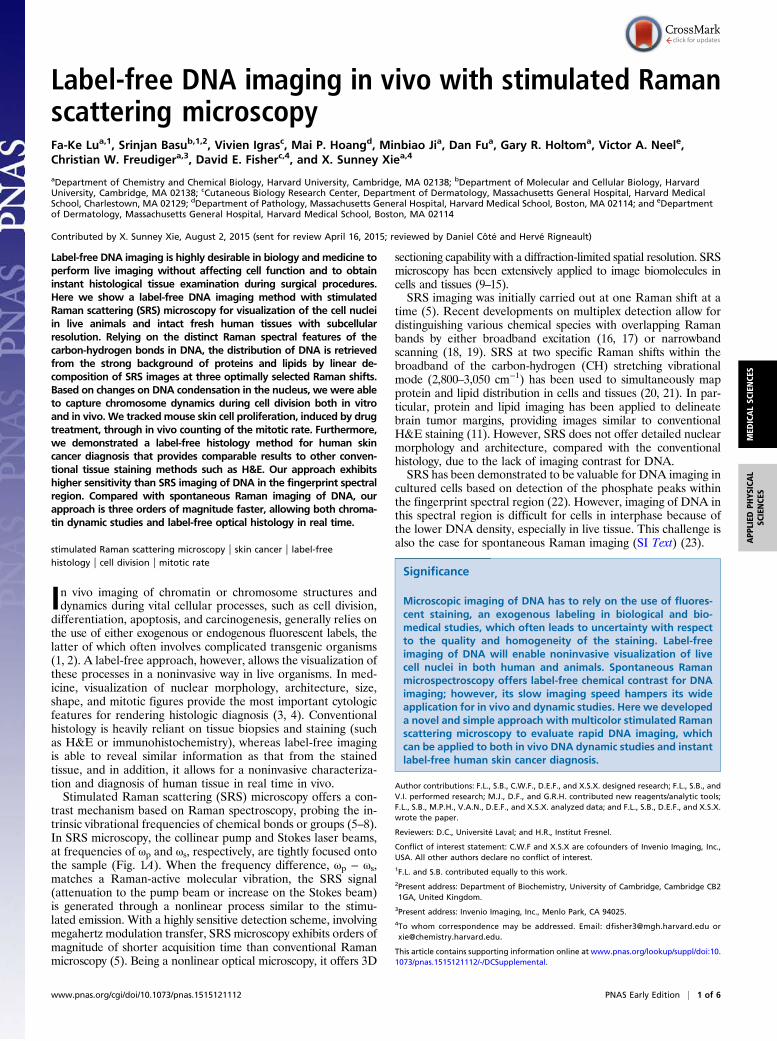
Label-Free SRS Histology for Human Skin Cancer Diagnosis. We broad-ened the use of SRS to image human skin tissue. The nuclearmorphology in normal human skin was clearly visualized withpositive DNA contrast with a high sensitivity, as well as images ofprotein and lipids, which displayed the regularly layered skinstructures (Fig. 3 A and B), providing complementary tissue andcellular morphological information. To first validate the DNAcontrast in human tissue, we imaged the same skin tissue sectionwith SRS and H&E staining in tandem. We found a clear corre-lation in terms of visibility of detailed nuclear morphology andarchitecture, as well as cellular and tissue morphology (Fig. 3 C andD), confirming the effectiveness of our method.To demonstrate the potential of SRS for label-free histology of
cancer in humans, we imaged fresh human skin cancer tissue fromthree surgical cases of squamous cell carcinoma (SCC), the secondmost common type of skin cancer (28). We found that we couldeasily identify an increased number of mitotic figures based onstronger signals and distinctive morphological features of thecondensed chromosomes (yellow arrowheads in Fig. 3E) (29).Mitotic figures are valuable diagnostic and prognostic indicators ofcancer aggressiveness (30), becausew it correlates directly with thelevel of cell division and proliferation. Fig. 3F shows another rep-resentative image of a small nest of carcinoma cells, in which ag-gregated tumor cells with enlarged nuclei (right side of the dottedcurve) are surrounded by nonneoplastic cells with smaller nuclei(left side of the curve), reflecting high intratumoral heterogeneity(31). Our results demonstrate that the multicolor SRS approach forlabel-free imaging of DNA, protein, and lipids in tissues offers clearand equivalent histological features as conventional H&E stainingdoes for skin cancer diagnosis, with the advantage of being a label-free method and thus not affecting the native form of the tissue.
Lu et al. PNAS Early Edition | 3 of 6
MED
ICALSC
IENCE
SAPP
LIED
PHYS
ICAL
SCIENCE
S
Although other multiphoton imaging techniques such as nativeTPEF and second harmonic generation (SHG) can also revealmost of the tissue morphological features (32, 33), SRS provideschemical specificity for nucleic acids. SRS therefore highlights boththe nuclear morphology and also allows for quantification, enablingidentification of mitoses and nuclear atypia in a quantitative fash-ion. We expect that SRS histology may not only speed up Mohssurgery by on-site label-free imaging of tumor tissue with margins,but also has the potential for in vivo noninvasive detection andprogress evaluation of skin lesions in real time.
Materials and MethodsSRSMicroscopy.Weused the picoEMERALD laser source (APE), which comprisesan optical parametric oscillator (OPO) synchronously pumped by a frequency-doubled picosecond oscillator (High-Q Laser) in a single housing. The OPOsupplies the pump beam (5–6 ps, tunable from 720 to 990 nm), and the os-cillator supplies the Stokes beam (7 ps, 1,064 nm). The two beams are tem-porally synchronized and spatially overlapped and then are coupled into amodified laser-scanning confocal microscope (FV300; Olympus) for SRS imag-ing. This picosecond system maps the sample of a single Raman shift at a time.To do spectral or multicolor imaging, the wavelength of the pump beam isscanned by tuning the Lyot filter in the OPO cavity. In our experiment, wesynchronized the tuning of the Lyot filter to the frame trigger of the micro-scope through the RS232 serial port by Labview programming to realize au-tomatic image acquisition at optimally selected multiple Raman shifts frameby frame, which made our multicolor SRS microscope feasible for long-termtime-lapse imaging of live cells and live animals in vivo. Each frame (512 × 512)was taken recurrently within 1 s to a few seconds. We used a high NA waterimmersion objective lens for imaging (UPlanApo IR 60× NA 1.2; Olympus).
Optimal Wavelength Selection.Weused an artificial sample to demonstrate themulticolor approach with linear decomposition. The sample was composed of
DNA fibers (Sigma) and a piece of BSA crystal (representing protein; Sigma),immersed in a droplet of oleic acid (OA, representing lipid; Sigma). Mathe-matically, for three components, at least three images should be acquired atthree Raman shifts. The Raman spectra of DNA, BSA, and OA in the highwavenumber range of the carbon-hydrogen (CH) stretching vibrational band(2,800–3,050 cm−1) are shown in Fig. S1A. Although they largely overlap, theyclearly do show distinct spectral features. As the spectra of SRS and Raman aremostly identical, to select the most distinct spectral features to decompose thethree components (DNA, BSA, and OA) with as much accuracy as possible, weperformed a simulation based on the criterion that minimizing the root meansquare error (RMSE) between the concentrations of the mixture componentsand their estimates to select the optimal Raman shifts (34–36).
For a sample containingM components with unknown concentrations {cmjm = 1. . .M}, respectively, we measure SRS signals at N wavelengths {ωnj n =1. . .N} (N ≥ M). The optimal wavelengths can be determined by minimizingthe RMSE between the true concentration and the calculated concentration
RMSE=
ffiffiffiffiffiffiffiffiffiffiffiffiffiffiffiffiffiffiffiffiffiffiffiffitrnEhðc− c
rÞðc− cÞt
io→min, [1]
where tr, E, and t denote matrix trace, expectation, and transpose, re-spectively. The measured spectrum {Sn} is equal to the linear combination ofthe spectra of the M components {km(ωn)} weighted by the concentrationsand the detection noise {r(ωn)}
S=Kc+ r, [2]
where
S =
264Sðω1Þ
..
.
SðωNÞ
375, c =
264c1...
cM
375, r =
264rðω1Þ
..
.
rðωNÞ
375,
and
A B C
D E
Fig. 2. Label-free in vivo SRS imaging of DNA (magenta) and lipids (green) in themouse skin and in vivomitotic counting. (A) SRS images of the TPA-treated mouseskin showed increased numbers of the mitotic figures (yellow arrowheads). The nuclear morphology of cells in interphase and mitotic phase were easily distin-guishable. (B) SRS images of untreated mouse skin barely showed mitosis. (C) Representative SRS images of epidermal keratinocytes in the TPA-treated mouse skinat different stages of the whole cell cycle: interphase, prophase, prometaphase, metaphase, anaphase, and telophase. (D) Intensity profile across the dotted linein A. The DNA contrast in a mitotic cell (∼2:1) is higher than that of the cell nuclei in interphase (∼1.4:1). (E) Tracking the cell division activity through in vivo countingof the mitotic rates of the basal keratinocytes in the TPA-treated mouse skin over 24 h. The total number of cells counted was ∼5,000 (Figs. S6–S9). (Scale bar, 20 μm.)
4 of 6 | www.pnas.org/cgi/doi/10.1073/pnas.1515121112 Lu et al.

K =
264k1ðω1Þ ⋯ kMðω1Þ
..
. ...
k1ðωNÞ ⋯ kMðωNÞ
375.
The least square solution for Eq. 2 is
c=K−1S. [3]
Substituting Eqs. 2 and 3 to Eq. 1 yields
RMSE=
ffiffiffiffiffiffiffiffiffiffiffiffiffiffiffiffiffiffiffiffiffiffiffiffiffiffiffiffiffiffiffiffiffiffiffiffiffiffiffiffiffiffitrhK−1EðrrtÞðKtÞ−1
ir. [4]
Given that the detection noise in SRS imaging is near shot-noise limited andobeys an uncorrelated process with zero mean and a constant variance σ2, Eq. 4reduces to
RMSE= σ ·ffiffiffiffiffiffiffiffiffiffiffiffiffiffiffiffiffiffiffiffiffiffiffiffiffiffitrhðKtKÞ−1
ir, [5]
where the calibration matrix K was based on the Raman spectra of the purechemicals. Our simulations using Eqs. 1 and 5 allowed the selection of threeoptimal Raman shifts at 2,973, 2,921, and 2,851 cm−1 (Fig. S1).
Spontaneous Raman Spectroscopy. The Raman spectra were acquired using aconfocal Raman spectrometer (LabRAM HR800; Horiba Jobin Yvon). AHelium-Neon (HeNe) laser at 633 nm was used to excite the sample. Thespectra were processed using LabSpec software. The objective is RMS20X(Olympus: NA, 0.4, WD, 1.2 mm). The average power on the sample was∼20 mW. Integration time for each spectra was ∼10–30 s.
TPEF Microscopy. TPEF imaging of DNA stained with DRAQ5 (BioStatus) inlive cells and tissue was excited by the 1,064-nm beam (by blocking theOPO beam) and detected by a photomultiplier tube (PMT; Hamamatsu)through a dichroic mirror and a short-pass filter. The samples were firstimaged with SRS and then were stained with DRAQ5 (10 μM, 10 min forlive cells and 30 min for fresh tissue at room temperature) directly on themicroscopy stage (37).
Cell Culture. HeLa S3 cells (ATCC) were maintained at 37 °C in a humidified 5%(vol/vol) CO2 air incubator and cultured in MEM (Invitrogen) supplementedwith 10% (vol/vol) FBS and 0.01 mg/mL insulin (Sigma). Cells were imaged inphenol red-free MEM (Sigma) supplemented with sodium bicarbonate, 20 mML-glutamine,100 ng/mL epidermal growth factor (EGF; Sigma), and 25 mMHepes, pH 8.0 (Invitrogen).
Time-lapse imaging of live cells for observing the cell division process wascarried out on a 35-mm dish with a 0.17-mm coverglass bottom (MatTek) in amodified onstage incubator (Live Cell Instrument; Chamlide). To accommodateboth high NA objective and high NA condenser with very short working dis-tance (<1 mm) for SRS imaging, the upper cover of the incubator wasspecifically designed using flexible plastic materials to enclose the objectivewithin the incubator and to allow it to move for aligning and focusing at thesame time (Fig. S3A). The temperature was maintained at 37 °C with 5%(vol/vol) CO2 in humidified air. An extra 35-mm dish with 1× PBS solution wasplaced within the incubator for better humidity maintenance.
For in vitro cell division imaging, HeLa cells were synchronized bydouble thymidine block (38). This procedure involved 18-h incubation(prepared at ∼25–30% confluence) in thymidine (final concentration,2 mM; Sigma), 9-h incubation in fresh media, and again a 17-h incubationin thymidine (final concentration, 2 mM). Before imaging, cells were in-cubated in fresh media for 8 h to allow cells reach middle G2 phase. Forin vivo cell division imaging in the xenograft mouse model, HeLa cellswere also synchronized using double thymidine block. After releasing,incubated cells in fresh media for 3 h before injecting into the mouseskinfold chamber. The total cellular lipids from the cultured HeLa cellpellet were extracted using the Bligh-Dyer method (39). Total cellularprotein was extracted using RIPA buffer (Thermo Scientific). We did notextracted DNA from the cell pellet.
Dorsal Skinfold Chamber Model in Mice. To minimize the motion artifacts in liveanimal imaging with multicolor SRS, we built the dorsal skinfold chamber modelon mice. The skinfold chamber, which consists of two symmetrical titaniumframes, was implanted in the dorsal skin of the mice following previouslyreported procedures (40–42). The chamber sandwiched and immobilized the skinon the back of the mouse. One side of the skin was surgically removed andreplaced by a round 0.17-mm coverglass with a 10-mm diameter. The screwsused should be as short as possible on both sides of the chamber to allow thehigh NA objective and the high NA condenser to be able to access to thechamber as close as needed for SRS transmission imaging (Fig. S3 B and C). Weused this model for two experiments as follows. (i) For the experiment of in vivomouse skin imaging, young adult mice (Swiss Webster, female, 6 wk; Taconic)were used. The skin within the chamber was topically treated with 2 μgTPA (Sigma) in 200 μL acetone to activate cell division activity (26, 43, 44).(ii ) For in vivo cell division dynamic imaging experiments, Ncr nude femalemice (Taconic) were used to establish a xenograft model (45, 46). Syn-chronized HeLa cells with double thymidine block were injected into thechamber superficially beneath the inner side of the skin. Images weretaken after 26 h of the injection.
Mouse Subskin Implantation Model for in Vivo Epi-SRS Imaging. Mouse dorsalskin was topically treated with 8 μg TPA in 800 μL acetone to activate celldivision activity in the skin. To immobilize the skin for imaging, a thinmetal piece was surgically implanted under the skin (titanium, 12 × 12 ×1 mm) with two small handles (2 × 5 × 1 mm) extended out of the skin.When imaging, the two small handles were fixed to a mounting block onthe microscope stage with the mouse under anesthesia. After imaging, themouse was released and maintained in the cage in normal conditions. Allof the in vivo animal experiments were performed under standard anes-thesia condition using O2/isoflurane (Fig. S3D). Animal experiments wereconducted in accordance with Harvard University IACUC Protocols 10-02and 29-01.
Human Skin and Skin Cancer Tissue. Discarded and deidentified human skinsamples including normal (from five surgical cases) and SCC (from threesurgical cases) tissue were collected and prepared in accordance with Mas-sachusetts General Hospital institutional review board protocol 2013-P-2337.
A
B
E
C
D
F
Fig. 3. SRS images of DNA (magenta), protein (cyan), and lipids (green) inhuman skin and skin cancer tissue. (A) Codistribution of DNA with lipids and(B) DNA with protein of fresh-frozen sectioned normal human skin tissue.Both nuclear and tissue morphology were clearly visualized. (C and D) Pairedimages of SRS and H&E of the same normal human skin tissue section veri-fied that SRS provides equivalent cytologic features to H&E staining. (E) SRSimages of fresh human skin squamous cell carcinoma (SCC) tissue showedincreased number of the mitotic figures. (F) SRS images of a small nest ofcarcinoma cells with enlarged cell nuclei in comparison with adjacent non-neoplastic cells. Thickness of the frozen sections for A–D is ∼20 μm. Thicknessof the fresh tissue for E and F is ∼1 mm. (Scale bar, 20 μm.)
Lu et al. PNAS Early Edition | 5 of 6
MED
ICALSC
IENCE
SAPP
LIED
PHYS
ICAL
SCIENCE
S

To collect paired images with SRS and H&E from the same tissue slice, freshnormal skin tissue was quickly embedded and frozen in OCT compoundfor frozen sectioning without fixation; 20-μm slices were first imagedwith SRS and then were stained with H&E (following standard pro-cedures) for light microcopy imaging. Fresh SCC tissue was cut into thinslices using a blade (∼1 mm) and then was sandwiched between a slideand coverglass for SRS transmission imaging. Some pressure was appliedto flatten the tissue.
ACKNOWLEDGMENTS. We thank Dr. X. Ni, Dr. X. Zhang, and Dr. J. Yong forhelp on the animal experiments; W. Yang for technical assistance on the photodetector; Dr. L. Sang, Dr. L. Kong, Dr. A. J. Golby, and Dr. N. Y. Agar for helpfuldiscussions; and Dr. D. Lando and Dr. P. Purcell for critical reading and editingof the manuscript. This work was supported by grants to X.S.X. from the USDepartment of Energy’s Basic Energy Sciences Program (DE-FG02-09ER16104)and National Institutes of Health (NIH) T-R01 (1R01EB010244-01) and to D.E.F.from the Dr. Miriam and Sheldon G. Adelson Medical Research Foundationand the NIH (P01 CA163222, R01 AR043369, and R21 CA175907).
1. Kagey MH, et al. (2010) Mediator and cohesin connect gene expression and chromatinarchitecture. Nature 467(7314):430–435.
2. Apostolou E, Hochedlinger K (2013) Chromatin dynamics during cellular reprogram-ming. Nature 502(7472):462–471.
3. Jannink I, Risberg B, Van Diest PJ, Baak JPA (1996) Heterogeneity of mitotic activity inbreast cancer. Histopathology 29(5):421–428.
4. Aasi SZ, Leffel DJ, Lazova RZ (2012) Atlas of practical mohs histopathology (Springer,New York).
5. Freudiger CW, et al. (2008) Label-free biomedical imaging with high sensitivity bystimulated Raman scattering microscopy. Science 322(5909):1857–1861.
6. Nandakumar P, Kovalev A, Volkmer A (2009) Vibrational imaging based on stimu-lated Raman scattering microscopy. New J Phys 11:033026.
7. Ideguchi T, et al. (2013) Coherent Raman spectro-imaging with laser frequency combs.Nature 502(7471):355–358.
8. Berto P, Andresen ER, Rigneault H (2014) Background-free stimulated Raman spec-troscopy and microscopy. Phys Rev Lett 112(5):053905.
9. Bégin S, Bélanger E, Laffray S, Vallée R, Côté D (2009) In vivo optical monitoring oftissue pathologies and diseases with vibrational contrast. J Biophotonics 2(11):632–642.
10. Saar BG, et al. (2010) Video-rate molecular imaging in vivo with stimulated Ramanscattering. Science 330(6009):1368–1370.
11. Ji M, et al. (2013) Rapid, label-free detection of brain tumors with stimulated Ramanscattering microscopy. Sci Transl Med 5(201):201ra119.
12. Mittal R, et al. (2013) Evaluation of stimulated Raman scattering microscopy foridentifying squamous cell carcinoma in human skin. Lasers Surg Med 45(8):496–502.
13. Fu D, et al. (2014) Imaging the intracellular distribution of tyrosine kinase inhibitors inliving cells with quantitative hyperspectral stimulated Raman scattering. Nat Chem6(7):614–622.
14. Wei L, et al. (2014) Live-cell imaging of alkyne-tagged small biomolecules by stimu-lated Raman scattering. Nat Methods 11(4):410–412.
15. Yue S, et al. (2014) Cholesteryl ester accumulation induced by PTEN loss and PI3K/AKTactivation underlies human prostate cancer aggressiveness. Cell Metab 19(3):393–406.
16. Freudiger CW, et al. (2011) Highly specific label-free molecular imaging with spec-trally tailored excitation stimulated Raman scattering (STE-SRS) microscopy. NatPhotonics 5(2):103–109.
17. Fu D, et al. (2012) Quantitative chemical imaging with multiplex stimulated Ramanscattering microscopy. J Am Chem Soc 134(8):3623–3626.
18. Ozeki Y, et al. (2012) High-speed molecular spectral imaging of tissue with stimulatedRaman scattering. Nat Photonics 6(12):844–850.
19. Wang K, et al. (2013) Time-lens based hyperspectral stimulated Raman scatteringimaging and quantitative spectral analysis. J Biophotonics 6(10):815–820.
20. Freudiger CW, et al. (2012) Multicolored stain-free histopathology with coherentRaman imaging. Lab Invest 92(10):1492–1502.
21. Lu FK, et al. (2012) Multicolor stimulated Raman scattering (SRS) microscopy.Mol Phys110(15-16):1927–1932.
22. Zhang X, et al. (2012) Label-free live-cell imaging of nucleic acids using stimulatedRaman scattering microscopy. ChemPhysChem 13(4):1054–1059.
23. Klein K, et al. (2012) Label-free live-cell imaging with confocal Raman microscopy.Biophys J 102(2):360–368.
24. Cheng J-X, Xie XS (2013) Coherent Raman scattering microscopy (CRC Press, BocaRaton).
25. Jeppsson K, Kanno T, Shirahige K, Sjögren C (2014) The maintenance of chromosomestructure: Positioning and functioning of SMC complexes. Nat Rev Mol Cell Biol 15(9):601–614.
26. Rodriguez-Puebla ML, Robles AI, Johnson DG, LaCava M, & Conti CJ (1998) Synchronizedproliferation induced by 12-O-tetradecanoylphorbol-13-acetate treatment of mouse skin:An in vivo model for cell cycle regulation. Cell growth & differentiation: the molecularbiology journal of the American Association for Cancer Research 9(1):31-39.
27. Tentler JJ, et al. (2012) Patient-derived tumour xenografts as models for oncologydrug development. Nat Rev Clin Oncol 9(6):338–350.
28. Madan V, Lear JT, Szeimies RM (2010) Non-melanoma skin cancer. Lancet 375(9715):673–685.
29. Petter G, Haustein UF (1998) Squamous cell carcinoma of the skin–histopathologicalfeatures and their significance for the clinical outcome. J Eur Acad Dermatol Venereol11(1):37–44.
30. Warner CL, Cockerell CJ (2011) The new seventh edition American Joint Committee onCancer staging of cutaneous non-melanoma skin cancer: A critical review. Am J ClinDermatol 12(3):147–154.
31. Marusyk A, Almendro V, Polyak K (2012) Intra-tumour heterogeneity: A looking glassfor cancer? Nat Rev Cancer 12(5):323–334.
32. Konig K, Riemann I (2003) High-resolution multiphoton tomography of human skinwith subcellular spatial resolution and picosecond time resolution. J Biomed Opt 8(3):432–439.
33. Chen X, Grégoire S, Formanek F, Galey JB, Rigneault H (2015) Quantitative 3D mo-lecular cutaneous absorption in human skin using label free nonlinear microscopy.J Control Release 200:78–86.
34. Frans SD, Harris JM (1985) Selection of Analytical Wavelengths for MulticomponentSpectrophotometric Determinations. Anal Chem 57(13):2680–2684.
35. Sasaki K, Kawata S, Minami S (1986) Optimal Wavelength Selection for Quantitative-Analysis. Appl Spectrosc 40(2):185–190.
36. Osborne SD, Jordan RB, Kunnemeyer R (1997) Method of wavelength selection forpartial least squares. Analyst (Lond) 122(12):1531–1537.
37. Martin RM, Leonhardt H, & Cardoso MC (2005) DNA labeling in living cells. Cytometry.Part A: the journal of the International Society for Analytical Cytology 67(1):45-52.
38. Peng CY, et al. (1997) Mitotic and G2 checkpoint control: Regulation of 14-3-3 proteinbinding by phosphorylation of Cdc25C on serine-216. Science 277(5331):1501–1505.
39. Bligh EG, Dyer WJ (1959) A rapid method of total lipid extraction and purification.Can J Biochem Physiol 37(8):911–917.
40. Papenfuss HD, Gross JF, Intaglietta M, Treese FA (1979) A transparent access chamberfor the rat dorsal skin fold. Microvasc Res 18(3):311–318.
41. Huang Q, et al. (1999) Noninvasive visualization of tumors in rodent dorsal skinwindow chambers. Nat Biotechnol 17(10):1033–1035.
42. Palmer GM, et al. (2011) In vivo optical molecular imaging and analysis in mice usingdorsal window chamber models applied to hypoxia, vasculature and fluorescent re-porters. Nat Protoc 6(9):1355–1366.
43. Slaga TJ, Fischer SM, Weeks CE, Klein-Szanto AJ, Reiners J (1982) Studies on themechanisms involved in multistage carcinogenesis in mouse skin. J Cell Biochem 18(1):99–119.
44. Argyris TS (1980) Epidermal growth following a single application of 12-O-tetrade-canoyl-phorbol-13-acetate in mice. Am J Pathol 98(3):639–648.
45. Morton CL, Houghton PJ (2007) Establishment of human tumor xenografts in im-munodeficient mice. Nat Protoc 2(2):247–250.
46. Orth JD, et al. (2011) Analysis of mitosis and antimitotic drug responses in tumors byin vivo microscopy and single-cell pharmacodynamics. Cancer Res 71(13):4608–4616.
47. Puppels GJ, et al. (1990) Studying single living cells and chromosomes by confocalRaman microspectroscopy. Nature 347(6290):301–303.
48. Thomas GJ, Jr (1999) Raman spectroscopy of protein and nucleic acid assemblies.Annu Rev Biophys Biomol Struct 28:1–27.
49. Huang Z, et al. (2003) Near-infrared Raman spectroscopy for optical diagnosis of lungcancer. Int J Cancer 107(6):1047–1052.
50. Uzunbajakava N, et al. (2003) Nonresonant confocal Raman imaging of DNA andprotein distribution in apoptotic cells. Biophys J 84(6):3968–3981.
51. Jess PR, et al. (2007) Early detection of cervical neoplasia by Raman spectroscopy.International journal of cancer. Journal international du cancer 121(12):2723-2728.
52. Chowdary MV, et al. (2009) Biochemical correlation of Raman spectra of normal,benign and malignant breast tissues: A spectral deconvolution study. Biopolymers91(7):539–546.
53. Jachtenberg JW, et al. (2013) Raman spectroscopy can discriminate distinct gliomasubtypes as defined by RNA expression profiling. J Raman Spectrosc 44(9):1217–1221.
54. Chen Y, et al. (2014) Raman spectroscopy analysis of the biochemical characteristics ofmolecules associated with the malignant transformation of gastric mucosa. PLoS One9(4):e93906.
55. Okotrub KA, Surovtsev NV, Semeshin VF, & Omelyanchuk LV (2015) Raman spec-troscopy for DNA quantification in cell nucleus. Cytometry. Part A: the journal of theInternational Society for Analytical Cytology 87(1):68-73.
56. Parker FS (1983) Applications of Infrared, Raman, and Resonance Raman Spectroscopyin Biochemistry (Plenum Press, New York).
57. Matthäus C, Boydston-White S, Miljkovi�c M, Romeo M, Diem M (2006) Raman andinfrared microspectral imaging of mitotic cells. Appl Spectrosc 60(1):1–8.
58. Mallidis C, et al. (2011) In situ visualization of damaged DNA in human sperm byRaman microspectroscopy. Hum Reprod 26(7):1641–1649.
59. Fu D, Xie XS (2014) Reliable cell segmentation based on spectral phasor analysis of hy-perspectral stimulated Raman scattering imaging data. Anal Chem 86(9):4115–4119.
60. Liao C-S, et al. (2015) Microsecond scale vibrational spectroscopic imaging by multi-plex stimulated Raman scattering microscopy. Light Sci Appl 4:e265.
6 of 6 | www.pnas.org/cgi/doi/10.1073/pnas.1515121112 Lu et al.