Embed Size (px)
Citation preview
2
Workflow
1. Pick your cells/tissue/incubation conditions*2. Pick your dye(s) (keep in mind excitation/emission
channels available, multiplexing)3. Pick loading method (single cell, multicellular,
retention)4. Load cells: how much dye, how long incubation,
wash or not5. Image
*dfilwt

3
Media
Common media such as DMEM use carbonic acid/bicarbonate pH bufferingwhere gaseous CO2 balances the H2CO3 / HCO3
- content of the medium.
pH goes to 8 for bicarbonate buffered media in absence of CO2. Neurons diewithin 5 minutes at pH 8.
Alternatives:(1) HEPES: insensitive to CO2 but photosensitizes H2O2 generation. Opti-MEMis HEPES buffered.(2) Leibovitz L15. Uses high levels of the free base forms of arginine, cysteineand histidine to set the desired pH.
Serum:Use serum-free media for dye loading. One of the stated reasons for inclusion ofserum in culture media is “to bind and neutralize toxins” (such as dyes).
H2O + CO2 H2CO3 H+ + HCO3-

4
Ammonia
L-glutamine is an essential nutrient in cell cultures for energy productionas well as protein and nucleic acid synthesis. However, L-glutamine incell culture media spontaneously degrades, generating ammonia.
5
Oxygen
“Although studies with primary lymphocytes are almost always conducted in CO2incubators maintained at atmospheric oxygen levels (atmosO2; 20%), thephysiological oxygen levels (physO2; 5%) that cells encounter in vivo are 2–4 timeslower. We show here that culturing primary T cells at atmosO2 significantly alters theintracellular redox state (decreases intracellular glutathione, increases oxidizedintracellular glutathione), whereas culturing at physO2 maintains the intracellularredox environment (intracellular glutathione/oxidized intracellular glutathione) close toits in vivo status”.
Proc Natl Acad Sci USA (2007) 104:4547–4552

6
Phenol Red?
250 300 350 400 450 500 550 600 650
Wavelength (nm)
Ab
so
rba
nce
pH 9.3 pH 7.0 pH 6.0
Phenol Red (phenolsulfonphthalein)Typical concentration in media is 15 µg/mL (~40 µM)
10 µM fluorescein in 100 µL CytoFluor microplate reader

7
Fluorescence emission spectra @ working concentration
500 550 600 650 700nm
1(EM), 1(EM), 1(EM)
0
10
20
30
40
50
HBSS
15 µg/mL phenol red in HBSS
15 µg/mL phenol red in HBSS + 10% FCS
Ex = 488 nm
Wavelength (nm)
Fluo
resc
ence
em
issi
on

8
Stokes shift enables darkfield imaging
Live HeLa cells incubated with Alexa Fluor 594 transferrin for 10 minutes to label early endosomes. The cells were subsequentlyfixed with paraformaldehyde and labeled with an antibody to the endosomal protein RhoD. That antibody was visualized with agreen-fluorescent secondary antibody. Yellow fluorescence indicates regions of co-localization. To illustrate the staining pattern, thecells were imaged by both fluorescence (upper panel) and differential interference contrast (DIC) microscopy (lower panel). Theimage was contributed by Harry Mellor, University of Bristol.
▶You only see what you stain (or what is autofluorescent)►Use DIC for cell morphology context, particularly on punctate targets likelysosomes, endosomes, phagocytosis► Fluorescent counterstaining for context; Hoechst 33342 (nucleus), calceinAM (cytoplasm), CellMask Orange (plasma membrane)
9
InstrumentStray light, detector noise
ReagentUnbound or nonspecifically bound probes
SampleSolute and solvent autofluorescence, scatteredexcitation light (particle size and wavelengthdependent)
Background Signals
► 1/0 is better S/N than 1000/1

10
Sources of Autofluorescence
Source Organism/Tissue Ex (nm) Em (nm)Flavins CHO cells 380, 460 520
Rat hepatocytes 468 525Neural cells (rat, bovine) 488 540-560Goldfish inner ear 450 540Periplaneta americana <350 530
NAD(P)H Rat cardiomyocytes 395 509S. cerevisiae 366 440-470CHO cells 360 440-450
Lipofuscins Medulla (rat, human, rhesus monkey) 460-490 520Rat heart 450-490 550Muscle, myocardium, hepatocytes 360 540-560Human brain 435 481-673Rat liver 345 430Rat retina 390-490 >510
Collagen and elastin Aorta, coronary artery (human) 476 >515Skin (human) 442 470-520
Autofluorescence (ex/em= 488/530 nm) of a typical 3T3 cellis equivalent to about 34,000 fluorescein molecules
No Ex > 500 nmNo Em >600 nm
Table from Analytical Biochemistry, 291:175 (2001)

11
Autofluorescence: Riboflavin
H3C
H3C N
N
NH
N
O
O
CH2
CHCHCHCH2OHHO
OH
OH
0
2000
4000
6000
8000
10000
12000
300 350 400 450 500 550 600 650 700 750 800
Wavelength (nm)
Ext
inct
ion c
oeffic
ient (M
-1c
m-1
)
Flu
ore
scence
em
issi
on
Fluorescencequantum yield = 0.3 (inethanol)
0.040.010.20.40.1Riboflavin content(mg/L)
Ham’s F12Medium199
RPMI1640
DMEMMEMMedium
Cell culture medium affects GFP photostability: a solutionNature Methods (2009) 6:859–860

12
Matching dye spectra to excitation sources and filters
Online spectra viewer utilityhttp://www.invitrogen.com/site/us/en/home/support/Research-Tools/Fluorescence-SpectraViewer.html
Emission
Excitation

13
0
25
50
75
100
450 500 550 600 650
Wavelength (nm)
Flu
ore
sc
en
ce
ex
cit
ati
on
0
25
50
75
100
450 500 550 600 650 700
Wavelength (nm)
Flu
ore
sc
en
ce
em
iss
ion
Fluorescence Spectra: CrosstalkExcitation spectra 1:1
0
25
50
75
100
575 600 625 650 675
Wavelength (nm)
Flu
ore
sc
en
ce
em
iss
ion
Detection window
10:1 (50%)
5:1 (25%)
2:1 (10%)
1:1 (5%)
Emission spectra 1:1
AF488 (blue) signalexpressed as % AF568(red) within detectionwindow (50% means 1AF488 photon per 2AF568; 5% = 1 AF488per 20 AF568
Dynamic range of protein expression: 1 –108 copies per cell Brightest dyes on lowest abundance targets

14
Dye Loading Issues
►Is the experimental specimen a pure or mixed cellculture or a tissue?.
►If the specimen is multicellular, is disseminated (all cells)or selective (one cell or a subgroup of cells) loadingdesired?
►What is the size of the cells to be labeled?►What is the size of the probe?►Impact of loading on cell viability and function.►Precision of amount delivered and location of delivery
(e.g. focal application of neuronal tracers)
15
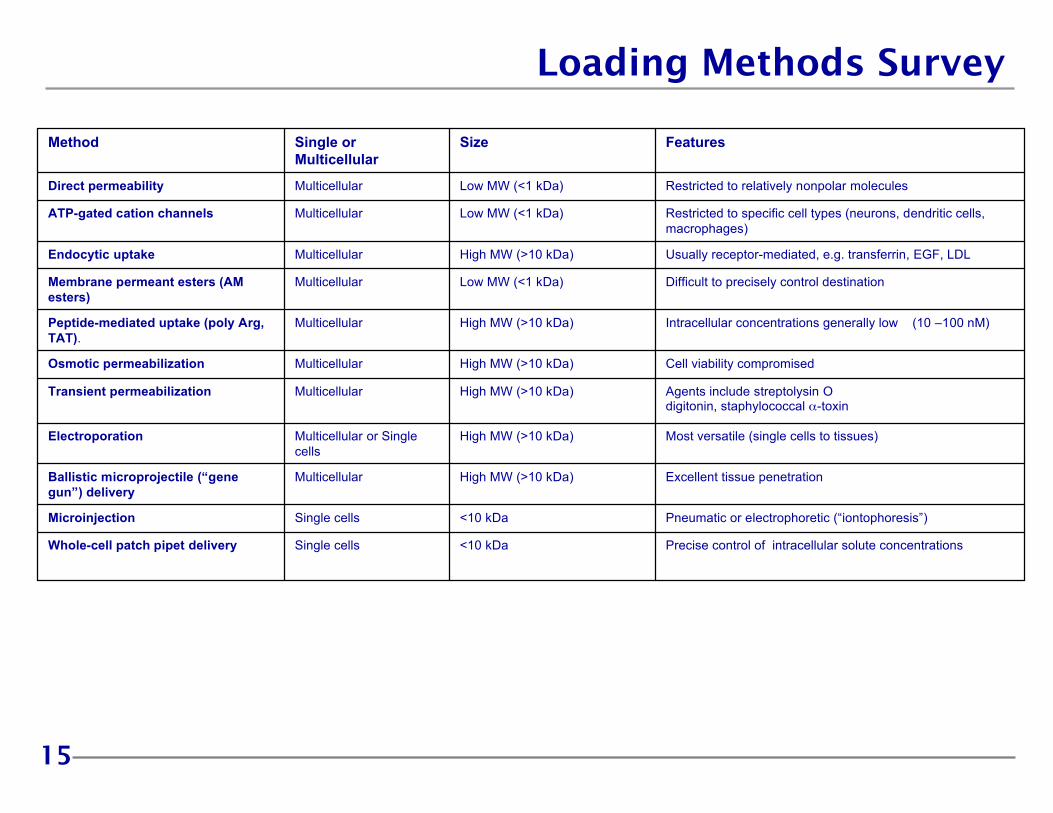
Loading Methods Survey
Precise control of intracellular solute concentrations<10 kDaSingle cellsWhole-cell patch pipet delivery
Pneumatic or electrophoretic (“iontophoresis”)<10 kDaSingle cellsMicroinjection
Excellent tissue penetrationHigh MW (>10 kDa)MulticellularBallistic microprojectile (“genegun”) delivery
Most versatile (single cells to tissues)High MW (>10 kDa)Multicellular or Singlecells
Electroporation
Agents include streptolysin Odigitonin, staphylococcal α-toxin
High MW (>10 kDa)MulticellularTransient permeabilization
Cell viability compromisedHigh MW (>10 kDa)MulticellularOsmotic permeabilization
Intracellular concentrations generally low (10 –100 nM)High MW (>10 kDa)MulticellularPeptide-mediated uptake (poly Arg,TAT).
Difficult to precisely control destinationLow MW (<1 kDa)MulticellularMembrane permeant esters (AMesters)
Usually receptor-mediated, e.g. transferrin, EGF, LDLHigh MW (>10 kDa)MulticellularEndocytic uptake
Restricted to specific cell types (neurons, dendritic cells,macrophages)
Low MW (<1 kDa)MulticellularATP-gated cation channels
Restricted to relatively nonpolar moleculesLow MW (<1 kDa)MulticellularDirect permeability
FeaturesSizeSingle orMulticellular
Method

16 When you add dyes to living cells, all hell can (and does) break loose………
AM Ester Loading
O OO
F
( OCCH2)2N
OCH2CH2O
N(CH2CO )2
CH3F
OO
esterase
O OCH3COCH2O
F
(CH3COCH2OCCH2)2N
OCH2CH2O
N(CH2COCH2OCCH3)2
CH3F
O
O O O O
1
fluo-4 AM O OO
F
( OCCH2)2N
OCH2CH2O
N(CH2CO )2
CH3F
OO
O OO
F
( OCCH2)2N
OCH2CH2O
N(CH2CO )2
CH3F
OO
esterase
Spontaneous or enzymatic hydrolysis
3
4
What happens to the red bits?
2
O OCH3COCH2O
F
(CH3COCH2OCCH2)2NOCH2CH2O
N(CH2COCH2OCCH3)2
CH3F
O
O O O O
5
17
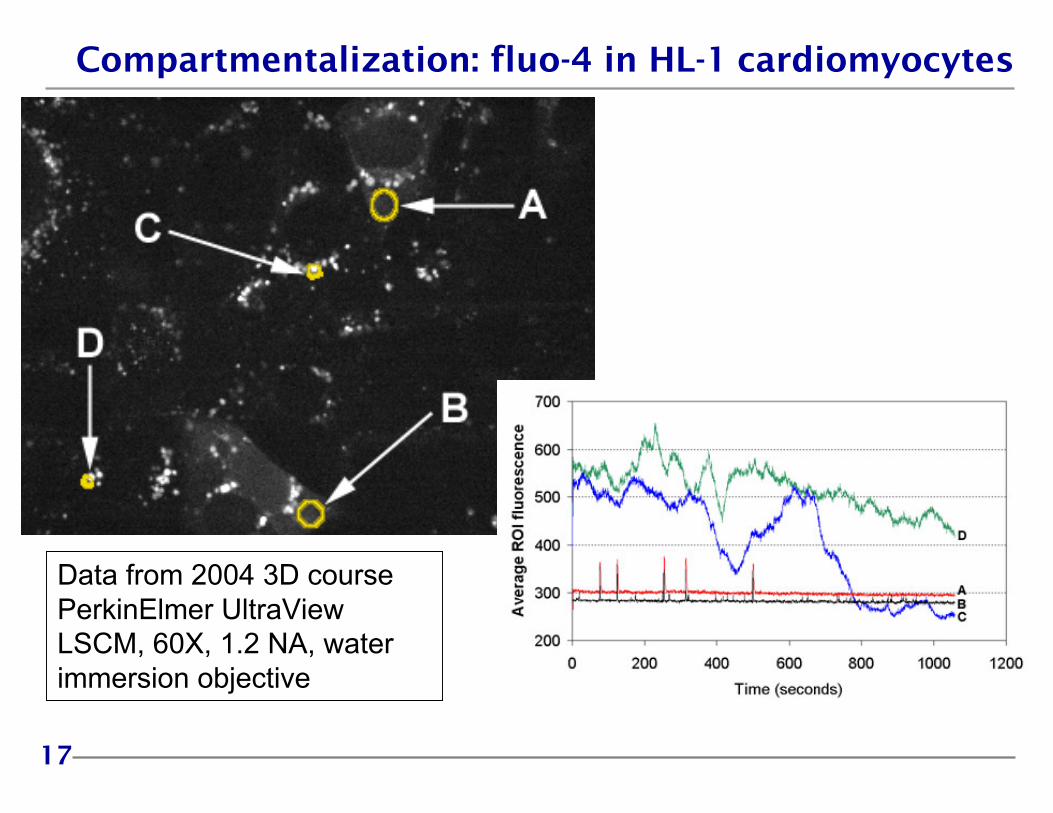
Compartmentalization: fluo-4 in HL-1 cardiomyocytes
Data from 2004 3D coursePerkinElmer UltraViewLSCM, 60X, 1.2 NA, waterimmersion objective

18
Reagent Background
+ probenecid – probenecid
CHO M1 cells, 4 µM Fluo-4 AM, 60 minutes @37CWhere’s my
contrast gone?
probenecid blocks extrusion of intracelluar fluo-4 via organic anion transporter multidrug resistance transporter assays

19
How much label? Target abundance and localization
► Compartmentalization increases concentration: 1 million molecules in a HeLacell (volume = 1.2 pL or 1200 µm3) is about 1.4 µM (1.4×10⁻⁶ M). 1 millionmolecules in 0.5mL is 3.3×10⁻¹⁵ M.► Intracellular concentrations of dye can easily exceed 100 µM even whenextracellular incubation concentration < 0.1 µM► Even more extreme effects for membrane-bound organelles (Nmito/Ncyto >1000)
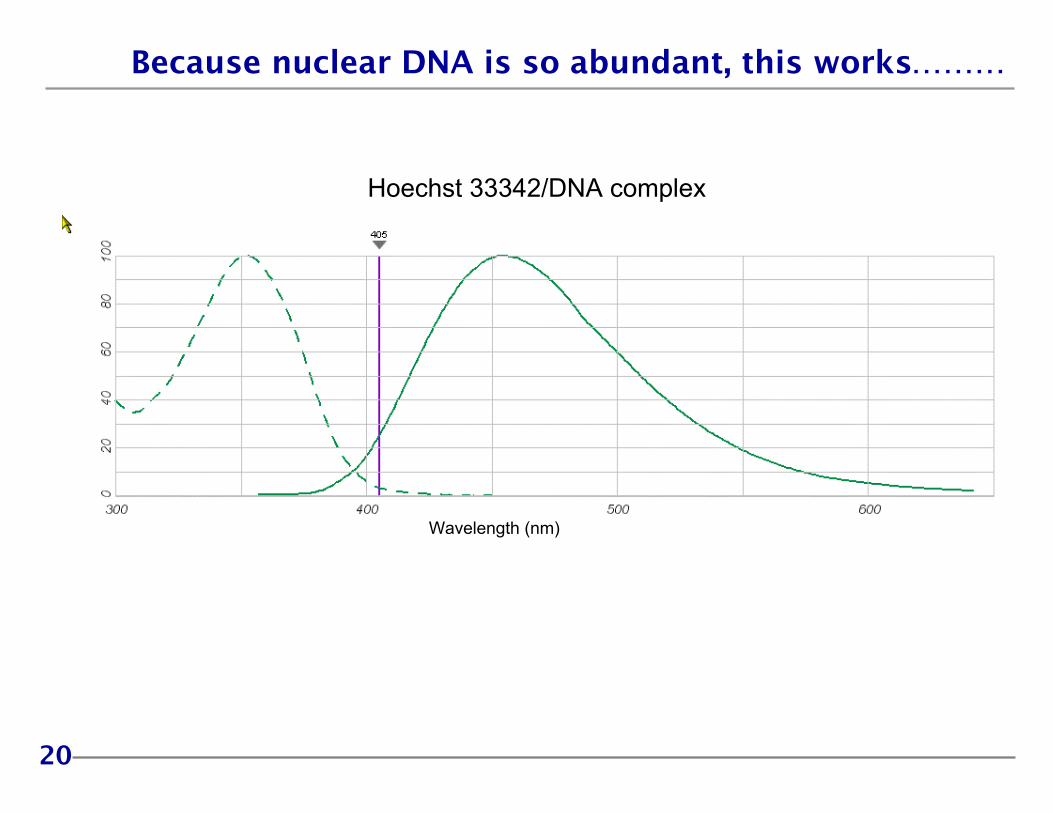
Nuclear DNA: 7 pg (~ 6 × 10⁹ base pairs per cell). Dye intercalation capacity= 1.2 × 10⁹ (1 dye: 5 base pairs).
? EGF receptors: 10,000 copies per cell
75 nm diameter
20
Because nuclear DNA is so abundant, this works………
Wavelength (nm)
Hoechst 33342/DNA complex
21
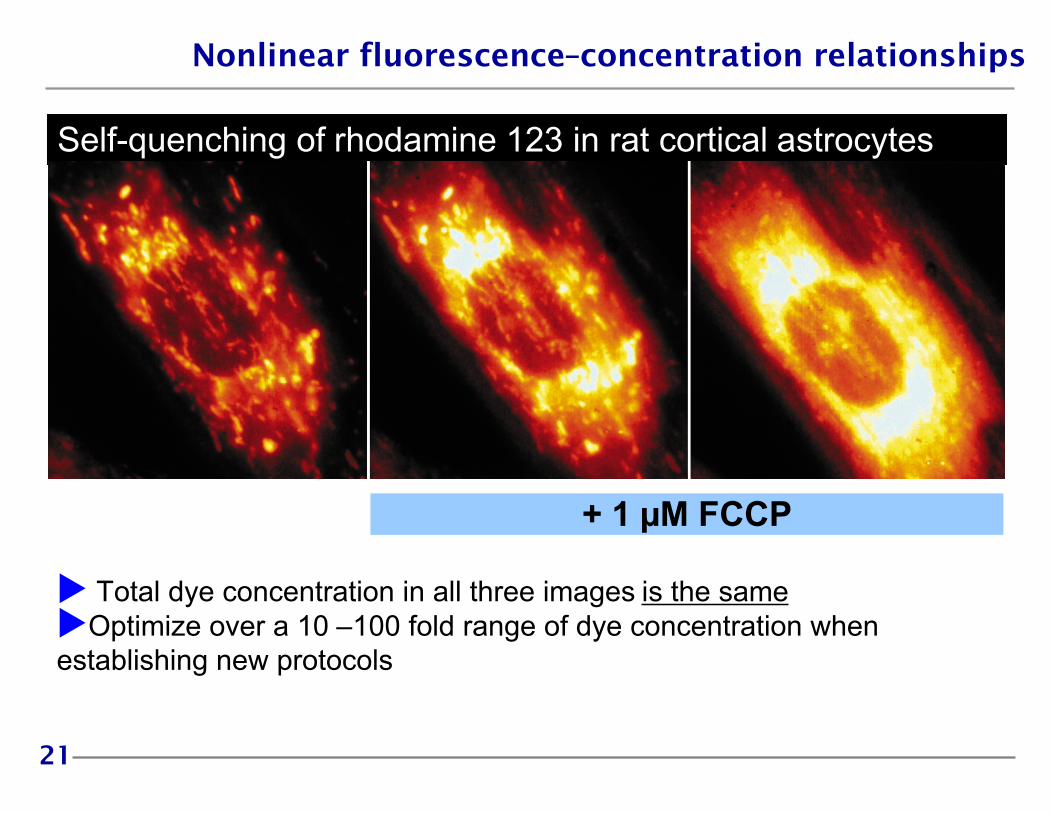
Nonlinear fluorescence–concentration relationships
Total dye concentration in all three images is the sameOptimize over a 10 –100 fold range of dye concentration whenestablishing new protocols
+ 1 µM FCCP
Self-quenching of rhodamine 123 in rat cortical astrocytes
22
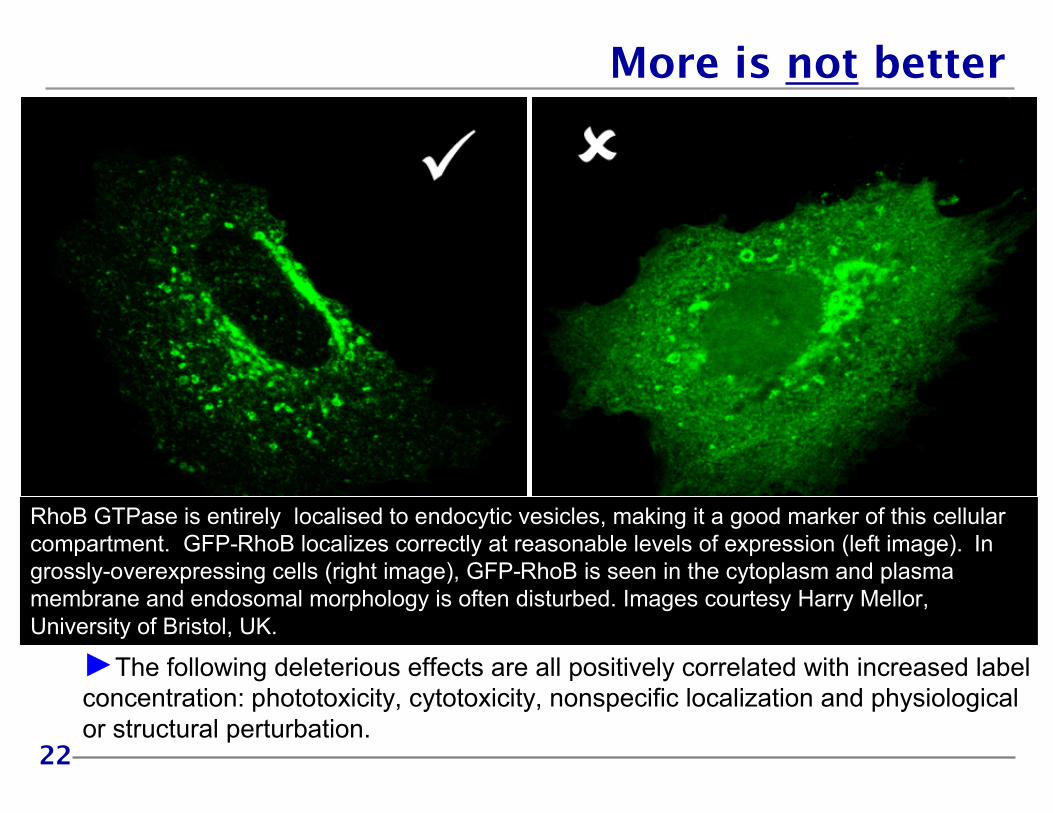
More is not better
RhoB GTPase is entirely localised to endocytic vesicles, making it a good marker of this cellularcompartment. GFP-RhoB localizes correctly at reasonable levels of expression (left image). Ingrossly-overexpressing cells (right image), GFP-RhoB is seen in the cytoplasm and plasmamembrane and endosomal morphology is often disturbed. Images courtesy Harry Mellor,University of Bristol, UK.
►The following deleterious effects are all positively correlated with increased labelconcentration: phototoxicity, cytotoxicity, nonspecific localization and physiologicalor structural perturbation.
23
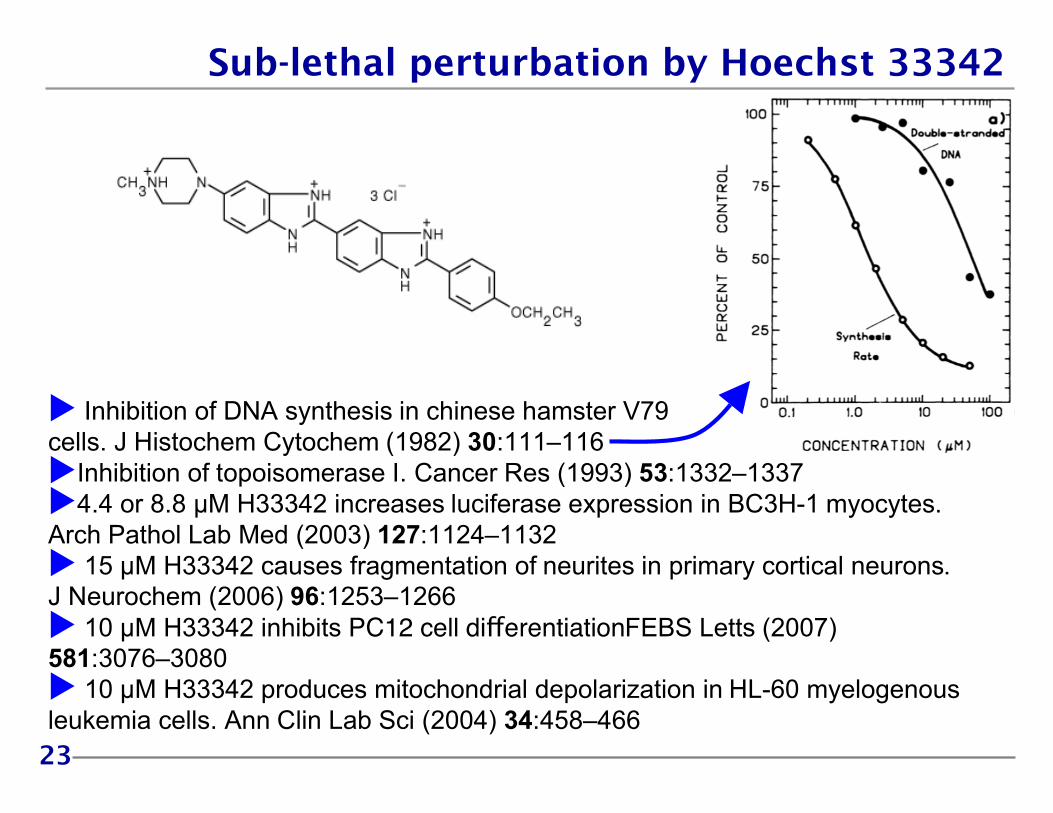
Sub-lethal perturbation by Hoechst 33342
Inhibition of DNA synthesis in chinese hamster V79cells. J Histochem Cytochem (1982) 30:111–116Inhibition of topoisomerase I. Cancer Res (1993) 53:1332–13374.4 or 8.8 µM H33342 increases luciferase expression in BC3H-1 myocytes.Arch Pathol Lab Med (2003) 127:1124–1132 15 µM H33342 causes fragmentation of neurites in primary cortical neurons.J Neurochem (2006) 96:1253–1266 10 µM H33342 inhibits PC12 cell differentiationFEBS Letts (2007)581:3076–3080 10 µM H33342 produces mitochondrial depolarization in HL-60 myelogenousleukemia cells. Ann Clin Lab Sci (2004) 34:458–466
24
To wash or not to wash.........that is the questionWashing is a trade-off: Improved signal:background versus additionalprotocol step (time) and potential damage to cells resulting from manipulation.Do wash with pre-warmed (37°C media) to avoid undue thermal stress.
Labeled proteins (antibodies, transferrins, cholera toxin B etc), lipids (DiI,BODIPY ceramide) and Ca2+ indicators (AM form) require a wash step to yieldacceptable image contrast.
Fluorogenic probes do generally not need a wash step to remove probe that isnot specifically associated with the target (staining solution is “dark”).Fluorogenic probes include most nuclear stains (DAPI, Hoechst 33342, SYTO 16etc), PED6, FM 1-43 and FM 4-64.
Some other probes (e.g MitoTracker Red CMXRos), although not fluorogenic,are usually so strongly associated with their target (particularly if you avoidoverloading) that there is no background to remove.
Some probes must NOT be washed off as their reporting function is based ontheir extracellular versus intracellular distribution. Examples include propidiumiodide (PI) for cell viability and DiSBAC2(3) for plasma membrane potential.
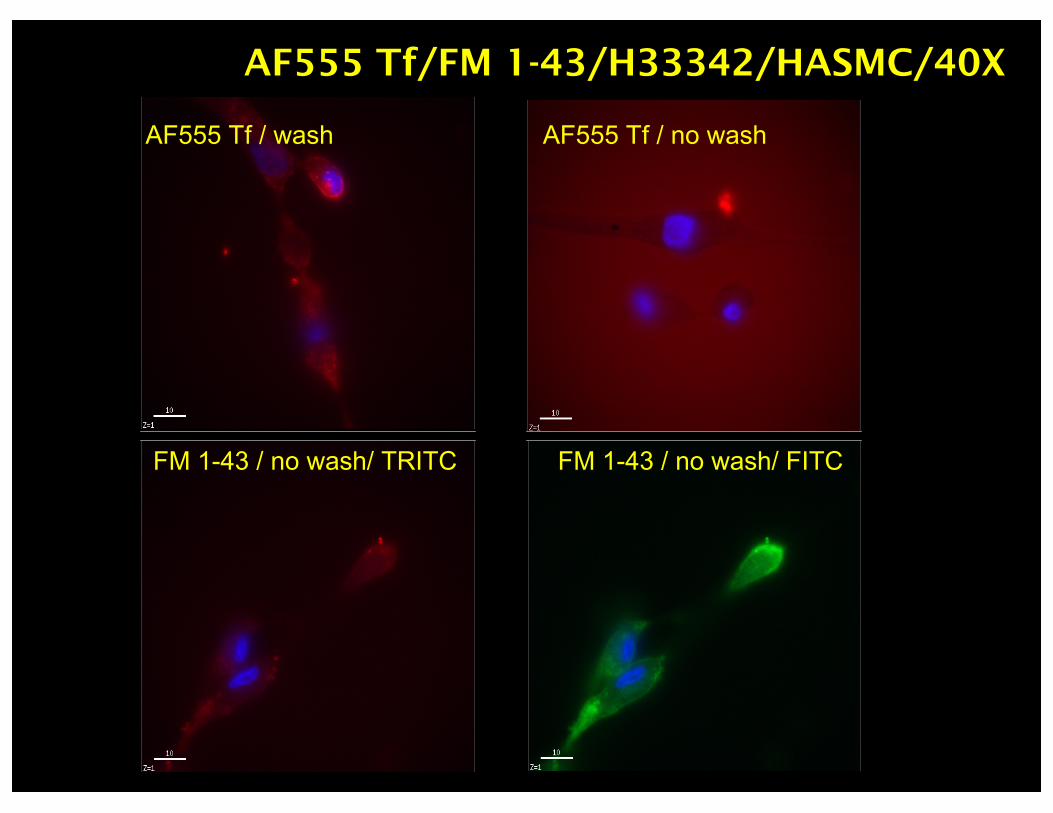
AF555 Tf/FM 1-43/H33342/HASMC/40X
AF555 Tf / wash AF555 Tf / no wash
FM 1-43 / no wash/ TRITC FM 1-43 / no wash/ FITC

26
PED6 fluorogenic PLA2 activity sensor
D
D
Q
Science 292:1385–1388 (2001)
PED6Phospholipase A2-activity dependent probe
BODIPY PCPhospholipase-independent lipid marker
gall bladder
pharynx
gall bladder
intestine
► Washing away unbound dye inside an animal is hard to do!
►In vivo imaging of lipid metabolism

27
PED6 phospholipase A2 substrate
OCH
OCH2
CH2O P
O
O!
OCH2CH
2NH
CCH3(CH
2)14
O
C
O
(CH2)4
H3C
H3C
F F
NB
N C (CH2)5NH
O
NO2
O2N
HOCH
OCH2
CH2O P
O
O!
OCH2CH
2NH
CCH3(CH
2)14
O
C (CH2)5NH
O
NO2
O2N
Phospholipase A2 cleavage
Intramolecularly Quenched Substrate(PED6)
Fluorescent Fatty Acid

28
Photobleaching the dark side is………
HeLa cells labeled with MitoTracker Red CMXRos: 40X followed by 10X

29
Photometric Output Factors: Photobleaching
► Irreversible destruction of excited fluorophore
► Proportional to time-integrated excitation intensity
► Avoidance: minimize excitation, maximize detection efficiency, antifadereagents
► Photobleaching and phototoxicity go hand-in-hand. Same reaction, differenttargets.
► QB (photobleaching quantum yield). QF/QB = number of fluorescence cycles before bleaching. About 30,000 for
fluorescein.

30
Photobleaching Reactions
N
O
CH3
CH CH CH
N
O
CH3
N
O
CH3
O
OO
1O2*
Anthracene
Carbocyanine dye (DiOC1(3))
1Dye 3Dye* + 3O2 1Dye + 1O2*Photosensitized generation of singlet oxygen
1. hνEX 2. ISC
Three control variables: 1. light (hνEX) 2. dye 3. O2
1O2*
+N
O
CH3
CH CH CH O
1
2B
2A
31
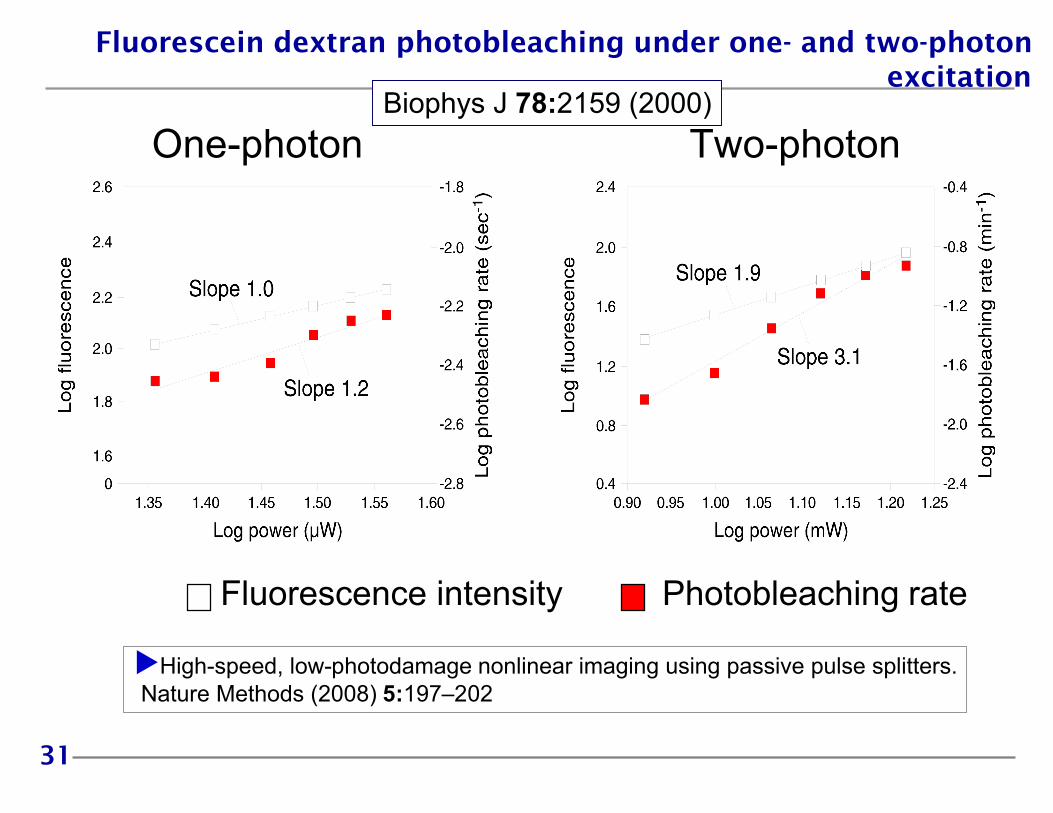
Fluorescence intensity
One-photon Two-photon
Photobleaching rate
Fluorescein dextran photobleaching under one- and two-photonexcitation
Biophys J 78:2159 (2000)
▶High-speed, low-photodamage nonlinear imaging using passive pulse splitters. Nature Methods (2008) 5:197–202
32
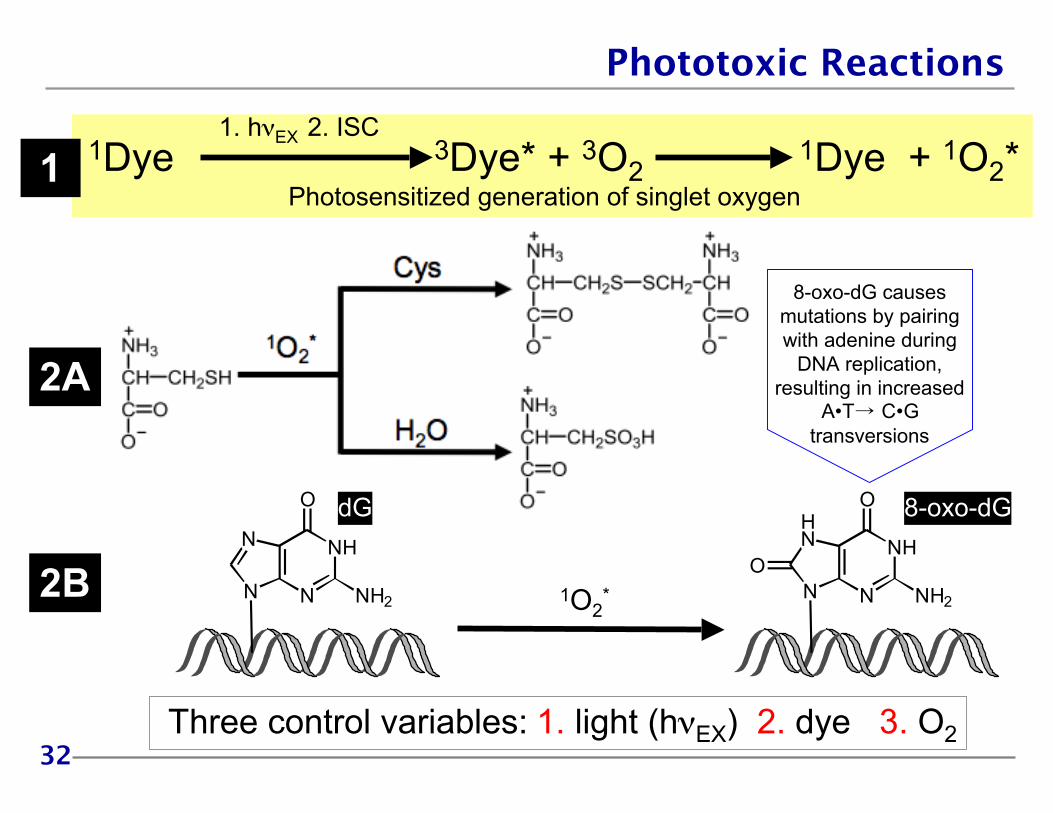
Phototoxic Reactions
1Dye 3Dye* + 3O2 1Dye + 1O2*Photosensitized generation of singlet oxygen
1. hνEX 2. ISC
1
2B
2A
N
NH
O
HN
N NH2
O
N
NH
O
N
N NH2 1O2*
8-oxo-dGdG
8-oxo-dG causesmutations by pairingwith adenine during
DNA replication,resulting in increased
A•T→ C•Gtransversions
Three control variables: 1. light (hνEX) 2. dye 3. O2
33
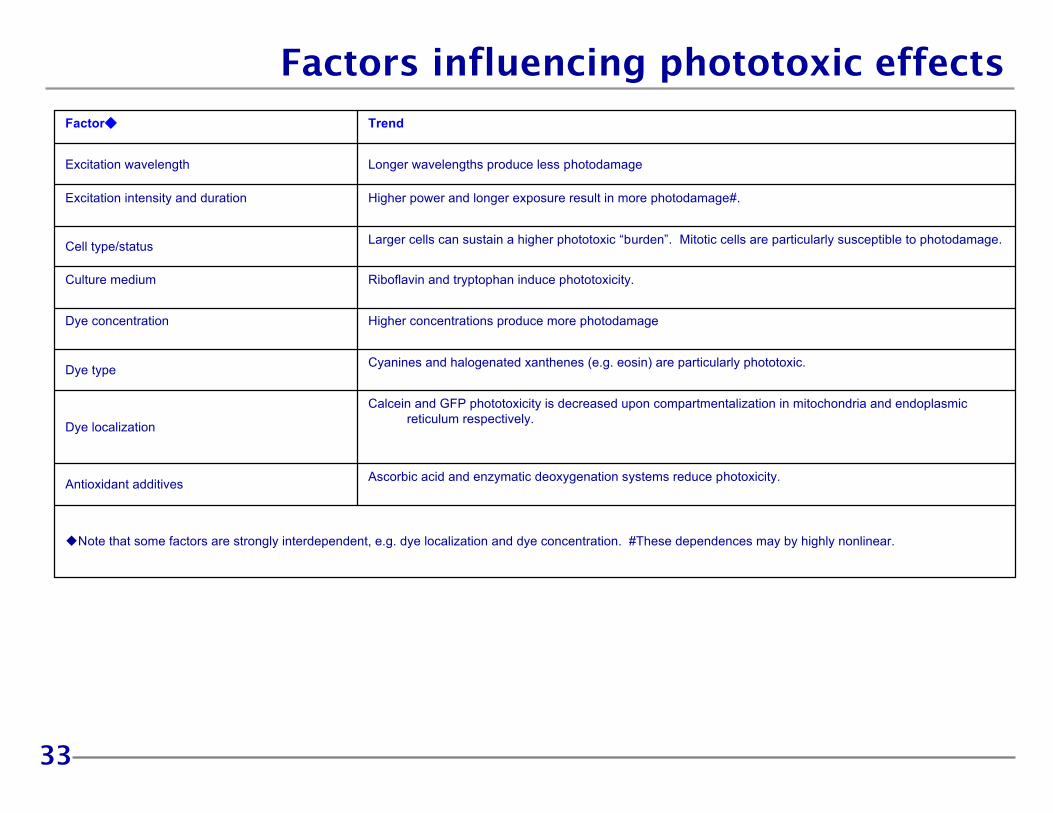
Note that some factors are strongly interdependent, e.g. dye localization and dye concentration. #These dependences may by highly nonlinear.
Ascorbic acid and enzymatic deoxygenation systems reduce photoxicity.Antioxidant additives
Calcein and GFP phototoxicity is decreased upon compartmentalization in mitochondria and endoplasmicreticulum respectively.Dye localization
Cyanines and halogenated xanthenes (e.g. eosin) are particularly phototoxic.Dye type
Higher concentrations produce more photodamageDye concentration
Riboflavin and tryptophan induce phototoxicity.Culture medium
Larger cells can sustain a higher phototoxic “burden”. Mitotic cells are particularly susceptible to photodamage.Cell type/status
Higher power and longer exposure result in more photodamage#.Excitation intensity and duration
Longer wavelengths produce less photodamageExcitation wavelength
TrendFactor
Factors influencing phototoxic effects


![BIM-Sim: Interactive Simulation of Broadband Imaging Using ...€¦ · approximate cellular structures in spectroscopic imaging of biological tissues [2]. There is also interest in](https://img.pdfslide.net/doc/110x75/6024ceead51870022946890b/bim-sim-interactive-simulation-of-broadband-imaging-using-approximate-cellular.jpg)