Embed Size (px)
Citation preview
Labor Force Sample Survey
2014
Statistical Analysis
December, 2015

H.H. Sheikh Tamim Bin Hamad Al-ThaniEmir of the State of Qatar

H.H. Sheikh Tamim Bin Hamad Al-ThaniEmir of the State of Qatar
All rights reserved to the Ministry of Development Planning and Statistics – December, 2015
When quoting, please refer to this publication as follows:
Ministry of Development Planning and Statistics, 2015, Labor force sample survey: Annual report: 2014 Doha – Qatar
Send correspondence to: Ministry of Development Planning and Statistics P.O. Box 1855, Doha – Qatar Telephone: +974-44958888 Fax: +974-44839999
E-mail: [email protected]
Join us:
www.mdps.gov.qa
www.qalm.gov.qa
Our Census Our Future
www.facebook.com/MDPSQatar
@MDPSQatar
Statistics on your mobile
Preface In accordance with the National Strategy for the Development of Statistics (NSDS) and due to the importance of labor market statistics in the socioeconomic planning process, the Ministry of Development Planning and Statistics carried out the Labor force Sample Survey (LFSS) 2014, to outline the size and composition of the labor force in Qatar. The survey provided basic data to help assess the relation between labor market requirements in Qatar and demographic and socioeconomic characteristics of the population such as education, labor and economic activity. It goes without saying that relying on these data is an imperative for the design and evaluation of the development policies and programs in the State such as socioeconomic planning and human resources development support programs.
The survey was implemented according to standards of the International Labor Organization (ILO), and within the relevant modified international classifications such as International Standard Industrial Classification (ISIC 4), International Standard Classification of Occupations (ISCO 88), and International Standard Classification of Education (ISCED 1997). It was based on a sample designed scientifically to help those interested in calculating reliable estimates of the relevant parameters. Accordingly, conclusions regarding key findings were supported by preview of specific information, estimation procedure and minimization of standard errors in this sample.
The Ministry of Development Planning and Statistics is pleased to publish the results of this survey and hopes it would achieve its goals and benefit planners, researchers and other concerned entities.
By the same token, the ministry extends appreciation to all sampled households for their positive response and cooperation that made this task a success. Appreciation is also overextended to all those who worked on this survey, whether from inside or outside the ministry.
H.E. Dr. Saleh bin Mohamed Al-Nabit
Minister of Development Planning and Statistics
Contents
Subject Page No.
Preface ...................................................................................................................... 5 Executive Summary .................................................................................................. 7 Concepts and Classifications .................................................................................... 8 Survey’s Key Results
Economic dependency Reduced ............................................................................ 11 More than 1.7 million employees in Qatar ............................................................... 11 Rise of the refined economic activity ratios ............................................................ 12 Over two thirds of Qatari labor force are employed in Government ...................... 13 Over half of Qatari labor force are highly skilled ...................................................... 14 Half of labor force work in “construction and trade .................................................. 15 Labor force in the economic occupations and activities increased
from 2013 to 2014 ................................................................................................... 16 Education level of 48% of the Qatari labor force is “University and above”. ............ 16 About 1.7 million are paid employees ..................................................................... 17 Working hours amount to 50 on average per week ................................................. 18 Female monthly-wage average is lower than male’s ............................................... 19 Reduction in unemployment rate ............................................................................. 20 Housewives represent half of the economically inactive population. ....................... 22
Survey Objectives ..................................................................................................... 24 Survey Description .................................................................................................... 25 Survey implementation .............................................................................................. 26 Online bulletins and Labor Force Sample Survey reports ........................................ 28 Tables ....................................................................................................................... 31
Labor Force Sample Survey, 20146
Executive summery The report presents the characteristics of labor force as revealed by the “Labor Force Sample Survey (LFSS) 2014” performed all over Qatar. The survey covers Qatari and non-Qatari households as well as collective households through a probability sample of 8,351 households composed of 53,363 members nationwide. The data are collected monthly, and published quarterly. The present survey complements Labor Force Sample Surveys of 2006 – 2009 & 2011 - 2013, aiming to update the relevant data.
The main indicators cited in the report highlight the positive impact of the harmonization of the economic and social achievements that developed the livelihood and occupational situations. All demographic variables, either for national or non-national labor force, including all sex and age groups, have shown constant increase in participation rates in economic activity and remarkable decrease in unemployment rates. Combining these two phenomena resulted in a net increase in the percentage of working-age population (employment/working-age population ratio). Following are the main points of the Labor Force Survey 2014:
1- Reduction in economic dependency ratios compared to previous years. 2- Qatari labor force annual growth increased by 2% compared to 2013. 3- Al-Wakrah, Al Khor and Al Dha’ain municipalities recorded the highest economic participation rates. 4- Slight decline of Qatari labor annual growth rate in the private sector vis-à-vis 2013. 5- Disparity of monthly wage average between males and females. 6- Females spend longer hours at work than males. 7- Half of Qatari labor force is employed in high, technical and administrative posts. 8- Half of labor force is observed in the economic activity “construction and trade”. 9- Qataris, unlike non-Qataris, prefer working in the public sector. 10- Decrease of unemployment rate in Qatar in 2014. 11- Decrease of unemployment rate among Qataris in 2014. 12- 31% of the unemployed Qataris wish to work in private sector. 13- 78% of unemployed Qataris haven’t been offered a job opportunity in the private sector.
Labor Force Sample Survey, 2014 7
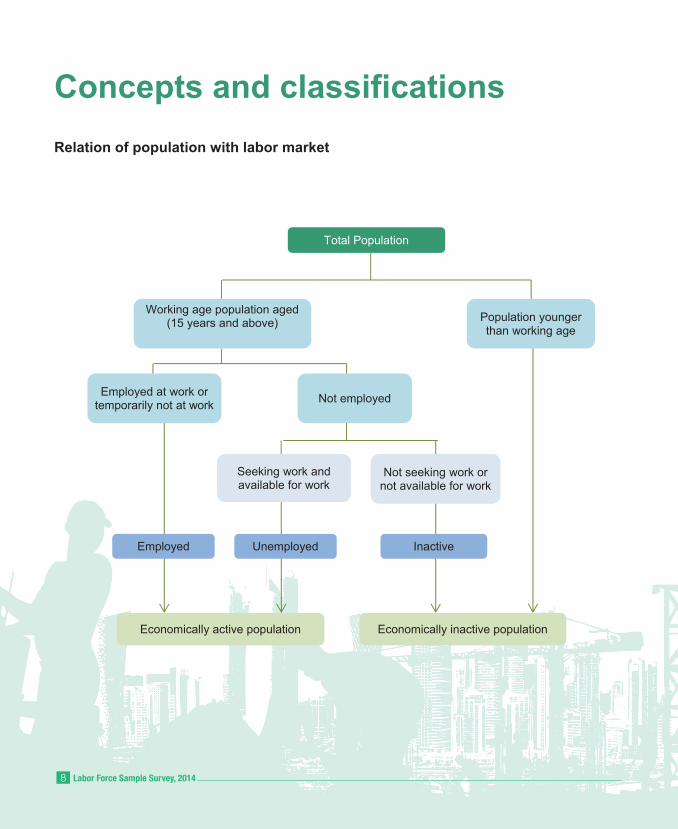
Concepts and classifications
Relation of population with labor market
Total Population
Population younger than working age
Working age population aged (15 years and above)
Not employed Employed at work or temporarily not at work
Not seeking work or not available for work
Seeking work and available for work
Inactive Unemployed Employed
Economically inactive population Economically active population
Labor Force Sample Survey, 20148
Economically Active Population: People in the working age (15 years and above) including actual
employed population, and unemployed population. Employed: All persons 15 years or older who, during the week prior to survey week:
a) Perform a work against a wage or salary, or profit or family gains, whether in cash or in kind, or b) Are temporarily not at work but they are formally linked to their jobs.
Paid employment: Persons with a job, either working or not during the survey, who perform work for wage or salary, in cash or in kind.
Self-employment: Persons who own, run or implement a project for an amount of money that could be specified or unspecified, but not periodic, regular or fixed, and who might be at work or temporarily not at work. Those are persons who perform work against a profit or family gain, in cash or in kind, in a business or a farm, or as contractors to provide services or implement other projects.
Unemployed: All persons 15 years and above who, during the week prior to the survey week, were without work but looking actively for work and are currently ready for it. A distinction is made between two types of unemployed: a) Unemployed persons seeking work for the first time: Persons who have never worked before and,
during the week prior to the survey week, were actively seeking work. These persons are also called “new entrants”.
b) Unemployed persons but previously worked: Persons with previous work experience who, during the week prior to the survey, were without work and actively seeking work.
Labor force Refined Economic Activity Ratio: the rate of economically current active population (labor force) to working-age population (15 years and above) × 100.
Youth participation rate in labor force : Number of employed persons aged 15 to 24 years as a ratio of population in the same age group × 100
Unemployment rate: Ratio of unemployed persons to the labor force population. Youth unemployment rate: Rate of the unemployed in the 15-24 age group to the labor force of the
same age group. Employment rate: Ratio of the employed to the labor force population. Economic dependency ratio: (No. of population - No. of the employed)/ N. of the employed ×100 Females working for a wage in the non-agricultural sector: Ratio of females working for a wage in
the non-agricultural sector to the total of employees working for a wage in the non-agricultural sector multiplied ×100.
Gender equality index of the female-to-male monthly wage rate: Monthly wage average of females to the monthly wage average of males ×100.
Labor Force Sample Survey, 2014 9
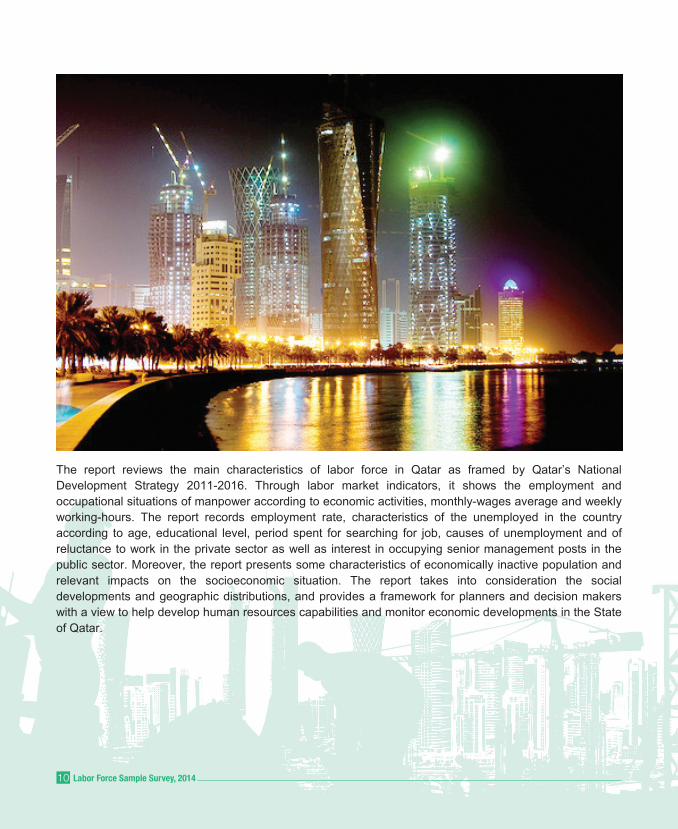
The report reviews the main characteristics of labor force in Qatar as framed by Qatar’s National Development Strategy 2011-2016. Through labor market indicators, it shows the employment and occupational situations of manpower according to economic activities, monthly-wages average and weekly working-hours. The report records employment rate, characteristics of the unemployed in the country according to age, educational level, period spent for searching for job, causes of unemployment and of reluctance to work in the private sector as well as interest in occupying senior management posts in the public sector. Moreover, the report presents some characteristics of economically inactive population and relevant impacts on the socioeconomic situation. The report takes into consideration the social developments and geographic distributions, and provides a framework for planners and decision makers with a view to help develop human resources capabilities and monitor economic developments in the State of Qatar.
Labor Force Sample Survey, 201410
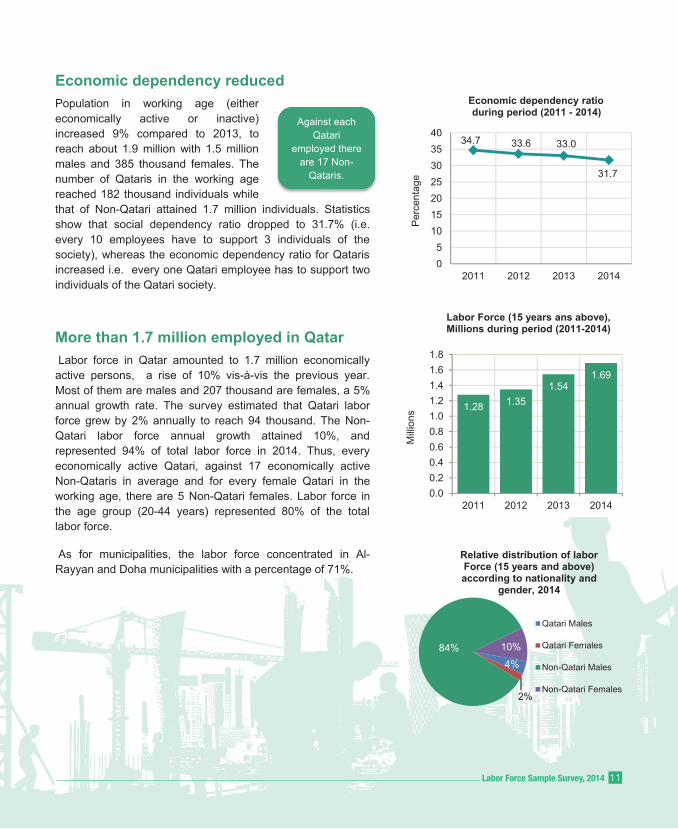
Economic dependency reduced Population in working age (either economically active or inactive) increased 9% compared to 2013, to reach about 1.9 million with 1.5 million males and 385 thousand females. The number of Qataris in the working age reached 182 thousand individuals while that of Non-Qatari attained 1.7 million individuals. Statistics show that social dependency ratio dropped to 31.7% (i.e. every 10 employees have to support 3 individuals of the society), whereas the economic dependency ratio for Qataris increased i.e. every one Qatari employee has to support two individuals of the Qatari society.
More than 1.7 million employed in Qatar Labor force in Qatar amounted to 1.7 million economically active persons, a rise of 10% vis-à-vis the previous year. Most of them are males and 207 thousand are females, a 5% annual growth rate. The survey estimated that Qatari labor force grew by 2% annually to reach 94 thousand. The Non-Qatari labor force annual growth attained 10%, and represented 94% of total labor force in 2014. Thus, every economically active Qatari, against 17 economically active Non-Qataris in average and for every female Qatari in the working age, there are 5 Non-Qatari females. Labor force in the age group (20-44 years) represented 80% of the total labor force.
As for municipalities, the labor force concentrated in Al-Rayyan and Doha municipalities with a percentage of 71%.
Against each Qatari
employed there are 17 Non-
Qataris.
34.7 33.6 33.0
31.7
05
10152025303540
2011 2012 2013 2014
Per
cent
age
Economic dependency ratio during period (2011 - 2014)
1.28 1.351.54
1.69
0.00.20.40.60.81.01.21.41.61.8
2011 2012 2013 2014
Mill
ions
Labor Force (15 years ans above), Millions during period (2011-2014)
4%
2%
84% 10%
Relative distribution of labor Force (15 years and above) according to nationality and
gender, 2014
Qatari Males
Qatari Females
Non-Qatari Males
Non-Qatari Females
Labor Force Sample Survey, 2014 11
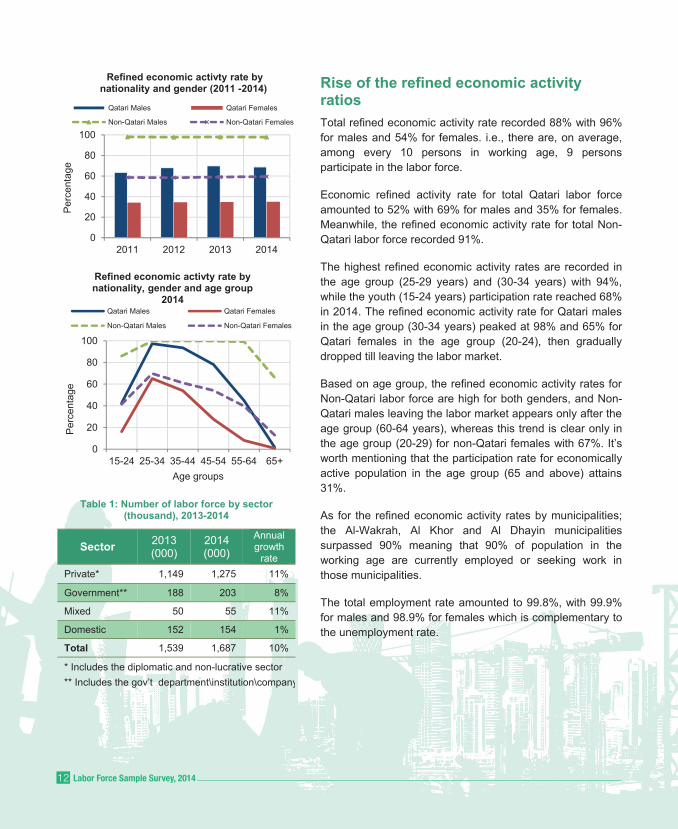
Rise of the refined economic activity ratios Total refined economic activity rate recorded 88% with 96% for males and 54% for females. i.e., there are, on average, among every 10 persons in working age, 9 persons participate in the labor force.
Economic refined activity rate for total Qatari labor force amounted to 52% with 69% for males and 35% for females. Meanwhile, the refined economic activity rate for total Non-Qatari labor force recorded 91%.
The highest refined economic activity rates are recorded in the age group (25-29 years) and (30-34 years) with 94%, while the youth (15-24 years) participation rate reached 68% in 2014. The refined economic activity rate for Qatari males in the age group (30-34 years) peaked at 98% and 65% for Qatari females in the age group (20-24), then gradually dropped till leaving the labor market.
Based on age group, the refined economic activity rates for Non-Qatari labor force are high for both genders, and Non-Qatari males leaving the labor market appears only after the age group (60-64 years), whereas this trend is clear only in the age group (20-29) for non-Qatari females with 67%. It’s worth mentioning that the participation rate for economically active population in the age group (65 and above) attains 31%.
As for the refined economic activity rates by municipalities; the Al-Wakrah, Al Khor and Al Dhayin municipalities surpassed 90% meaning that 90% of population in the working age are currently employed or seeking work in those municipalities.
The total employment rate amounted to 99.8%, with 99.9% for males and 98.9% for females which is complementary to the unemployment rate.
Table 1: Number of labor force by sector (thousand), 2013-2014
Sector 2013 (000)
2014 (000)
Annual growth
ratePrivate* 1,149 1,275 11%
Government** 188 203 8%
Mixed 50 55 11%
Domestic 152 154 1%
Total 1,539 1,687 10%
* Includes the diplomatic and non-lucrative sector ** Includes the gov’t department\institution\company
0
20
40
60
80
100
2011 2012 2013 2014
Per
cent
age
Refined economic activty rate by nationality and gender (2011 -2014)
Qatari Males Qatari Females
Non-Qatari Males Non-Qatari Females
0
20
40
60
80
100
15-24 25-34 35-44 45-54 55-64 65+
Per
cent
age
Age groups
Refined economic activty rate by nationality, gender and age group
2014Qatari Males Qatari Females
Non-Qatari Males Non-Qatari Females
Labor Force Sample Survey, 201412
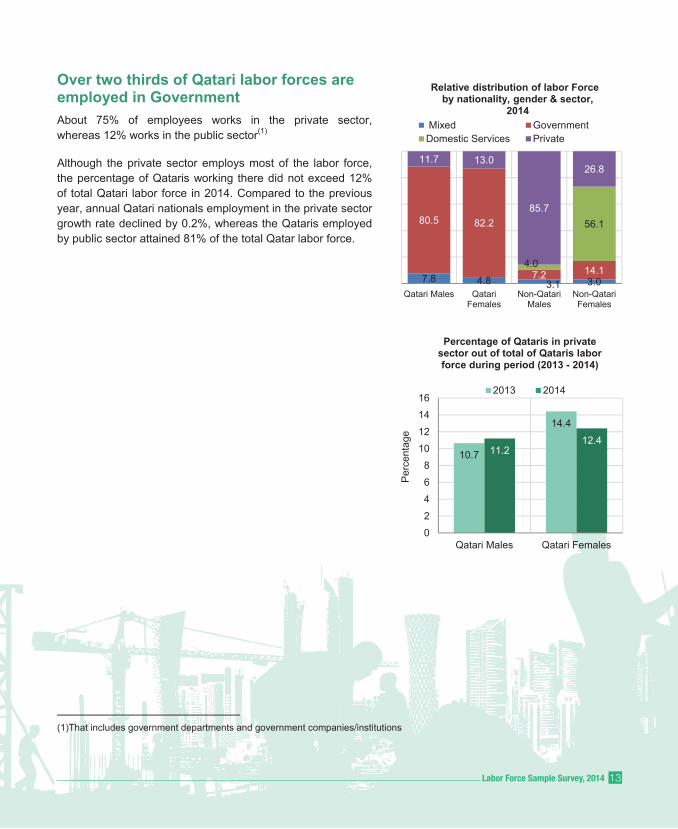
Over two thirds of Qatari labor forces are employed in Government About 75% of employees works in the private sector, whereas 12% works in the public sector 1( )
Although the private sector employs most of the labor force, the percentage of Qataris working there did not exceed 12% of total Qatari labor force in 2014. Compared to the previous year, annual Qatari nationals employment in the private sector growth rate declined by 0.2%, whereas the Qataris employed by public sector attained 81% of the total Qatar labor force.
(1)That includes government departments and government companies/institutions
7.8 4.8 3.1 3.0
80.5 82.2
7.2 14.14.0
56.1
11.7 13.0
85.7
26.8
Qatari Males QatariFemales
Non-QatariMales
Non-QatariFemales
Relative distribution of labor Force by nationality, gender & sector,
2014 Mixed GovernmentDomestic Services Private
10.7
14.4
11.212.4
02
468
1012
1416
Qatari Males Qatari Females
Per
cent
age
Percentage of Qataris in private sector out of total of Qataris labor force during period (2013 - 2014)
2013 2014
Labor Force Sample Survey, 2014 13
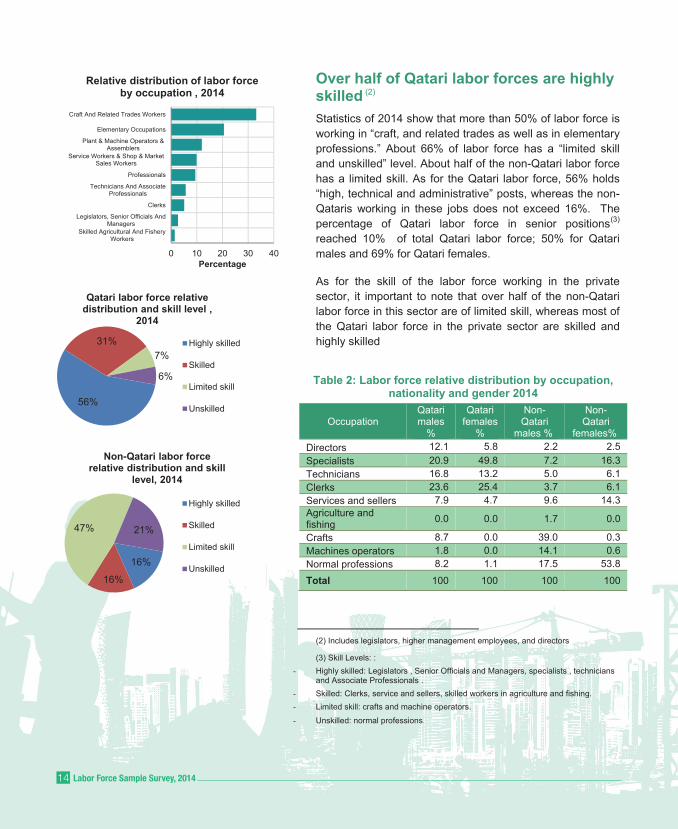
Over half of Qatari labor forces are highly skilled )2(
Statistics of 2014 show that more than 50% of labor force is working in “craft, and related trades as well as in elementary professions.” About 66% of labor force has a “limited skill and unskilled” level. About half of the non-Qatari labor force has a limited skill. As for the Qatari labor force, 56% holds “high, technical and administrative” posts, whereas the non-Qataris working in these jobs does not exceed 16%. The percentage of Qatari labor force in senior positions 3( ) reached 10% of total Qatari labor force; 50% for Qatari males and 69% for Qatari females.
As for the skill of the labor force working in the private sector, it important to note that over half of the non-Qatari labor force in this sector are of limited skill, whereas most of the Qatari labor force in the private sector are skilled and highly skilled
(2) Includes legislators, higher management employees, and directors
(3) Skill Levels: : - Highly skilled: Legislators , Senior Officials and Managers, specialists , technicians
and Associate Professionals . - Skilled: Clerks, service and sellers, skilled workers in agriculture and fishing. - Limited skill: crafts and machine operators.
- Unskilled: normal professions.
Table 2: Labor force relative distribution by occupation, nationality and gender 2014
Occupation Qatari males
%
Qatari females
%
Non-Qatari
males %
Non-Qatari
females % Directors 12.1 5.8 2.2 2.5 Specialists 20.9 49.8 7.2 16.3 Technicians 16.8 13.2 5.0 6.1 Clerks 23.6 25.4 3.7 6.1 Services and sellers 7.9 4.7 9.6 14.3 Agriculture and fishing 0.0 0.0 1.7 0.0
Crafts 8.7 0.0 39.0 0.3 Machines operators 1.8 0.0 14.1 0.6 Normal professions 8.2 1.1 17.5 53.8
Total 100 100 100 100
0 10 20 30 40
Skilled Agricultural And FisheryWorkers
Legislators, Senior Officials AndManagers
Clerks
Technicians And AssociateProfessionals
Professionals
Service Workers & Shop & MarketSales Workers
Plant & Machine Operators &Assemblers
Elementary Occupations
Craft And Related Trades Workers
Percentage
Relative distribution of labor force by occupation , 2014
56%
31%7%
6%
Qatari labor force relative distribution and skill level ,
2014
Highly skilled
Skilled
Limited skill
Unskilled
16%
16%
47% 21%
Non-Qatari labor force relative distribution and skill
level, 2014
Highly skilled
Skilled
Limited skill
Unskilled
Labor Force Sample Survey, 201414
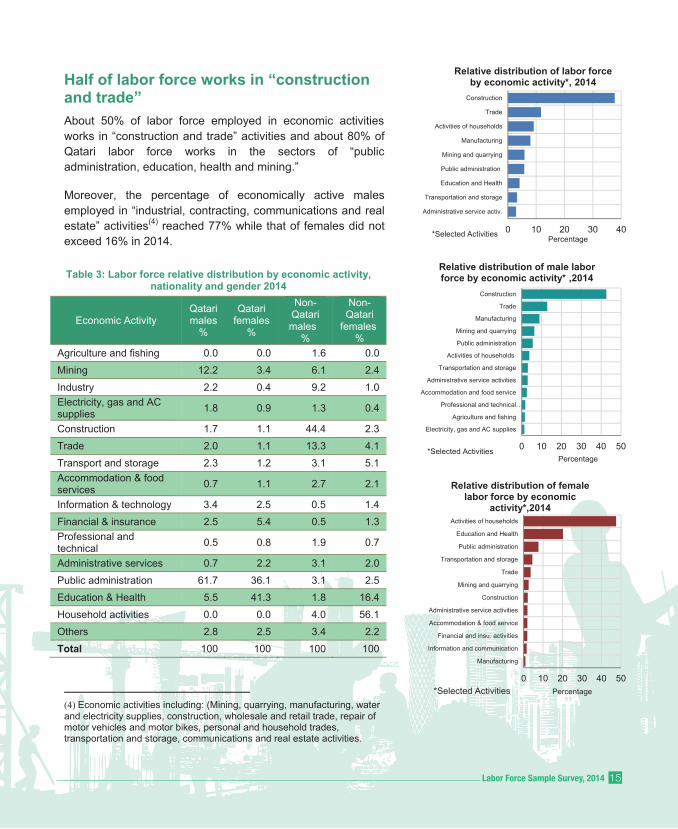
Half of labor force works in “construction and trade” About 50% of labor force employed in economic activities works in “construction and trade” activities and about 80% of Qatari labor force works in the sectors of “public administration, education, health and mining.”
Moreover, the percentage of economically active males employed in “industrial, contracting, communications and real estate” activities(4) reached 77% while that of females did not exceed 16% in 2014.
(4) Economic activities including: (Mining, quarrying, manufacturing, water and electricity supplies, construction, wholesale and retail trade, repair of motor vehicles and motor bikes, personal and household trades, transportation and storage, communications and real estate activities.
Table 3: Labor force relative distribution by economic activity, nationality and gender 2014
Economic Activity Qatari males
%
Qatari females
%
Non-Qatari males
%
Non-Qatari
females %
Agriculture and fishing 0.0 0.0 1.6 0.0 Mining 12.2 3.4 6.1 2.4 Industry 2.2 0.4 9.2 1.0 Electricity, gas and AC supplies 1.8 0.9 1.3 0.4
Construction 1.7 1.1 44.4 2.3 Trade 2.0 1.1 13.3 4.1 Transport and storage 2.3 1.2 3.1 5.1 Accommodation & food services 0.7 1.1 2.7 2.1
Information & technology 3.4 2.5 0.5 1.4 Financial & insurance 2.5 5.4 0.5 1.3 Professional and technical 0.5 0.8 1.9 0.7
Administrative services 0.7 2.2 3.1 2.0 Public administration 61.7 36.1 3.1 2.5 Education & Health 5.5 41.3 1.8 16.4 Household activities 0.0 0.0 4.0 56.1 Others 2.8 2.5 3.4 2.2 Total 100 100 100 100
0 10 20 30 40
Administrative service activ.
Transportation and storage
Education and Health
Public administration
Mining and quarrying
Manufacturing
Activities of households
Trade
Construction
Percentage
Relative distribution of labor force by economic activity*, 2014
*Selected Activities
0 10 20 30 40 50
Electricity, gas and AC supplies
Agriculture and fishing
Professional and technical…
Accommodation and food service
Administrative service activities
Transportation and storage
Activities of households
Public administration
Mining and quarrying
Manufacturing
Trade
Construction
Relative distribution of male labor force by economic activity* ,2014
Percentage*Selected Activities
0 10 20 30 40 50
Manufacturing
Information and communication
Financial and insu. activities
Accommodation & food service
Administrative service activities
Construction
Mining and quarrying
Trade
Transportation and storage
Public administration
Education and Health
Activities of households
Percentage
Relative distribution of female labor force by economic
activity*,2014
*Selected Activities
Labor Force Sample Survey, 2014 15
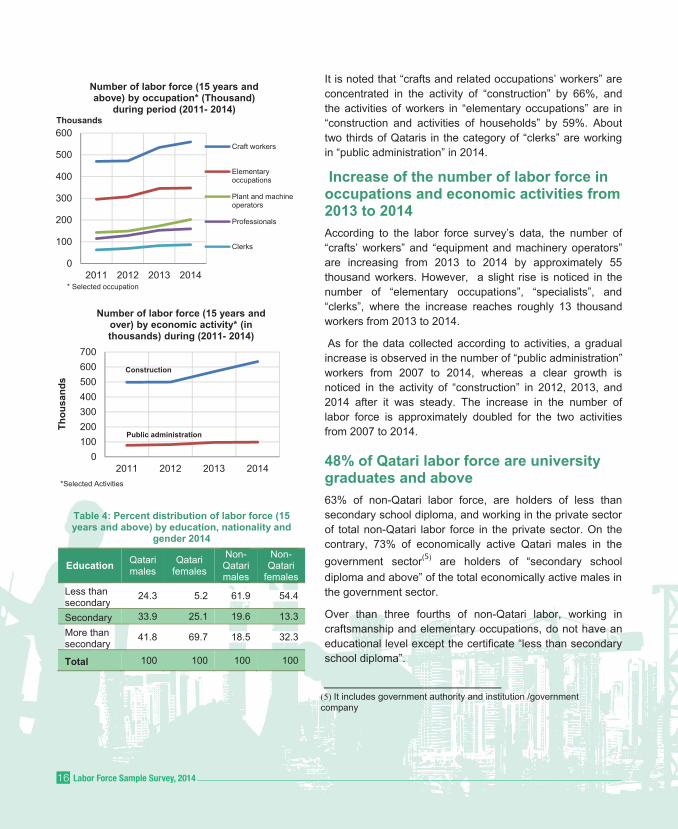
It is noted that “crafts and related occupations’ workers” are concentrated in the activity of “construction” by 66%, and the activities of workers in “elementary occupations” are in “construction and activities of households” by 59%. About two thirds of Qataris in the category of “clerks” are working in “public administration” in 2014.
Increase of the number of labor force in occupations and economic activities from 2013 to 2014 According to the labor force survey’s data, the number of “crafts’ workers” and “equipment and machinery operators” are increasing from 2013 to 2014 by approximately 55 thousand workers. However, a slight rise is noticed in the number of “elementary occupations”, “specialists”, and “clerks”, where the increase reaches roughly 13 thousand workers from 2013 to 2014.
As for the data collected according to activities, a gradual increase is observed in the number of “public administration” workers from 2007 to 2014, whereas a clear growth is noticed in the activity of “construction” in 2012, 2013, and 2014 after it was steady. The increase in the number of labor force is approximately doubled for the two activities from 2007 to 2014.
48% of Qatari labor force are university graduates and above 63% of non-Qatari labor force, are holders of less than secondary school diploma, and working in the private sector of total non-Qatari labor force in the private sector. On the contrary, 73% of economically active Qatari males in the government sector(5) are holders of “secondary school diploma and above” of the total economically active males in the government sector.
Over than three fourths of non-Qatari labor, working in craftsmanship and elementary occupations, do not have an educational level except the certificate “less than secondary school diploma”.
(5) It includes government authority and institution /government company
0
100
200
300
400
500
600
2011 2012 2013 2014
Thousands
Number of labor force (15 years and above) by occupation* (Thousand)
during period (2011- 2014)
Craft workers
Elementaryoccupations
Plant and machineoperators
Professionals
Clerks
* Selected occupation
0100200300400500600700
2011 2012 2013 2014
Thou
sand
s
Number of labor force (15 years and over) by economic activity* (in thousands) during (2011- 2014)
*Selected Activities
Construction
Public administration
Table 4: Percent distribution of labor force (15 years and above) by education, nationality and
gender 2014
Education Qatari males
Qatari females
Non-Qatari males
Non-Qatari
females Less than secondary
24.3 5.2 61.9 54.4
Secondary 33.9 25.1 19.6 13.3 More than secondary
41.8 69.7 18.5 32.3
Total 100 100 100 100
Labor Force Sample Survey, 201416
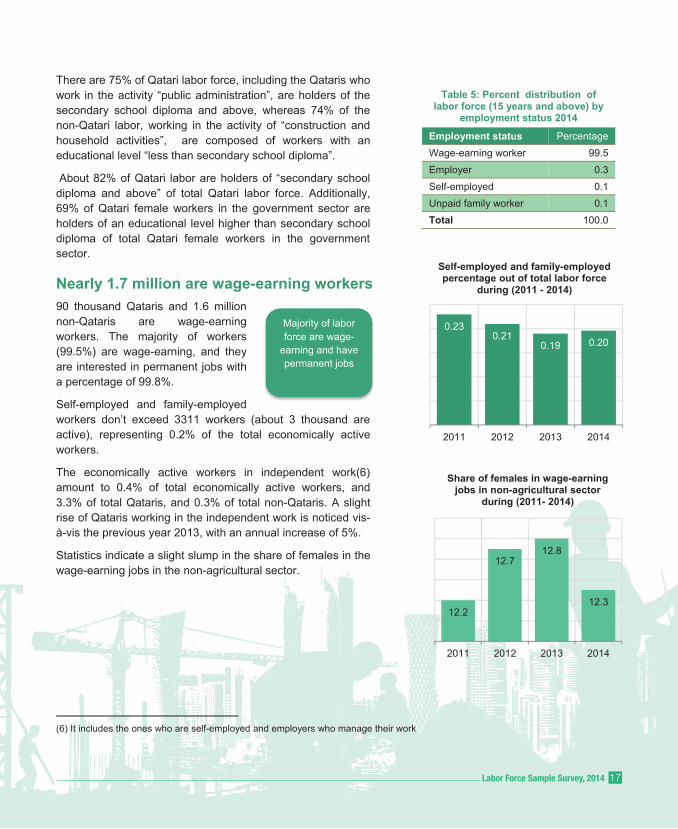
There are 75% of Qatari labor force, including the Qataris who work in the activity “public administration”, are holders of the secondary school diploma and above, whereas 74% of the non-Qatari labor, working in the activity of “construction and household activities”, are composed of workers with an educational level “less than secondary school diploma”.
About 82% of Qatari labor are holders of “secondary school diploma and above” of total Qatari labor force. Additionally, 69% of Qatari female workers in the government sector are holders of an educational level higher than secondary school diploma of total Qatari female workers in the government sector.
Nearly 1.7 million are wage-earning workers 90 thousand Qataris and 1.6 million non-Qataris are wage-earning workers. The majority of workers (99.5%) are wage-earning, and they are interested in permanent jobs with a percentage of 99.8%.
Self-employed and family-employed workers don’t exceed 3311 workers (about 3 thousand are active), representing 0.2% of the total economically active workers.
The economically active workers in independent work(6) amount to 0.4% of total economically active workers, and 3.3% of total Qataris, and 0.3% of total non-Qataris. A slight rise of Qataris working in the independent work is noticed vis-à-vis the previous year 2013, with an annual increase of 5%.
Statistics indicate a slight slump in the share of females in the wage-earning jobs in the non-agricultural sector.
(6) It includes the ones who are self-employed and employers who manage their work
Table 5: Percent distribution of labor force (15 years and above) by
employment status 2014
Employment status Percentage Wage-earning worker 99.5 Employer 0.3 Self-employed 0.1 Unpaid family worker 0.1 Total 100.0
Majority of labor force are wage-
earning and have permanent jobs
0.230.21
0.19 0.20
2011 2012 2013 2014
Self-employed and family-employed percentage out of total labor force
during (2011 - 2014)
12.2
12.712.8
12.3
2011 2012 2013 2014
Share of females in wage-earning jobs in non-agricultural sector
during (2011- 2014)
Labor Force Sample Survey, 2014 17
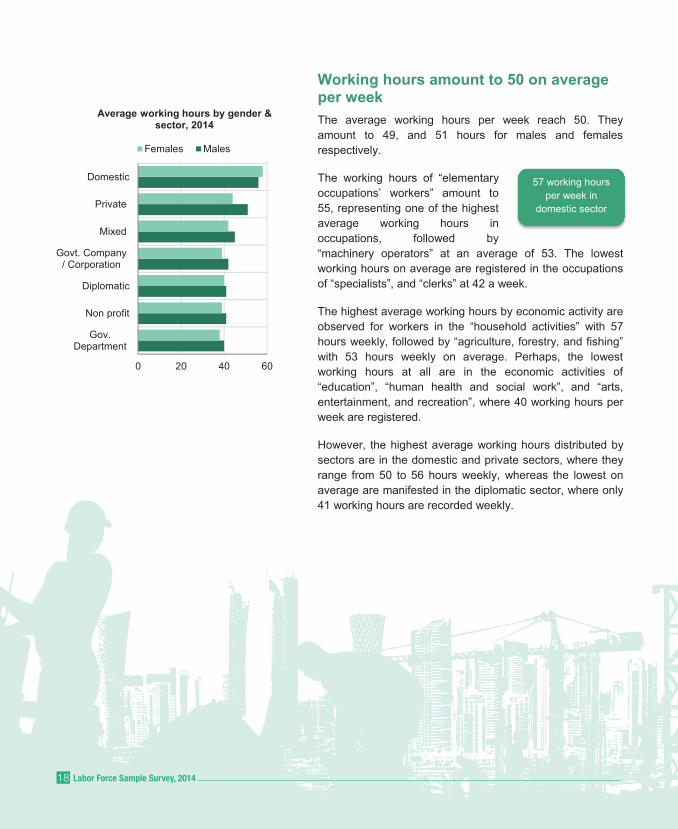
Working hours amount to 50 on average per week The average working hours per week reach 50. They amount to 49, and 51 hours for males and females respectively.
The working hours of “elementary occupations’ workers” amount to 55, representing one of the highest average working hours in occupations, followed by “machinery operators” at an average of 53. The lowest working hours on average are registered in the occupations of “specialists”, and “clerks” at 42 a week.
The highest average working hours by economic activity are observed for workers in the “household activities” with 57 hours weekly, followed by “agriculture, forestry, and fishing” with 53 hours weekly on average. Perhaps, the lowest working hours at all are in the economic activities of “education”, “human health and social work”, and “arts, entertainment, and recreation”, where 40 working hours per week are registered.
However, the highest average working hours distributed by sectors are in the domestic and private sectors, where they range from 50 to 56 hours weekly, whereas the lowest on average are manifested in the diplomatic sector, where only 41 working hours are recorded weekly.
57 working hours per week in
domestic sector
0 20 40 60
Gov.Department
Non profit
Diplomatic
Govt. Company/ Corporation
Mixed
Private
Domestic
Average working hours by gender & sector, 2014
Females Males
Labor Force Sample Survey, 201418
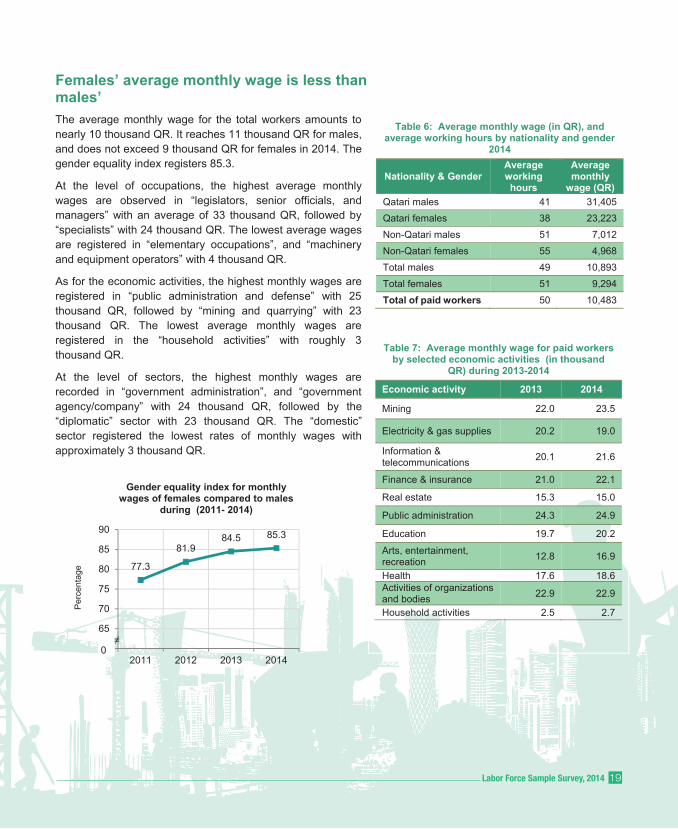
Females’ average monthly wage is less than males’ The average monthly wage for the total workers amounts to nearly 10 thousand QR. It reaches 11 thousand QR for males, and does not exceed 9 thousand QR for females in 2014. The gender equality index registers 85.3.
At the level of occupations, the highest average monthly wages are observed in “legislators, senior officials, and managers” with an average of 33 thousand QR, followed by “specialists” with 24 thousand QR. The lowest average wages are registered in “elementary occupations”, and “machinery and equipment operators” with 4 thousand QR.
As for the economic activities, the highest monthly wages are registered in “public administration and defense” with 25 thousand QR, followed by “mining and quarrying” with 23 thousand QR. The lowest average monthly wages are registered in the “household activities” with roughly 3 thousand QR.
At the level of sectors, the highest monthly wages are recorded in “government administration”, and “government agency/company” with 24 thousand QR, followed by the “diplomatic” sector with 23 thousand QR. The “domestic” sector registered the lowest rates of monthly wages with approximately 3 thousand QR.
Table 7: Average monthly wage for paid workers by selected economic activities (in thousand
QR) during 2013-2014
Economic activity 2013 2014
Mining 22.0 23.5
Electricity & gas supplies 20.2 19.0
Information & telecommunications 20.1 21.6
Finance & insurance 21.0 22.1
Real estate 15.3 15.0
Public administration 24.3 24.9
Education 19.7 20.2
Arts, entertainment, recreation 12.8 16.9
Health 17.6 18.6 Activities of organizations and bodies 22.9 22.9
Household activities 2.5 2.7
Table 6: Average monthly wage (in QR), and average working hours by nationality and gender
2014
Nationality & Gender Average working hours
Average monthly
wage (QR) Qatari males 41 31,405 Qatari females 38 23,223 Non-Qatari males 51 7,012 Non-Qatari females 55 4,968 Total males 49 10,893 Total females 51 9,294 Total of paid workers 50 10,483
77.3
81.984.5 85.3
60
65
70
75
80
85
90
2011 2012 2013 2014
Per
cent
age
Gender equality index for monthly wages of females compared to males
during (2011- 2014)
0≠
Labor Force Sample Survey, 2014 19
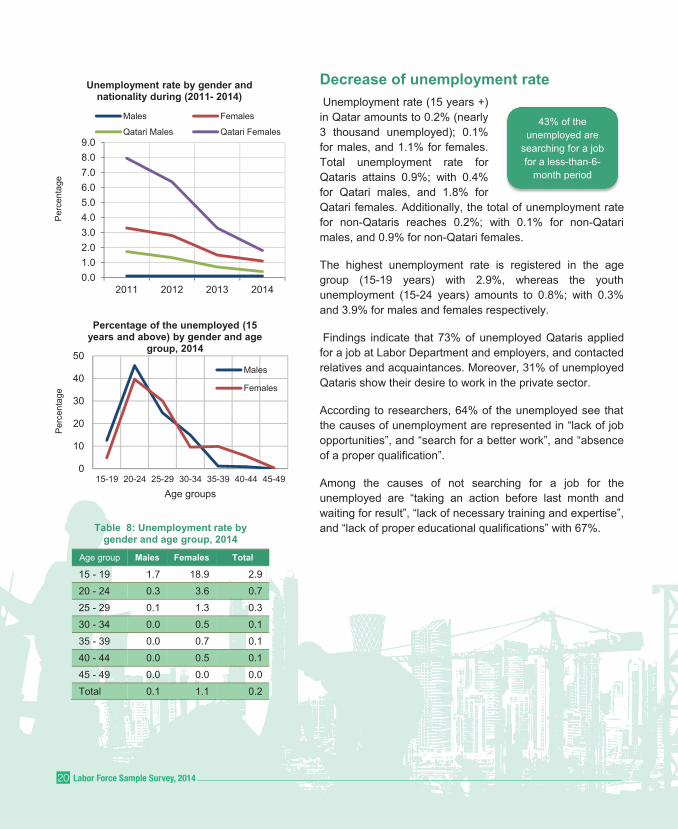
Decrease of unemployment rate Unemployment rate (15 years +) in Qatar amounts to 0.2% (nearly 3 thousand unemployed); 0.1% for males, and 1.1% for females. Total unemployment rate for Qataris attains 0.9%; with 0.4% for Qatari males, and 1.8% for Qatari females. Additionally, the total of unemployment rate for non-Qataris reaches 0.2%; with 0.1% for non-Qatari males, and 0.9% for non-Qatari females.
The highest unemployment rate is registered in the age group (15-19 years) with 2.9%, whereas the youth unemployment (15-24 years) amounts to 0.8%; with 0.3% and 3.9% for males and females respectively.
Findings indicate that 73% of unemployed Qataris applied for a job at Labor Department and employers, and contacted relatives and acquaintances. Moreover, 31% of unemployed Qataris show their desire to work in the private sector.
According to researchers, 64% of the unemployed see that the causes of unemployment are represented in “lack of job opportunities”, and “search for a better work”, and “absence of a proper qualification”.
Among the causes of not searching for a job for the unemployed are “taking an action before last month and waiting for result”, “lack of necessary training and expertise”, and “lack of proper educational qualifications” with 67%.
43% of the unemployed are
searching for a job for a less-than-6-
month period
Table 8: Unemployment rate by gender and age group, 2014
Age group Males Females Total
15 - 19 1.7 18.9 2.9 20 - 24 0.3 3.6 0.7 25 - 29 0.1 1.3 0.3 30 - 34 0.0 0.5 0.1 35 - 39 0.0 0.7 0.1 40 - 44 0.0 0.5 0.1 45 - 49 0.0 0.0 0.0 Total 0.1 1.1 0.2
0.01.02.03.04.05.06.07.08.09.0
2011 2012 2013 2014
Per
cent
age
Unemployment rate by gender and nationality during (2011- 2014)
Males Females
Qatari Males Qatari Females
0
10
20
30
40
50
15-19 20-24 25-29 30-34 35-39 40-44 45-49
Per
cent
age
Age groups
Percentage of the unemployed (15 years and above) by gender and age
group, 2014
Males
Females
Labor Force Sample Survey, 201420
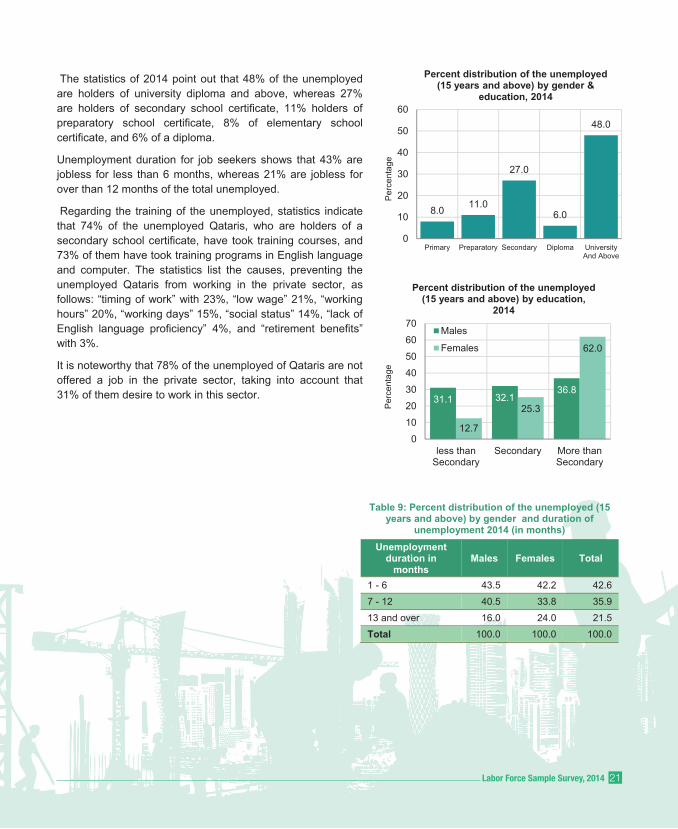
The statistics of 2014 point out that 48% of the unemployed are holders of university diploma and above, whereas 27% are holders of secondary school certificate, 11% holders of preparatory school certificate, 8% of elementary school certificate, and 6% of a diploma.
Unemployment duration for job seekers shows that 43% are jobless for less than 6 months, whereas 21% are jobless for over than 12 months of the total unemployed.
Regarding the training of the unemployed, statistics indicate that 74% of the unemployed Qataris, who are holders of a secondary school certificate, have took training courses, and 73% of them have took training programs in English language and computer. The statistics list the causes, preventing the unemployed Qataris from working in the private sector, as follows: “timing of work” with 23%, “low wage” 21%, “working hours” 20%, “working days” 15%, “social status” 14%, “lack of English language proficiency” 4%, and “retirement benefits” with 3%.
It is noteworthy that 78% of the unemployed of Qataris are not offered a job in the private sector, taking into account that 31% of them desire to work in this sector.
Table 9: Percent distribution of the unemployed (15 years and above) by gender and duration of
unemployment 2014 (in months) Unemployment
duration in months
Males Females Total
1 - 6 43.5 42.2 42.6 7 - 12 40.5 33.8 35.9 13 and over 16.0 24.0 21.5 Total 100.0 100.0 100.0
31.1 32.136.8
12.7
25.3
62.0
0
10
20
30
40
50
60
70
less thanSecondary
Secondary More thanSecondary
Per
cent
age
Percent distribution of the unemployed (15 years and above) by education,
2014
Males
Females
8.0 11.0
27.0
6.0
48.0
0
10
20
30
40
50
60
Primary Preparatory Secondary Diploma UniversityAnd Above
Per
cent
age
Percent distribution of the unemployed (15 years and above) by gender &
education, 2014
Labor Force Sample Survey, 2014 21
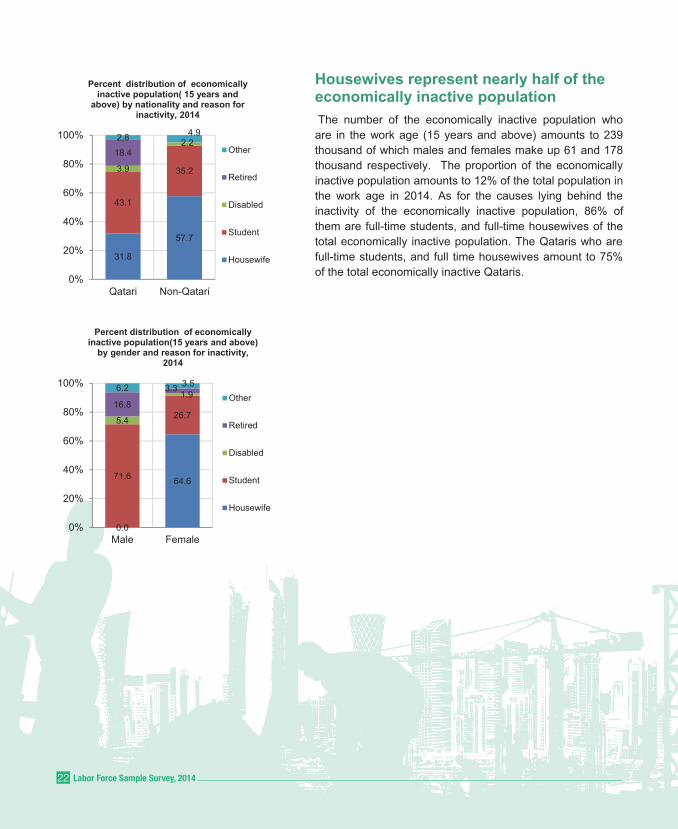
Housewives represent nearly half of the economically inactive population The number of the economically inactive population who are in the work age (15 years and above) amounts to 239 thousand of which males and females make up 61 and 178 thousand respectively. The proportion of the economically inactive population amounts to 12% of the total population in the work age in 2014. As for the causes lying behind the inactivity of the economically inactive population, 86% of them are full-time students, and full-time housewives of the total economically inactive population. The Qataris who are full-time students, and full time housewives amount to 75% of the total economically inactive Qataris.
31.8
57.7
43.1
35.23.9
2.218.4
2.8 4.9
0%
20%
40%
60%
80%
100%
Qatari Non-Qatari
Percent distribution of economically inactive population( 15 years and
above) by nationality and reason for inactivity, 2014
Other
Retired
Disabled
Student
Housewife
0.0
64.671.6
26.75.4
1.916.8
3.36.2 3.5
0%
20%
40%
60%
80%
100%
Male Female
Percent distribution of economically inactive population(15 years and above)
by gender and reason for inactivity, 2014
Other
Retired
Disabled
Student
Housewife
Labor Force Sample Survey, 201422

Survey objectives
1. Estimation of labor force size in the State of Qatar.
2. Distribution of labor force by different characteristics: age group, gender, education, marital status, employment status, economic activity, occupation, sector … etc.
3. Measurement of employment and unemployment levels in the State of Qatar.
4. Measurement of unemployment.
5. Study of the relationship between the occupation and educational specialization.
6. Study of the population that falls outside the category of labor force by: age group, gender, nationality, education, marital status, desire to work, reason for reluctance to work, and reason for leaving the previous work.
7. Establishment of an updated database, and provision of the entire data and information necessary for the conduct of studies.
Labor Force Sample Survey, 201424
Survey description 1- Survey’s scope: The targeted population of the labor force survey are all Qatari and non-Qatari households in Qatar. This includes individuals living in normal and collective households. Those latter are a group of persons with no ties of kinship, but they share living conditions in a residential unit, i.e. labor camps, boarding schools, nurses in hospitals…etc. the survey covers small collective households (less than 7 persons), and large collective households (7 persons or more). The survey does not cover short-stay accommodations such as hotels.
2- Reference period Data are collected monthly. The survey’s reference period is the week prior to the one when interviews are conducted.
3- Themes covered by the survey The survey measures the labor force core statistics – economically active population, employment, unemployment, and the relevant demographic, social and economic variables which include economic activity, occupation, and education,…etc. In addition to the key themes, the survey investigates income, working hours, work type, current and previous occupation, economic activity, employment status, stability at work, reasons for not working full-time, secondary work (multiple occupations), duration and methods for looking for a job, reasons for unemployment and not searching for a job, desire and readiness to work or training, and other variables. Further, the survey tackles the methods used previously by the Qatari employees (less than 25 years of age) to obtain their current jobs, and the reasons behind not looking for job in the private sector by the Qataris who are unemployed.
Labor Force Sample Survey, 2014 25
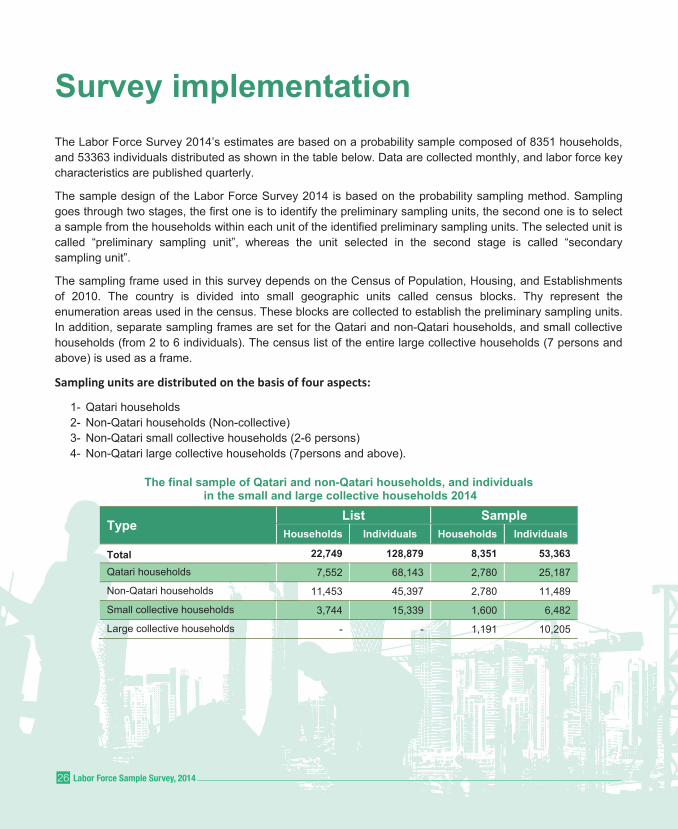
Survey implementation The Labor Force Survey 2014’s estimates are based on a probability sample composed of 8351 households, and 53363 individuals distributed as shown in the table below. Data are collected monthly, and labor force key characteristics are published quarterly.
The sample design of the Labor Force Survey 2014 is based on the probability sampling method. Sampling goes through two stages, the first one is to identify the preliminary sampling units, the second one is to select a sample from the households within each unit of the identified preliminary sampling units. The selected unit is called “preliminary sampling unit”, whereas the unit selected in the second stage is called “secondary sampling unit”.
The sampling frame used in this survey depends on the Census of Population, Housing, and Establishments of 2010. The country is divided into small geographic units called census blocks. Thy represent the enumeration areas used in the census. These blocks are collected to establish the preliminary sampling units. In addition, separate sampling frames are set for the Qatari and non-Qatari households, and small collective households (from 2 to 6 individuals). The census list of the entire large collective households (7 persons and above) is used as a frame.
Sampling units are distributed on the basis of four aspects:
1- Qatari households 2- Non-Qatari households (Non-collective) 3- Non-Qatari small collective households (2-6 persons) 4- Non-Qatari large collective households (7persons and above).
The final sample of Qatari and non-Qatari households, and individuals in the small and large collective households 2014
Type List Sample
Households Individuals Households Individuals
Total 22,749 128,879 8,351 53,363
Qatari households 7,552 68,143 2,780 25,187
Non-Qatari households 11,453 45,397 2,780 11,489
Small collective households 3,744 15,339 1,600 6,482
Large collective households - - 1,191 10,205
Labor Force Sample Survey, 201426
For further details on:
Survey implementation and methodology Sampling, field operations, and weighting procedures Standard errors of survey estimates
Please visit our websites: Ministry of Development Planning and Statistics www.mdps.gov.qa
Qatar Information Exchange (Qalm) www.qalm.gov.qa
Published tables The online bulletin of the Labor Force Sample Survey 2014 is presented in 116 tables. It also features the labor market’s key indicators. The main 26 tables are selected for this analytical report, and the rest of tables are available on www.mdps.gov.qa or on www.qalm.gov.qa
Labor Force Sample Survey, 2014 27
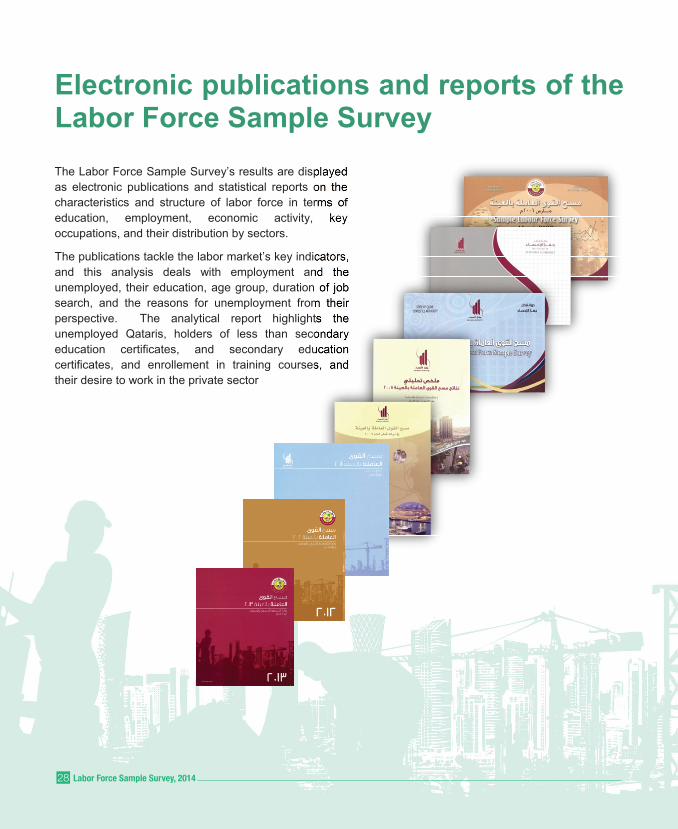
Electronic publications and reports of the Labor Force Sample Survey The Labor Force Sample Survey’s results are displayed as electronic publications and statistical reports on the characteristics and structure of labor force in terms of education, employment, economic activity, key occupations, and their distribution by sectors.
The publications tackle the labor market’s key indicators, and this analysis deals with employment and the unemployed, their education, age group, duration of job search, and the reasons for unemployment from their perspective. The analytical report highlights the unemployed Qataris, holders of less than secondary education certificates, and secondary education certificates, and enrollement in training courses, and their desire to work in the private sector
Labor Force Sample Survey, 201428
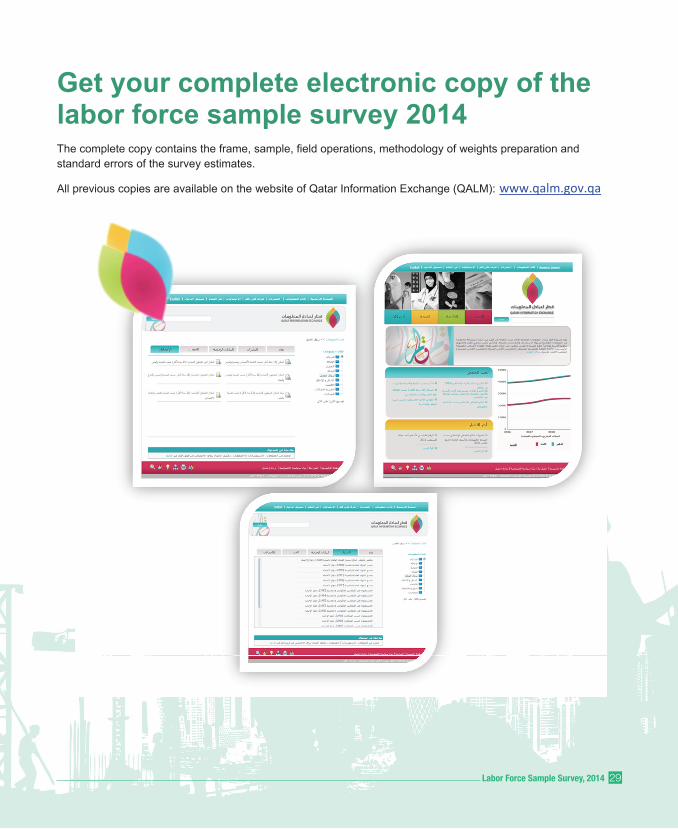
Get your complete electronic copy of the labor force sample survey 2014 The complete copy contains the frame, sample, field operations, methodology of weights preparation and standard errors of the survey estimates.
All previous copies are available on the website of Qatar Information Exchange (QALM): www.qalm.gov.qa
Labor Force Sample Survey, 2014 29


TabLeS