Embed Size (px)
Citation preview

Maine State LibraryMaine State DocumentsCenter for Workforce Research and InformationDocuments Labor
9-1-1999
Labor Market Digest, September 1999Maine Department of Labor
Maine Center for Workforce Research and Information
Follow this and additional works at: http://digitalmaine.com/cwri_docs
This Text is brought to you for free and open access by the Labor at Maine State Documents. It has been accepted for inclusion in Center for WorkforceResearch and Information Documents by an authorized administrator of Maine State Documents. For more information, please [email protected].
Recommended CitationMaine Department of Labor and Maine Center for Workforce Research and Information, "Labor Market Digest, September 1999"(1999). Center for Workforce Research and Information Documents. Paper 866.http://digitalmaine.com/cwri_docs/866

MAINE Labor Market DigestDEPARTMENT OF
LABORLabor i Market 111formation
INSIDE . . .
Unemployment rates below
two percent are recorded
by Lincoln and Cumberland
counties page 3
Adjusted unemployment
falls slightly between
lune and July page 4
Nonfarm employment
rises by 14,200 over the
year, led by services
industries page 6
lob gains were recorded by
fifteen counties between
1997 and 1998 page 8
A publication of
j the
Maine Department of Labor
Labor Market
ormation Services
vnold A. Fongemiedivision Director
n-Circre
ana A. Evans
Editor
information, call
, .jne (207) 287-2271
FAX (207) 287-2947
TTY 1-800-794-1110
E-Mail - [email protected]
Visit our Home Page at
http://www.state.me.us/labor/
Imis/frdef.htm
July Data September 1999
The Number of Jobs in Maine Increased by
Almost 14,000 Between 1997 and 1998
Reported employment1 increased by 13,944 statewide between 1997 and 1998. Jobsin services industries rose by 6,879, accounting for almost 50 percent of the total jobgain. All other industry divisions, with the exception of manufacturing, also recorded
over-the-year job increases. Gains ranged from 35 in Piscataquis County to 3,126 in
Cumberland County. A loss of 83 jobs was recorded in Kennebec County.
See page eight for a breakdown of county jobs by industry.
'Employment reported by employers subject to the Maine Employment Security Law. Also included is
reported employment of federal government installations within the state. The primary exclusion from
this employment count is the self-employed. County job changes do not add to the statewide change of13,944 due to employers with establishments in more than one county who report on a statewide basis
only.
Genera
ted o
n 2
01
5-1
1-1
8 1
6:3
8 G
MT /
htt
p:/
/hd
l.hand
le.n
et/
20
27
/coo.3
19
24
08
28
38
10
7C
reati
ve C
om
mons
Zero
(C
C0
) /
htt
p:/
/ww
w.h
ath
itru
st.o
rg/a
ccess
_use
#cc
-zero

2 Maine Labor Market Digest
Civilian Labor Force, Employed, and Unemployed
by Labor Market Area, Not Seasonally Adjusted
AREACIVILIAN LABOR FORCE'
July 99 June 99 July 98
EMPLOYED2
July 99 June 99 July 98
UNEMPLOYED3
July 99 June 99 July 98
UNEMPLOYMENT RATE4
July 99 June 99 July 98
LABOR MARKET AREAS
Augusta 47,220 45,520 46,030 45,450 43,480 44,260 1,780 2,040 1,780 3.8% 4.5% 3.9%
Bangor MSA 51,200 50,600 48,900 50,100 49,300 47,700 1,100 1,300 1,200 2.1 2.6 2.4
Bath-Brunswick 34,670 33,220 34,150 33,810 32,160 33,340 860 1,060 810 2.5 3.2 2.4
Belfast 15,850 15,790 15,340 15,330 15,190 14,830 520 600 510 3.3 3.8 3.3
Biddeford 42,800 40,970 41,820 42,080 40,030 41,020 710 950 800 1.7 2.3 1.9
Boothbay Harbor 10,840 10,060 10,520 10,710 9,870 10,380 130 190 140 1.2 1.9 1.3
Bucksport 5,190 5,400 5,120 4,970 5,170 4,910 220 230 210 4.2 4.3 4.1
Calais 5,240 5,230 4,980 4,800 4,680 4,590 440 560 390 8.4 10.6 7.8
Dexter-Pittsfield 12,130 13,310 11,960 11,230 12,250 11,040 900 1,060 920 7.4 8.0 7.7
Dover-Foxcrott 7,190 7,700 7,020 6,760 7,180 6,630 440 510 400 6.1 6.6 5.6
Ellsworth-Bar Harbor 24,410 22,580 22,610 23,710 21,640 22,080 690 930 540 2.8 4.1 2.4
Farmington 16,650 16,840 16,510 15,560 15,540 15,370 1,080 1,300 1,150 6.5 7.7 6.9
Fort Kent 3,680 3,800 3,560 3,390 3,240 3,270 290 560 290 7.9 14.8 8.2
Greenville 1,080 1,050 1,080 1,020 960 1,030 60 90 50 5.2 8.1 4.5
Houlton 6,690 6,850 6,490 6,350 6,390 6,140 340 460 350 5.0 6.7 5.4
Jonesport-Milbridge 4,270 4,240 4,180 3,970 3,860 3,910 310 380 270 7.2 9.0 6.4
Kittery-York5 20,640 19,990 19,960 20,350 19,710 19,760 290 280 190 1.4 1.4 1.0
Lewiston-Auburn MSA 52,600 52,900 51,100 50,800 50,700 48,900 1,800 2,200 2,200 3.4 4.2 4.3
Lincoln-Howland 5,900 6,190 5,790 5,560 5,690 5,480 340 500 310 5.7 8.1 5.4
Machias-Eastport 6,790 6,910 6,910 6,380 6,330 6,440 410 580 470 6.0 8.4 6.9
Madawaska 4,170 4,240 4,110 4,020 4,030 3,960 160 210 150 3.7 4.9 3.6
Millinocket-East Millinocket 5,380 5,510 5,300 5,090 5,070 4,990 300 440 310 5.5 8.0 5.9
Norway-Paris 11,640 12,090 11,640 10,980 11,360 11,010 670 730 620 5.7 6.0 5.4
Outer Bangor 7,490 8,500 6,810 7,060 8,020 6,460 430 480 350 5.7 5.7 5.2
Patten-Island Falls 1,980 2,050 1,890 1,830 1,780 1,740 160 270 150 8.0 13.3 7.8
Portland MSA 142,900 138,200 135,400 140,400 135,100 133,000 2,600 3,100 2,300 1.8 2.2 1.7
Presque Isle-Caribou 20,460 20,110 20,070 19,620 19,090 18,990 840 1,020 1,080 4.1 5.1 5.4
Rockland 24,950 24,820 24,430 24,380 24,110 23,890 570 710 540 2.3 2.8 2.2
Rumford 9,840 9,990 9,680 9,140 9,100 9,120 700 890 560 7.1 8.9 5.7
Sanford 23,640 23,960 22,940 22,660 22,870 21,610 980 1,090 1,340 4.1 4.6 5.8
Sebago Lakes Region 14,720 14,210 14,580 14,170 13,530 14,180 560 680 400 3.8 4.8 2.7
Skowhegan 16,910 17,450 16,670 15,900 16,170 15,710 1,010 1,280 960 6.0 7.4 5.8
Stonington 5,950 5,840 5,750 5,810 5,680 5,640 150 160 120 2.5 2.8 2.0
Van Buren 1,570 1,580 1,490 1,490 1,460 1,420 80 120 70 4.9 7.3 4.8
Waterville 23,560 25,130 23,350 22,520 23,830 22,150 1,040 1,310 1,210 4.4 5.2 5.2
MAINE 690,300 682,800 668,100 667,400 654,500 645,000 22,900 28,300 23,100 3.3 4.1 3.5
UNITED STATES (000) 141,119 140,666 139,336 134,800 134,395 132,769 6,319 6,271 6,567 4.5 4.5 4.7
Civilian labor force, employed, and unemployed estimates are by place of residence, Current month estimates are preliminary; prior month and year-ago
estimates are revised. Items may not add due to rounding. All data exclude members of the Armed Forces. MSA stands for Metropolitan Statistical Area.
2Total employment includes nonfarm wage and salary workers, agricultural workers, unpaid family workers, domestics, the self employed, and workers involved in
labor disputes.
3People are classified as unemployed, regardless of their eligibility for unemployment benefits or public assistance, if they meet all of the following: they were not
employed during the survey week; they were available for work at that time; and they made specific efforts to find employment some time during the prior four
weeks. Persons laid off from their former jobs and awaiting recall and those expecting to report to a job within 30 days need not be looking for work to be
counted as unemployed.
4The unemployment rate is calculated by dividing the total number of unemployed by the total civilian labor force, and Is expressed as a percent.
5Kittery-York is the five-town Maine portion of the Portsmouth-Rochester PMSA which Includes towns in both Maine and New Hampshire.
Source: Maine Department of Labor, Labor Market Information Services, in cooperation with the U.S. Department of Labor, Bureau of Labor Statistics.
Labor Market Information Scroiccs
Genera
ted o
n 2
01
5-1
1-1
8 1
6:3
8 G
MT /
htt
p:/
/hd
l.hand
le.n
et/
20
27
/coo.3
19
24
08
28
38
10
7C
reati
ve C
om
mons
Zero
(C
C0
) /
htt
p:/
/ww
w.h
ath
itru
st.o
rg/a
ccess
_use
#cc
-zero

Maine Labor Market Digest
Civilian Labor Force, Employed, and Unemployed
by County, Not Seasonally Adjusted1
AREACIVILIAN LABOR FORCE
Julv 99 June 99 Julv 98
EMPLOYED
June 99
UNEMPLOYED
June 99 Julv 98
UNEMPLOYMENT RATE
July 99 June 99 July 98
COUNTY
Julv 99 Julv 98 Julv 99
Androscoggin 58,690 58,940 57,130 56,580 56,370 54,590 2,110 2,570 2,540 3.6% 4.4% 4.4%
Aroostook 38,120 38,260 37,230 36,260 35,580 35,120 1,860 2,680 2,110 4.9 7.0 5.7
Cumberland 150,180 145,090 143,040 147,320 141,550 140,490 2,860 3,540 2,560 1.9 2.4 1.8
Franklin 14,040 14,250 13,880 13,140 13,120 12,980 900 1,130 900 6.4 7.9 6.5
Hancock 32,500 30,900 30,610 31,580 29,710 29,860 920 1,190 750 2.8 3.8 2.4
Kennebec 60,730 60,350 59,490 58,380 57,550 57,010 2,350 2,800 2,480 3.9 4.6 4.2
Knox 21,910 21,790 21,440 21,400 21,170 20,970 510 630 470 2.3 2.9 2.2
Lincoln 19,520 18,470 19,040 19,160 18,030 18,660 360 440 370 1.8 2.4 2.0
Oxford 26,750 27,050 26,440 25,100 25,140 25,110 1,650 1,910 1,330 6.2 7.1 5.0
Penobscot 77,200 78,450 73,730 74,390 75,060 71,040 2,800 3,390 2,690 3.6 4.3 3.6
Piscataquis 8,380 8,870 8,210 7,890 8,260 7,760 490 600 450 5.9 6.8 5.4
Sagadahoc 16,260 15,570 16,000 15,830 15,050 15,610 430 510 390 2.7 3.3 2.5
Somerset 25,920 27,210 25,620 24,380 25,300 24,050 1,540 1,910 1,570 5.9 7.0 6.1
Waldo 21,160 21,280 20,590 20,460 20,430 19,820 710 850 770 3.3 4.0 3.7
Washington 16,830 16,880 16,560 15,690 15,350 15,430 1,150 1,530 1,130 6.8 9.0 6 8
York 102,100 99,430 99,100 99,840 96,780 96,450 2,260 2,650 2,650 2.2 2.7 2,7
MAINE 690,300 682,800 668,100 667,400 654,500 645,000 22,900 28,300 23,100 3.3 4.1 3.5
UNITED STATES (000) 141,119 140,666 139,336 134,800 134,395 132,769 6,319 6,271 6,567 4.5 4.5 4.7
See page 2 for footnotes1 through4 and source.
Area Analyst's Corner
Central AreaKen Bridges (207) 624-5199
L.L. Bean is hiring 650 to 750 temporary seasonal workers
for its Waterville customer service facility. The company
plans to keep 150 to 200 of these workers year round
after the Christmas season. ♦Augusta is studying the
feasibility of a second industrial park.+DucktrapRiver Fish Farm in Belfast has doubled the size of its
production plant to keep up with growing demand.
The company currently employs 155, up from 75
five years ago.
Western AreaGerard Dennison (207) 783-5314
Etonic World Wide Corp. will close its
golf shoe manufacturing plant in Rich
mond in September putting about 30
people out of work. The company laid off
66 people earlier this year.^MBNA in
Farmington is scheduled to open a new call
center in late August, employing 150 full-
and part-time workers by the end of 1999
♦The ownership of the American Skiing1Company in Newry has been reorganized. Oak Hill Capital
Partners of Westchester County, New York, purchased $150million of preferred stock, and now owns 48.5 percent of the
stock making it the company's largest single investor.
North/East AreaCraig Holland (207) 941-3076
Moose Creek Lumber, which just began
operations in Ashland, currently employs 14
workers and, when fully operational, antici
pates a workforce of 50 people. ♦HydroBlend, a company that manufactures dry
batter mixes for the food products industry, is
nearing the start-up phase at Loring
Commerce Center in Limestone. The Idaho
based business expects to eventually
employ 30. ♦Circuit City, a national
chain specializing in electronics, is
nearing completion of a 28,500
square foot store near the BangorMall, with a fall opening antici
pated.
Southern AreaEva Smith (207) 775-5891
A new technique to replenish the local supply of babyclams is being considered by the Town of Eliot. The project has
long-term potential for commercial harvesting. ♦ApplicatorsSales and Service Inc., a manufacturer of vinyl replacementwindows, will be moving from Portland to Biddeford's new Exit 4
Business Park. Plans include an 80,000 square-foot plant and a
30,000 square-foot warehouse. Current employment levels will be
maintained, and creation of up to 50 new jobs is expected during
the next three years. ♦ The South Portland Planning Board has
approved two new building projects for the Maine Mall area.
Labor Market Information Services
Genera
ted o
n 2
01
5-1
1-1
8 1
6:3
8 G
MT /
htt
p:/
/hd
l.hand
le.n
et/
20
27
/coo.3
19
24
08
28
38
10
7C
reati
ve C
om
mons
Zero
(C
C0
) /
htt
p:/
/ww
w.h
ath
itru
st.o
rg/a
ccess
_use
#cc
-zero

4 Maine Labor Market Digest
Civilian Labor Force, Employed, and Unemployed in Maine, Seasonally Adjusted (in thousands)
ITCi J 1999 199811bM
Jul Jun May Apr Mar Feb Jan Dec Nov Oct Sep Aug Jul
Civilian Labor Force 670.2 668.5 668.1 663.0 662.8 663.8 660.5 664.7 662.2 658.6 653.1 650.4 648.6
Employed 642.3 639.1 639.4 639.4 640.2 641.8 637.7 639.5 635.5 630.1 624.7 621,4 619.8
Unemployed 27.9 29.4 28.7 23.6 22.6 22.0 22.8 25.2 26.7 28.5 28.3 28.9 28.8
Unemployment Rate (%) 4.2 4.4 4.3 3.6 3.4 3.3 3.5 3.8 4.0 4.3 4.3 4.4 4.4
1See page 2 for footnotes 1 through 4 and source.
Nonf arm Wage and Salary Employment in Maine, Seasonally Adjusted1 p. i
1999 1998
4
INDUSTRYJul Jun May Apr Mar Feb Jan Dec Nov Oct Sep Aug Jul
Nonfarm Wage and Salary Employment2 583.7 583.8 581.6 581.4 580.8 579.9 578.6 577.1 576.1 574.7 573.0 570.2 570.0
Construction 26.9 26.9 27.3 27.4 26.7 26.6 26.2 25.1 25.0 25.1 25.1 25.0 24.9
Manufacturing 84.7 84.9 84.7 84.6 85.7 86.4 86.6 85.4 85.9 85.9 86.9 86.2 86.5
Durable Goods 42.3 42.0 42.2 42.2 42.7 42.9 43.0 42.5 42.6 42.5 42.2 42.2 42.3
Nondurable Goods 42.4 42.9 42.5 42.4 43.0 43.5 43.6 42.9 43.3 43.4 44.7 44.0 44.2
Transportation and Public Utilities 24.4 24.3 24.4 24.1 24.2 24.2 24.2 24.0 23.9 23.9 23.6 23.6 23.6
Wholesale Trade 26.8 27.1 27.1 27.2 27.1 27.1 27.0 27.0 27.1 27.1 26.9 26.8 26.8
Retail Trade 118.6 119.1 118.8 118.3 118.7 117.8 118.2 119.1 119.1 118.1 117.0 116.2 115.4
Finance, Insurance, and Real Estate 30.9 31.1 31.1 31.0 30.7 30.8 30.7 30.3 30.2 30.0 29.7 29.7 30.0
Services 176.5 176.1 174.5 174.5 173.2 172.7 172.1 172.5 171.9 171.4 170.4 169.1 169.0
Government 94.8 94.2 93.6 94.2 94.4 94.2 93.5 93.6 92.9 93.1 93.3 93.5 93.7
1 See footnotes1 and 2 on page6. 1 Miningemploymentis notsuitabletor seasonaladjustmentbecauseit has very littleseasonaland irregularmovement.Thus,the not-
seasonally-adjustedseries is usedas a componentof the seasonallyadjustedtotal nonfarmwageand salaryemploymentestimate.Source:See page2.
July Unemployment Rate Fell to 4.2 Percent
State Labor Commissioner Valerie Landry announced
that the seasonally-adjusted unemployment rate for
Maine fell slightly to 4.2 percent in July from 4.4 percent
in June.
The seasonally-adjusted unemployment rate also
declined over the past year, from 4.4 percent in July 1998
to the current rate of 4.2 percent, as job opportunities
continued to expand.
Between July 1998 and July 1999 the number of
seasonally-adjusted nonfarm wage and salary jobs
increased by 13,700 to 583,700. Contributing to the over-
the-year increase in nonfarm wage and salary jobs were
gains in services; retail trade; construction; government;and finance, insurance, and real estate.
Other New England states reporting seasonally-adjustedJuly unemployment rates include New Hampshire, 2.5
percent, and Vermont, 3.1 percent. The adjusted national
rate for July was 4.3 percent.
In Maine the not-seasonally-adjusted unemployment rate
for July was 3.3 percent, down from 4.1 percent in Juneand 3.5 percent in July 1998. The unadjusted national
rate was 4.5 percent in July, unchanged from June, and
down from 4.7 percent in July 1998. Not-seasonally-
adjusted July unemployment rates for Maine counties
Unemployment Rates, Seasonally Adjusted
=> 3%
U.S. NewEngland Maine
J A
1998s 0 N D J F
1999
M A M J J
ranged from 1 .8 percent in Lincoln County to 6.8 percentin Washington County.
Not-seasonally-adjusted nonfarm wage and salary
employment fell by 5,300 between June and July as a
result of normal temporary plant shutdowns in
manufacturing industries and seasonal reductions ofnonprofessional workers in local schools. Partially
offsetting these temporary losses were seasonal gains by
lodging services and eating and drinking places.
Between July 1998 and July 1999, not-seasonally-
adjusted nonfarm wage and salary jobs increased by14,200. Services rose by 7,500, mainly in social services,
business services, health services, and other services.
Labor Market Information Services
Genera
ted o
n 2
01
5-1
1-1
8 1
6:3
8 G
MT /
htt
p:/
/hd
l.hand
le.n
et/
20
27
/coo.3
19
24
08
28
38
10
7C
reati
ve C
om
mons
Zero
(C
C0
) /
htt
p:/
/ww
w.h
ath
itru
st.o
rg/a
ccess
_use
#cc
-zero

Maine Labor Market Digest 5
Selected Regular Unemployment Compensation Program Indicators
Key Data
Average Duration
Average Weekly Benefit Amount*
Exhaustees
July 1999
13.2
$186.27
839
*For totallyunemployedclaimants,excludingdependencyallowances.
Weekly Initial Claims
Week 8/7 7/31 7/24 7/17 7/10 7/3 6/26
1999 868 1,143 1,230 1,006 1,201 1,088 1,106
Week 8/8 8/1 7/25 7/18 7/11 7/4 6/27
1998 1,302 1,213 1,306 1,368 1,068 1,225 1,293
June 1999
13.3
$188.25
939
July 1998
16.5
$137.34
1,236
Continued Claims Less Partials*
July 1999 June 1999 July 1998
4,726 5,428 8,469*
For the week including the 12lh of the month.
Monthly Unemployment Insurance Trust Fund Balance
S240
Retail trade rose by 3,500, with the largest gains in foodstores, auto sales and services, general merchandisestores, and eating and drinking places. Construction;
government; finance, insurance, and real estate; and
transportation and public utilities also recorded jobgrowth. Manufacturing jobs fell by 1,800, with losses in
paper and allied products, leather and leather products,lumber and wood products, and electronic and other
electrical equipment.
Unemployment Rates for Maine
22 6%
=5 4%
3':
asonallyAdjusted NolSeasonallyAdjusted
JASONDJFMAMJJ1998 1999
U.S. Consumer Price Indexfor all urban consumers (CPI-U)
Item
(1982-1984 = 100) All Items
July 99 June 99 July 98 Dec 98
166.7 166.2 163.2 163.9
Percent Change from Prior Month +0.3%
Percent Change from 12 Months Ago +2.1%
Percent change from Last December +1.7%
Over-the-Year Change in CPI-U
* iiii.iiiii ' "" "<,,,.
Labor Market Information Services
Genera
ted o
n 2
01
5-1
1-1
8 1
6:3
8 G
MT /
htt
p:/
/hd
l.hand
le.n
et/
20
27
/coo.3
19
24
08
28
38
10
7C
reati
ve C
om
mons
Zero
(C
C0
) /
htt
p:/
/ww
w.h
ath
itru
st.o
rg/a
ccess
_use
#cc
-zero
6 Maine Labor Market Digest
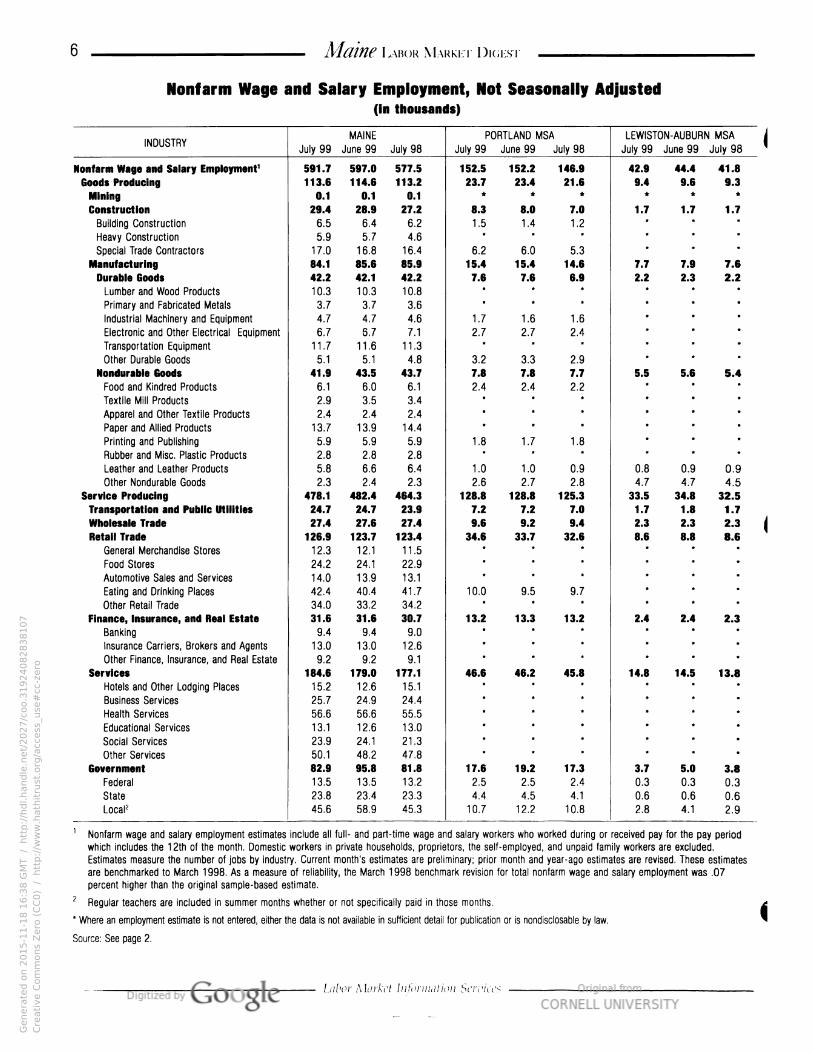
Nonffarm Wage and Salary Employment, Not Seasonally Adjusted(in thousands)
INDUSTRYMAINE
June 99
PORTLAND MSA
July 99 June 99 July 98
LEWISTON-AUBURN MSA
July 99 June 99 July 98July 99 July 98
Nonfarm Wage and Salary Employment1 591.7 597.0 577.5 152.5 152.2 146.9 42.9 44.4 41.8
Goods Producing 113.6 114.6 113.2 23.7 23.4 21.6 9.4 0.0 0.3
Mining 0.1 0.1 0.1 • * * * • •
Construction 29.4 28.9 27.2 8.3 8.0 7.0 1.7 1.7 1.7
Building Construction 6.5 6.4 6.2 1.5 1.4 1.2ft « ■
Heavy Construction 5.9 5.7 4.6• • * ft • ■
Special Trade Contractors 17.0 16.8 16.4 6.2 6.0 5.3ft • •
Manufacturing 84.1 85.6 85.9 15.4 15.4 14.6 7.7 7.0 7.0Durable Goods 42.2 42.1 42.2 7.6 7.0 6.9 2.2 2.3
Lumber and Wood Products 10.3 10.3 10.8• • a • •
Primary and Fabricated Metals 3.7 3.7 3.6• • » * * *
Industrial Machinery and Equipment 4.7 4.7 4.6 1.7 1.6 1.6• * •
Electronic and Other Electrical Equipment 6.7 6.7 7.1 2.7 2.7 2.4• * •
Transportation Equipment 11.7 11.6 11.3* ■ * • * *
Other Durable Goods 5.1 5.1 4.8 3.2 3.3 2.9* • •
Nondurable Goods 41.9 43.5 43.7 7.8 7.0 7.7 5.5 5.0 5.4
Food and Kindred Products 6.1 6.0 6.1 2.4 2.4 2.2* • •
Textile Mill Products 2.9 3.5 3.4* • * • • •
Apparel and Other Textile Products 2.4 2.4 2.4* * * • • ■
Paper and Allied Products 13.7 13.9 14.4* 4 • * • *
Printing and Publishing 5.9 5.9 5.9 1.8 1.7 1.8• • •
Rubber and Misc. Plastic Products 2.8 2.8 2.84 * * * •
Leather and Leather Products 5.8 6.6 6.4 1.0 1.0 0.9 0.8 0.9 o.g
Other Nondurable Goods 2.3 2.4 2.3 2.6 2.7 2.8 4.7 4.7 4.5Service Producing 478.1 482.4 464.3 128.8 128.8 125.3 33.5 34.8 32.5
Transportation and Public Utilities 24.7 24.7 23.9 7.2 7.2 7.0 1.7 1.8 1.7Wholesale Trade 27.4 27.6 27.4 9.6 0.2 9.4 2.3 2.3 2.3Retail Trade 126.9 123.7 123.4 34.6 33.7 32.6 8.6 8.8 8.0
General Merchandise Stores 12.3 12.1 11.5* * * • • *
Food Stores 24.2 24.1 22.9* • * • • •
Automotive Sales and Services 14.0 13.9 13.1* ■ * ■ •
Eating and Drinking Places 42.4 40.4 41.7 10.0 9.5 9.7* • »
Other Retail Trade 34.0 33.2 34.2* • • * * •
Finance, Insurance, and Real Estate 31.6 31.6 30.7 13.2 13.3 13.2 2.4 2.4 2.3
Banking 9.4 9.4 9.04 • * • ■ ■
Insurance Carriers, Brokers and Agents 13.0 13.0 12.6* * * * »
Other Finance, Insurance, and Real Estate 9.2 9.2 9.1* • * * • •
Services 184.6 179.0 177.1 46.6 46.2 45.8 14.8 14.5 13.8Hotels and Other Lodging Places 15.2 12.6 15.1
* * ft • • •
Business Services 25.7 24.9 24.4* * « * * ■
Health Services 56.6 56.6 55.5m • • • * ft
Educational Services 13.1 12.6 13.0* ■ ft • • ■
Social Services 23.9 24.1 21.3ft • ft * ft
Other Services 50.1 48.2 47.8• • * • * •
Government 82.9 95.8 81.8 17.6 19.2 17.3 3.7 5.0 3.8
Federal 13.5 13.5 13.2 2.5 2.5 2.4 0.3 0.3 0.3
State 23.8 23.4 23.3 4.4 4.5 4.1 0.6 0.6 0.6
Local2 45.6 589 45.3 10.7 12.2 10.8 2.8 4.1 2.9
1Nonfarm wage and salary employment estimates include all full- and part-time wage and salary workers who worked during or received pay for the pay period
which includes the 12th of the month. Domestic workers in private households, proprietors, the self-employed, and unpaid family workers are excluded.
Estimates measure the number of jobs by industry. Current month's estimates are preliminary; prior month and year-ago estimates are revised. These estimates
are benchmarked to March 1998. As a measure of reliability, the March 1998 benchmark revision for total nonfarm wage and salary employment was .07
percent higher than the original sample-based estimate.
2Regular teachers are included in summer months whether or not specifically paid in those months,
*Where an employmentestimateis not entered,eitherthe data is not availablein sufficientdetailfor publicationor is nondisclosableby law.
Source: See page 2.
Labor Market Information Services
Genera
ted o
n 2
01
5-1
1-1
8 1
6:3
8 G
MT /
htt
p:/
/hd
l.hand
le.n
et/
20
27
/coo.3
19
24
08
28
38
10
7C
reati
ve C
om
mons
Zero
(C
C0
) /
htt
p:/
/ww
w.h
ath
itru
st.o
rg/a
ccess
_use
#cc
-zero

Maine Labor Market Digest 7
Earnings and Hours of Production Workers in Manufacturing Industries1
Not Seasonally Adjusted
AREA AND INDUSTRY
AVERAGE WEEKLY
EARNINGS
July 99 June 99 July 98
AVERAGE WEEKLY
HOURS
July 99 June 99 July 98
AVERAGE HOURLY
EARNINGS
July 99 June 99 July 98
ANNUAL AVERAGE
HOURLY EARNINGS
1998 1997 1996
STATEWIDE
Manufacturing S554.21 S563.29 $545.29 39.9 40.7 39.6 $13.89 $13.84 S13.77 $13.50 $13.12 $12.71
Durable Goods 535.11 541.31 530.55 40.6 41.8 40.5 13.18 12.95 13.10 12.99 12.72 12.23
Lumber and Wood Products 454.37 451.54 435.34 43.9 42.8 41.5 10.35 10.55 10.49 10.45 10.32 10.10
Primary and Fabricated Metals 514.14 531.53 523.93 41.0 42.9 43.3 12.54 12.39 12.10 12.33 11.55 11.31
Industrial Machinery and Equipment 640.14 656.12 635.01 44.3 46.5 45.1 14.45 14.11 14.08 14.33 14.66 14.17
Electronicand Other Electric Equipment 510.94 516.47 465.24 42.9 44.6 38.9 11.91 11.58 11.96 11.48 11.13 10.94
Transportation Equipment 624.53 639.23 674.63 34.6 37.1 37.5 18.05 17.23 17.99 17.60 16.77 15.49
Other Durable Goods 438.10 432.95 429.95 39.9 40.5 40.6 10.98 10.69 10.59 10.40 10.27 10.08
Nondurable Goods 576.14 586.77 561.44 39.3 39.7 38.8 14.66 14.78 14.47 14.04 13.50 13.17
Food and Kindred Products 336.36 378.81 402.04 39.9 36.6 39.3 8.43 10.35 10.23 10.00 9.85 10.00
Textile Mill Products 474.90 454.02 416.23 42.9 41.2 37.6 11.07 11.02 11.07 10.49 9.97 10.27
Apparel and Other Textile Products 352.59 387.89 358.72 36.5 39.3 37.8 9.66 9.87 9.49 9.57 9.52 9.00
Paper and Allied Products 876.26 887.26 831.34 39.4 40.7 40.2 22.24 21.80 20.68 20.23 19.44 18.84
Leather and Leather Products 363.85 389.46 329.76 38.3 40.4 36.0 9.50 9.64 9.16 9.31 8.88 8.71
Other Nondurable Goods 497.25 503.61 473.69 39.0 39.1 38.7 12.75 12.88 12.24 12.12 11.65 11.20
PORTLAND MSA
Manufacturing 461.42 495.50 471.09 42.1 42.9 41.0 10.96 11.55 11.49 11.86 11.28 11.22
LEWISTON-AUDURN MSA
Manufacturing 507.09 518.75 498.17 40.6 41.5 40.7 12.49 12.50 12.24 11.40 11.13 11.13
Hours worked and earningsdata are computedbased on payrollfiguresfor the week includingthe 12th of the monthfor manufacturingproductionworkers.Averagehourly
earningsare calculatedon a gross basis,and includesuch factors as premiumpay for overtimeand shift differential,as well as changesin basic hourlyand incentiveratesof
pay.Averageweeklyearningsare the productof weekly hours worked and hourlyearnings.
Source: See page 2.
Nonfarm Employment by Sector
January 1984-July 1999, Maine1
Hours Worked by Manufacturing
Production Workers, Maine2580
480
35380
a.280E
LU
180
80
Service-Producing Goods-Producing
Nonfarm Employment by Industry Division
Maine, July 19992
JASONDJFMAMJJ1998 1999
Nonfarm Employment by Industry Division
Maine, Over-the-Year Change, July 19992
V J 4?// /SeasonallyAdjusted.
2NotSeasonallyAdjusted.
Labor Market Information Services
Genera
ted o
n 2
01
5-1
1-1
8 1
6:3
8 G
MT /
htt
p:/
/hd
l.hand
le.n
et/
20
27
/coo.3
19
24
08
28
38
10
7C
reati
ve C
om
mons
Zero
(C
C0
) /
htt
p:/
/ww
w.h
ath
itru
st.o
rg/a
ccess
_use
#cc
-zero

8 Maine Labor Market Digest
Seasonal Adjustment Makes Labor Market Trends Easier to Follow
Over the course of a year, the levels of
employment and unemployment undergosharp fluctuations due to seasonal events suchas changes in weather, reduced or expandedproduction, harvests, major holidays, and the
opening and closing of schools.
These seasonal fluctuations make it difficult to
track trends in employment and unemployment from month to month. Because these
seasonal events follow a more or less regular
pattern each year, their influence on statistical
trends can be eliminated by mathematicallyadjusting the statistics from month to month in
an effort to remove these seasonal patterns.
These adjustments make it easier to observethe longer-term trends and other nonseasonalmovements in the monthly data.
The two seasonally-adjusted Maine labormarket data series are the civilian labor forceestimates, including total employment, unemployment, and the unemployment rate; and the
nonfarm wage and salary employment esti
mates (see tables on page 4). Unadjusted, both
unemployment and the two measures of
employment have a highly seasonal pattern in
Maine. Peaks in unemployment occur in the
winter and lows occur in summer or early fall.
Employment estimates display the reverse
pattern.
The graph below presents seasonally-adjusted (
and unadjusted nonfarm wage and salary jobsfor Maine from January 1998 through August1 999. The number of unadjusted nonfarm jobshas its ups and downs during the course of a
year, peaking in the fall. At that time,
construction jobs reach the highest level for the
year, job in tourist-related industries start to fall
but remain high relative to winter months, and
schools are back in session resulting in highergovernment employment.
Adjusting for seasonally yields a more visible
long-run trend. For example, while the numberof unadjusted jobs dropped substantiallybetween November 1998 and January 1999due to seasonal influences, there was a
seasonally-adjusted gain of 2,500. Between
January 1998 and August 1999 adjustednonfarm jobs have been increasing steadily,extending a trend that started in 1992.
Nonfarm Wage and Salary Jobs in Maine
(.no
_c 580o
5 560
E
Z 540
r,2()
Not seasonallyadjusted Seasonallyadjusted
|an1998
Apr lulv Oct |an1W
Apr lulv
If you do NOT desire to continue receiving this publication, check here (-J* and return this cover to the address below.
If your address has changed, please indicate change and return this cover to the address below.
Maine Department of LaborLabor Market Information Services , —~~
20 Union Street ■ , * '■._■
Augusta, Maine 04330-6826 » r '
OFFICIAL BUSINESS
PENALTY FOR PRIVATE USE $300RETURN SERVICE REQUESTED
MARTIN P. CATHERWOOD LIBRARYINDUS. & LABOR RELATIONS SCHOOLITHACA NY 14853-3901
llllllllllllullllllllllllllllllllllll iiiiiillliltililiiliilil
Genera
ted o
n 2
01
5-1
1-1
8 1
6:3
8 G
MT /
htt
p:/
/hd
l.hand
le.n
et/
20
27
/coo.3
19
24
08
28
38
10
7C
reati
ve C
om
mons
Zero
(C
C0
) /
htt
p:/
/ww
w.h
ath
itru
st.o
rg/a
ccess
_use
#cc
-zero