Embed Size (px)
Citation preview

Printed on recycled paper
About this series...
Abstract
Social Protection & Labor Discussion Papers are published to communicate the results of The World Bank’s work to the development community with the least possible delay. The typescript manuscript of this paper therefore has not been prepared in accordance with the procedures appropriate to formally edited texts.
The findings, interpretations, and conclusions expressed herein are those of the author(s), and do not necessarily reflect the views of the International Bank for Reconstruction and Development / The World Bank and its affiliated organizations, or those of the Executive Directors of The World Bank or the governments they represent. The World Bank does not guarantee the accuracy of the data included in this work. The author(s) attest(s) that the paper represents original work. It fully references and describes all relevant prior work on the same subject.
For more information, please contact the Social Protection Advisory Service, The World Bank, 1818 H Street, N.W., Room G7-803, Washington, DC 20433 USA. Telephone: (202) 458-5267, Fax: (202) 614-0471, E-mail: [email protected] or visit us on-line at www.worldbank.org/sp.
M a r c h 2 0 1 2
Background Paper for the World Bank 2012–2022 Social Protection and Labor Strategy
This paper reviews labor market trends throughout the developing world, identifies issues and policy priorities across groups of countries, and derives implications for the World Bank’s new Social Protection and Labor Strategy. Five key issues are identified: a high and growing share of the labor force that is self-employed or working in household enterprises, exposure to income shocks with limited access to risk management systems, low female participation rates, high youth unemployment rates, and the need to manage migration flows and remittances. The paper then details a three-pronged agenda based on providing incentives and conditions for work, improving the efficiency of job creation, and managing risks /facilitating labor market transitions. This suggests that the Bank should emphasize self-employment and entrepreneurship promotion, provision of skills and development opportunities, and facilitation of labor market transitions into and between jobs, while protecting workers from shocks and paying particular attention to youth.
Labor Markets in Middle and Low Income Countries
Trends and Implications for Social Protection and Labor Policies
Yoonyoung Cho, David Margolis, David Newhouse and David Robalino
D I S C U S S I O N P A P E R NO. 1207
Pub
lic D
iscl
osur
e A
utho
rized
Pub
lic D
iscl
osur
e A
utho
rized
Pub
lic D
iscl
osur
e A
utho
rized
Pub
lic D
iscl
osur
e A
utho
rized
Labor Markets in Low and Middle‐Income Countries: Trends
and Implications for Social Protection and Labor Policies
Background Paper for the World Bank 2012–2022 Social Protection and Labor Strategy
Yoonyoung Cho, David N. Margolis,
David Newhouse and David A. Robalino
March 2012
Abstract
This paper reviews labor market trends throughout the developing world, identifies issues and
policy priorities across groups of countries, and derives implications for the World Bank’s new Social
Protection and Labor Strategy. Five key issues are identified: a high and growing share of the labor
force that is self‐employed or working in household enterprises, exposure to income shocks with
limited access to risk management systems, low female participation rates, high youth
unemployment rates, and the need to manage migration flows and remittances. The paper then
details a three‐pronged agenda based on providing incentives and conditions for work, improving
the efficiency of job creation, and managing risks / facilitating labor market transitions. This suggests
that the Bank should emphasize self‐employment and entrepreneurship promotion, provision of
skills and development opportunities, and facilitation of labor market transitions into and between
jobs, while protecting workers from shocks and paying particular attention to youth.
JEL Codes: O15, O19, J21
Key Words: labor markets, developing countries, cluster analysis, self‐employment,
entrepreneurship, skills, activation, labor market transitions, social protection, youth employment

ACKNOWLEDGMENTS
Victor Eduardo Macias Essedin provided inputs to the sections on entrepreneurship and
youth and Alice Wuermli provided inputs to the section on youth.

TABLE OF CONTENTS
I. INTRODUCTION ............................................................................................................................ 1
II. DEVELOPMENT PATTERNS AND LABOR MARKET OUTCOMES ....................................................... 4
III. WHAT ARE THE CONSTRAINTS TO THE CREATION OF GOOD JOBS? ............................................. 13
3.1 MACROECONOMIC POLICY ............................................................................................................... 14
3.2 INVESTMENT CLIMATE INSTITUTIONS AND INFRASTRUCTURE .................................................................. 15
3.3 LABOR MARKET REGULATIONS AND INSTITUTIONS ................................................................................ 18
3.4 EDUCATION AND SKILLS .................................................................................................................... 21
3.5 SOCIAL PROTECTION ........................................................................................................................ 25
IV. AREAS FOR FUTURE RESEARCH AND POLICY ANALYSIS ............................................................... 28
4.1 BUSINESSES AND JOBS: FROM SELF‐EMPLOYMENT TO ENTREPRENEURSHIP ............................................... 29
4.2 DEVELOPING SKILLS ......................................................................................................................... 33
4.3 ACTIVATING INDIVIDUALS AND FACILITATING LABOR MARKET TRANSITIONS ............................................. 36
4.4 PROTECTING WORKERS .................................................................................................................... 38
4.5 SPECIAL ISSUES REGARDING YOUTH ................................................................................................... 41
V. CONCLUSIONS AND IMPLICATIONS FOR THE BANK’S WORK ON LABOR ...................................... 43
5.1 KNOWLEDGE PLATFORM .................................................................................................................. 44
5.2 IMPACT EVALUATIONS ..................................................................................................................... 45
5.3 DATA, INDICATORS, AND MODELING TOOLS ........................................................................................ 46
5.4 OPERATIONALIZATION OF KEY LABOR MARKET INTERVENTIONS .............................................................. 48
5.5 RETHINKING TRAINING ACTIVITIES ..................................................................................................... 48
APPENDIX 1: CLUSTER ANALYSIS ........................................................................................................ 49
APPENDIX 2: DETAILED STATISTICS FOR EACH CLUSTER ..................................................................... 52
APPENDIX 3: REGIONAL PRIORITIES CONCERNING LABOR MARKETS .................................................. 57
APPENDIX 4: SUMMARY OF THE WORLD BANK’S RECENT STUDIES BY TOPIC ..................................... 58
REFERENCES ...................................................................................................................................... 63

LIST OF FIGURES
Figure 1: Country Groupings by Development Path ..................................................................................... 6
Figure 2: Labor Force and Employment Growth (1990‐1995 to 2005‐2008) .............................................. 8
Figure 3: Productivity, Agriculture Share, and Informality ......................................................................... 10
Figure 4: Youth Unemployment vs Youth Labor Force Growth ................................................................. 12
Figure 5: Tax‐Wedges around the World ................................................................................................... 28
LIST OF TABLES
Table 1: Main Macroeconomic and Labor Market Indicators across Clusters ............................................ 5
Table 2: Challenges – Basic Macroeconomic Indicators ............................................................................. 15
Table 3: Challenges – Business Environment ............................................................................................. 17
Table 4: Challenges – Infrastructure .......................................................................................................... 18
Table 5: Challenges – Labor Market Regulations ....................................................................................... 20
Table 6: Challenges – Skills ......................................................................................................................... 22
Table 7: Challenges – Social Protection ...................................................................................................... 26
1
I. INTRODUCTION
The well‐being of the majority of the world’s population depends critically on workers’ ability to
earn a decent and reliable stream of income. Improving individuals’ livelihoods and earnings
opportunities, to a large extent, is about improving their work opportunities – by helping them
either to increase the returns from their current work or to move from inactivity or low return
occupations into more productive occupations. At the same time, jobs that provide an
adequate standard of living during good times are not enough. Any job is associated with risks:
the risk of being dismissed, the risk of exploitation or abuse, the risk of work injury or disability,
or the risk of a drop in the price of the goods or services sold by a self‐employed person or a
small family business. An agenda to promote good quality employment needs to consider
policies, such as implementing labor regulations or providing insurance, that reduce or mitigate
these risks.
This paper reviews labor market trends throughout the developing world, identifies specific
problems and policy priorities across groups of countries, and derives implications for the Bank’s
work on labor and the new Social Protection and Labor Strategy. The analysis is based on a
sample of 133 middle and low income countries during the last two decades, complemented by
desk reviews of relevant studies in labor economics, including economic sector work produced
by the World Bank. It reviews the evolution of several standard labor market indicators such as
participation, employment/unemployment, and labor productivity growth. For each country,
we also track important determinants of these indicators, including the macroeconomic and
business environment, the level of education of the labor force, and labor regulations and social
insurance laws.
As countries recover from the financial crisis, it is increasingly important for policymakers to
move beyond short term mitigation measures and tackle structural problems that limit workers’
access to productive jobs and formal risk management programs. The global challenge facing
policymakers, particularly in low and middle income countries, is to create more high‐quality
jobs. A large share of the labor force remains employed in low productivity activities in the

2
urban informal sector or in agriculture. Many are self‐employed, work in a household
enterprise without outside workers, or in a family business without pay. Earnings are often
insufficient to pull households out of poverty. Low labor participation rates and high
unemployment are also issues of concern. Women, in particular, are less likely to enter the
labor force, while in many countries a growing number of youth are filling the ranks of the
unemployed. And with the exception of a minority of formal sector workers, most workers are
vulnerable to abuse, poor working conditions, risk of exploitation, and lack of income
protection.
The structural problems that hinder the creation of good jobs vary from country to country.
Many countries are still affected by macroeconomic policies that create uncertainty and/or
regulations that increase the costs of doing business, which reduce incentives to invest in job‐
creating enterprises. The lack of skilled workers, and inappropriate labor regulations and social
insurance policies, are also part of the problem. The importance of each of these factors varies
by country and is not necessarily the same within regions. In low income countries, for instance,
imperfections in labor markets and inadequate labor regulations and social insurance laws tend
to be less important because most workers are in the “unorganized” sector and well‐
functioning labor markets often do not exist. In these settings, the lack of a skilled labor force
and weak basic infrastructure, both of which inhibit innovation and economic diversification,
are more pressing constraints. In middle income countries, although macroeconomic stability
and the skills of the workforce remain important, imperfections in the labor market and
inappropriate regulations and social insurance systems can become binding.
In the context of the new Social Protection and Labor Strategy, the paper identifies three
common objectives for labor policies in middle and low income countries. The first two, more
directly related to the promotion function of the social protection system, focus on (i) providing
incentives and conditions for individuals to work; and (ii) ensuring that enough high‐quality
jobs, both salaried and non‐salaried, are created. These objectives can be promoted through
policies that promote sound macroeconomic and business environments (including labor
regulations), as well as programs that provide direct support to self‐employed workers and

3
small entrepreneurs. The third objective, mainly related to the prevention function, concerns
managing risks and facilitating labor market transitions. This entails reducing the routine risks
that workers face, in part by ensuring that they can smooth consumption in the presence of
income shocks through risk pooling or savings arrangements. There is also a key role for active
labor market programs that facilitate the transition of youth from school to work, and help
adults move from a state of disability, inactivity, or unemployment into productive jobs.
Improving labor market outcomes requires a cross‐sectoral perspective that recognizes the
complementarities and tensions that can exist between different types of policies. For instance,
macroeconomic policies that provide incentives to invest and create jobs also can reduce the
risk of unemployment and provide incentives to work. Similarly, insurance policies that protect
incomes equally can encourage workers to invest in skills and engage in activities that are risky
but offer high returns. Or, activation policies that help individuals transit from inactivity or
unemployment into work can facilitate labor reallocations that help create good jobs in
particular regions or sectors. At the same time, poorly designed policies aimed at reducing
worker risks, such as overly stringent regulations on dismissal procedures, can backfire by
reducing incentives to create quality jobs or incentives to work. Improving our understanding of
how the interactions between different policy interventions affect the behavior of workers and
employers is thus a necessary condition to design more effective social protection systems.1
The paper is organized in four sections. The first describes the analysis of labor market trends
across different types of countries. In the second, we analyze secondary data as well as country
and regional studies to identify constraints that prevent entrepreneurs from starting or
expanding businesses to create jobs, as well as those facing workers to obtain wage and salary
jobs. This analysis is followed by a discussion of five areas where future research and policy
analysis should focus to address major knowledge gaps. The last section concludes and
discusses the operational implications for the Bank’s work on labor.
1 See the Background Paper for the World Bank 2010‐2022 Social Protection and Labor Strategy, “Building Social Protection and Labor Systems, Concepts and Operational Implications” by David A. Robalino, Laura Rawlings, and Ian Walker.
4
II. DEVELOPMENT PATTERNS AND LABOR MARKET OUTCOMES
Traditionally, cross‐country analyses of labor market trends have grouped together countries by
region or income level. This is a natural classification of countries and is appealing in part
because it matches the way operations are organized within the Bank. These classifications can
combine countries that, although geographically close or similar in terms of standards of living,
have important structural differences. When countries’ macroeconomic and labor market
dynamics are different, so too will be their key constraints and policy priorities.2 As a result, it
can become difficult to diagnose and develop policy priorities that apply to all countries within
a region or income group.
The analysis in this section takes a different approach, classifying countries by how similar they
are according to broad demographic, macro, and labor market indicators. The indicators that
determine the groupings were chosen to give a reasonably accurate picture of labor market
activity while maximizing the number of countries for which analysis could be undertaken,
given that missing data is a serious issue for many developing countries.3 Each group contains
countries whose observed labor market changes indicated that they were on a similar
development path, as distinct as possible from the development path of other groups. In this
part of the analysis, we exclude factors that determine labor market outcomes such as the
existence of infrastructure or labor regulations, which are discussed in the next section.
Four groups of countries can be identified, bringing together countries from different regions
and, in some cases, different levels of income.4 The clusters are represented by different
2 Examples of neighboring countries with vastly different labor markets include India and Bangladesh, Brazil and Bolivia, Russia and Tajikistan, Saudi Arabia and Yemen, South Africa and Mozambique, and China and Mongolia. 3 The indicators used are the following: log GNI per capita, percentage change in average years of schooling, percentage population growth, percentage working age population growth, percentage adult population growth, percentage youth population growth, percentage change in total employment, percentage change in adult working population, percentage change in youth working population, percentage change in male working population, percentage change in female working population, percentage change in agricultural employment, percentage change in industrial employment, and percentage change in service sector employment. The baseline period for the analysis was 1995‐1999, and the comparison period was 2005‐2008. The analysis was based on a statistical procedure known as cluster analysis (see Appendix 1 for details). 4 The data used for the cluster analysis are drawn from the ILO‐KILM and WDI databases.

5
columns in Table 1 and different colors in Figure 1. The main characteristics can be summarized
as follows: 5
Table 1: Main Macroeconomic and Labor Market Indicators across Clusters
Type 1: Type 2: Type 3: Type 4:
Middle Income,
Rapid Growth,
Structura l Change
Upper Middle
Income, Aging,
Decl ining Informal i ty
Very Low Income,
Young, Balanced
Employment Growth
Low Income, Young,
Slow Productivi ty
Growth
Ini tia l level (1995‐1999)
GDP per capi ta 1,224 3,406 209 464
$2/day poverty rate 30% 15% 85% 56%
Percentage growth
GDP per capi ta 33% 26% 23% 18%
Labor productivi ty 24% 19% 18% 8%
Total l abor force 21% 15% 30% 29%
Youth l abor force 11% ‐3% 32% 23%
Total employment 21% 16% 30% 31%
Youth employment 13% ‐2% 32% 24%
Changes
$2/day poverty rate ‐8.58 ‐4.23 ‐6.63 ‐11.60
Sel f, unpaid fami ly and
household employment share 0.37 ‐1.33 15.56 ‐2.48
Agricul ture share ‐5.51 ‐2.20 ‐4.08 ‐7.36
Industry share 3.68 0.77 0.96 5.43
Publ ic Sector share ‐0.46 ‐0.51 0.95
Recent level (2005‐2008)
Female l abor force participation 45% 49% 67% 54%
Adult employment to working age
population ratio62% 63% 77% 68%
Youth unemployment rate 21% 21% 10% 18%
Pens ion coverage among working
age population20% 30% 4% 8%
Number of countries avai lable
Tota l 25 23 17 13
Sources: WDI and ILO‐KILM. Notes: Initial level figures refer to the 5‐year average of available data from the period 1995‐1999, while change and growth figures compare initial level average to the 4‐year average of available data from the period 2005‐2008. Data available for all countries in groups 1‐4 and all variables except (Initial poverty rate – Change in poverty rate ‐ Self, unpaid family and household employment share – Public sector share countries available/total countries in group): 20‐15‐10‐5/25 type 1 countries, 17‐11‐17‐12/23 type 2 countries, 9‐4‐1‐0/17 type 3 countries, and 11‐7‐1‐2/13 type 4 countries.
5 The analysis compares average values of available data for the 1995‐1999 period with average values over the 2005‐2008 period. Income levels are based on WDI definitions for 2009: GNI per capita less than USD 995=low income, GNI per capital between USD 996 and USD 3945=lower middle income and GNI per capita between USD 3945 and USD 12195=upper middle income. Detailed statistics for each cluster are provided in Appendix 2.

6
Figure 1: Country Groupings by Development Path
Cluster 1: Middle Income, Rapid Growth, and Structural Change. This cluster consists of
countries where both income per capita and labor productivity have grown rapidly,
moving most into the middle income category. Significant structural changes also have
occurred, with a reallocation of labor away from agriculture and into the industrial
sector. Furthermore, employment growth is in line with labor force growth. Examples of
this cluster include rapidly growing countries like China, India, Armenia, and Kazakhstan,
as well as many countries from the Middle East and North Africa, and Latin America and
the Caribbean.
Cluster 2: Upper Middle Income, Aging, and Declining Informality. The second cluster
includes higher income countries that, while not matching the first cluster, have also
displayed high growth rates in income per capita and labor productivity. Structural
changes from agriculture to industry or services have been less important in this cluster,
but there has been a small shift away from informal employment. Employment growth
is also in line with labor force growth, but the share of youth employed has been
shrinking. These countries include Argentina, Brazil, South Africa and Russia.
Cluster 3: Very Low Income, Young, and Balanced Employment Growth. Countries in
the third cluster are the poorest in the sample. Growth in income per capita and labor
productivity was solid, in line with a shift of employment out of agriculture into the
service sector. There are no major imbalances between labor force and employment

7
growth despite a rapid increase in the number of youth in the labor market. At the same
time, the share of self, unpaid family, and household employment has experienced a
large increase, suggesting an insufficient number of good jobs. This cluster includes
many African countries such as Burundi, Ghana, and Malawi, with some poorer
countries from other regions such as Bangladesh, Cambodia, and Tajikistan.
Cluster 4: Low Income, Young, and Slow Productivity Growth. This group of countries is
characterized by slow growth in output and productivity, despite substantial
employment growth and a rapid structural transformation out of agriculture into
industry. These countries demonstrate that substantial employment shifts from
agriculture to industry do not always translate into improved labor productivity. While
the majority of these countries are located in Sub‐Saharan Africa, the cluster also
includes non‐African countries like Nicaragua, Pakistan, and Mongolia.
Cluster 5: Residual Countries. The final group of countries is heterogeneous and has
only one common feature: a lack of available data.6 As a result, we cannot draw
conclusions about any particular development path for these countries.
The rapid expansion of employment, however, masks five important challenges. The first is the
high and growing share of the labor force that is self‐employed or working in household
enterprises, often without pay. These activities absorb over 55 percent of labor force in low
income countries (cluster 4) and close to 85 percent in very low income countries (cluster 3).
This problem is less severe in the case of upper middle income countries (cluster 2) where
informality has been declining, but remains an issue in many middle income countries. Growth
6 Of the 55 countries in this group, no single indicator was available for all of them: the country with the most available data was Georgia with 19 of the 20 variables used for the analysis (missing only the change in the average years of schooling). At the other extreme, Kosovo only had data for the change in the agricultural and industrial shares of employment, while only demographic information (percentage change in the total and youth population, and percentage change in the working age population) was obtainable for North Korea. In fact, much of the data that is available for these countries is drawn from sources in which imputed data is common. The variables that are the most highly represented in group 5 are those related to demographics (typically projections between censuses) and the share of employment in agriculture or industry (drawn from the ILO’s KILM database, which relies on well‐documented imputation techniques (ILO Employment Trends Unit (2010) “Trends Econometric Models: A Review of the Methodology,” http://www.ilo.org/wcmsp5/groups/public/‐‐‐ed_emp/‐‐‐emp_elm/‐‐‐trends/documents/publication/wcms_120382.pdf) when original source data are unavailable). Margolis et al. (2010) demonstrates the importance of this problem and discusses alternative imputation mechanisms that can be used in the developing world in the absence of regularly reported labor market data.

8
in self‐employment is matched by an increasing share of informal wage and salary
employment.7 Although the share of informal employment generally decreases with income,8 it
remains a cause for concern even in higher income countries.9 The majority of these self‐
employed jobs are not productive and generate low earnings, and as a result many of these
workers and their families remain poor (poverty rates in the countries of clusters 3 and 4 are 85
and 56 percent respectively). Moreover, workers in these activities/jobs are typically not
protected by labor regulations and social insurance systems, and therefore remain vulnerable
to abuse and exploitation or fluctuations in incomes. Bringing more employment into the
formal wage and salary sectors while improving the productivity of the self‐employed continues
to be a challenge for many of these governments10 (see Figure 2).
Figure 2: Labor Force and Employment Growth (1990‐1995 to 2005‐2008)
Source: Cho et al., (2011)
Note: blue=East Asia and Pacific, green=Europe and Central Asia, red=Latin
America and the Carribean, yellow=Middle East and North Africa,
orange=South Asia, and gray=Sub‐Saharan Africa.
7 Informality is defined as lack of access to social insurance and/or the failure to pay social security taxes. See Perry et al. (2007), World Bank (forthcoming‐a), World Bank (forthcoming‐b). 8 See Loayza and Rigolini (2006). 9 See Ribe et al. (2010). 10 Flagship reports in the LAC, MENA, and ECA regions investigate the issues related to informality and discuss policy options ranging from institutional reforms to skills development for marginalized workers. See Perry et al. (2007) for LAC, World Bank (forthcoming‐a) for MENA, and World Bank (forthcoming‐b) for ECA.
-.2
0.2
.4.6
-.2
0.2
.4.6
-.2 0 .2 .4 .6 -.2 0 .2 .4 .6
Country type 1 Country type 2
Country type 3 Country type 4
Em
plo
ymen
t gro
wth
Labor force growth

9
High rates of self‐employment are explained in part by the important role that agriculture still
plays as a source of jobs, particularly in low income countries. The share of agricultural
employment has been declining across the board, but in some cases only slowly. In very low
income countries, 38 percent of workers are employed in agriculture. In countries such as
Liberia, Sierra Leone, or the Central African Republic, over 50 percent of all employment is in
agriculture. Countries in cluster 4, which tend to be slightly wealthier than those in cluster 3,
experienced significantly faster shifts out of agricultural employment. Even in this cluster,
however, agriculture still accounts for 22 percent of all jobs.
While higher labor productivity and earnings will require a reallocation of jobs out of agriculture
and the unorganized sector, the type of reallocation matters. Indeed, the relationship between
productivity growth and changes in the sectoral allocation of employment varies across clusters.
In the second cluster, for example, higher productivity growth is strongly associated with a
reduction in both the shares of agricultural and self‐employment (see Figure 3), which suggests
that the structural transformations taking place in these countries are leading to productivity
gains and higher quality jobs. In cluster 1, however, increased productivity growth is strongly
associated with an increase in self‐ and family employment, despite a similar negative
relationship between productivity growth and agricultural employment. Meanwhile, in clusters
3 and 4, the association between productivity growth and shifts out of agricultural employment
is weaker, again implying that movement out of agriculture alone in these lower income
countries is not sufficient to raise productivity. In brief, the right type of structural
transformation is not easy to achieve and will not happen overnight. Interventions that increase
productivity and access to social protection for workers in the agricultural and “unorganized
sector” are therefore key priorities for countries with large numbers of workers in these
sectors.11
11 See Fox and Gaal (2010); World Bank (2010g).

10
Figure 3: Productivity, Agriculture Share, and Informality
Note: blue=East Asia and Pacific, green=Europe and Central Asia, red=Latin America and the Carribean, yellow=Middle East and North Africa, orange=South Asia, and gray=Sub‐Saharan Africa.
The high share of employment outside the formal sector is also correlated with high exposure
to income shocks and limited access to risk management systems. It is estimated that less
than 20 percent of the world’s labor force has access to social security. Even in cluster 1
countries, only 30 percent of the labor force is covered. The situation is even more dramatic in
clusters 3 and 4, where less than 10 percent of labor force is covered by public pensions –
mainly civil servants and a small contingent of formal workers in the private sector. Not
surprisingly, coverage rates across countries are strongly correlated with income and region.
Low income workers and the poor, especially those living in rural areas, are much less likely to
be covered.12 But even those who are covered are not covered all the time. Data for some
countries in cluster 2, for instance, show that there are frequent movements in and out of the
social security – these reflect transitions between formal and informal employment, and
employment and unemployment. On average, workers only contribute during half of their
active life; low income workers have lower contribution densities.13
Low female participation rates, which drive adult employment rates down and keep an
important source of human capital idle, are another major issue facing the majority of low and
middle income countries. The participation of women in the labor market is particularly low in
12 See Ribe et. al. (2010); Holzmann et al. (2009). 13 See Levy (2008); Forteza (2010).
-.5
0.5
1-.
50
.51
-20 -10 0 10 -20 -10 0 10
Country type 1 Country type 2
Country type 3 Country type 4
Pro
duct
ivity
gro
wth
Growth in agriculture share
-.5
0.5
1
-10 0 10 -10 0 10
Country type 1 Country type 2
Pro
duct
ivity
gro
wth
Change in share of informal sector

11
middle income countries (45% in cluster 1 and 49% in cluster 2). The lowest rates are observed
in the Middle East and North Africa, which averaged 26.8 percent over the 2005‐2008 period.
Participation rates tend to be higher in low income countries in part because minimal
household earnings force more women to work. In fact, close to 70 percent of women are
active in very low income countries, even though they often work in household enterprises
without pay. In Tanzania, for instance, 70 percent of women work in agriculture and among
those in non‐agricultural activities, 43 percent work in household enterprises without outside
workers and 30 percent as unpaid family workers.
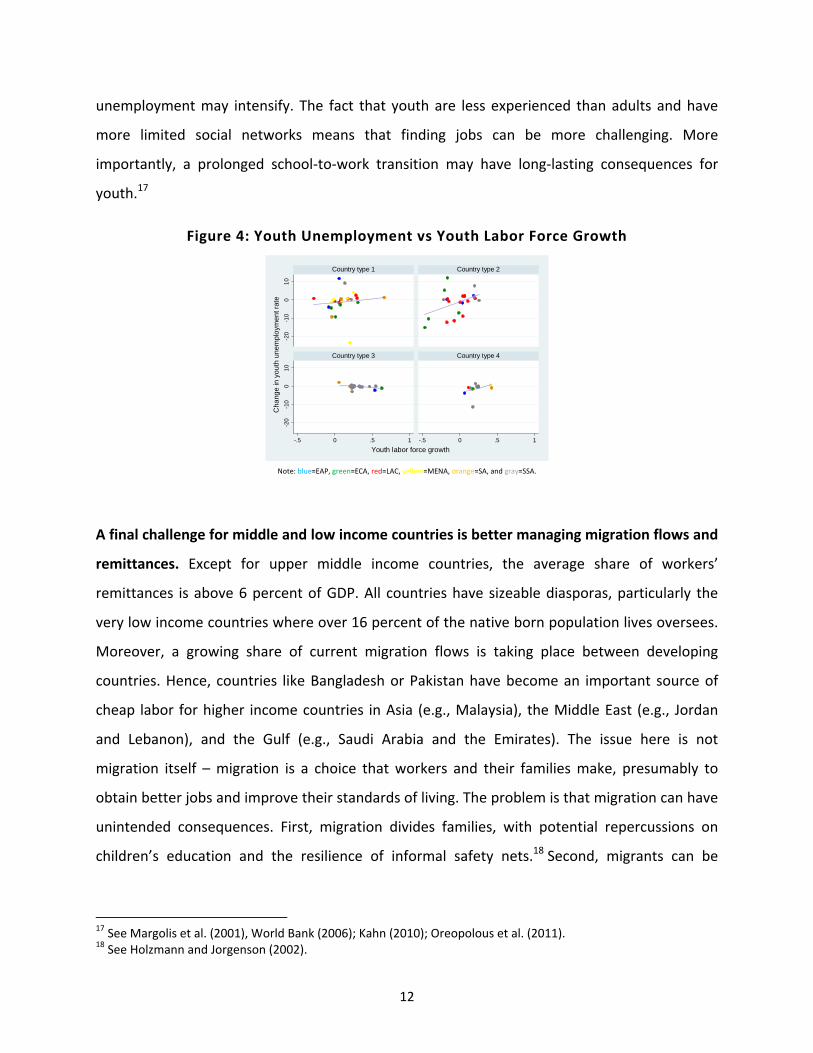
High youth unemployment rates also pose a severe challenge in many countries. As in the case
of low female participation rates, youth unemployment tends to be higher in middle income
countries, but there is considerable heterogeneity and only weak linkages to the growth rate of
the youth labor force (see Figure 4). 14 Youth unemployment is particularly high in the Middle
East and North Africa region where it averages 26.5 percent. It ranges from 17.0 percent in
Morocco to 37.5 percent in Iraq. In other regions, countries with high youth unemployment
rates include Indonesia (28 percent youth unemployment rate) and South Africa (40 percent).
The latter is a legacy of apartheid that calls for serious attention, as it is unusually high and long
term, with a large number of discouraged nonparticipants.15 More recently, the great recession
highlighted the vulnerability of youth employment in many cluster 2 countries.16
In low income countries, youth employment rates tend to be lower but remain a serious
concern. While the youth unemployment rate is low in the very low income cluster 3, the youth
labor force has been growing very rapidly (32 percent on average). Although youth may be
finding work in these countries, they are often forced to take low‐quality and low‐productvity
jobs. In cluster 4 countries, the youth unemployment rate is considerably higher (18 percent),
close to the level observed in middle income countries. As the share of youth in the labor force
continues to increase in both sets of low income countries, the problem of youth
14 Serbia, for example, saw its youth labor force shrink by 16 percent, while youth unemployment grew by 12 percentage points. 15 See Lam (2008); Levinsohn and Pugatch (2011). 16 See Cho and Newhouse (2011). Their analysis covers many of type 2 countries such as South Africa, Bulgaria, Lithuania, Turkey, Argentina, Brazil, Chile, Costa Rica, and Mexico.
12
unemployment may intensify. The fact that youth are less experienced than adults and have
more limited social networks means that finding jobs can be more challenging. More
importantly, a prolonged school‐to‐work transition may have long‐lasting consequences for
youth.17
Figure 4: Youth Unemployment vs Youth Labor Force Growth
Note: blue=EAP, green=ECA, red=LAC, yellow=MENA, orange=SA, and gray=SSA.
A final challenge for middle and low income countries is better managing migration flows and
remittances. Except for upper middle income countries, the average share of workers’
remittances is above 6 percent of GDP. All countries have sizeable diasporas, particularly the
very low income countries where over 16 percent of the native born population lives oversees.
Moreover, a growing share of current migration flows is taking place between developing
countries. Hence, countries like Bangladesh or Pakistan have become an important source of
cheap labor for higher income countries in Asia (e.g., Malaysia), the Middle East (e.g., Jordan
and Lebanon), and the Gulf (e.g., Saudi Arabia and the Emirates). The issue here is not
migration itself – migration is a choice that workers and their families make, presumably to
obtain better jobs and improve their standards of living. The problem is that migration can have
unintended consequences. First, migration divides families, with potential repercussions on
children’s education and the resilience of informal safety nets.18 Second, migrants can be
17 See Margolis et al. (2001), World Bank (2006); Kahn (2010); Oreopolous et al. (2011). 18 See Holzmann and Jorgenson (2002).
-20
-10
01
0-2
0-1
00
10
-.5 0 .5 1 -.5 0 .5 1
Country type 1 Country type 2
Country type 3 Country type 4
Cha
nge
in y
out
h un
emp
loym
ent r
ate
Youth labor force growth
13
exposed to abuse and exploitation in receiving countries.19 Migration management that
benefits both sending and receiving countries is a policy problem that is only now beginning to
receive the serious attention it deserves.
III. WHAT ARE THE CONSTRAINTS TO THE CREATION OF GOOD JOBS?
Ultimately the labor market outcomes discussed in the previous section – the lack of sufficient
formal wage employment and the large share of workers involved in low productivity activities,
vulnerability to income shocks, high youth unemployment rates, low female participation rates,
and important migration flows – depend on decisions by entrepreneurs to create, expand,
downsize, or close business or establishments; occupational choices made by workers; and the
efficiency of the job‐matching process. Several formal and informal institutions affect these
decisions and labor market dynamics. Much attention, for instance, has been given to the role
of macroeconomic stability, the rule of law, infrastructure, and business regulations in
influencing investment and hiring decisions. Decisions about the creation and expansion of
businesses also depend on the cost of recruiting and paying workers with given skills. Regions
with few skilled workers, where workers do not hold trusted diplomas certifying their skills, or
where labor regulations increase the cost of hiring and dismissing workers will be less likely to
attract investors, particularly those involved in high value added activities. Occupational choices
also play a role at different levels, including the types of skills in which individuals invest and
decisions about accepting formal or informal job offers or moving into self‐employment.20
These decisions can be affected by both labor regulations and the design of mandatory
insurance programs.
19 See Holzmann et al. (2011). 20 These decisions reflect individual preferences and the constraints they face. Many individuals, for instance, might choose to become self‐employed not because it is their vocation but because the number of salaried jobs is small relative to the number of jobseekers. Expectations about the types of jobs and earnings that are available can also affect decisions to invest in education and training. Individuals are less likely to invest in high end skills if they know that the number of jobs available is rationed and the probability of getting one is low – in this case, the expected return to investment in education can be low even if the wage premium itself is very high.

14
In this section we discuss some of the main factors that can contribute to explain current labor
market outcomes in middle and low income countries. We focus on five sets of indicators: (i)
macroeconomic; (ii) the investment climate; (iii) labor market regulations; (iv) skills; and (v)
social insurance policies.21
3.1 Macroeconomic Policy
A stable macroeconomy, balanced budgets, and competitive exchange rates are some of the key
ingredients to promote investments and employment creation. Countries with high inflation,
which creates uncertainty about the real rate of return of different projects, are less likely to
attract investments. Large deficits and high public debt can lead to high interest rates, the
crowding‐out of private investments, and less employment creation. And, an appreciation of
the real exchange rate can affect the competitiveness of export‐oriented sectors and also
reduce investments and employment there.
Comparing macroeconomic indicators suggests qualitative differences across clusters (see Table
2). Type 1 and 2 countries, which are the highest income and among the most productive
countries, have low inflation, succeed in attracting foreign direct investment, and have
relatively high gross capital formation, but on average they are running budget and current
account deficits. Type 4 countries, although facing slightly higher inflation and carrying slightly
more public debt, are running budget surpluses, on average. They are also experiencing a high
level of gross capital formation, albeit primarily of domestic origin as seen by the low level of
foreign direct investment.
Type 3 countries are in a more delicate situation, despite running budget surpluses on average.
These countries have the lowest rate of gross capital formation and are running high current
account deficits. Moreover, their very low levels of foreign direct investment suggest that
access to new innovations/technologies will be limited. This is a risky prospect given that this
cluster contains, on average, the poorest countries. Thus far, relatively low capital formation
and FDI have not appeared to constrain labor productivity growth, which was high in the past.
21 The World Bank refers to these five dimensions as the MILES framework (see Banerji et al. 2008).

15
In the future, however, increases in the capital stock may be needed to enable these countries
to absorb a rapidly growing labor force while maintaining labor productivity growth.
Table 2: Challenges – Basic Macroeconomic Indicators
1. Middle‐Income, Rapid Growth, Structural Change
2. Upper Middle‐Income, Aging, Declining Informality
3. Very Low Income, Young, Balanced Employment Growth
4. Low‐Income, Young, Slow Productivity Growth
GNI per capita 5099 10483 936 1986
Average USD 2/day poverty rate
25 11 77 43
GDP per capita 1679 4305 270 548
Labor productivity 5064 11929 719 1681
Foreign direct investment/GDP
1.84 1.93 0.07 0.19
Source: WDI.
Notes: Figures refer to the 4‐year average of available data from the period 2005‐2008. Data available for all countries in groups 1‐4 and all variables.
red=serious, yellow=moderate and green=mild
3.2 Investment Climate Institutions and Infrastructure
The creation of new jobs depends ultimately on the ability of entrepreneurs to expand existing
businesses or start new ventures. The evidence available today shows that although large firms
tend to account for the majority of jobs in the developed world, 22 this may not be the case in
the developing world.23 Furthermore, new establishments of existing firms and small new firms
(including non‐employers) are responsible for most of the new jobs created.24 Not all of the
newly created firms survive; in fact most do not. Yet, those that do succeed, the “gazelles,”
ultimately become the engines of employment and productivity growth.25 It is this process of
firms’ entry and exit, of job creation and destruction that keeps economies healthy. A business
environment that shortcuts this process by precluding innovation and the creation of new firms
22 See Haltiwanger et al. (2010). 23 See Ayyagari et al. (2011). 24 See Haltiwanger et al. (2010) and Ayyagari et al. (2011). 25 See Haltiwanger et al. (2010).

16
or by making exit and job destruction costly will most likely lead to an inefficient allocation of
resources, stagnant productivity, and slow employment growth.26
Although the relationship between a business friendly environment and job creation is complex,
the empirical evidence typically points to a positive link. For example, a high tax rate can reduce
firms’ profitability and thus discourage entry and future investments.27 The importance of
infrastructure for job creation has been highlighted in numerous BEEPS28 and ICA29 studies.
Other studies shed light on the importance of access to finance,30 deregulation of entry,31 and
governance and corruption32 for job creation.
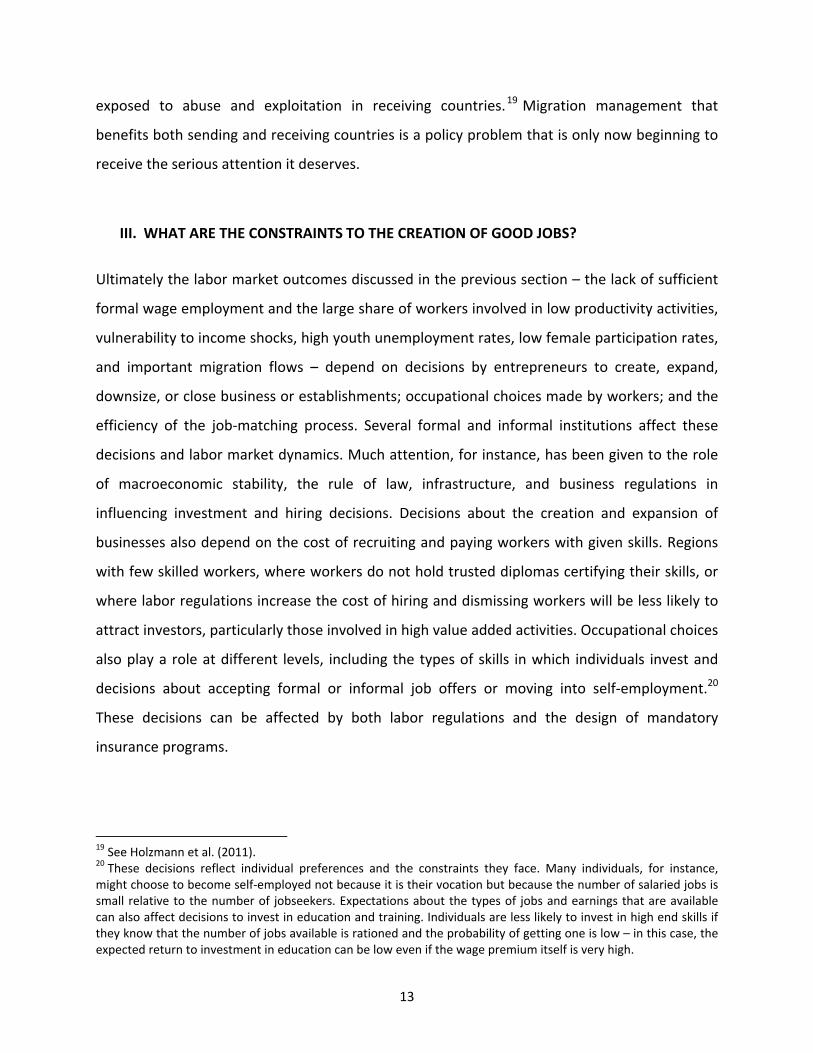
Among the countries in our sample, those in cluster 2 have the most accommodating business
environments, while those in cluster 3 have the worst, particularly when it comes to access to
credit (see Table 3).33 Developing countries in general are very underserved by credit bureaus
and public registries, which provide information on the creditworthiness of borrowers to
lenders and thus facilitate access to credit. These problems are especially relevant in type 3
countries, where on average only 1 in 10,000 people is covered by a private credit bureau and
5.6 out of every 1,000 are covered by a public credit registry. These obstacles to accessing
capital can be a serious constraint to job creation and productive investment.
26 See Haltiwanger et al. (2008). 27 Kolko et al. (2011). 28 The Bank’s Business Environment and Enterprise Performance Surveys (BEEPS) list several key indicators of constraints to doing business including tax rates and administration, corruption and crimes, business licensing, labor regulation, skills of work force, infrastructure such as transportation, water, and electricity, and access to finance and land. 29 Investment Climate Assessments run by the World Bank have tended to focus in the past on administrative conditions for business and infrastructure, as well as issues of access to credit. Examples of this approach are the Investment Climate Assessments in Mongolia, Mozambique, and Ethiopia (types 3, 4, and 5). More recently, however, Investment Climate Assessments in Turkey, Mauritius, Albania, and South Africa (types 1 and 2) move beyond the simple business environment and have begun integrating features discussed in previous sections, such as policies to promote skills development, adoption of new technology, and productivity of microenterprises. 30 Demirgüç‐Kunt and Maksimovic (1998); Galindo and Micco (2005); Ayyagari et al. (2006). 31 Klapper et al. (2004); Branstetter et al. (2010). 32 Fisman and Svensson (2007). 33 For this analysis, the Bank’s investment climate assessments have been used to characterize the business environment based on 8 categories of indicators: macroeconomic stability and trade policy; infrastructure such as transportation, electricity, and communication; access to land and finance; market structure and entry barriers; regulations and licensing; property rights and contract enforcement; security and crime; and local governance and corruption.
17
Table 3: Challenges – Business Environment
1. Middle‐Income, Rapid Growth, Structural Change
2. Upper Middle‐Income, Aging, Declining Informality
3. Very Low Income, Young, Balanced Employment Growth
4. Low‐Income, Young, Slow Productivity Growth
Days to start a business
39 39 39 43
Getting credit: share covered by public registry
8.6 9.5 0.6 3.3
Getting credit: share covered by private bureau
15.7 38.7 0.0 8.0
Number of tax payments per year
37 34 37 47
Years to close business
3.5 2.8 3.4 3.7
Voice and accountability indicator
‐0.5 0.2 ‐0.5 ‐0.5
Political stability and absence of violence indicator
‐0.5 0.0 ‐0.7 ‐0.5
Source: Doing Business.
Notes: Figures refer to most recent year data. Data available for all countries in groups 1‐4 and all variables except getting credit: public registry (missing
for type 2 country Malaysia), getting credit: private bureau (missing for type 1 country Egypt and type 2 country Mauritius) and years to close business
(missing for type 1 country Albania and type 3 countries Burundi, Cambodia, and Rwanda).
Administrative failures associated with long delays in opening or closing a business, or excessive
tax reporting requirements, can also increase transaction costs and reduce incentives to invest.
Often these administrative obstacles appear in the same countries that impose stringent labor
market regulations, further reducing the incentives of firms to create jobs. Procedures for
creating a business and cumbersome tax regulations tend to be particularly problematic in
cluster 4 countries. Procedures to close a business, on the other hand, are a problem across the
board, although cluster 2 countries are relatively less affected.
Weak infrastructure can be an even more serious hurdle to attracting investment and
innovation and inducing employment creation. For example, a lack of readily available
electricity or water can make additional investment much more costly if the new facilities need
to include off‐grid electricity generation. Likewise, an absence of paved roads, railways, or
maintained waterways can make the transportation of goods to market more costly and reduce
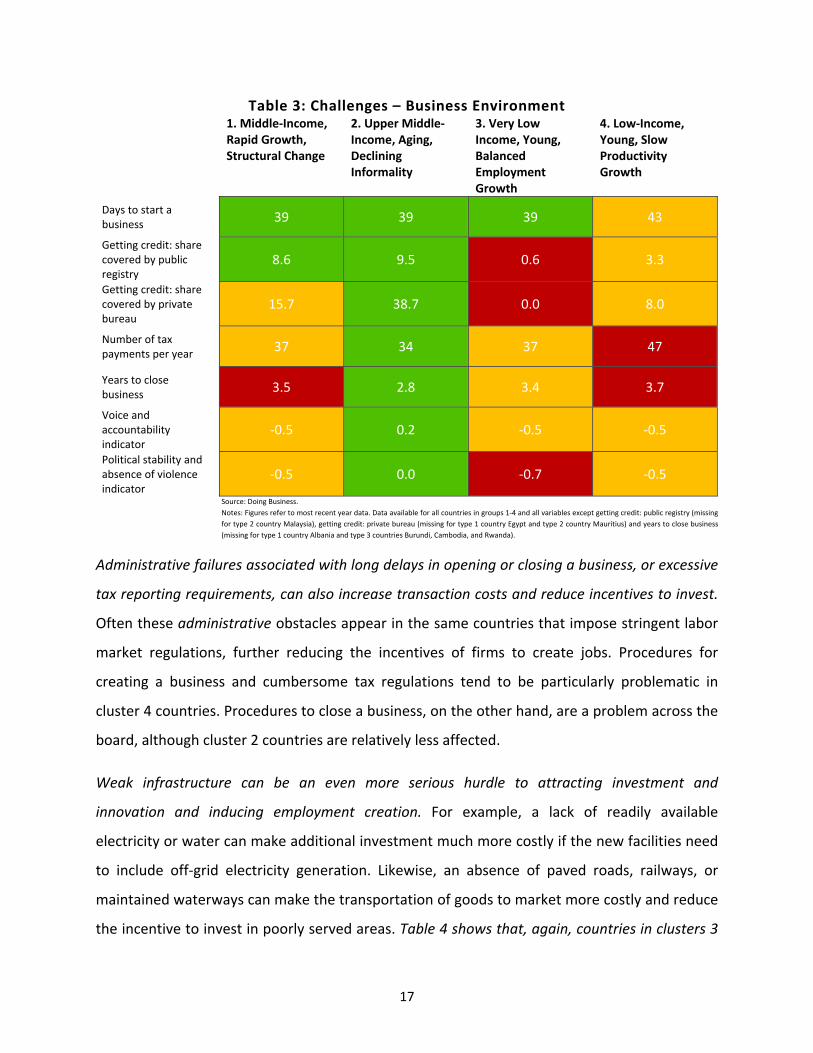
the incentive to invest in poorly served areas. Table 4 shows that, again, countries in clusters 3
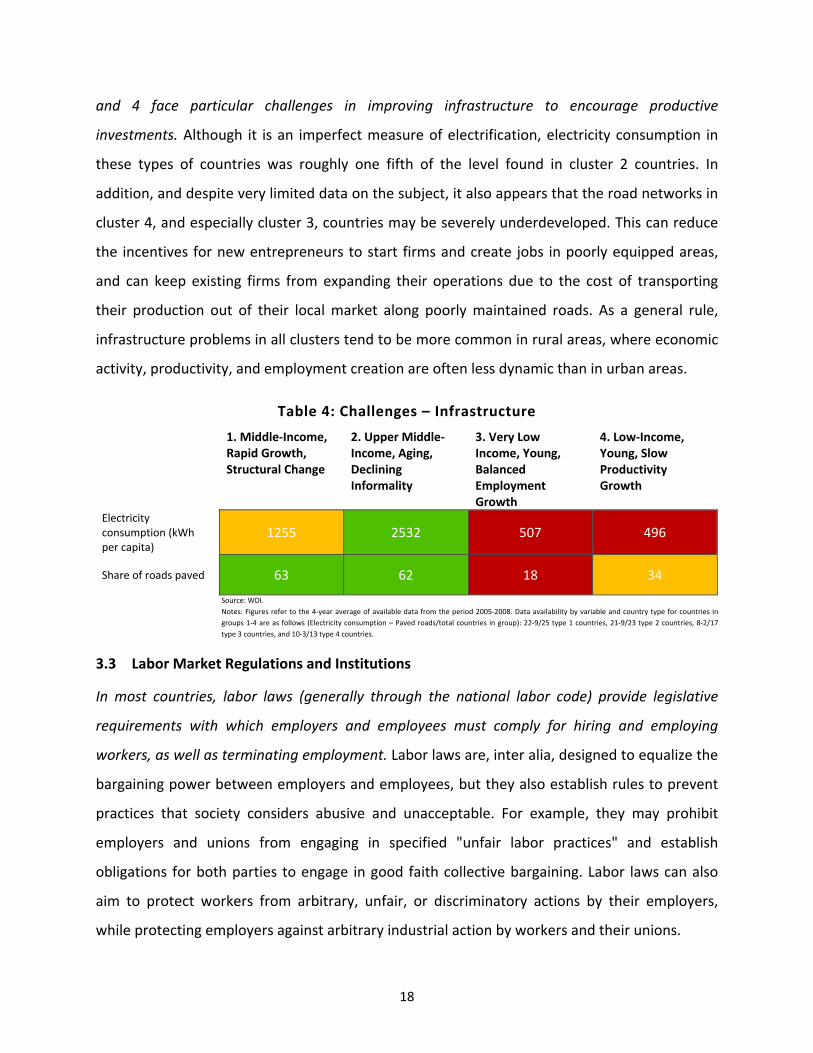
18
and 4 face particular challenges in improving infrastructure to encourage productive
investments. Although it is an imperfect measure of electrification, electricity consumption in
these types of countries was roughly one fifth of the level found in cluster 2 countries. In
addition, and despite very limited data on the subject, it also appears that the road networks in
cluster 4, and especially cluster 3, countries may be severely underdeveloped. This can reduce
the incentives for new entrepreneurs to start firms and create jobs in poorly equipped areas,
and can keep existing firms from expanding their operations due to the cost of transporting
their production out of their local market along poorly maintained roads. As a general rule,
infrastructure problems in all clusters tend to be more common in rural areas, where economic
activity, productivity, and employment creation are often less dynamic than in urban areas.
Table 4: Challenges – Infrastructure
1. Middle‐Income, Rapid Growth, Structural Change
2. Upper Middle‐Income, Aging, Declining Informality
3. Very Low Income, Young, Balanced Employment Growth
4. Low‐Income, Young, Slow Productivity Growth
Electricity consumption (kWh per capita)
1255 2532 507 496
Share of roads paved 63 62 18 34
Source: WDI.
Notes: Figures refer to the 4‐year average of available data from the period 2005‐2008. Data availability by variable and country type for countries in
groups 1‐4 are as follows (Electricity consumption – Paved roads/total countries in group): 22‐9/25 type 1 countries, 21‐9/23 type 2 countries, 8‐2/17
type 3 countries, and 10‐3/13 type 4 countries.
3.3 Labor Market Regulations and Institutions
In most countries, labor laws (generally through the national labor code) provide legislative
requirements with which employers and employees must comply for hiring and employing
workers, as well as terminating employment. Labor laws are, inter alia, designed to equalize the
bargaining power between employers and employees, but they also establish rules to prevent
practices that society considers abusive and unacceptable. For example, they may prohibit
employers and unions from engaging in specified "unfair labor practices" and establish
obligations for both parties to engage in good faith collective bargaining. Labor laws can also
aim to protect workers from arbitrary, unfair, or discriminatory actions by their employers,
while protecting employers against arbitrary industrial action by workers and their unions.

19
The main aspects of labor law include: (i) entry into an employment contract (mandatory
provisions of employment contracts, probation period); (ii) term of employment contract,
including fixed‐term contracts, part‐time employment, and working hours; (iii) paid and unpaid
leave, maternity leave, and family leave; (iv) wages and benefits including minimum wages; and
(v) contract termination, including notification and approval by a third party, advance notice,
mandatory (re)training, and severance payments.
The most frequent issues surrounding labor regulations concern hiring and dismissal
procedures34 and minimum wage policies. Regarding the former, one problem is restrictions on
contractual diversity. Legislation often imposes constraints on the use of fixed‐term contracts,
part‐time contracts, on‐call contracts, zero‐hour contracts, contracts for workers hired through
temporary employment agencies, and freelance contracts, even if these are established
features of modern labor markets in developed countries. In terms of the minimum wage, most
of the problems relate to high levels of discretion in minimum wage setting and adjustment,
which leads to excessive uncertainty, and systems where levels are set without consideration of
worker productivity.35
Across clusters the rigidity of labor regulations is a concern. Despite low coverage due to a large
informal sector (particularly in clusters 3 and 4), some aspects of the legislation can be quite
restrictive. Although the poorest countries (cluster 3) have the weakest social protection
coverage (see Section 3.5), they, along with cluster 1 countries, also tend to have the most rigid
labor markets (see Table 5). For example, cluster 3 countries have, on average, a minimum
wage that is more than 50 percent of value added per worker; they provide for severance pay
equal to almost 19 weeks of earnings and 88 percent of the countries require administrative
notification in advance of layoffs of at least 9 workers. Furthermore, in nearly half of the cluster
1 countries, administrative approval is required before groups of workers can be dismissed.
When contrasted with type 2 countries, type 1 and 3 countries have more “rigid” labor markets
along almost all dimensions.
34 See Kuddo (2009). 35 See Cho et al. (2010).

20
Table 5: Challenges – Labor Market Regulations
1. Middle‐Income, Rapid Growth, Structural Change
2. Upper Middle‐Income, Aging, Declining Informality
3. Very Low Income, Young, Balanced Employment Growth
4. Low‐Income, Young, Slow Productivity Growth
Ratio of minimum wage to value added per worker
37% 27% 57% 52%
Severance pay for redundancy dismissal (in salary weeks)
13.1 14.8 18.9 12.6
Notice period for redundancy dismissal (in salary weeks)
5.1 4.1 5.5 4.0
Paid annual leave (in working days)
17 17 20 21
Notification of a third party required if 9 workers are dismissed
83% 43% 88% 54%
Approval of a third party required if 9 workers are dismissed
48% 13% 18% 15%
Fixed‐term contract prohibited for permanent tasks
50% 61% 59% 23%
Source: Doing Business (Employing Workers Indicators).
Notes: Figures refer to most recent year data. Severance pay, notice period, and paid annual leave figures represent averages for workers with 1, 5, and
10 years of job seniority. Data available for all countries in groups 1‐4 and all variables except the notification and approval variables, for which one
country in group 1 (Bolivia) is missing data.
Even though the evidence from the literature is mixed, it usually shows that laws aimed at
providing job security reduce turnover, lead to the creation of fewer jobs, and possibly slow
productivity growth.36 For example, evidence from Latin America shows job protection is
correlated with lower turnover in Colombia, Brazil, and Peru,37 and longer job tenure more
generally. In principle, this could increase employment and provide incentives to increase
investment in human capital within the firm, since workers with strong job protection resemble
a fixed asset for the firm.38 However, evidence suggests that lower job turnover can also lead to
lower job creation,39 less demand for unskilled workers,40 and higher average unemployment
rates.41 Finally, there is growing evidence that tighter labor regulations can negatively affect
36 See Kuddo (2009) for a review of the literature. 37 Kugler (1999); Gonzaga (2003); Saavedra and Torero (2000). 38 See Holzer (1991). 39 See Kugler (1999) for the case of Colombia. 40 See Montenegro and Pages (2003) for the case of Chile. 41 Elmeskov et al. (1998); Lazear (1990); Addison and Grosso (1996).
21
productivity growth by increasing the cost of labor adjustments and reducing the incentives for
firms to innovate and adopt new, especially labor‐saving, technologies.42
The literature on the impact of minimum wages is also mixed, being sensitive to the actual wage
level and the type of labor market where it is implemented. A minimum wage can be an efficient
policy response to increase wages and even employment in imperfectly competitive labor
markets, like those found in most countries.43 In practice, a minimum wage that is low enough
relative to economy‐wide average earnings is not likely to have major impacts on employment.
A minimum wage that is too high, however, can reduce incentives to create jobs in the formal
sector, particularly for youth. Moreover, there is no evidence that a minimum wage is a good
instrument to reduce poverty or inequality.44
Issues related to labor regulations are less important for labor markets in clusters 3 and 4
despite their rigidity because such a large share of employment is outside of wage and salary
work; they need to receive attention, however, in the other clusters. A particular challenge for
countries in clusters 1 and 2 is rethinking the tradeoff between the advantages to incumbents
provided by labor market regulations and the benefits of flexible labor markets that can
generate additional employment, especially in the formal sector. Higher minimum wages,
higher severance pay, longer paid vacations, and longer advance notice are intended to
improve the quality of jobs for those who occupy them. However, if these regulations reduce
the incentives to hire new workers or lead employers to exit the formal sector, significant
negative effects can impinge on “outsiders”, namely workers who do not manage to get or keep
one of the protected jobs.
3.4 Education and Skills
The accumulation of human capital through the acquisition of knowledge and skills is
recognized as central for economic development. More educated workers not only have better
42 See Hopenhayn and Rogerson (1993) for an analysis using a general equilibrium model of job search; Cappelli (2000) and Hobjin and Jovanovic (2001) for analyses of the impact on the cost of labor adjustments; and Scarpetta and Tressel (2004) for direct effects on productivity growth. 43 Card and Krueger (1997); Manning (2003). 44 See Kuddo (2009) and Cho et al. (2010) for a review.

22
job opportunities, earn more, and have more stable and rewarding jobs, they also are more
adaptable and mobile.45 Workers who acquire more skills also make other workers and capital
more productive and, within the firm, they facilitate the adaptation, adoption, and ultimately
invention of new technologies. This is crucial to enable technological change and economic
diversification. Through all these channels, a more educated and more skilled labor force is
likely to contribute to faster employment and economic growth.46
In the developing world, unfortunately, the majority of the labor force has very low levels of
education (see Table 6). Countries in cluster 2 have the best indicators, yet the average number
of years of schooling is only 8.5 (primary plus a couple of years of secondary). For comparison,
this same average in OECD countries is 11.9 years. Moreover, only 30 percent of the working
age population in cluster 2 countries has successfully finished high school and less than 7
percent has a university degree. Again, in advanced economies these shares are 56 and 14
percent respectively.
Table 6: Challenges – Skills
1. Middle‐Income, Rapid Growth, Structural Change
2. Upper Middle‐Income, Aging, Declining Informality
3. Very Low Income, Young, Balanced Employment Growth
4. Low‐Income, Young, Slow Productivity Growth
Average years of schooling
7.5 8.5 4.3 5.3
Literacy rate 95.76 93.87 56.18 65.68
Share of working age population completed secondary school
27.79 30.92 9.93 14.69
Share of working age population having completed tertiary education
6.44 7.45 1.35 3.09
Source: WDI, Barro and Lee (2010).
Notes: Figures refer to the 4‐year average of available data from the period 2005‐2008. Data available for all countries in groups 1‐4 for average years of
schooling but data on the literacy rate are limited (countries available/total countries in group): 24/25 type 1 countries, 20/23 type 2 countries, 15/17
type 3 countries, and 12/13 type 4 countries.
45 There is a vast literature empirically supporting the value of investing in education to develop human capital and on the contribution of education to growth and development (see, for example, Vandenbussche et al. 2004; Aghion et al. 2008; Helpman 1992; Hanushek and Kimko 2000; Krueger and Lindahl 2001; Hanushek and Woessmann 2007). 46 See Helpman (2010).

23
There is, of course, a clear divide between the middle and upper middle income countries of
clusters 1 and 2 and those in the other clusters, where providing even basic skills to the
population remains a challenge. Countries in clusters 1 and 2 already have literacy rates over 90
percent. For these countries, the issue of access to primary education is more or less resolved,
and the challenge is to further lift the skill level of the population into the secondary and
tertiary levels. In the other countries, illiteracy can touch up to 73 percent of the population
(Niger) and average years of education can be as low as 1.2 (Mozambique). In some cluster 3
and 4 countries like Kenya, Mongolia, Tajikistan, or the Kyrgyz Republic, literacy rates and
average education have reached levels comparable to type 1 and 2 countries. Nevertheless, a
priority for the countries in clusters 3 and 4 continues to be expanding educational
opportunities and ensuring the presence of teachers and the availability of textbooks.47
Still, these basic indicators of educational achievement hide fundamental issues regarding the
relevance of skills acquired in education and training systems for labor markets. Indeed,
ensuring that children enroll in schools and ultimately graduate from college does not
guarantee that, while in the system, they are acquiring skills that will improve their labor
market opportunities.48 For many developing countries, particularly in low income settings,
assessments of education quality are disappointing.49,50
The diversity of skills that matter for the labor market, and the ways in which the skills required
by employers change as economies develop, make providing skills relevant to the labor market a
challenge. For example, recent empirical analyses show that success in the labor market does
not only depend on the acquisition of technical skills. Cognitive and non‐cognitive skills, in part
47 See the World Development Report (2007); World Bank (2007, 2008). 48 See the Skills toward Employability and Productivity (StEP) framework publication “Stepping Up Skills for More Jobs and Higher Productivity” (World Bank, 2010). 49 See Glewwe and Kremer (2006); World Bank (2008); Robalino et al. (2011); Boissiere (2004). 50 Internationally comparable data measuring the quality of education such as TIMSS (Third International Mathematics and Science Study), PIRLS (Progress in International Reading Literacy Study), and PISA (Programme for International Student Assessment), collect information primarily from developed countries and a few middle income developing countries. Internationally comparable data are not available for very low income countries. The performance of students on achievement tests administered within many of the low income countries, however, suggests that academic achievement is often very low. See Glewwe and Kremer (2006) and Boissiere (2004) for more information on the quality of education in developing countries, World Bank (2008) for a country‐specific assessment of academic achievement in LAC, and Robalino et al. (2011) for South Asia.
24
acquired in early childhood and during basic and secondary schooling, are also important
determinants of employment dynamics and earnings later in life51 and facilitate the acquisition
of technical skills and education more generally.52 The literature has also found that the
demand for higher level cognitive skills, relative to demands for manual job‐specific skills, tends
to increase with technological progress, development, and diversification of the economy.53
As the level of education increases, skills mismatch becomes an increasingly important issue and
a major cause of high unemployment, especially among youth with higher education. In India,
for instance, 50 percent of university graduates obtain a diploma in the arts, far exceeding
employer demands.54 In Tunisia, the share of higher educated youth among unemployed youth
has been rising and currently is the largest among all education levels. Graduate curricula are
often criticized as the source of high unemployment among tertiary educated youth, and more
than 50% of university graduates are in jobs that do not use the skills they acquired in the
university.55 In Macedonia, where youth unemployment (particularly long term unemployment)
is prevalent, skills mismatch is pervasive. Employer surveys show that soft skills such as
responsibility and team work are more appreciated than job‐specific skills such as foreign
languages or technical skills.
Compounding the problems of low educational attainment, quality, and potential skill
mismatches is the phenomenon of low or declining rates of return to education. Recent
evidence for very diverse countries, from Latin America to South Asia, shows that investments
in different levels of education are not always worth their cost. In Latin America, rates of return
on education are generally positive but have been falling over the last decade in the case of
secondary and higher education. Within South Asia, rates of return to certain levels of
51 Heckman et al. (2006) show that cognitive skills and non‐congnitive skills are important in explaining a diverse array of labor market outcomes. Although there are important gender differences in the effects of these skills, for most behaviors, both factors play an important role for men and women. Carneiro and Heckman (2003), Heckman and Masterov (2007), Cunha et al. (2006), and numerous other papers establish that parents play an important role in producing both the cognitive and non‐cognitive skills of their children. 52 See Bowles and Gintis (1976); Heckman et al. (2006). 53 See Autor, Levy, and Murnane (2003); Goldin and Katz (2007). 54 See Robalino et al. (2011). 55 See the Skills toward Employability and Productivity (StEP) framework publication “Stepping Up Skills for More Jobs and Higher Productivity” (World Bank 2010).
25
education can be negative. Low or falling rates of return ultimately reflect a mismatch between
supply and demand; if the demand for a given skill set grows less rapidly than the supply, wages
are expected to fall and push down the return to the investment. The factors behind these
dynamics are complex, but they deserve careful attention if incentives to investment in
education and training are to be preserved and enhanced.
3.5 Social Protection
Social insurance policies are important determinants of labor market dynamics and the quality
of jobs. 56 If well‐designed, social insurance programs not only can protect workers’
consumption against various shocks but also facilitate labor mobility and improve their
bargaining power. This can reduce failures in labor markets, allow better matches between
skills and jobs, and provide incentives to engage in higher risk/higher return activities – which
can in turn contribute to productivity growth and employment creation. On the other hand,
badly designed social insurance policies often have adverse impacts on labor markets by
restricting labor mobility, reducing labor demand, and providing incentives for informality or
labor force withdrawal. This happens, for instance, when social insurance benefits are not
portable, when the tax‐wedge that finances the contributory programs is too high, when out‐
of‐work benefit levels are too high or last too long, and/or when the design of non‐contributory
programs to expand coverage induces implicit taxes on formal work.
Social insurance programs cover considerably different sets of risks across countries (see Table
7). Among the countries for which data exists, old age, disability and survivor benefits are the
most common – only Malawi does not offer them. Unemployment benefits, however, are not
part of the social insurance system in the majority of cases. Only 35 percent of countries in the
sample have them (mostly in cluster 2), while the others rely on severance pay regulated
through the labor code (see next section). Severance pay is riskier (since the systems are not
funded) and usually associated with long legal and administrative processes. Outside of clusters
1 and 2, only a minority of countries offers contributory health insurance. In the others, all
56 The rationale for having these programs is that many individuals may not have the ability to self‐insure against risks such as disease, longevity, or unemployment due to “myopia,” liquidity constraints, and capital and insurance market imperfections (see Barr 2004; Kuddo et al. 2011).
26
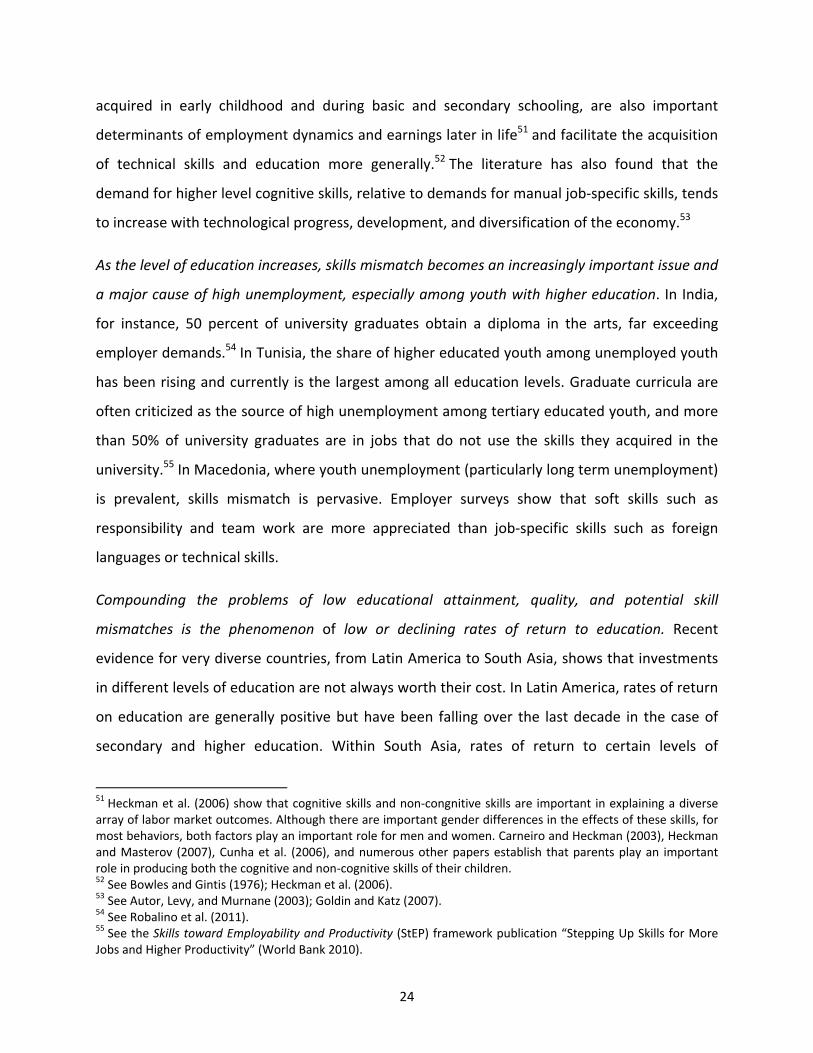
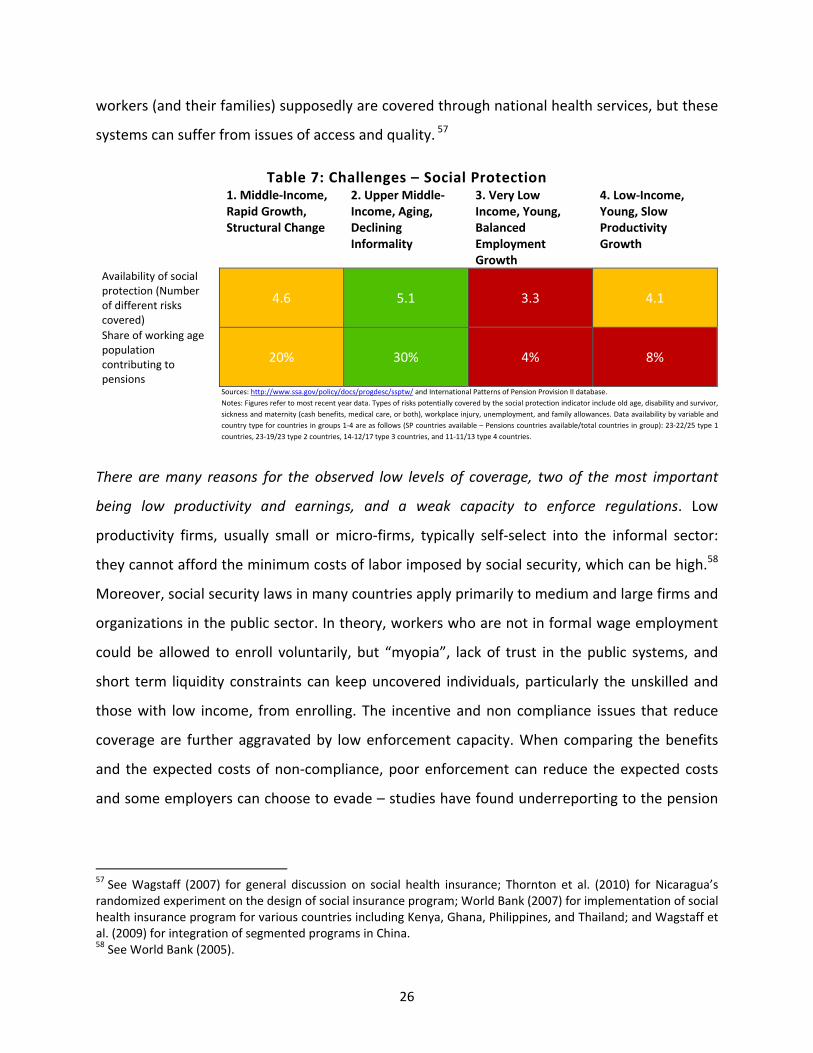
workers (and their families) supposedly are covered through national health services, but these
systems can suffer from issues of access and quality. 57
Table 7: Challenges – Social Protection
1. Middle‐Income, Rapid Growth, Structural Change
2. Upper Middle‐Income, Aging, Declining Informality
3. Very Low Income, Young, Balanced Employment Growth
4. Low‐Income, Young, Slow Productivity Growth
Availability of social protection (Number of different risks covered)
4.6 5.1 3.3 4.1
Share of working age population contributing to pensions
20% 30% 4% 8%
Sources: http://www.ssa.gov/policy/docs/progdesc/ssptw/ and International Patterns of Pension Provision II database.
Notes: Figures refer to most recent year data. Types of risks potentially covered by the social protection indicator include old age, disability and survivor,
sickness and maternity (cash benefits, medical care, or both), workplace injury, unemployment, and family allowances. Data availability by variable and
country type for countries in groups 1‐4 are as follows (SP countries available – Pensions countries available/total countries in group): 23‐22/25 type 1
countries, 23‐19/23 type 2 countries, 14‐12/17 type 3 countries, and 11‐11/13 type 4 countries.
There are many reasons for the observed low levels of coverage, two of the most important
being low productivity and earnings, and a weak capacity to enforce regulations. Low
productivity firms, usually small or micro‐firms, typically self‐select into the informal sector:
they cannot afford the minimum costs of labor imposed by social security, which can be high.58
Moreover, social security laws in many countries apply primarily to medium and large firms and
organizations in the public sector. In theory, workers who are not in formal wage employment
could be allowed to enroll voluntarily, but “myopia”, lack of trust in the public systems, and
short term liquidity constraints can keep uncovered individuals, particularly the unskilled and
those with low income, from enrolling. The incentive and non compliance issues that reduce
coverage are further aggravated by low enforcement capacity. When comparing the benefits
and the expected costs of non‐compliance, poor enforcement can reduce the expected costs
and some employers can choose to evade – studies have found underreporting to the pension
57 See Wagstaff (2007) for general discussion on social health insurance; Thornton et al. (2010) for Nicaragua’s randomized experiment on the design of social insurance program; World Bank (2007) for implementation of social health insurance program for various countries including Kenya, Ghana, Philippines, and Thailand; and Wagstaff et al. (2009) for integration of segmented programs in China. 58 See World Bank (2005).

27
system can be as high as 30% of the covered wage bill in formal firms.59 There are also
employees who prefer higher take‐home pay to the benefits offered by social security,
particularly when non‐contributory arrangements are in place or the perceived value of the
benefits is low.60
More generally, social insurance programs can affect labor market outcomes through implicit
and explicit taxes and subsidies within the various insurance programs, particularly in cluster 1
and 2 countries.61 These distortions can affect behavior on the supply side of the labor market
in several ways. First, incentives to search for and keep jobs may be affected by the presence of
unemployment insurance systems that are not actuarially fair, as is the case in most countries
with such systems.62 Second, a lack of portability of benefits can restrict labor mobility. This is
quite common in countries with fragmented social insurance systems.63 Finally, decisions to
participate in the labor force, and in particular to retire early, can be affected by the design of
the pension system.64 In particular, system parameters such as high minimum pensions can
push individuals to delay entry into the labor market or retire earlier in order to receive higher
rates of return on their contributions.
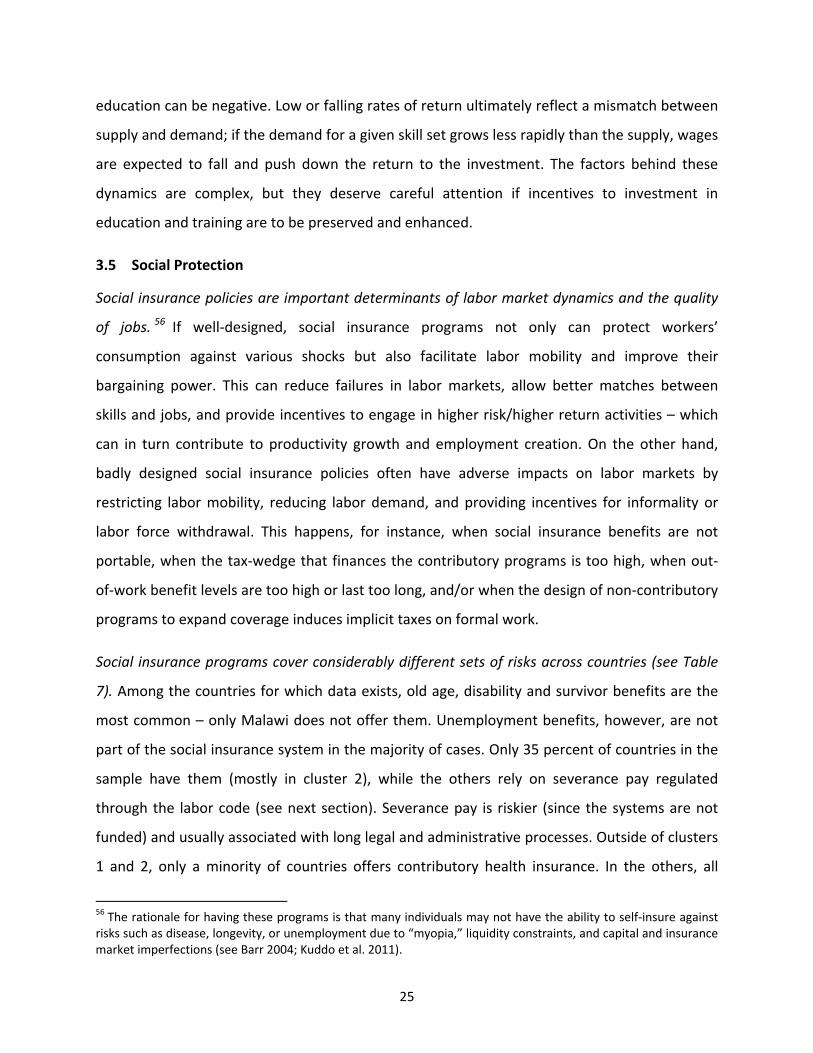
From the demand side, social insurance programs can affect firm behavior when funded
through payroll taxes with a high tax wedge (the difference between the cost of labor and take‐
home pay) and when regulations impose dismissal taxes (or severance pay). Both payroll taxes
and severance benefits in countries around the world can be quite high (see Figure 5). In
particular, type 2 countries such as Colombia, Mexico, Lithuania, and Turkey present a larger
tax wedge than the world average. Type 1 countries including Algeria, Tunisia, Peru, and
Morocco follow. There is evidence that the level of formal employment declines as the tax
59 Ibid. 60 See Perry et al. (2007); Ribe et al. (2010). 61 See Robalino et al. (forthcoming). 62 See Robalino et al. (2009) for a review; Tatsiramos (2010) and Vodopivec (2009) for a discussion. One alternative, individual unemployment savings accounts, can also distort behavior if the mandated precautionary savings rate is too high and/or the interest paid on the accounts is too low. In this case, workers may have incentives to collude with employers and simulate dismissals, thereby allowing the individual to withdraw his or her forced savings. See Chapter 5 in Ribe et al. (2010) for details. 63 See Forteza (2010). 64 In poorly designed defined‐benefit pension systems, the rates of return that individuals receive on their contributions depend on when they join, how often they contribute, and when they retire (Robalino et al. 2005).
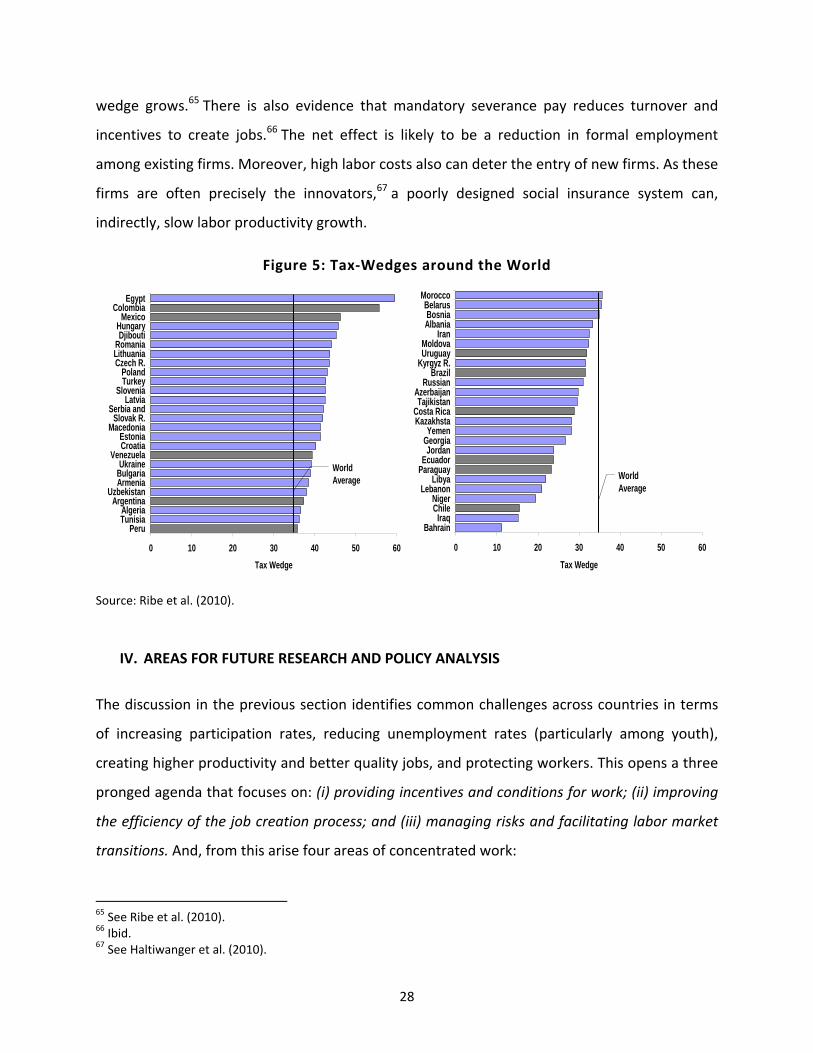
28
wedge grows.65 There is also evidence that mandatory severance pay reduces turnover and
incentives to create jobs.66 The net effect is likely to be a reduction in formal employment
among existing firms. Moreover, high labor costs also can deter the entry of new firms. As these
firms are often precisely the innovators,67 a poorly designed social insurance system can,
indirectly, slow labor productivity growth.
Figure 5: Tax‐Wedges around the World
Source: Ribe et al. (2010).
IV. AREAS FOR FUTURE RESEARCH AND POLICY ANALYSIS
The discussion in the previous section identifies common challenges across countries in terms
of increasing participation rates, reducing unemployment rates (particularly among youth),
creating higher productivity and better quality jobs, and protecting workers. This opens a three
pronged agenda that focuses on: (i) providing incentives and conditions for work; (ii) improving
the efficiency of the job creation process; and (iii) managing risks and facilitating labor market
transitions. And, from this arise four areas of concentrated work:
65 See Ribe et al. (2010). 66 Ibid. 67 See Haltiwanger et al. (2010).
0 10 20 30 40 50 60
PeruTunisiaAlgeria
ArgentinaUzbekistan
ArmeniaBulgariaUkraine
VenezuelaCroatiaEstonia
MacedoniaSlovak R.
Serbia andLatvia
SloveniaTurkeyPoland
Czech R.LithuaniaRomaniaDjibouti
HungaryMexico
ColombiaEgypt
Tax Wedge
World Average
0 10 20 30 40 50 60
BahrainIraq
ChileNiger
LebanonLibya
ParaguayEcuador
JordanGeorgiaYemen
KazakhstaCosta Rica
TajikistanAzerbaijan
RussianBrazil
Kyrgyz R.UruguayMoldova
IranAlbaniaBosnia
BelarusMorocco
Tax Wedge
World Average

29
First, the process of job creation and destruction: what are the constraints that need to
be removed and how can the self‐employed and small entrepreneurs be supported?
Second, skills: how can the level and relevance of skills of the new entrants to the labor
market be improved, and what can be done with the large stock of unskilled workers?
Third, labor market dynamics: how can transitions from school‐to‐work, out of
unemployment, or inactivity, and between jobs be facilitated?
Finally, worker protection: how can regulations and laws protect workers from loss of
income and exploitation or abuse without creating labor market distortions that reduce
employment levels or encourage informality?
4.1 Businesses and Jobs: From Self‐employment to Entrepreneurship
As noted in Section II, wage and salary employment make up the minority of jobs in the
developing world, suggesting two interrelated policy agendas through which the Bank can
support countries to increase the number of good quality jobs. The first agenda involves
ensuring that the process of businesses and job creation (and destruction) can take place
efficiently. Good ideas or projects should be able to be funded and implemented, and
entrepreneurs should have the incentives to grow and create jobs; bad ideas should be filtered
out and discarded so that human and physical resources can be put to better use. Clearly, not
all good ideas need to be transformed into large corporations. Many businesses can remain
small but productivity should be high enough to allow entrepreneurs to operate “formally” and
pay wages (or generate earnings) that ensure a decent standard of living for all workers.
The second agenda involves improving the quality of the jobs that already exist. Some low
skilled, self‐employed or small entrepreneurs running low productivity, small scale businesses
have economic potential if well managed, while others do not. There is also variability in the
potential of self‐employed individuals to become successful business owners. The goal of public
policy in this case is to help promising businesses realize their potential, while assisting those
individuals involved in non‐economically viable activities to exit and transition to a more
productive occupation. The relative importance of each of these agendas will depend on

30
countries’ economic circumstances; the second agenda would probably need to receive priority
in clusters 3 and 4 but in most cases both will coexist.
Policies to promote macroeconomic stability and a business environment that encourages
investments and innovation are relevant mainly to the first agenda and the high end jobs. The
focus here should continue to be on understanding how different parts of the regulatory
framework affect the creation of firms and jobs in different sectors, regions, and at various
levels of productivity. Evidence highlights the importance of competition in facilitating firm
entry, innovation, and productivity growth.68 Research also shows that significant reductions in
regulations can increase the number of business and wage employment.69 Even so, important
questions remain in terms of how different regulations and policy interventions affect
competition (e.g., competition councils, anti‐trust law) and ultimately jobs. How to enforce
these regulations in developing countries also remains an open policy question.70
The first agenda could also involve more direct policy interventions to stimulate investments in
specific sectors. Even in a perfect business environment with low macroeconomic and
microeconomic risks, investments and new business will not simply follow, due to other market
features such as coordination failures, and information spillovers.71 In the case of coordination
failures, the return to one investment depends on whether another investment is also made,
such as when the profitability of export activities depends on port investments. Information
spillovers can occur when first movers in new activities pay the cost of experimenting, allowing
new entrants to learn from the experience. In this case, governments may be called upon to
temporarily subsidize investments, guarantee loans to firms, facilitate the creation of necessary
infrastructure, and mobilize skilled workers. How these policies should be implemented –
starting with how to “target industries” – will need to be addressed.72
68 See, for example Aghion et al. (2005) and Hallward‐Driemeier and Thompson (2009). 69 See Bruhn (2011) and Klapper and Love (2010). 70 See Hallward‐Driemeier and Pritchett (2010). 71 See Hausmann (2008). 72 Lin and Monga (2010) present evidence that governments implementing successful industrial policies targeted industries that (i) were consistent with the country’s latest comparative advantage determined by endowment structure and, (ii) were mature in countries whose per capita income was, on average, around double their own.
31
Relatively little is known about the effectiveness of interventions that support self‐employment
and entrepreneurship (the second agenda). These policies attempt to influence: motivation and
risk tolerance (via cultural and social norms); technical and non‐cognitive skills; information
about production technologies, best management practices, and prices; access to value chains
and markets; and liquidity constraints. Interventions of this sort include business and life skills
training, advisory services, networking, improving access to finance, and micro‐franchising.
It is difficult to extract reproducible lessons from the evidence given the large heterogeneity of
programs and the fact that they are typically comprised of a package of interventions.
Randomized control trials carried out on a sample of microfinance clients in Peru,73 Tanzania,74
Bosnia‐Herzegovina, 75 Dominican Republic, 76 and Pakistan 77 found that business training
improved business knowledge and business practices, but there is little evidence of an impact
on sales, profits, or survival rates. Moreover, introducing microfinance in new areas affects the
creation and ownership of new businesses but not employment among current businesses.78
Evaluations of youth programs that provide entrepreneurial skills show that much depends on
curriculum, pedagogical approach, and whether participants have to actually start a business or
not.79 For example, an evaluation of Argentina’s Microemprendimientos Productivos, which
targeted welfare beneficiaries from a large safety nets intervention, reports that the
intervention failed to increase income for the average participant in the short run.80 Evaluations
of matching grants for SMEs in Argentina81 and Tunisia show positive results on employment
creation, with less straightforward results in Mauritius.82 Mentoring for SMEs in Mexico led to
large, though imprecisely measured, increases in profits and sales but no increase in
73 See Karlan and Valdivia (2011). 74 See Bjorvatn and Tungodden (2010). 75 See Bruhn and Zia (2011). 76 See Drexler, Fisher, and Schoar (2011). 77 See Mansuri and Gine (2011). 78 See Banerjee et al. (2009). 79 For the case of the Netherlands see Oosterbeek, Van Praag and Ijsselstein (2010). For Botswana, Ethiopia, Kenya, South Africa, and Tunisia see Africa Competitiveness Report (2011). 80 See Almeida and Galasso (2009). 81 See Castillo et al. (2010). 82 See Biggs (1999).

32
employment over one year.83 Provision of business consultants to improve management
practices in India increased productivity by 11 percent and annual profits by over USD 200,000
per firm, but induced no significant change in employment in the first year.84 In general, most
results measure impacts over the short run; little is known about the medium term impact of
these programs.
Promising interventions nonetheless do exist. Micro‐franchising programs remove the difficult
step of business design by replication of a successful existing business in sectors from
pharmaceutical drugs, to ice cream, to solid waste collection, to domestic or phone services, to
the provision of water. In addition, the risk of failure is lower than that of a standard firm start‐
up, which increases the attractiveness of this type of program in places where the stigma
associated with failure is high. Interventions that focus on increasing the productivity,
integration, resistance to shocks, and competitiveness in the agricultural sector also merit
more attention, particularly for countries in the low income clusters. Some of the interventions
targeting this sector include policies that promote access to finance, facilitate the adoption of
new technologies, help upward movement in the value chain, improve the use of fertilizers and
seeds, provide information about prices and quality standards, ease access to insurance to
manage risk, provide assistance for the formation of producer networks, and promote skill
development.85
Looking forward, the agenda to support self‐employment and entrepreneurship should be an
important component of the work on social protection and labor markets, in partnership with
the IFC, DEC/FPD, and other sectors within the Bank. The following questions will need to
receive attention:
Designing instruments and targeting methods to identify different groups of potential
beneficiaries and assess the constraints they face. Examples of targeted groups include
subsistence farmers, women, youth, and low productivity firms, among others.
Interventions can take place at the individual, firm, or community level.
83 See Bruhn, Karlan, and Schoar (2011). 84 See Bloom et al. (2011). 85 See World Bank (2007c).

33
Better understanding what types of entrepreneurship programs are effective for
specific groups. This is essential to design programs tailored to different population
subgroups and go beyond the “one‐size fits all” approach.
Identifying the benefits of mitigating risk for entrepreneurs. The presence of uninsured
risk may deter potentially successful entrepreneurs either from establishing businesses
or from engaging in high risk / high reward activities. Still, entrepreneurs should bear
some risk so as to reduce moral hazard and give them a vested interest in the success of
their enterprise.
Identifying implementation issues that are crucial for a program to succeed and be
scaled up. Evaluations that show muted results do not necessarily imply that the
corresponding programs are always ineffective; they can reflect problems with design
and/or implementation.
Identifying what skills are related to successful entrepreneurship and learning about
their malleability over the lifecycle. This can help understand whether interventions
need to be introduced early in an individual’s education or if they can be taught after
the individual enters the labor market.
Developing a dialogue with international agencies, NGOs, and other stakeholders that
have experience in the design and implementation of entrepreneurship
interventions.86 This dialogue is essential to develop partnerships at different levels (e.g.,
funding, technical assistance, and capacity‐building).
4.2 Developing Skills
The area of skills development also has a two pronged agenda: improving the skills of the large
stock of unskilled workers and, over the medium term, improving the skills of new labor market
entrants. Both are complicated by the multiplicity of channels through which skills are acquired
– from parents and families in the early years of life, later through schools, universities, and
vocational centers, and ultimately via on–the‐job training and work experience. In addition,
86 Examples of organizations with experience in entrepreneurship interventions include: International Labor
Organization, Kauffmann Foundation, Global Entrepreneurship Monitor, International Rescue Committee, BRAC, FINCA, Freedom from Hunger, Nike Foundation, Goldman Sachs, Cisco, Intel, and Microsoft.

34
whether the right set of skills translates into higher employment and productivity depends on
how well labor markets function. Labor markets where information is lacking or mobility is
limited may fail to match jobseekers with the right jobs, reducing the returns on investments in
additional skills.
The StEP framework87 highlights the importance and complementarity of these different
dimensions. The framework emphasizes that in order to improve employability and productivity,
countries need to coordinate policies at five levels: (i) creating the conditions for adequate
early childhood development; (ii) laying a strong foundation in basic and secondary schooling;
(iii) building and upgrading job skills in response to labor market signals; (iv) promoting
technological change by enhancing the human dimension of innovation; and (v) enabling labor
mobility and improving the matching of skills to jobs through appropriate labor market
regulation, social protection, and intermediation programs.
The focus of the work on skills for the Social Protection and Labor sector is step 3.88 Specifically,
SP&L’s work concentrates on three types of training programs for individuals who are leaving
the formal general schooling system or are already in the labor market: pre‐employment
technical and vocational education and training (TVET); on‐the‐job training (OJT); and training‐
related active labor market programs (ALMP) targeted to individuals without access to the first
two. In this way, the skills agenda is intimately related to the work on entrepreneurship and
labor market transitions.
Although current skills development initiatives have increased investments in training at various
levels, the effectiveness and relevance of the skills individuals acquire remain a concern.89 A
common problem for most programs is the lack of monitoring and evaluation systems. Worse
still, policymakers lack information about the distribution of skills on the supply and demand
sides of the labor market; they are not able to measure what they are trying to influence via
policy. As a result, supply‐driven TVET systems struggle to remain relevant, training funds
87 See Skills toward Employability and Productivity (StEP) framework publication “Stepping Up Skills for More Jobs and Higher Productivity” (World Bank 2010). 88 Labor policies are also concerned with Steps 4 and 5 which are covered in Sections 3.4 and 3.5 respectively. 89 For a recent report taking stock of skills development strategies see Almeida et al. (forthcoming).

35
financed through payroll taxes increase the cost of labor without necessarily providing
incentives to firms to invest in productive training, and fragmented ALMPs have unclear
mandates and face design, governance, and accountability issues.
The challenge is to improve the design of current programs, taking into account the market
failures they are trying to address as well as the limitations of government interventions.90 Key
considerations affecting the success of programs include poaching and matching externalities;
capital markets that preclude investments in training; coordination failures that lead workers to
underinvest in training (due to lack of high productivity jobs) while limiting the incentives for
employers to create these jobs (because of a lack of skilled workers); and limited information
and individual “myopia” that lead to insufficient investments in training or inappropriate career
choices. Governments, too, are prone to failure and many programs currently operating are
part of the problem, not the solution.
The Human Development Network already works extensively on skills; in this context, the Social
Protection and Labor sector’s contributions should focus on the following priority areas:
Measuring skills. An important question is how to define and measure the set of skills
that determine labor market outcomes in developing countries. Sound country‐level,
regularly‐administered surveys of workers and firms that measure the supply and
demand of technical, cognitive, and non‐cognitive skills relevant for the developing
world need to be devised..91
Assessing failures in the market for skill acquisition. There is an urgent need for a much
better assessment of the main market and governmental failures affecting the provision
of training as well as evaluations of the impact of alternative corrective policy
interventions. A first step would be to improve current data collection and ongoing
monitoring and evaluation systems (M&E) across all programs. Another issue is to
define a more systematic approach to identify constraints facing individuals looking to
acquire skills or firms seeking to provide them. This could involve evaluating information
90 See Almeida et al. (forthcoming). 91 The Bank has already pioneered this type of survey in Lebanon and Peru, and is exploring the possibilities for expanding to more countries.
36
problems and myopia among different groups of workers and assessing the likelihood
that more information and/or incentives possibly could affect skill acquisition.
Improving knowledge about program design and implementation. Some of the most
important decisions when designing a new program relate to governance, management
structures, public vs. private provision, financing mechanisms, payment systems to
providers, decentralization and autonomy, regulations to control quality, and how to
target and deliver subsidies (to individuals or firms). Efforts should be undertaken to fill
these knowledge gaps.
4.3 Activating Individuals and Facilitating Labor Market Transitions
Labor market transitions are crucial determinants of labor market outcomes. High
unemployment rates today can reflect inefficient transitions from school to work, from welfare
to work, or between jobs. Low participation rates also raise the question of how to help
individuals transit from inactivity into a job. Because of failures in labor markets, government
interventions can be designed to help ease these transitions by helping individuals better signal
their skills to employers, find or relocate for the right jobs, identify training needs and/or the
right training providers, or finance this training. Insufficient labor demand and low expected
returns to investments in training or job‐search are also issues that may require government
intervention.
Supporting countries in the design and implementation of programs that activate individuals
and facilitate labor market transitions should be an important part of the Bank’s work on labor.
The relevant programs fall into two categories: (i) programs to stimulate labor demand and (ii)
programs to support job search and improve employability. The first set of programs mainly
includes public works and wage subsidies,92 while the second brings together interventions
such as intermediation, counseling, job‐search assistance, training, skills certification, and social
services that facilitate mobility (e.g., child care). The entrepreneurship promotion programs of
Section 4.1 can also become part of the portfolio when wage and salary jobs are lacking.
92 Some of these, as well as other, programs (such as work‐sharing) have also been used to protect jobs during a recession. Their use, however, is more controversial. More effective interventions to temporarily help firms in distress include credit and access to public tenders.

37
Evaluations of have given mixed results, but this may partly reflect design problems in the
programs being evaluated. As with entrepreneurship promotion programs, negative
evaluations should not be interpreted as suggesting that the active labor market programs as a
whole are not needed or are not useful.93 The market failures that these programs try to
address are real, and successful programs linking individuals to jobs that integrate various
interventions and have a strong involvement of the private sector do exist. For example,
“Training Plus” programs, which consist of technical and/or life skills training followed by work
experience through private sector internships and job placement assistance, have been found
to be quite successful at activating individuals. Interventions such the Jovenes programs in Latin
America (mainly targeted to unskilled youth)94 and Probecat in Mexico95 fit in this category.
These interventions are relevant for all four clusters of countries, even though the composition
of the portfolio will vary according to country circumstances and target population. Programs
linking individuals to formal wage employment (e.g., intermediation and job‐search assistance)
will be less relevant in clusters 3 and 4 given the small size of the formal sector. In clusters 3 and
4, these components of the package of services could be replaced with programs that support
self‐employment and entrepreneurship.
The challenge is to better understand how to design and implement integrated interventions
that respond to the needs of different workers in different country settings.96 Specific issues
include:
Understanding employability constraints. Specific instruments and analytical products
could be developed, including a stock‐taking of the most successful profiling
methodologies in high income countries, a statistical toolkit to analyze the main
93 See Cunningham et al. (2010). 94 Jovenes programs have a strong emphasis on demand‐driven skills training, ensured by ex ante agreements with the private sector to provide internships to their graduates. Wages during the internship are financed by the program. 95 The program, which is not specifically targeted to a disadvantaged population, provides a stipend equivalent to the minimum wage to beneficiaries while the private sector businesses provide the training and the internship (for a minimum of three months), and cover the training costs. Most importantly, private firms have to agree to retain at least 70 percent of the trainees for a year each in order to participate in the program (Ibarraran and Rosas 2009). 96 For a detailed review of programs and a more in depth discussion of the various issues, see Almeida et al. (2011). For a recent discussion about how wage subsidies are used in Tunisia, see Robalino et al. (2011).
38
constraints to employability across different groups based on varying data sources, and
an exploration of techniques used for providing profiling and counseling services across
different programs and settings.
Understanding incentive‐compatible designs of income support schemes. The
effectiveness of activation policies addressed to income support recipients will depend,
in part, on the incentives these beneficiaries have to search for jobs or enter programs
that improve their employability, earnings potential, or businesses. The evidence linking
transfers and other interventions to incentives, behaviors, and take‐up rates, however,
is still unclear.
Investigating the appropriate contracting, auditing, and payment systems for the
outsourcing of service delivery to the private sector. Private sector involvement has
typically been associated with greater cost‐effectiveness, lower pressure on public
budgets, and a wider array of services proposed to an increasingly diverse clientele.
Despite the importance, there is still little understanding of how to best create and
operate these markets.
4.4 Protecting Workers
Although not all reforms of labor regulations and social insurance systems97 have achieved their
goals, past experiences have improved our understanding of the pre‐conditions for success. Four
general principles must be considered when reforming worker protection: (i) taking a more
integrated approach to worker protection systems; (ii) delinking access to public insurance
programs from the existence of a labor contract; (iii) moving to explicit forms of redistribution
to cover those with either no or limited savings capacity and reducing distortions where
compatible with societal objectives;98 and (iv) integrating, simplifying, and refocusing labor
regulations.
Taking an integrated approach to the reform of worker protection systems could improve their
success for a number of reasons. First, labor laws and social insurance are intimately linked. It is
97 See World Bank (2010); Holzmann et al. (2009); World Bank (2005); Ferreira and Robalino (2010). 98 Implicit redistribution is currently a part of many systems, but these implicit subsidies are often regressive, benefiting more high than low income workers. See Ribe et al. (2010); Skoufias et al. (2009); Forteza et al. (2010).

39
risky, for instance, to have more flexible labor regulations if the right insurance programs are
not in place. Second, there are important interactions between social insurance programs, so
reforming one program without looking at the effects on another can be counterproductive. As
an example, changes in a public health insurance plan can affect the amount (and frequency)
that workers contribute to social security and, through this channel, the savings workers
accumulate in their pension accounts. Similarly, changes in unemployment benefit systems can
affect retirement ages and the sustainability of pension systems.99 Third, it is difficult to justify
having fundamentally different strategies to expand the coverage of the various programs
when the problems that need to be addressed are essentially the same. Finally, there are gains
to be made, through cost reductions and more effective service delivery, if programs are better
coordinated and share administrative and information systems.
Expanding access to social insurance would require opening systems to all workers regardless of
occupation and most likely on a voluntary basis, given the difficulty of enforcing compliance.
This raises several technical challenges: (i) defining the set and level of benefits that are
provided to attract workers – and their employers (when available) – from outside the formal
sector; (ii) structuring incentives to encourage enrollment and take‐up; (iii) mobilizing subsidies
for individuals with low or limited savings capacity; (iv) financing the system so as to minimize
incentives to evade while allowing workers to enroll (regardless of income and their
contribution capacity) and avoiding the creation of unfunded liabilities; (v) collecting
contributions from workers without stable and measurable earnings who often lack access to
the financial sector; and (v) paying benefits.
Beyond flexibility, labor regulations need to be integrated, simplified, and better enforced. In
most developing countries, inspection offices do not have the capacity to enforce the many
regulations found in different pieces of legislation. Societies thus need to prioritize the areas
where labor markets need to be regulated and try to extend these basic rights to informal
sector wage earners. These priorities would include, for instance, the enforcement of core labor
standards (freedom of association, no forced labor, no child labor, and no discrimination) and
99 See Robalino et al. (2009).

40
regulations on minimum wages and working conditions (work schedules, health, and safety).
Lower priority areas might be regulating contracts or dismissal procedures beyond requiring
appropriate advance notice.
To be able to address the four general principles described above, the work on social protection
and labor at the Bank would need to focus on the following areas and activities:
Designing guidelines to account for individual heterogeneity when setting the
mandate of social insurance programs. Individuals have different preferences and
needs, yet most systems impose a universal mandate. This can create implicit cross‐
subsidization, provide incentives for informality, and increase the tax‐wedge. Alternative
schemes need to be considered where individuals are more involved in the choice of the
benefits they receive.
Providing guidance to move towards efficient and equitable redistributive
arrangements. A priority is to develop best practices for gradually moving to
contributory social insurance programs that are based on actuarially fair risk pooling
and/or savings. Explicit redistributive arrangements can then be added as complements
to these basic arrangements. Questions to address include: (i) whether to use ex ante or
ex post transfers; (ii) how to design a targeted mechanism that goes beyond the poor;
and (iii) how to finance the programs.
Supporting the development of voluntary savings schemes for informal sector workers.
Informal workers are disproportionately excluded from the financial sector and thus
may not have sufficient access to (or knowledge of) private savings instruments. How to
best design public voluntary contribution systems is unclear, and it is difficult to
evaluate alternative arrangements in the field. Pilot experiments should be launched to
understand the constraints affecting willingness to save (e.g., information, skills, access,
liquidity constraints, trust, and social norms) and the interventions/incentives
susceptible to influence savings.
Improving administrative systems. More efficient and universal social insurance
programs will require better administrative systems to manage their various business

41
processes: identification; registration; targeting; collection of contributions; calculation
of benefits; and benefit payment. The Bank should therefore: (i) take stock of best
practices and promising technologies; (ii) develop a toolkit to benchmark administrative
systems; (iii) develop operational manuals to guide the design and implementation of
various programs; and (iv) support efforts to refine targeting methodologies that
attempt to reach the informal sector.
Assessing the impact of labor regulations and improving enforcement. Considerations
that should be addressed include: (i) the efficient level of discretion; (ii) how to combine
controls and penalties; (iii) how not to discourage small entrepreneurs; (iv) how to limit
the opportunities for harassment and corruption associated with increased enforcement;
and (v) how to involve civil society in the process to expand labor regulations to informal
sector workers.
4.5 Special Issues Regarding Youth
The analysis of demographics and youth labor market outcomes showed that youth labor
market issues are relevant for all clusters. The growing share of young workers in the labor
force in many countries, especially in clusters 3 and 4, has the potential to contribute to
unemployment growth. The lack of experience among young workers not only compounds the
problem but more importantly could have long lasting consequences.100 The social benefit of
any policy intervention that helps young people durably transition into the world of work, other
things being equal, can be inferred to be higher than for adults.
Because of these reasons, the work on social protection and labor, therefore, should pay special
consideration to youth issues when designing and implementing any of the interventions
discussed in this section.
Skills development programs should consider that many personality traits, non‐
cognitive skills, and attitudes are malleable through young adulthood. The
100 See Margolis et al. (2001), World Bank (2006).
42
psychological literature indicates that personality traits stabilize by roughly age 30.101
Personality characteristics and non‐cognitive skills influence occupational choice.102
These elements should be considered when designing the curriculum and pedagogical
approaches and selecting trainers for skills development programs for youth.
Skills development programs for youth should foster the development of self‐
regulation, a positive identity, and “productive” preferences. Recent research has
found that a young person’s susceptibility to deviant or risky behavior, academic failure,
or low performance in the job market is less a function of vulnerability to adverse
circumstances and more a heightened sensitivity to external factors, including positive
ones.103
Familiarity with the internet and mobile communications among youth creates
opportunities for innovation in the delivery of training, labor intermediation, and
entrepreneurship programs. One example of a business training program relying
fundamentally on web‐based content is the IFC’s SME Toolkit: Build Your Business
program. It includes material on creating a business plan, starting a business, and
financial literacy, among other subjects. Elsewhere, cell phones have been used by
programs like SoukTel to connect employers and job‐seekers via text messages in
Somalia and Palestine.
Alternative or complementary arrangements for youth need to be incorporated into
social insurance programs. For example, young people may be disproportionately
reluctant to contribute voluntarily to pensions, because they either are myopic or lack
faith in the pension system. Unemployment insurance systems can also present
problems, particularly if countries move to programs based on savings. Finally,
alternative avenues for financing health insurance for youth may need to be explored.
101 Longitudinal studies that track college students have shown that personality traits show certain persistence during this period of life, although some changes still occur (Robins et al. 2001). Roberts et al. (2003) found that work experiences were related to changes in personality from age 18 to 26 using a panel of individuals in New Zealand. They also found that personality traits at age 18 predicted work experiences at age 26, suggesting the presence of unobserved common factors that influence both personality and work experiences. 102 Empirical evidence shows that the decision to start‐up a business and entrepreneurial performance are affected by a series of cognitive and non‐cognitive skills. See Heckman et al. (2008) and Ciavarella et al. (2004). 103 See Belsky and Pluess (2009); Belsky et al. (2007).

43
Current systems based on payroll taxes penalize youth, who are less likely to have
dependents and incur lower average health costs. Moving to systems based on
premiums, for instance, could make social insurance less expensive, more competitive,
and more desirable for youth.
Entrepreneurship programs also need to take into account the extra intensity with
which certain constraints affect youth. Most youth lack the social networks, business
skills, and money to establish a business because they do not have labor market
experience or assets that might serve as collateral. These issues suggest a shift in
emphasis for some of the program components (i.e., mentoring, access to capital) when
designing entrepreneurship programs for youth.
V. CONCLUSIONS AND IMPLICATIONS FOR THE BANK’S WORK ON LABOR
This paper has reviewed some of the main trends in labor markets around the word, identified
some of the key challenges that countries face to improve them using the MILES framework,
and discussed implications in terms of research and policy analysis. The agenda that emerges
for the Bank’s work on labor is ambitious and its implementation will require a coordinated
effort between the regions and networks, with major contributions from the Human
Development, Finance and Private Sector Development, Poverty Reduction, and Development
Economics Networks. It will also require rethinking current institutional arrangements and
knowledge management tools with the aim to increase their operational impact. We propose
actions at five levels:
1. Leveraging internal resources and partnerships to implement the knowledge agenda, in
particular through development of a knowledge platform on labor.
2. Moving towards the second generation of impact evaluations of labor market programs.
3. Improving the capacity to monitor, benchmark, and analyze labor markets.
4. Improving the capacity to track and develop operational guidelines for promising or
successful labor market interventions.
5. Rethinking partnerships and training.
44
5.1 Knowledge Platform
The jobs agenda suffers from lack of coordination, data, and institutional knowledge. Part of the
problem is content‐related: the agenda is inherently multi‐sectoral and, as suggested by the
MILES framework, requires coordination of policy interventions at various levels. In addition,
the data and instruments needed to assess market failures are often not available, and there is
often insufficient knowledge about how best to design and implement particular policies (e.g.,
employment services or support to small entrepreneurs). Institutional constraints comprise
another facet of the problem: the organization of knowledge production and management on
the subject of jobs is hampered by: (i) the lack of a systematic process to digest current cross‐
sectoral research into forms that can most usefully inform policy; (ii) the mismatch between
some of the research in the academic community and the demands from policymakers; and (iii)
the disconnect between research findings and policy recommendations on the one hand, and
local political and institutional constraints on the other.
The Jobs Knowledge Platform (JKP) aims to address these constraints. The JKP, which is jointly
managed by the Social Protection anchor and three other networks, is an international network
of researchers, policy analysts, and policymakers. This network links the Bank with universities,
think tanks, academic associations, other international organizations, donors, and elements of
civil society such as labor unions and chambers of commerce. The network aims to identify
knowledge gaps in the jobs agenda in developing countries, foster relevant research, link
research to policy, and disseminate best practices and innovations.
The JKP has three core objectives:
Making knowledge accessible: The JKP will mobilize leading academics and policy
analysts to build a virtual encyclopedia of issues related to job creation. This will take
the form of a Wiki bringing together insights from labor, finance, macro, industrial
organization, and trade economics as they pertain to firm growth, job creation, and
labor market outcomes. Beyond direct virtual access, the dissemination of best practices
will be supported by policy and technical notes, newsletters, and virtual lectures by
internationally renowned academics and policymakers.
45
Filling knowledge gaps by matching research to policy interests and developing
innovative, cross‐sectoral approaches. During an initial stage, the JKP will be used to
identify knowledge gaps. In a second stage, the JKP will mobilize resources for research
that can fill the knowledge gaps. This will be done by: (i) facilitating access and/or
supporting the collection of relevant data, such as panel surveys on labor market
outcomes; (ii) linking researchers and analysts, particularly between northern and
southern institutions; (iii) having prestigious scientific journals dedicate special issues to
specific research questions; (iv) creating fellowships and research grants; and (v)
organizing high level dissemination activities.
Enhancing the impact of knowledge on policy. Information and knowledge are
necessary but not sufficient to achieve successful reforms; more is needed to help
policymakers transform ideas and policy recommendations into new laws and programs.
Despite constraints related to the political economy of reform, the outcomes of a given
policy debate often depend on how issues are framed. Exposing stakeholders to the
experiences of other countries that have considered similar reforms can improve the
policy debate. The main contributions of the JKP to this process are to: (i) coordinate
discussion platforms where ongoing reforms are followed continuously, with
commentary from experts and stakeholders; (ii) facilitate South‐South partnerships
where experiences in the implementation of successful reforms can be shared; (iii)
disseminate knowledge about the experiences of successful reformers and reforms; and
(iv) use various international forums to bring together all the relevant actors for a given
theme.
5.2 Impact Evaluations
Policy interventions and programs that the Bank supports are increasingly subject to rigorous
evaluation. In the area of labor markets there have been important recent initiatives to
evaluate programs104 such as the Dominican Republic Youth Development Program; India’s
National Rural Employment Guarantee; Liberia’s Economic Empowerment of Adolescent Girls;
Malawi’s Apprenticeship Program and Entrepreneurial Support for Vulnerable Youth; South 104 Many of these impact evaluations were financed by the Spanish Impact Evaluation Fund.
46
Africa’s Wage Subsidy for Youth; Tunisia’s Turning Theses into Enterprises; Turkey’s ISKUR
Training Program; and Uganda’s Social Action Fund.
The goal moving forward is to mobilize resources to fund evaluations that provide information
not only about whether a given program makes a difference but also why and whether it is cost‐
effective. Key questions to be addressed are: how governance arrangements, delivery systems,
and choices about content affect the impact of a given program; how these effects change with
the target group and economic environment; and whether the time of exposure to the
interventions makes a difference. More attention will also be given to the value of the
economic costs and benefits of the various interventions.
Beyond the evaluation of government pilots or programs, resources should also be mobilized to
fund field experiments that can improve our knowledge of specific interventions. Experiments
can help understand, for example, how different incentives, targeted to different population
groups in different settings, can affect savings behaviors (see Section 4.4) or how changes in the
components of an entrepreneurship promotion program can affect entrepreneurial success
(see Section 4.1).
5.3 Data, Indicators, and Modeling Tools
Beyond program evaluation, good labor policy needs to start with a good assessment of labor
markets, a task constrained, in part, by limited data. For many countries, surveys that provide
labor market data (mainly household, labor force, and enterprise surveys) are either not
available or infrequently updated. Even among the countries that have surveys, individuals or
firms are usually not followed over time, making it impossible to observe labor market
transitions. Data about earnings, a primary indicator of the quality of a job, are also seldom
available for self‐employed workers. Looking forward, a three pillar strategy is proposed:
Improving labor market assessments and benchmarking. The proposal is to partner
with ongoing efforts to standardize and track the production of relevant labor market
data, and collaborate with the regions in the analysis of specific issues. While several
regions within the Bank are actively engaged in standardizing household survey data,

47
the most comprehensive collection of labor market data is the International Income
Distribution Database. This archive, which is maintained by the Development Research
Group, covers 251 surveys in 126 countries (Montenegro and Hirn 2009). The Labor
Team would complement these efforts by first creating and maintaining a small,
complementary database of standardized panel surveys that could be used to track
labor market transitions.105 The second step would be to establish, in consultation with
labor markets experts, the set of indicators that should be tracked and benchmarked at
both the macro and micro levels, beyond what is available in current databases such as
WBI and KILM. The various surveys in the databases could also be used to better
understand how observed policies and institutions are related to labor market
outcomes.
Upgrading estimates of recent labor market developments. Given frequent gaps in
labor market data within and across countries, it is important to improve the methods
used to impute missing data. Imputation techniques are widely used today by the
institutions managing databases on labor indicators. There are, however, concerns
regarding their reliability. The proposal is to launch a concerted effort with key internal
and external partners to further develop these techniques, building on recent
innovations.106
Strengthening countries’ LM information systems and survey instruments. Beyond
helping to mobilize resources to improve countries labor market information systems,
there is room to work on the improvement of current instruments. In particular, most
surveys do not collect information on the extent to which firms or workers comply with
labor market regulations (such as minimum wages, minimum labor standards, social
security contributions, and severance pay); individual job satisfaction and preferences
towards social security benefits; or sources of labor market information and job search
behavior. Although ad‐hoc initiatives have expanded and improved current instruments,
more systematic and coordinated efforts are needed.
105 This database on panel surveys of workers can be used to obtain a better understanding of labor market transitions and patterns of job creation and destruction. 106 See Margolis et al. (2010).

48
5.4 Operationalization of Key Labor Market Interventions
Ultimately, the impact that the Bank has in countries results from the quality of the operations it
supports and helps design; therefore, it is necessary to have more a systematic process to
disseminate and apply best practices. Even today, task team leaders rely mainly on their own
initiative and informal arrangements to learn about the design and implementation of
operations in other countries that are similar to the ones they are preparing (e.g., a training
project for vulnerable youth). The proposal looking forward is to (i) dedicate resources to create
an inventory of labor market interventions; and (ii) develop toolkits (i.e., operational manuals
and technical notes) to guide the design and implementation of the most promising operations.
5.5 Rethinking Training Activities
Training activities have been developed to inform interested parties about the many dimensions
of the jobs agenda, but these often sacrifice depth in exchange for breadth; going forward the
balance needs to change. The proposal is to complement the Labor Markets Core Course (LMCC)
with targeted, intensive training on the design and implementation of specific interventions.
The LMCC provided by the Social Protection Anchor could be shortened to give a general
perspective on labor market issues and policies. Other one or two week courses would be
provided on topics such as youth employment, design of unemployment benefits systems, or
the organization of employment services. These could be offered regionally, depending on the
policy priorities for given groups of countries, or could take the form of online courses – which
would expand their reach considerably. Additional resources would also need to be allocated to
assess the impact of these courses through more detailed surveys, evaluations, and the tracing
of participants.

49
APPENDIX 1: CLUSTER ANALYSIS
Cluster analysis is a statistical technique to reveal subgroups based on similarity without
imposing an a priori structure on the raw data. Groupings through cluster analysis are done in
such a way that observations in a cluster are similar to each other while those across different
clusters are dissimilar. By grouping the similar observations together and separating the
dissimilar ones, each group provides a concise description of similarities and differences in the
data.
There are several different methods to generate clusters from data, each depending on a
different measure of “distance” between data points within the cluster. The analysis
undertaken here uses the Euclidean distance as a measure of distance, and the Ward clustering
method to assign countries with similar experiences.107 The Euclidean distance between the
data from two countries X and Y is defined as , ∑ . Assuming that there are
1,2, … countries with 1,2, … variables for each country in cluster , and letting
the total number of clusters be , the Ward method assigns countries in each cluster by
minimizing the within cluster variance
2
111
,
where is within cluster mean of variable j over all countries in the cluster m.
Since the cluster analysis as used here aims to identify the countries that followed a similar
development path, focusing on labor market evolutions over time, variables that are thought to
affect the main labor market indicators are used for the purposes of clustering the countries. In
order to capture the differential growth rates of the size of labor force by gender and age group,
the percentage change in the population of each gender and age group (youth and adults) was
selected. Likewise, to capture the differential growth rates of employment by gender and age,
107 See Everitt et al. (2001) for a detailed explanation on cluster analysis, including different distance measures and methods.
50
the percentage changes of the size of the employed population are added. The analysis includes
the percentage growth in the number of people working in each sector (agriculture, industry,
and service) to reflect the structural transformation in the labor market, and the percentage
change in average years of schooling to consider the skills level of the workforce. Finally, to
capture the initial state of each country, average GDP per capita during the period of 1995‐1999
was also included.
The results of the cluster analysis identify four different development paths, as described in the
text.108 The extent of population aging or the size of the youth bulge, shifts from agriculture to
industry and to services, employment growth by gender and age, and progress in education, as
well as the initial GDP level are the determining features of each cluster. As the results show,
countries from different regions and income levels fall into the same cluster, meaning that they
share common patterns of labor market evolution. This suggests that simple grouping by the
region and income levels, although a natural first step, masks important heterogeneity within
regions or income levels, and commonality across regions and income levels, in the
development paths taken by each country.
While cluster analysis provides useful information on different development paths for countries
across different regions and income groups, there remain several caveats to this approach. First,
the results from cluster analysis can vary widely depending on the methods used, and the scale
and type of variables included. The analysis undertaken here is constrained in particular by the
availability of data, with the variables used being chosen so as to give as accurate a picture of
labor market changes as possible and balance orders of magnitude as much as possible while
limiting the number of countries eliminated due to missing data. Thus the grouping from this
exercise is not definitive, and a different set of variables could potentially lead to a different set
of development paths.
Also, the cluster analysis only groups countries by similarity of observed variables, and in no
way implies a causal relation between inputs and outcomes. Once the clusters have been
determined, descriptive statistics for other variables that were not used to establish
108 Detailed tables providing descriptive statistics for each cluster are presented in Appendix 2.

51
membership in the cluster, such as productivity growth, GDP, or National Income growth, or
poverty reduction, can be calculated. The discussion does not imply causality, but rather
considers how sets of variables move together on average for particular groups of countries. It
is important to remember that the stock‐taking and grouping of countries into development
paths is a descriptive exercise, and more detailed econometric analysis would be required to
determine a causal link between the inputs and outcomes as described in this paper.

52
APPENDIX 2: DETAILED STATISTICS FOR EACH CLUSTER
Table A2.1: Cluster 1 ‐ Middle Income, Rapid Growth, and Structural Change
Mean
Number
of
countries
Mean
Number
of
countries
Percent GDP per capita growth 33% 25 Percent Labor productivity Growth 24% 25
Percent GNI per capita growth 55% 25 Change in $2/day poverty rate ‐8.58 15
Baseline average GDP per capita 1224 25 Baseline average $2/day poverty rate 30% 20
Labor Force Unemployment
Percent population growth 12% 25Change in adult employment to working age
population ratio1.38 25
Percent working‐age population growth 19% 25Change in youth employment to working age
population ratio‐0.95 25
Percent youth population growth 15% 25 Change in youth unemployment rate ‐1.13 25
Change in female labor force participation 2.32 25
Change in youth labor force participation ‐1.77 25 Employment
Percent employment growth 21% 25
Skills Change in agricultural employment share ‐5.51 25
Change in average years of schooling 0.92 25 Change in public sector employment share ‐0.46 5
Change in percent literate 11.96 20Change in self, unpaid family and household
employment share0.37 10
East Asia & Pacific China, Indonesia, Philippines
Europe & Central Asia Albania, Armenia, Kazakhstan, Ukraine
Latin America & Caribbean Bolivia, Ecuador, Guatemala, Guyana, Hondouras, Paraguay, Peru
Middle East & North Africa Algeria, Egypt, Jordan, Morocco, Syria, Tunisia
South Asia India, Maldives, Sri Lanka
Sub‐Saharan Africa Swaziland, Namibia
Outcomes
Inputs
Countries
Sources: WDI, ILO‐KILM.
Notes: “Percentage growth” figures refer to percentage increase in 4‐year average value of the period 2005‐2008 relative to the 5‐year average
of values for the baseline period 1995‐1999. “Change” figures refer to percentage point change between comparison and baseline intervals.
Color code for countries based on income level in 2009: red=low income, blue=lower middle income and green=upper middle income.
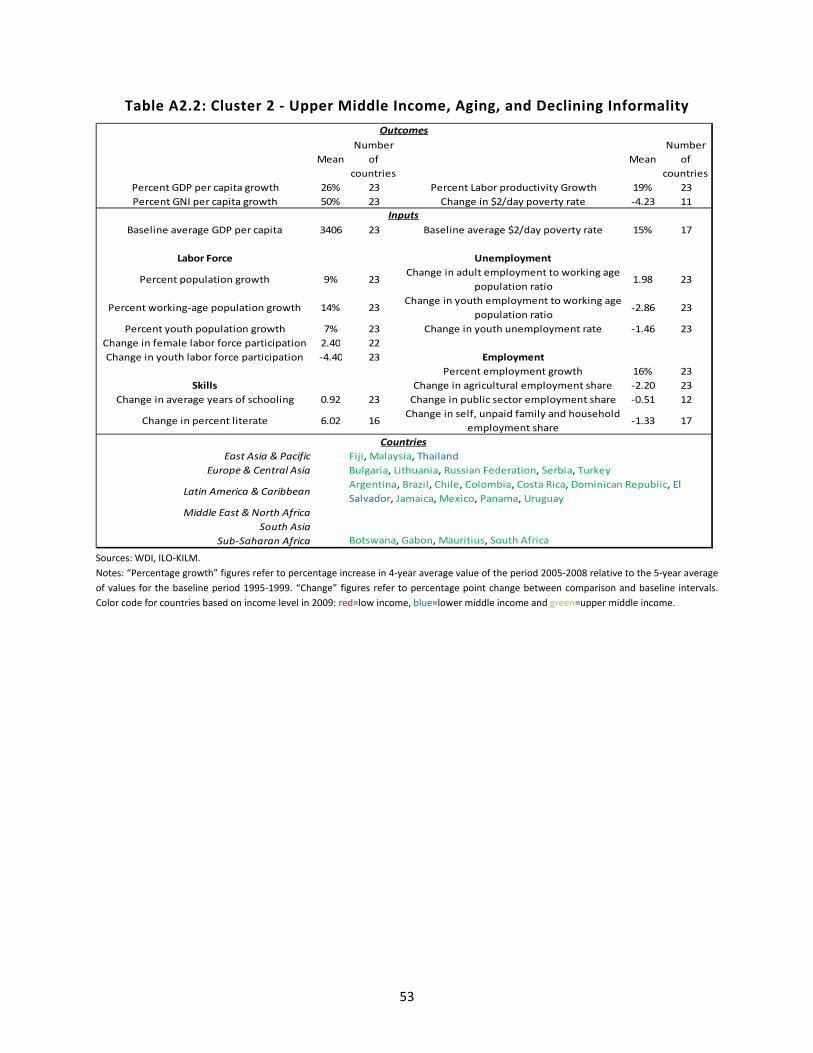
53
Table A2.2: Cluster 2 ‐ Upper Middle Income, Aging, and Declining Informality
Mean
Number
of
countries
Mean
Number
of
countries
Percent GDP per capita growth 26% 23 Percent Labor productivity Growth 19% 23
Percent GNI per capita growth 50% 23 Change in $2/day poverty rate ‐4.23 11
Baseline average GDP per capita 3406 23 Baseline average $2/day poverty rate 15% 17
Labor Force Unemployment
Percent population growth 9% 23Change in adult employment to working age
population ratio1.98 23
Percent working‐age population growth 14% 23Change in youth employment to working age
population ratio‐2.86 23
Percent youth population growth 7% 23 Change in youth unemployment rate ‐1.46 23
Change in female labor force participation 2.40 22
Change in youth labor force participation ‐4.40 23 Employment
Percent employment growth 16% 23
Skills Change in agricultural employment share ‐2.20 23
Change in average years of schooling 0.92 23 Change in public sector employment share ‐0.51 12
Change in percent literate 6.02 16Change in self, unpaid family and household
employment share‐1.33 17
East Asia & Pacific Fiji, Malaysia, Thailand
Europe & Central Asia Bulgaria, Lithuania, Russian Federation, Serbia, Turkey
Latin America & Caribbean
Middle East & North Africa
South Asia
Sub‐Saharan Africa Botswana, Gabon, Mauritius, South Africa
Outcomes
Inputs
Countries
Argentina, Brazil, Chile, Colombia, Costa Rica, Dominican Republic, El
Salvador, Jamaica, Mexico, Panama, Uruguay
Sources: WDI, ILO‐KILM.
Notes: “Percentage growth” figures refer to percentage increase in 4‐year average value of the period 2005‐2008 relative to the 5‐year average
of values for the baseline period 1995‐1999. “Change” figures refer to percentage point change between comparison and baseline intervals.
Color code for countries based on income level in 2009: red=low income, blue=lower middle income and green=upper middle income.

54
Table A2.3: Cluster 3 ‐ Very Low Income, Young, Balanced Employment Growth
Mean
Number
of
countries
Mean
Number
of
countries
Percent GDP per capita growth 23% 17 Percent Labor productivity Growth 18% 17
Percent GNI per capita growth 42% 17 Change in $2/day poverty rate ‐6.63 4
Baseline average GDP per capita 208.7 17 Baseline average $2/day poverty rate 85% 9
Labor Force Unemployment
Percent population growth 25% 17Change in adult employment to working age
population ratio0.83 17
Percent working‐age population growth 29% 17Change in youth employment to working age
population ratio0.13 17
Percent youth population growth 31% 17 Change in youth unemployment rate ‐0.36 17
Change in female labor force participation 1.23 17
Change in youth labor force participation 0.04 17 Employment
Percent employment growth 30% 17
Skills Change in agricultural employment share ‐4.08 17
Change in average years of schooling 0.73 17 Change in public sector employment share 0
Change in percent literate 15.57 8Change in self, unpaid family and household
employment share15.56 1
East Asia & Pacific Cambodia
Europe & Central Asia Tajikistan
Latin America & Caribbean
Middle East & North Africa
South Asia Bangladesh, Nepal
Sub‐Saharan Africa
Outcomes
Inputs
Countries
Burundi, Central African Republic, Ghana, Liberia, Malawi, Mali,
Mozambique, Niger, Rwanda, Sierra Leone, Togo, Uganada, Zambia Sources: WDI, ILO‐KILM.
Notes: “Percentage growth” figures refer to percentage increase in 4‐year average value of the period 2005‐2008 relative to the 5‐year average
of values for the baseline period 1995‐1999. “Change” figures refer to percentage point change between comparison and baseline intervals.
Color code for countries based on income level in 2009: red=low income, blue=lower middle income and green=upper middle income.
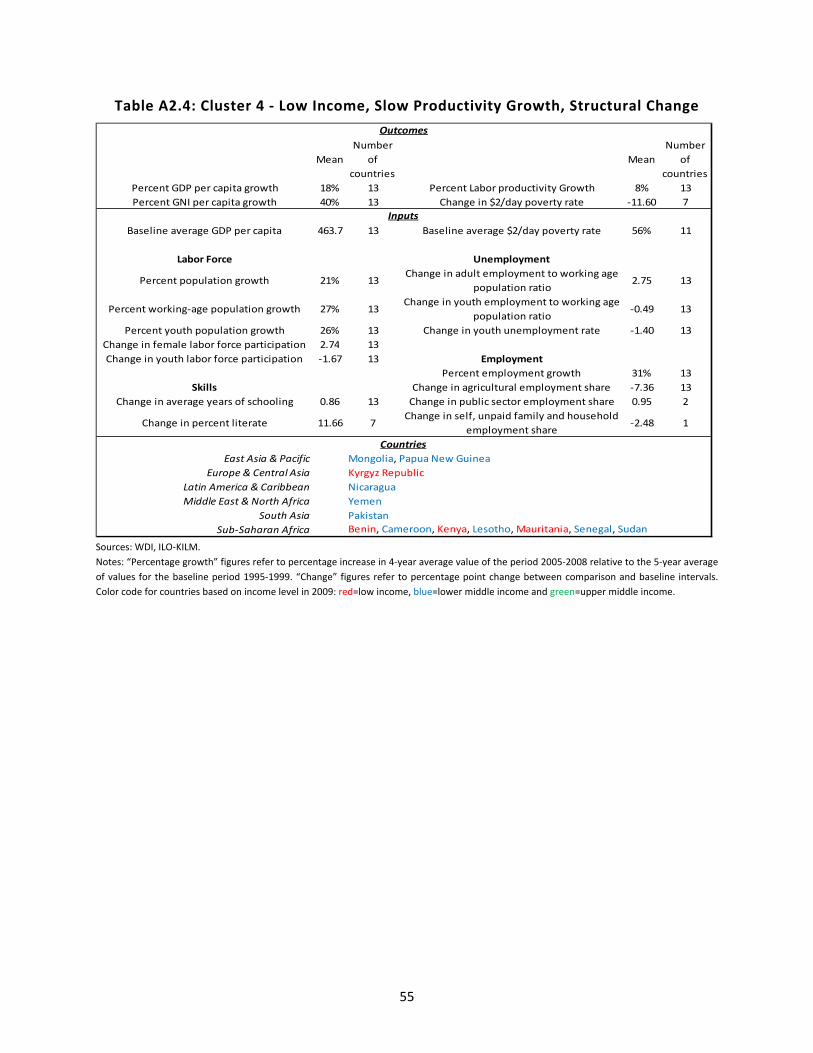
55
Table A2.4: Cluster 4 ‐ Low Income, Slow Productivity Growth, Structural Change
Mean
Number
of
countries
Mean
Number
of
countries
Percent GDP per capita growth 18% 13 Percent Labor productivity Growth 8% 13
Percent GNI per capita growth 40% 13 Change in $2/day poverty rate ‐11.60 7
Baseline average GDP per capita 463.7 13 Baseline average $2/day poverty rate 56% 11
Labor Force Unemployment
Percent population growth 21% 13Change in adult employment to working age
population ratio2.75 13
Percent working‐age population growth 27% 13Change in youth employment to working age
population ratio‐0.49 13
Percent youth population growth 26% 13 Change in youth unemployment rate ‐1.40 13
Change in female labor force participation 2.74 13
Change in youth labor force participation ‐1.67 13 Employment
Percent employment growth 31% 13
Skills Change in agricultural employment share ‐7.36 13
Change in average years of schooling 0.86 13 Change in public sector employment share 0.95 2
Change in percent literate 11.66 7Change in self, unpaid family and household
employment share‐2.48 1
East Asia & Pacific Mongolia, Papua New Guinea
Europe & Central Asia Kyrgyz Republic
Latin America & Caribbean Nicaragua
Middle East & North Africa Yemen
South Asia Pakistan
Sub‐Saharan Africa Benin, Cameroon, Kenya, Lesotho, Mauritania, Senegal, Sudan
Outcomes
Inputs
Countries
Sources: WDI, ILO‐KILM.
Notes: “Percentage growth” figures refer to percentage increase in 4‐year average value of the period 2005‐2008 relative to the 5‐year average
of values for the baseline period 1995‐1999. “Change” figures refer to percentage point change between comparison and baseline intervals.
Color code for countries based on income level in 2009: red=low income, blue=lower middle income and green=upper middle income.
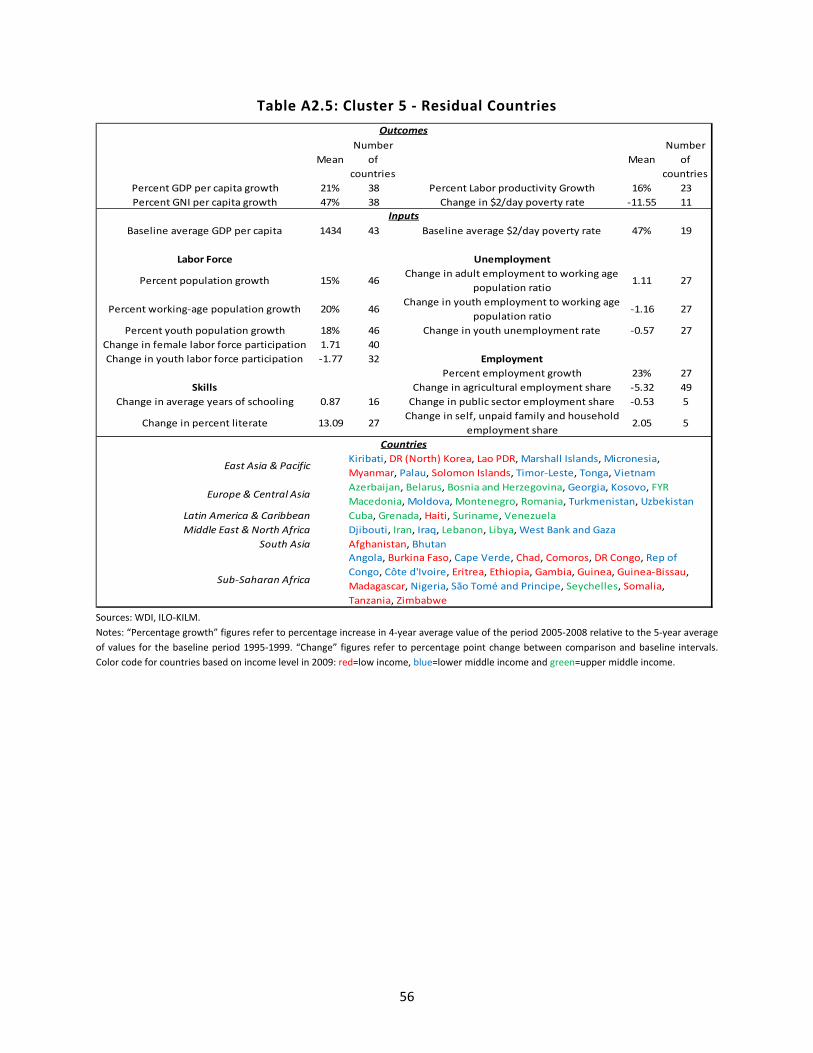
56
Table A2.5: Cluster 5 ‐ Residual Countries
Mean
Number
of
countries
Mean
Number
of
countries
Percent GDP per capita growth 21% 38 Percent Labor productivity Growth 16% 23
Percent GNI per capita growth 47% 38 Change in $2/day poverty rate ‐11.55 11
Baseline average GDP per capita 1434 43 Baseline average $2/day poverty rate 47% 19
Labor Force Unemployment
Percent population growth 15% 46Change in adult employment to working age
population ratio1.11 27
Percent working‐age population growth 20% 46Change in youth employment to working age
population ratio‐1.16 27
Percent youth population growth 18% 46 Change in youth unemployment rate ‐0.57 27
Change in female labor force participation 1.71 40
Change in youth labor force participation ‐1.77 32 Employment
Percent employment growth 23% 27
Skills Change in agricultural employment share ‐5.32 49
Change in average years of schooling 0.87 16 Change in public sector employment share ‐0.53 5
Change in percent literate 13.09 27Change in self, unpaid family and household
employment share2.05 5
East Asia & Pacific
Europe & Central Asia
Latin America & Caribbean Cuba, Grenada, Haiti, Suriname, Venezuela
Middle East & North Africa Djibouti, Iran, Iraq, Lebanon, Libya, West Bank and Gaza
South Asia Afghanistan, Bhutan
Sub‐Saharan Africa
Azerbaijan, Belarus, Bosnia and Herzegovina, Georgia, Kosovo, FYR
Macedonia, Moldova, Montenegro, Romania, Turkmenistan, Uzbekistan
Angola, Burkina Faso, Cape Verde, Chad, Comoros, DR Congo, Rep of
Congo, Côte d'Ivoire, Eritrea, Ethiopia, Gambia, Guinea, Guinea‐Bissau,
Madagascar, Nigeria, São Tomé and Principe, Seychelles, Somalia,
Tanzania, Zimbabwe
Outcomes
Inputs
Countries
Kiribati, DR (North) Korea, Lao PDR, Marshall Islands, Micronesia,
Myanmar, Palau, Solomon Islands, Timor‐Leste, Tonga, Vietnam
Sources: WDI, ILO‐KILM.
Notes: “Percentage growth” figures refer to percentage increase in 4‐year average value of the period 2005‐2008 relative to the 5‐year average
of values for the baseline period 1995‐1999. “Change” figures refer to percentage point change between comparison and baseline intervals.
Color code for countries based on income level in 2009: red=low income, blue=lower middle income and green=upper middle income.
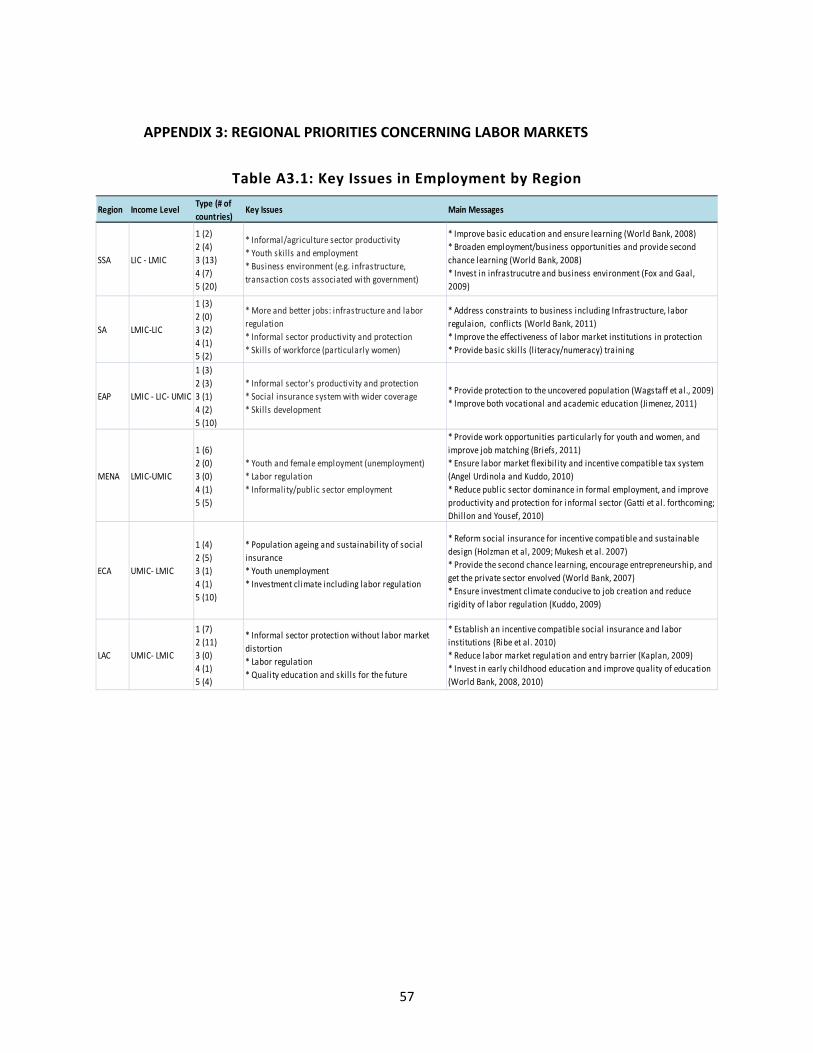
57
APPENDIX 3: REGIONAL PRIORITIES CONCERNING LABOR MARKETS
Table A3.1: Key Issues in Employment by Region
Region Income LevelType (# of
countries)Key Issues Main Messages
SSA LIC ‐ LMIC
1 (2)
2 (4)
3 (13)
4 (7)
5 (20)
* Informal/agriculture sector productivity
* Youth skil ls and employment
* Business environment (e.g. infrastructure,
transaction costs associated with government)
* Improve basic education and ensure learning (World Bank, 2008)
* Broaden employment/business opportunities and provide second
chance learning (World Bank, 2008)
* Invest in infrastrucutre and business environment (Fox and Gaal,
2009)
SA LMIC‐LIC
1 (3)
2 (0)
3 (2)
4 (1)
5 (2)
* More and better jobs: infrastructure and labor
regulation
* Informal sector productivity and protection
* Skil ls of workforce (particularly women)
* Address constraints to business including Infrastructure, labor
regulaion, conflicts (World Bank, 2011)
* Improve the effectiveness of labor market institutions in protection
* Provide basic skil ls (literacy/numeracy) training
EAP LMIC ‐ LIC‐ UMIC
1 (3)
2 (3)
3 (1)
4 (2)
5 (10)
* Informal sector's productivity and protection
* Social insurance system with wider coverage
* Skil ls development
* Provide protection to the uncovered population (Wagstaff et al., 2009)
* Improve both vocational and academic education (Jimenez, 2011)
MENA LMIC‐UMIC
1 (6)
2 (0)
3 (0)
4 (1)
5 (5)
* Youth and female employment (unemployment)
* Labor regulation
* Informality/public sector employment
* Provide work opportunities particularly for youth and women, and
improve job matching (Briefs, 2011)
* Ensure labor market flexibility and incentive compatible tax system
(Angel Urdinola and Kuddo, 2010)
* Reduce public sector dominance in formal employment, and improve
productivity and protection for informal sector (Gatti et al. forthcoming;
Dhillon and Yousef, 2010)
ECA UMIC‐ LMIC
1 (4)
2 (5)
3 (1)
4 (1)
5 (10)
* Population ageing and sustainabil ity of social
insurance
* Youth unemployment
* Investment climate including labor regulation
* Reform social insurance for incentive compatible and sustainable
design (Holzman et al, 2009; Mukesh et al. 2007)
* Provide the second chance learning, encourage entrepreneurship, and
get the private sector envolved (World Bank, 2007)
* Ensure investment climate conducive to job creation and reduce
rigidity of labor regulation (Kuddo, 2009)
LAC UMIC‐ LMIC
1 (7)
2 (11)
3 (0)
4 (1)
5 (4)
* Informal sector protection without labor market
distortion
* Labor regulation
* Quality education and skil ls for the future
* Establish an incentive compatible social insurance and labor
institutions (Ribe et al. 2010)
* Reduce labor market regulation and entry barrier (Kaplan, 2009)
* Invest in early childhood education and improve quality of education
(World Bank, 2008, 2010)

58
APPENDIX 4: SUMMARY OF THE WORLD BANK’S RECENT STUDIES BY TOPIC
Study/Report Region/Country Main Question Main Messages
Informality
Loayza and Rigolini (2006)
Global Cyclicality of informal sector.
Informal employment is in general counter‐cyclical, and the extent of counter‐cyclicality is lower with larger informal sector and better police and judicial services.
Perry et al. (2007) LAC
Informality: definition, motivation, dynamics, earnings, productivity, social protection, and institutions.
Not only from exclusion, but also an existing incentive is an important source of the expansion of informality. Policy suggestions include the following areas: (i) productivity for both formal and informal; (ii) social protection for all; (iii) formalization; (iv) enforcement; (v) legitimacy of the state.
World Bank (forthcoming‐a)
MENA Informality is examined in the context of the region's labor market, where the segmentation between the public and private sector, employment gap in gender, and youth bulge exist.
World Bank (forthcoming‐b)
ECA Institutions related to tax policy and administration, social insurance, and education may encourage workers to enter and stay in the informal sector, and the role of institutions will be examined.
Levy (2008) LAC The effect of providing benefits to the informal sector.
Adding a separate social policy for the informal sector is believed to unduly encourage a low productivity informal sector, intensify the segmentation of labor market, hamper economic growth, and do little to help reduce poverty.
Sakthivel and Joddar (2006)
India Social security coverage for the unorganized workforce in India.
The majority of the workforce in India works in unorganized sector and is not covered by social security.
Social Insurance
Holzman et al. (2009) Global Expanding social pension to those not covered.
Voluntary social insurance system, universal and delinked from work status, with financial incentives to increase the take up would be useful to reduce the coverage gap.
Wagstaff (2007) Global Social Health Insurance (SHI).
SHI does not necessarily bring better delivery and quality of health care. It provides little incentive for non‐poor informal sector to participate.
Hsiao, Shaw and Fraker (2007)
Global SHI in various developing countries.
Each country case shows policy considerations for each step of SHI from design, to implementation, to expansion, and to ultimately universal coverage.
Vodopivec (2009) Global Unemployment insurance Given large informal sector, weak administrative capacity, large political risks, and corruption in developing countries, this study suggests 5 adaptations from the standard UI system: (i) self‐insurance; (ii) simplified monitoring of job‐search

59
behavior; (iii) piggybacking the existing system; (iv) employer and employee as a main source of fund; and (v) modest benefits.
Ribe et al. (2010) LAC Social insurance including pension, unemployment, and health insurance as well as other protection measures.
Framework for social insurance for all (universal coverage), with adequate mandate system (well‐defined contribution and payment) and subsidy (redistribution) is suggested.
Rafael et al. (2008) LAC Coverage of pension programs in 18 countries in LAC.
The coverage of employed workers increases with income quintile and firm size; little progress was made from 1990s to 2000s.
World Bank (2003). ECA Old age pension. Pension expenditures, socioeconomic and demographic structure change, and EU integration require reform in pensions: parametric change diversifying the source of funding and paradigm change overhauling the system.
World Bank (2009) ECA Impacts of the great recession on pension system in ECA.
Given a larger challenge of demographic structure, the government is advised not to make any long term policy changes to address the short term fiscal concerns due to the great recession.
Mukesh et al. (2007) ECA Population aging and its implications on LM, financial market, pension system, public expenditure, and education.
In order to prevent old age poverty and facilitate consumption smoothing in the face of population aging, not only parametric reform but also substantial design change of pension systems should be considered.
World Bank, (2010a) China Social Health Insurance (SHI).
Integrating segmented medical insurance systems and setting up a monitoring framework is critical.
Wagstaff et al. (2009) China SHI. The impact evaluation of Chinese voluntary health insurance system shows that it has increased outpatient and inpatient utilization, and has reduced the cost of deliveries. But it has not reduced out‐of‐pocket expenses per outpatient visit or inpatient spell.
Thorton et al. (2010) Nicaragua Randomized experiments: Social health insurance.
The impact evaluation of voluntary social health insurance in Nicaragua shows that designing benefits and premiums conducive to take‐up is important.
Chetty and Looney (2005)
Indonesia Impacts of unemployment on consumption patterns.
Unlike the US, Indonesian households sacrifice human capital investment in response to unemployment.
ALMPs
Angel‐Urdinola and Kuddo (2010)
MENA Review of ALMPs for youth in MENA.
There are issues to be addressed in coordination, the type and objectives, targeting, accreditation, and monitoring and evaluation of the programs.

60
Card et al. (2011) Dominican Republic
Impact of classroom and private internship training on employability of low income, unskilled youth.
Negligible impacts on employment and positive effects on earnings (10%), but not significant.
Attanasio et al. (2008) Colombia 3 months in class + 3 months on‐the‐job training (OJT).
Significantly positive effects on employment and earnings for both males (8%) and females (18%), with larger impacts on females. Impacts from in class training but not from OJT.
Education
WDR (2007) Global Policies for youth with focus on school to work transition (education and labor market policy).
Great progress toward completion of primary schooling, but large dropout at secondary level and lack of basic skills even after completion of primary school poses new challenges.
World Bank (2010b) Global Early Childhood Development (ECD).
Guide provides: (i) existing information on the usefulness of ECD; (ii) practical information on recently relevant ECD topics, such as measuring child development outcomes and policy instruments; and (iii) latest evidence on intervention and major knowledge gaps.
World Bank (2007a) ECA Linking vocational education and labor market outcomes.
Reforming current vocational education system to improve efficiency is needed to improve quality.
World Bank (2010c) LAC Early Childhood Development (ECD)
Important to intervene during the window of opportunity from conception to 24 months.
World Bank (2008) Ghana and Pakistan
Education policy relevant for LM returns.
High returns to basic cognitive skills exist, especially in lower income countries. Not only increasing completion rate of primary schools (quantity) but also quality improvement to ensure skills development in primary school is also critical.
World Bank (2010d) Indonesia Education policy for transition to work and quality jobs.
Ensure basic quality and generic skills development in schools, rather than increasing the number of vocational schools.
Labor Market Regulation
Freeman (2009) Global Relationship between labor market institutions and economic performance.
It is not clear that the labor market institutions strongly affect economic performance.
Boeri et al. (2008) Global LM institutions and regulations, and functioning of LM (Minimum Wage (MW), Minimum Benefits(MB), Employment Protection Legislation (EPL), Unemployment Insurance Benefits(UIB)).
Theoretical background and international evidence of the effects of each institution and regulations on economic performance, to shed light on policies in developing countries.
Fox and Oviedo (2008)
AFR LM institutions and outcomes.
Labor institutions are not a main barrier to labor market outcomes. Used legal origin (former British colony or not) and Doing Business indicators to proxy for strict legal regulation.
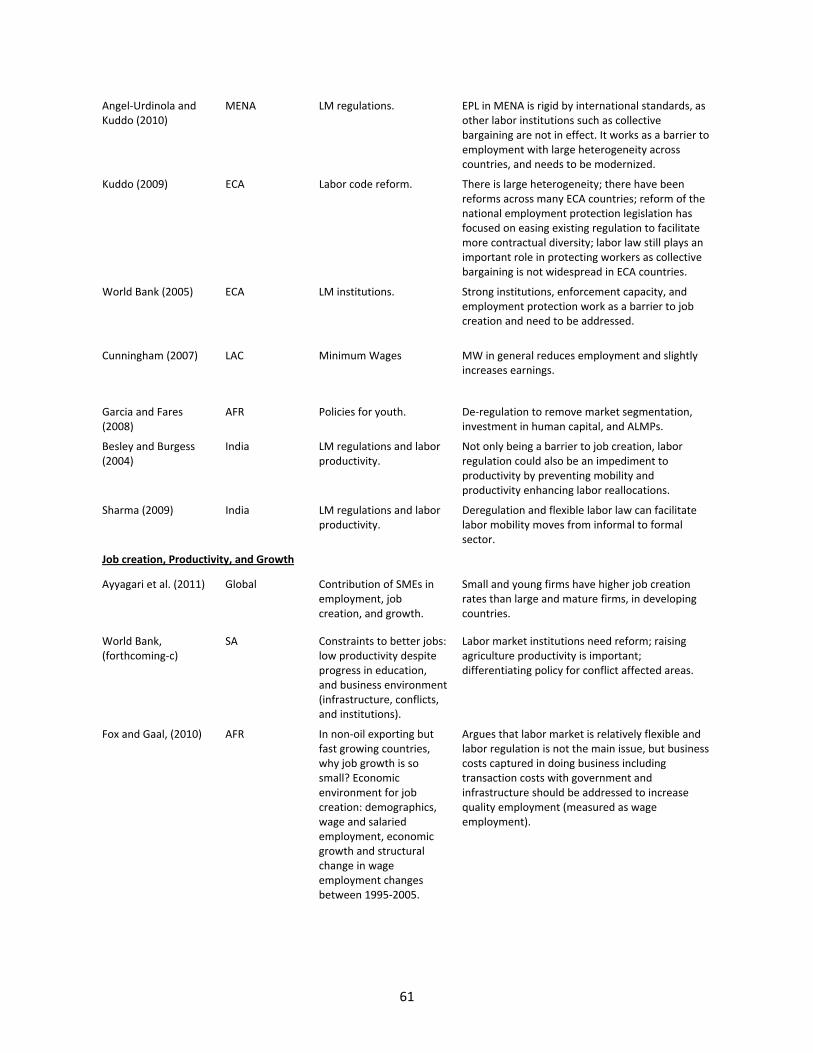
61
Angel‐Urdinola and Kuddo (2010)
MENA LM regulations. EPL in MENA is rigid by international standards, as other labor institutions such as collective bargaining are not in effect. It works as a barrier to employment with large heterogeneity across countries, and needs to be modernized.
Kuddo (2009) ECA Labor code reform. There is large heterogeneity; there have been reforms across many ECA countries; reform of the national employment protection legislation has focused on easing existing regulation to facilitate more contractual diversity; labor law still plays an important role in protecting workers as collective bargaining is not widespread in ECA countries.
World Bank (2005) ECA LM institutions. Strong institutions, enforcement capacity, and employment protection work as a barrier to job creation and need to be addressed.
Cunningham (2007) LAC Minimum Wages MW in general reduces employment and slightly increases earnings.
Garcia and Fares (2008)
AFR Policies for youth. De‐regulation to remove market segmentation, investment in human capital, and ALMPs.
Besley and Burgess (2004)
India LM regulations and labor productivity.
Not only being a barrier to job creation, labor regulation could also be an impediment to productivity by preventing mobility and productivity enhancing labor reallocations.
Sharma (2009) India LM regulations and labor productivity.
Deregulation and flexible labor law can facilitate labor mobility moves from informal to formal sector.
Job creation, Productivity, and Growth
Ayyagari et al. (2011) Global Contribution of SMEs in employment, job creation, and growth.
Small and young firms have higher job creation rates than large and mature firms, in developing countries.
World Bank, (forthcoming‐c)
SA Constraints to better jobs: low productivity despite progress in education, and business environment (infrastructure, conflicts, and institutions).
Labor market institutions need reform; raising agriculture productivity is important; differentiating policy for conflict affected areas.
Fox and Gaal, (2010) AFR In non‐oil exporting but fast growing countries, why job growth is so small? Economic environment for job creation: demographics, wage and salaried employment, economic growth and structural change in wage employment changes between 1995‐2005.
Argues that labor market is relatively flexible and labor regulation is not the main issue, but business costs captured in doing business including transaction costs with government and infrastructure should be addressed to increase quality employment (measured as wage employment).

62
World Bank (2005) ECA Productivity, investment climate, and labor market institutions and job creation.
Increasing pace of job creation and facilitating the reallocation of jobs and workers to more productive sector is needed.
IADB(2009) LAC Long term dynamics of employment, jobless growth, low productivity growth, regulation for worker protection, social security, main barriers to firms' growth (constraints in investment climate), and role of regulation.
Creation of good jobs: business environment, protection against unemployment, ALMPs, and improving quality of jobs.
Kaplan (2009) LAC Effects of labor regulation reform on job creation.
Labor regulation reform increased overall employment, and in particular, small firms benefited more.
World Bank (2007b) MENA Job creation. With continued economic growth, employment increased with a large increase in working age population. It is important to create jobs in more productive areas.
World Bank (2010e) India Low productivity informal, dual formal, regional differences, labor regulations, and ALMP.
Regulatory reforms and active labor market policies are particularly important for job creation.
World Bank (2010f) Indonesia Labor market regulation, skills development, safety net.
More unemployment benefits and lower severance payments; quality improvement in vocational schools and additional training facilities for a second chance; more inclusive social protection rather than focusing on formal sectors.
World Bank (2010g) Nigeria Employment growth. Building enterprise sector, productivity and skills, trades.
63
REFERENCES
Addison, J. and J.‐L. Grosso. 1996. “Job Security Provisions and Employment: Revised Estimates,”
Industrial Relation 35(4).
Aghion, P., N. Bloom, R. Blundell, R. Griffith, and P. Howitt. 2005. “Competition and Innovation:
An Inverted‐U Relationship,” Quarterly Journal of Economics 120(2).
Aghion, P., L. Boustan, C. Hoxby, and J. Vandenbussche. 2008. “The Causal Impact of Education
on Economic Growth: Evidence from U.S.” Brookings Papers on Economic Activity. Washington,
DC: Brookings Institution.
Almeida, R., J. Arbelaez, M. Honorati, A. Kuddo, T. Lohmann, M. Ovadiya, L. Pop, M.L. Sanchez
Puerta, and M. Weber. 2011. “Improving Employability and Earning Opportunities: The Role of
Activation and Graduation Programs,” Social Protection and Labor Discussion Series.
Washington DC: World Bank. Draft.
Almeida, R. and E. Galasso. 2009. “Jump‐starting Self‐employment? Evidence for Welfare,”
World Development 38(5).
Almedia, R., J. Berhman, and D. Robalino. 2012. Taking Stock of Skills Development Strategies
and Moving Ahead. Washington, DC: World Bank. Forthcoming.
Angel‐Urdinola, D. and A. Kuddo. 2010. “Non‐public Provision of Active Labor Market Programs
in Arab‐Mediterranean Countries: An Inventory of Youth Programs.” Social Protection
Discussion Paper 1005. Washington DC: World Bank.
Attanasio, O., A. Kugler, and C. Meghir. 2008. “Subsidizing Vocational Training for
Disadvantaged Youth in Developing Countries: Evidence from a Randomized Trial.” IZA Working
Paper 4251. Bonn, Germany: Institute for the Study of Labor.
Autor, D., F. Levy, and R. Murnane. 2003. “The Skill Content of Recent Technological Change: An
Empirical Exploration,” Quarterly Journal of Economics 118(4).
Ayyagari, M., A. Demirgüç‐Kunt, and V. Maksimovic. 2006. “How Important are Financing
Constraints? The Role of Finance in the Business Environment.” World Bank Policy Research
Working Paper 3820. Washington DC: World Bank.
—. 2011. “Young vs. Small Firms across the World: Contribution to Employment, Job Creation,
and Growth.” World Bank Policy Research Working Paper 5631. Washington DC: World Bank.
64
Banerjee, A., E. Duflo, R. Glennerster, and C. Kinnan. 2009. “The Miracle of Microfinance?
Evidence from a Randomized Evaluation.” IMF Research Working Paper 31. Washington DC:
International Monetary Fund.
Banerji, A., R. Holzmann, P. Paci, C. Pages, S. Scarpetta, and M. Vodopivec. 2008. “Miles to Go:
A Quest for an Operational Labor Market Paradigm for Developing Countries.” Social Protection
and Labor note. Washington DC: World Bank.
Barr, N. 2004. Economics of the Welfare State. Oxford: Oxford University Press.
Baumol, W. 1967. “Macroeconomics of Unbalanced Growth: The Anatomy of Urban Crisis,”
American Economic Review 57(3).
Belsky, J., M. Bakermans‐Kranenburg, and M. van Ijzendoorn. 2007. “For Better and For Worse:
Differential Susceptibility to Environmental Influences,” Current Directions in Psychological
Science 16(6).
Belsky, J. and M. Pluess. 2009. “The Nature (and Nurture?) of Plasticity in Early Human
Development,” Perspectives on Psychological Science 4(4).
Besley, T. and R. Burgess. 2004. “Can Labor Regulation Hinder Economic Performance?
Evidence From India,” Quarterly Journal of Economics 119(1).
Biggs, J. 1999. Teaching for Quality Learning at University. New York: Society for Research into
Higher Education and Open University Press.
Bjorvatn, K. and B. Tungodden. 2010. “Teaching Business in Tanzania: Evaluating Participation
and Performance,” Journal of the European Economic Association 8(2‐3).
Bloom, N., B. Eifert, A. Mahajan, D. McKenzie, and J. Roberts. 2011. "Does Management Matter?
Evidence from India.” NBER Working Paper 16658. Cambridge, Mass.: National Bureau of
Economic Research.
Boeri, T., B. Helppie, and M. Macis. 2008. “Labor Regulations in Developing Countries: A Review
of the Evidence and Directions for Future Research.” World Bank Social Protection Discussion
Paper 0833. Washington DC: World Bank.
Boissiere, M. 2004. Determinants of Primary Education Outcomes in Developing Countries.
Washington DC: World Bank. Draft.
Bowles, S. and H. Gintis. 1976. Schooling in Capitalist America. New York: Basic Books.
65
Branstetter, L., F. Lima, L. Taylor, and A. Venâncio. 2010. “Do Entry Regulations Deter
Entrepreneurship and Job Creation? Evidence from Recent Reforms in Portugal.” NBER Working
Paper 16473. Cambridge, Mass.: National Bureau of Economic Research.
Bruhn, M. 2011. “License to Sell: The Effect of Business Registration Reform on Entrepreneurial
Activity in Mexico,” Review of Economics and Statistics 93(1).
Bruhn, M. and B. Zia. 2011. “Business and Financial Literacy for Young Entrepreneurs: Evidence
from Bosnia‐Herzegovina.” World Bank Policy Research Working Paper 5642. Washington DC:
World Bank.
Bruhn, M., D. Karlan, and A. Schoar. 2010. “What Capital is Missing in Developing Countries,”
American Economic Review: Papers & Proceedings 100(3).
Cappelli, P. 2000. “Examining the Incidence of Downsizing and Its Effect on Establishment
Performance.” In D. Neumark (ed.), On the Job. New York: Russell Sage Foundation.
Castillo, V., A. Maffioli, A. Monsalvo, S. Rojo, and R. Stucchi. 2010. "Can SME Policies Improve
Firm Performance? Evidence from an Impact Evaluation in Argentina." OVE Working Papers
0710. Washington DC: Inter‐American Development Bank.
Card, D., P. Ibarraran, F. Regalia, D. Rosas, and Y. Soares. 2011. “The Impacts of Youth Training
in the Dominican Republic,” Journal of Labor Economics 29(2).
Card, D. and A.Krueger. 1997. Myth and Measurement: The New Economics of the Minimum
Wage. Princeton: Princeton University Press.
Carneiro, P. and J.Heckman. 2003. “Human Capital Policy.” IZA Discussion Papers 821. Bonn,
Germany: Institute for the Study of Labor. Bonn, Germany: Institute for the Study of Labor.
Chawla, M., G. Betcherman, and A. Banerji. 2007. From Red to Gray: The “Third Transition” of
Aging Populations in Eastern Europe and the Former Soviet Union. Washington, DC: World Bank.
Chetty, R. and A. Looney. 2005. “Income Risk and the Benefits of Social Insurance: Evidence
from Indonesia and the US.” NBER Working Paper 11708. Cambridge, Mass.: National Bureau of
Economic Research.
Cho, Y., X. Del Carpio, A. Kuddo, D. Margolis, and D. Robalino. 2010. “A Minimum Wage in
Malaysia: Issues to Consider Before Implementation.” Washington DC: World Bank. Draft.
Cho, Y. and D. Newhouse. 2011. “How Did the Great Recession Affect Different Types of
Workers? Evidence from 17 Middle‐Income Countries,” World Bank Policy Research Working
Paper 5636. Washington DC: World Bank.

66
Ciavarella. M., A. Buchholtz, C. Riordan, R. Gatewood, and G. Stokes. 2004. “The Big Five and
Venture Survival: Is There a Linkage?” Journal of Business Venturing 19(4).
Crockett, L. and R. Silbereisen. 2000. Negotiating Adolescence in Times of Social Change.
Cambridge: Cambridge University Press.
Cunha, F., J. Heckman, L. Lochner, and D. Masterov. 2005. “Interpreting the Evidence on Life
Cycle Skill Formation.” NBER Working Paper 11331. Cambridge, Mass.: National Bureau of
Economic Research.
Cunningham, W. 2007. Minimum Wages and Social Policy: Lessons from Developing Countries.
Washington, DC: World Bank.
Cunningham, W., M.L. Sanchez Puerta, and A. Wuermli. 2010. “Active Labor Market Programs
for Youth: A Framework to Guide Youth Employment Interventions.” World Bank Employment
Policy Primer 16. Washington DC: World Bank.
Demirgüç‐Kunt, A. and V. Maksimovic. 1998. “Law Finance and Firm Growth,” Journal of
Finance 53(6).
Dhillon, N. and T. Youssef (eds.). 2009. Generation in Waiting: The Unfulfilled Promise of Young
People in the Middle East. Washington, DC: Brookings Institution.
Duarte, M. and D. Restuccia. 2010. "The Role of the Structural Transformation in Aggregate
Productivity," Quarterly Journal of Economics 125(1).
Drexler, A., G. Fisher, and A. Schoar. 2011. “Keeping It Simple: Financial Literacy and Rules of
Thumb.” CEPR Discussion Paper 7994. London: Centre for Economic Policy Research.
Elmeskov, J., J. Martin, and S. Scarpetta. 1998. “Key Lessons for Labour Market Reforms:
Evidence from OECD Countries Experience,” Swedish Economic Policy Review 5(2).
Everitt, B., S. Landau, and M. Leese. 2001. Cluster Analysis. Oxford, Oxford University Press.
Fisman, R. and J. Svensson. 2007. “Are Corruption and Taxation Really Harmful to Growth? Firm
Level Evidence,” Journal of Development Economics 83(1).
Forteza, Á. 2010. “The Portability of Pension Rights: General Principles and the Caribbean Case,”
Development Policy Review 28(2).
Fox, M. and A.M. Oviedo. 2008. Institutions and Labor market outcomes in Sub Saharan Africa.
Washington DC: World Bank.
67
Fox, M. and M. Sekkel Gaal. 2010. Working Out of Poverty: Job Creation and the Quality of
Growth in Africa. Washington, DC: World Bank.
Freeman, R. 2009. “Labor Regulations, Unions, and Social Protection in Developing Countries:
Market distortions or Efficient Institutions?” NBER Working Paper 14789. Cambridge, Mass.:
National Bureau of Economic Research.
Galindo, A. and A. Micco. 2005. “Bank Credit to Small and Medium‐Sized Enterprises: The Role
of Creditor Protection.” Documentos de Trabajo. Santiago: Banco Central de Chile, 347.
Garcia, M. and J. Fares. 2008. Youth in Africa's Labor Market. Washington, DC: World Bank.
Glewwe, P. and M. Kremer. 2006. "Schools, Teachers, and Education Outcomes in Developing
Countries." In E. Hanushek and F. Welch (eds.). Handbook of the Economics of Education. New
York: Elsevier.
Goldin, C. and L. Katz. 2007. “Long‐Run Changes in the Wage Structure: Narrowing, Widening,
Polarizing.” Brookings Papers on Economic Activity. Washington, DC: Brookings Institution.
Gonzaga, G. 2003. “Labor Turnover and Labor Legislation in Brazil,” Economia 4(1).
Hallward‐Driemeier, M. and F. Thompson. 2009. "Creative Destruction and Policy Reforms:
Changing Productivity Effects of Firm Turnover in Moroccan Manufacturing." World Bank Policy
Research Working Paper 5085. Washington DC: World Bank.
Hallward‐Driemeier, M. and L. Pritchett. 2011. "How Business Is Done and the 'Doing Business'
Indicators : The Investment Climate When Firms Have Climate Control." World Bank Policy
Research Working Paper 5563. Washington DC: World Bank.
Haltiwanger, J., S. Scarpetta, and H. Schweiger. 2008. “Assessing Job Flows Across Countries:
The Role of Industry, Firm Size and Regulations.” NBER Working Paper 13920. Cambridge, Mass.:
National Bureau of Economic Research.
Haltiwanger, J., R. Jarmin, and J. Miranda. 2010. “Who Creates Jobs? Small vs. Large vs. Young.”
NBER Working Paper 16300. Cambridge, Mass.: National Bureau of Economic Research.
Hanushek, E. and D. Kimko. 2000. “Schooling, Labor‐Force Quality, and the Growth of Nations,”
American Economic Review 90(5).
Hanushek, E. and L. Woessmann. 2007. “The Role of Education Quality for Economic Growth.”
World Bank Policy Research Working Paper 4122. Washington DC: World Bank.
68
Hausmann, R. 2008. “The Other Hand: High Bandwidth Development Policy,” Center for
International Development (CID) Working Paper 179. Cambridge, Mass.: Harvard University.
Heckman, J., J. Stixrud, and S. Urzua. 2006. “The Effects of Cognitive and Noncognitive Abilities
on Labor Market Outcomes and Social Behavior,” Journal of Labor Economics 24(3).
Heckman, J. and D. Masterov. 2007. “The Productivity Argument for Investing in Young
Children,” Review of Agricultural Economics 29(3).
Helpman, E. 1992. "Endogenous Macroeconomic Growth Theory" European Economic Review
36(2‐3).
Helpman, E. 2010. "Labor Market Frictions as a Source of Comparative Advantage, with
Implications for Unemployment and Inequality," NBER Working Papers 15764. Cambridge,
Mass.: National Bureau of Economic Research.
Hobjin, B. and B. Jovanovic. 2001. "The Information Technology Revolution and the Stock
Market: Evidence," American Economic Review 91(5).
Holzer, H. 1991. “The Spatial Mismatch Hypothesis: What Has the Evidence Shown?” Urban
Studies 28(1).
Holzmann, R., D. Robalino, and N. Takayama. 2009. Closing the Coverage Gap, The Role of
Social Pensions and Other Retirement Income Transfers. Washington, DC: World Bank.
Hsiao, W., R. Shaw, and A. Fraker. 2007. Social Health Insurance for Developing Nations.
Washington, DC: World Bank.
Hopenhayn, H. and R. Rogerson. 1993. “Job Turnover and Policy Evaluation: A General
Equilibrium Analysis,” Journal of Political Economy 101(5).
IADB. 2009. Job Creation in Latin America and Caribbeab: Recent Trends and Policy Challenges.
Washington, DC: Inter‐American Development Bank.
Ibarraran, P. and D. Rosas. 2009. “Evaluating the Impact of Job Training Programs in Latin
America: Evidence from IDB Funded Operations,” Journal of Development Effectiveness 1(2).
ILO. 2008. Global Employment Trends for Youth. Geneva; International Labour Office.
Jasso, G., D. Massey, M. Rosenzweig, and J. Smith. 2000. “The New Immigrant Survey Pilot (NIS‐
P): Overview and New Findings about U.S. Legal Immigrants at Admission,” Demography 37(1).
Kahn, L. 2010. “The Long Term Consequences of Graduating from College During a Bad
Economy”, Labour Economics 17(2).

69
Kaplan, D. 2009. “Job Creation and Labor Reform in Latin America,” Journal of Comparative
Economics 37(1).
Karlan, D. and M. Valdivia. 2011. “Teaching Entrepreneurship: Impact of Business Training on
Microfinance Clients and Institutions,” The Review of Economics and Statistics 93(2).
Klapper, L. and I. Love. 2010. "The Impact of Business Environment Reforms on New Firm
Registration." World Bank Policy Research Working Paper 5493. Washington DC: World Bank.
Klapper, L., L. Laeven, and R. Rajan 2004. “Business Environment and Firm Entry: Evidence from
International Data.” NBER Working Paper 10380. Cambridge, Mass.: National Bureau of
Economic Research.
Kolko, J., D. Neumark, and M. Cuellar Mejia. 2011. “Public Policy, State Business Climates, and
Economic Growth,” NBER Working Paper 16968. Cambridge, Mass.: National Bureau of
Economic Research.
Krueger, A. and M. Lindahl. 2001. "Education for Growth: Why and for Whom?" Journal of
Economic Literature 39(4).
Kuddo, A. 2009. “Labor Laws in Eastern European and Central Asian Countries: Minimum Norms
and Practices.” World Bank Social Protection Discussion Paper 0920. Washington DC: World
Bank.
Kuddo, A., K. Otoo, A. Posarac, D. Robalino, F. Rother, and M. Weber. 2011. Toward Starter
Labor Regulations and Social Insurance: Protecting Workers While Creating (Good) Jobs.
Washington DC: World Bank. Draft.
Kugler, A. 1999. “The Impact of Firing Costs on Turnover and Unemployment: Evidence from
the Colombian Labour Market Reform,” International Tax and Public Finance 6(4).
Lam, D., M. Leibbrandt, and C. Mlatsheni. 2008. “Education and Youth Unemployment in South
Africa” Southern Africa Labour and Development Research Unit Working Paper 22. Cape Town:
University of Cape Town.
Lazear, E. 1990. “Job Security Provisions and Employment,” The Quarterly Journal of Economics
105(3).
Levinsohn, J. and T. Pugatch. 2011. “The Role of Reservation Wages in Youth Unemployment in
South Africa: A Structural Approach,” New Have: Yale University. Draft.
Levy, S. 2008. Good Intentions, Bad Outcomes: Social Policy, Informality, and Economic Growth
in Mexico. Washington DC: Brookings Institution.
70
Lim, L.L. 2009. "Female Labour Force Participation." In Completing the Fertility Transition. New
York: United Nations.
Lin, J.Y. and C. Monga. 2010. “Growth Identification and Facilitation: The Role of the State in the
Dynamics of Structural Change,” World Bank Policy Research Working Paper 5513. Washington
DC: World Bank.
Loayza, N. and J.Rigolini. 2006. “Informality Trends and Cycles,” World Bank Policy Research
Working Paper 4078. Washington DC: World Bank.
Margolis, D., D. Newhouse, and M. Weber. 2010. “What’s Happening Now? Model‐Based
Imputation of Low‐Frequency Variables in Macroeconomic Panel Data (ITSEM).” Washington DC:
World Bank. Draft.
Margolis, D., V. Simonnet and L. Vilhuber. 2001. “Early Career Experiences and Later Career
Outcomes: Comparing the United States, France and Germany,” Vierteljahrshefte zur
Wirtschaftsforschung 70(1): 31‐38.
Manning, A. 2003. Monopsony in Motion: Imperfect Competition in Labor Markets. Princeton:
Princeton University Press.
Mansuri, G. and X. Gine. 2011. “Money or Ideas? A Field Experiment on Constraints to
Entrepreneurship in Rural Pakistan,” Washington DC: World Bank. Draft.
Masten, A., K. Best and N. Garmezy. 1990. “Resilience and Development: Contributions from
the Study of Children who Overcome Adversity,” Development and Psychopathology 2(4).
Masten, A. and J. Obradovic. 2006. “Competence and Resilience in Development.” Annals of the
New York Academy of Sciences 1094. New York: The Rockefeller University.
McKenzie, D., J. Gibson, and S. Stillman. 2010. “How Important is Selection? Experimental vs.
Non‐Experimental Measures of the Income Gains from Migration,” Journal of the European
Economic Association 8(4).
McLoyd, V., R. Kaplan, K. Purtell, E. Bagley, C. Hardaway, and C. Smalls. 2009. “Poverty and
Socioeconomic Disadvantage in Adolescence.” In R. Lerner and L. Steinberg (eds.), Handbook of
Adolescent Psychology (3rd ed.), Volume 1. New Jersey: John Wiley & Sons Inc.
Montenegro, C. and M. Hirn. 2008. “A New Disaggregated Set of Labor Market Indicators Using
Standardized Household Surveys from Around the World.” World Development Report 2009
Background Paper. Washington DC: World Bank.

71
Montenegro, C. and C. Pages. 2004. "Who Benefits from Labor Market Regulations? Chile 1960‐
1998" NBER Working Papers 9850. Cambridge, Mass.: National Bureau of Economic Research.
Oosterbeek, H., M. van Praag, and A Ijsselstein. 2010. “The Impact of Entrepreneurship
Education on Entrepreneurship Skills and Motivation,” European Economic Review 54(3).
Oreopolous, P., T von Wachter, and A Heisz. 2011. “The Short and Long‐term Career Effects of
Graduating in a Recession,” American Economic Journal: Applied Economics 4(1).
Perry, G., W. Maloney, O. Arias, P. Fajnzylber, A. Mason, and J. Saavedra‐Chanduvi. 2007.
Informality: Exit and Exclusion. Washington, DC: World Bank.
Ribe, H., D. Robalino, and I Walker. 2010. Protection for All in Latin America and Caribbean from
Right to Reality. Washington, DC: World Bank.
Robalino, D., L. Rawlings, and I. Walker. 2012. Building Social Protection and Labor Systems,
Concepts and Operational Implications, Background Paper for the World Bank 2010‐2022 Social
Protection and Labor Strategy. Washington DC: World Bank.
Robalino, D., M. Di Filippo, T. Lohmann, and D.Margolis, 2012. “Skills toward Employment and
Productivity,” in More and Better Jobs in South Asia. Washington, DC: World Bank. Forthcoming.
Robalino, D., F. Rother, and D. Newhouse. 2011. “Labor Markets in the Aftermath of the Crisis,”
Social Protection and Labor Brief. Washington DC: World Bank.
Robalino, D., M. Vodopivec, and A. Bodor. 2009. “Savings for Unemployment in Good or Bad
Times: Options for Developing Countries,” IZA Discussion Paper 4516. Bonn, Germany: Institute
for the Study of Labor.
Robalino, D., E. Whitehouse, A. Mataoanu, A. Musalem, E. Sherwood, and O. Sluchynsky. 2005.
Pensions in the Middle East and North Africa: Time for Change. Munich: University Library of
Munich.
Roberts, B., A. Caspi, and T. Moffitt. 2003). “Work experiences and personality development in
young adulthood,” Journal of Personality and Social Psychology 84(3).
Robins, R., R. Fraley, B. Roberts, and K. Trzesniewski. 2001. “A Longitudinal Study of Personality
Change in Young Adulthood,” Journal of Personality 69(4).
Rofman, R., L. Lucchetti, and G. Ourens. 2008. "Pension Systems in Latin America: Concepts and
Measurements of Coverage." Social Protection Discussion Paper 0616. Washington DC: World
Bank.

72
Saavedra, J. and M. Torero. 2000. “Labor Market Reforms and Their Impact on Formal Labor
Demand and Job Market Turnover: The Case of Peru.” IDB Working Paper 121. Washington DC:
Inter‐American Development Bank.
Sakthivel, S. and P. Joddar. 2006. “Unorganized Sector Workforce in India: Trends, Patterns, and
Social Security Coverage,” Economic and Political Weekly 41(21).
Scarpetta, S. and T. Tressel. 2004. “Boosting Productivity via Innovation and Adoption of New
Technologies: Any Role for Labor Market Institutions?” World Bank Social Protection Discussion
Paper 0406. Washington DC: World Bank.
Sharma, S. 2009. “Entry Regulation, Labor Laws and Informality,” World Bank Policy Research
Working Paper 48927. Washington DC: World Bank.
Skoufias, E., K. Lindert, and J. Sapiro. 2009. Globalization and the Role of Public Transfers in
Redistributing Income in Latin America and the Caribbean. New York: United Nations University.
Draft.
Tatsiramos, K. 2010. “Unemployment Insurance in Europe: Unemployment Duration and
Subsequent Employment Stability,” Journal of the European Economic Association 7(6).
Thorton, R., L. Hatt, E. Field, M. Islam, F. Solis Diaz, M. González. 2010. "Social Security Health
Insurance for the Informal Sector in Nicaragua: A Randomized Evaluation," Health Economics
19(2).
Vandenbussche, J., P. Aghion, and C. Meghir. 2004. “Growth, Distance to Frontier and
Composition of Human Capital,” Journal of Economic Growth 11(2).
Vodopivec, M. 2009. “Introducing Unemployment Insurance to Developing Countries,” Social
Protection Discussion Paper 0907. Washington DC: World Bank.
Wagstaff, A. 2007. "Social Health Insurance Reexamined." World Bank Policy Research Working
Paper 4111. Washington DC: World Bank.
Wagstaff, A., M. Lindelow, J. Gao, L. Xu, and J. Qian. 2009. “Extending Health Insurance to the
Rural Population: An Impact Evaluation of China's New Cooperative Medical Scheme,” Journal
of Health Economics 28(1).
World Bank. 2003. Pension Reform in Europe: Process and Progress. Washington DC.
—. 2005. Enhancing Job Opportunities: Eastern Europe and Former Soviet Union. Washington
DC.

73
—. 2006. World Development Report 2007: Development and the Next Generation.
Washington DC.
—. 2007a. Vocational Education in the New EU member states: Enhancing Labor Market
Outcomes and Fiscal Efficiency. Washington DC.
—. 2007b. Economic Developments and Prospects: Job Creation in an Era of High Growth.
Washington DC.
—. 2007c. World Development Report 2008: Agriculture for Development. Washington DC.
—. 2008. Linking Education Policy to Labor Market Outcomes. Washington DC.
—. 2009. Pensions in Crisis: Europe and Central Asia Regional Policy Note. Washington DC.
—. 2010a. The Path to Integrated Insurance System in China. Washington DC.
—. 2010b. Investing in Young Children: An Early Childhood Development Guide for Policy
Dialogue and Project Preparation. Washington DC.
—. 2010c. The Promise of Early Child Development in Latin America and the Caribbean.
Washington DC.
—. 2010d. Education, Training, and Labor Market Outcomes for Youth in Indonesia. Washington
DC.
—. 2010e. India's Employment Challenge: Creating Jobs, Helping Workers. Washington DC:
Oxford University Press and World Bank.
—. 2010f. Jobs Report: Toward Better Jobs and Security for All. Washington DC.
—. 2010g. Putting Nigeria to Work: A Strategy for Employment and Growth. Ed Volker Treichel.
Washington DC.
—. Forthcoming‐a. The Challenge of Informality: Promoting Inclusion and Job Quality in the
Middle East and North Africa Region. Washington DC.
—. Forthcoming‐b. In from the Shadow: Integrating Europe's Informal Labor. Washington DC.
—. Forthcoming‐c. More and Better Jobs in South Asia. Washington DC.
World Economic Forum, World Bank, and African Development Bank. 2011. The Africa
Competitiveness Report. Geneva: World Economic Forum.
Background Papers for the World Bank 2012–2022 Social Protection and Labor Strategy
No. Title 1210 Climate-Responsive Social Protection by Anne T. Kuriakose, Rasmus Heltberg, William Wiseman, Cecilia Costella,
Rachel Cipryk and Sabine Cornelius, March 2012 1209 Social Protection in Low Income Countries and Fragile Situations: Challenges
and Future Directions by Colin Andrews, Maitreyi Das, John Elder, Mirey Ovadiya and Giuseppe
Zampaglione, March 2012 1208 The World Bank in Pensions: A Background Paper for the Social Protection
Strategy by Mark Dorfman and Robert Palacios, March 2012 1207 Labor Markets in Middle and Low Income Countries: Trends and Implications
for Social Protection and Labor Policies by Yoonyoung Cho, David Margolis, David Newhouse and David Robalino,
March 2012 1206 Rules, Roles and Controls: Governance in Social Protection with an Application
to Social Assistance by Lucy Bassett, Sara Giannozzi, Lucian Pop and Dena Ringold, March 2012 1205 Crisis Response in Social Protection by Federica Marzo and Hideki Mori, March 2012 1204 Improving Access to Jobs and Earnings Opportunities: The Role of Activation
and Graduation Policies In Developing Countries by Rita Almeida, Juliana Arbelaez, Maddalena Honorati, Arvo Kuddo, Tanja
Lohmann, Mirey Ovadiya, Lucian Pop, Maria Laura Sanchez Puerta and Michael Weber, March 2012
1203 Productive Role of Safety Nets by Harold Alderman and Ruslan Yemtsov, March 2012 1202 Building Social Protection and Labor Systems: Concepts and Operational
Implications by David A. Robalino, Laura Rawlings and Ian Walker, March 2012
Printed on recycled paper
About this series...
Abstract
Social Protection & Labor Discussion Papers are published to communicate the results of The World Bank’s work to the development community with the least possible delay. The typescript manuscript of this paper therefore has not been prepared in accordance with the procedures appropriate to formally edited texts.
The findings, interpretations, and conclusions expressed herein are those of the author(s), and do not necessarily reflect the views of the International Bank for Reconstruction and Development / The World Bank and its affiliated organizations, or those of the Executive Directors of The World Bank or the governments they represent. The World Bank does not guarantee the accuracy of the data included in this work. The author(s) attest(s) that the paper represents original work. It fully references and describes all relevant prior work on the same subject.
For more information, please contact the Social Protection Advisory Service, The World Bank, 1818 H Street, N.W., Room G7-803, Washington, DC 20433 USA. Telephone: (202) 458-5267, Fax: (202) 614-0471, E-mail: [email protected] or visit us on-line at www.worldbank.org/sp.
M a r c h 2 0 1 2
Background Paper for the World Bank 2012–2022 Social Protection and Labor Strategy
The paper develops an operational definition of governance that can be applied to social protection. The 2004 WDR accountability framework acts as a starting point, defining accountability in terms of a set of principal-agent relationships between policymakers, providers, and citizens. Applying this framework to social protection, the paper looks at three broad areas where the Bank is involved in governance in social protection: rules of the game, including clear criteria for entry and exit of programs; roles and responsibilities, including defining accountability relationships and incentive frameworks across levels of government and institutions involved in social protection; and controls and accountability measures, including the broad set of implementation mechanisms and procedures for ensuring that “the right benefit gets to the right person at the right time”. The paper applies this framework to social assistance policies and programs, reviews what is currently being done across the Bank in this area, and identifies future opportunities for clients and Bank engagement.
Rules, Roles and Controls
Governance in Social Protection with an Application to Social Assistance
Lucy Bassett, Sara Giannozzi, Lucian Pop and Dena Ringold
D I S C U S S I O N P A P E R NO. 1206