Embed Size (px)
Citation preview

LABOR POLICY AND INVESTMENT
John W. BuddYijiang Wang
Industrial Relations CenterUniversity of Minnesota
3-300 Carlson School of Management321 19th Avenue South
Minneapolis, MN 55455-0438
e-mail addresses: [email protected], [email protected]
December 2000, revised July 2001
JEL Classification: J58, G31
Abstract
Policy debates over proposed legislative labor policy changes include contentions that businessinvestment will negatively respond to labor laws that favor labor. Research on labor policy,however, often assumes that investment is fixed. We present a sequential bargaining model inwhich labor policies that increase labor’s bargaining power and reduce management’s optionsduring strikes are predicted to reduce investment. Using provincial data on investment for 1967to 1999, a strike replacement ban and protections for workers who refuse to handle struck workare estimated to reduce new investment, especially within the first few years after the policychange.
Budd thanks the Carlson School of Management’s McKnight - Business and EconomicsResearch Grants Program for financial support.

1
In the United States and Canada, companies, labor unions, and scholars devote
considerable attention to monitoring, affecting, and understanding government regulation of the
employment relationship. Well-known examples include minimum wage provisions, mandated
family and medical leaves, and restrictions on the use of replacement workers during strikes.
Government regulations, policies, and laws pertaining to labor relations activities, such as
strikes, union organizing, or the imposition and collection of union dues, are called labor
policies.
In response to a proposed ban on strike replacements in the federal sector of Canada, the
Canadian Chamber of Commerce (1995, p. 67) argued that “investors would be given a powerful
incentive to either avoid or flee the jurisdiction.” An Ernst and Young report commissioned by
the Council of Ontario Construction Associations surveyed employers’ beliefs about the likely
impact of proposed Ontario labor law changes. In this survey of 251 Ontario businesses, 84.5
percent agreed that the proposed changes would affect their future investment plans in Ontario
(Council of Ontario Construction Associations, 1992). Similar reactions to proposed labor
policy changes are observed in the United States. Respondents to these types of surveys have an
obvious self-interest in inflating their responses, but even if exaggerated, they underscore the
importance of incorporating investment decisions into models and analyses of labor policies.
However, the research literature has generally overlooked investment decisions when
modeling and analyzing labor policies. This paper expands this narrow focus by analyzing the
effect of various labor policies on investment. This is an important extension to the existing
literature because previous research implicitly, if not explicitly, analyzes these policies in a
framework in which investment is assume to be fixed.
A clear example is the research on banning strike replacements. Strike replacement
2
restrictions have been theoretically modeled using private information bargaining models, and
such restrictions are predicted to unambiguously increase wage outcomes (e.g., Cramton,
Gunderson, and Tracy,1999; Farès and Robert, 1996). Empirical research and public policy
debates have been conducted with this modeling framework as a foundation. However, the
model below demonstrates that capital investment may adjust to the passage of strike
replacement legislation, and other labor policies.
In the model developed below, investors choose the amount of capital to invest in a firm
and after this investment is known, the firm and union bargain over the wage rate to be paid to
the employees. Labor policies such as strike replacement restrictions affect the expected
utilization of capital and also union bargaining power so investment responds to the passage of
such policies. And if investment changes in response to policy changes, then the wage effects of
labor policies are ambiguous (Budd and Wang, 1999).
The second part of this paper uses Canadian provincial data on investment and building
permits for 1967 to 1999 to empirically analyze the extent to which investment responds to labor
policy changes. Previous empirical research examines the relationship between various labor
policies and wages (Budd, 1996; Cramton, Gunderson, and Tracy (1999), strike activity (Budd,
1996; Cramton, Gunderson, and Tracy, 1999; Gunderson, Kervin, and Reid, 1989; Gunderson
and Melino, 1990) and employment (Budd, 2000), but we are unaware of any analyses of
investment.1
1 As referenced below, there is both theoretical and empirical research on unionization andinvestment which we use as a foundation for this paper.

3
Theoretical Framework
The firm in our model has a production function f(K,θL) where K > 0 denotes units of
sunk capital, L > 0 denotes units of labor, and 0 ≤ θ ≤ 1indicates the relative productivity levels
of labor under different labor policy regimes. To ensure an interior solution, we assume that the
production function is well behaved and has the standard properties: f(0, θL) = f(K, 0) = 0; fi(.,.)
> 0; fi(.,.) = ∞ at i = 0 (but j>0, j ≠ i); fii(.,.) < 0, and fij > 0 (j ≠ i), where i = K, θL; and fi and fii
are, respectively, the first and second derivatives of f with respect to i.
A key feature of this model is the incorporation of θ which depends on the specific labor
policies in effect in a jurisdiction. If there is normal production not interrupted by a strike or
other labor relations activity, θ = 1; otherwise θ < 1. For example, if the use of both temporary
and permanent strike replacements is prohibited, the firm has minimal options for trying to
maintain production during a strike so during a strike, θ = 0. If strike replacements are allowed,
0 < θ < 1 during a strike. The two strict inequalities are established under two very reasonable
and easily understandable assumptions. First, due to reasons such as specific human capital that
can be accumulated only in a long-term employment relation, replacements are not as productive
as regular workers. Second, replacements’ productivity is positive so having them is better than
not; or employers would not argue against replacement ban legislation.
Whether θ is closer to 0 or 1 is an empirical question and likely to vary across different
laws and also from industry to industry. The magnitude of θ may also depend on technology and
specific labor market conditions (e.g., if labor is readily available from the market with the kind
of skills and knowledge needed in the production). In the case of strike replacements, the extent
to which the replacement workers are inexperienced and the relative importance of firm specific

4
experience to productivity would like affect the magnitude of θ .
Labor at this firm is represented by a union which maximizes a utility function U(w, L)
where w is the wage. For simplicity, we can normalize the units of labor to one so that output
and the union’s utility are, respectively,
y = f(K, θ) and U(w) = w.
Following the wealth maximization principle, the first-best solution is joint profit and
utility maximization
max{K}
π(K, θ, w) + U(w)
= f(K, θ) – rK – w + w
= f(K, θ) – rK
from which it is clear that the first-best capital level K’ satisfies fK(K’, 0) = r. However,
choosing K = K’ is not sufficient. To avoid any social costs due to strikes, it is also necessary
that the worker be paid no less than the market wage, i.e., w > w. Jointly, K = K’ and w > w are
sufficient for obtaining the first-best solution. 2
However, in our model, there is no central planner to maximize total social welfare. The
firm and the worker are both selfish players, with the former maximizing profit and the latter
utility. The selfish motivation plus the fact that the productive life of capital is typically greater
than the duration of a collective bargaining agreement yields a model with sequential moves.
Investors determine K at time 0. After K is sunk, the firm and union engage in Nash bargaining
over the wage at time 1. If the two sides can reach an agreement, at time 2 production proceeds
2 An underlying assumption is that there is no legal ban of workers from walking away fromtheir work. If such a ban is in place, then K = K’ alone is sufficient for achieving the first-bestsolution.
5
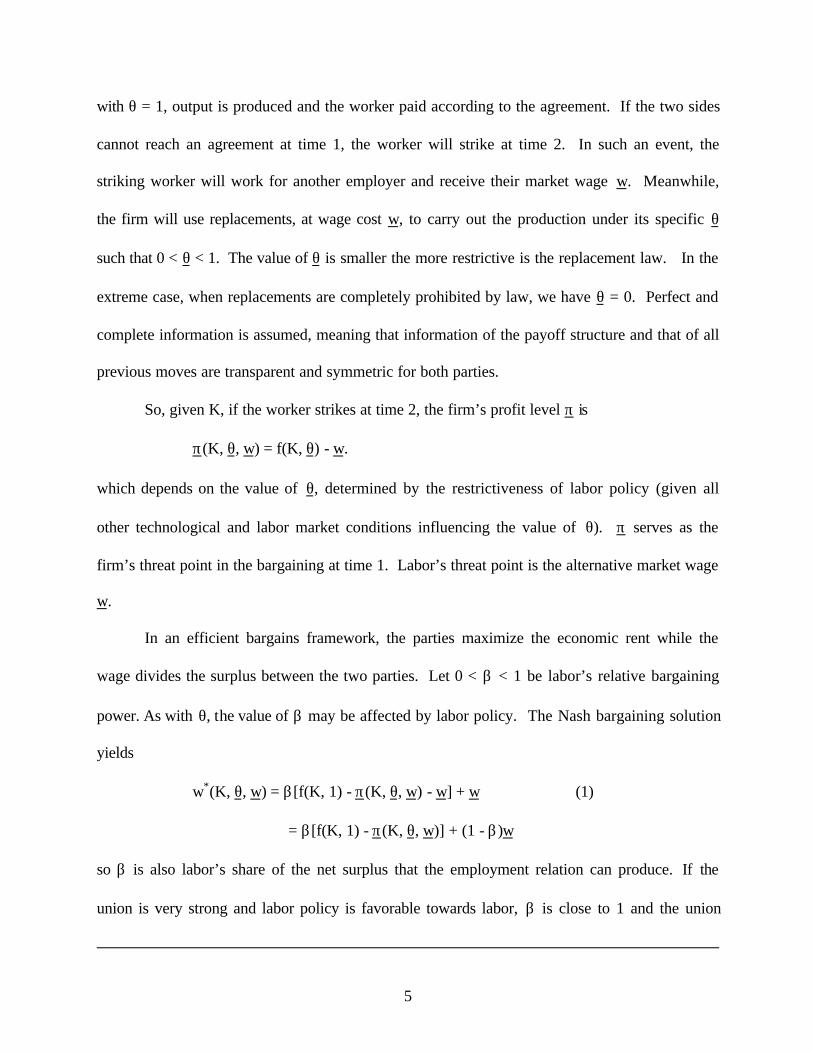
with θ = 1, output is produced and the worker paid according to the agreement. If the two sides
cannot reach an agreement at time 1, the worker will strike at time 2. In such an event, the
striking worker will work for another employer and receive their market wage w. Meanwhile,
the firm will use replacements, at wage cost w, to carry out the production under its specific θ
such that 0 < θ < 1. The value of θ is smaller the more restrictive is the replacement law. In the
extreme case, when replacements are completely prohibited by law, we have θ = 0. Perfect and
complete information is assumed, meaning that information of the payoff structure and that of all
previous moves are transparent and symmetric for both parties.
So, given K, if the worker strikes at time 2, the firm’s profit level π is
π(K, θ, w) = f(K, θ) - w.
which depends on the value of θ, determined by the restrictiveness of labor policy (given all
other technological and labor market conditions influencing the value of θ). π serves as the
firm’s threat point in the bargaining at time 1. Labor’s threat point is the alternative market wage
w.
In an efficient bargains framework, the parties maximize the economic rent while the
wage divides the surplus between the two parties. Let 0 < β < 1 be labor’s relative bargaining
power. As with θ, the value of β may be affected by labor policy. The Nash bargaining solution
yields
w*(K, θ, w) = β[f(K, 1) - π(K, θ, w) - w] + w (1)
= β[f(K, 1) - π(K, θ, w)] + (1 - β)w
so β is also labor’s share of the net surplus that the employment relation can produce. If the
union is very strong and labor policy is favorable towards labor, β is close to 1 and the union

6
captures nearly all of the surplus [f(K, 1) - π(K, θ, w) – w]. If the union is weak and labor policy
favors management, β is close to 0 and the union captures very little of the surplus so the
negotiated wage w* is close to the market wage w.
Inserting the negotiated wage w* from equation (1) into the firm’s profit equation yields
(2)
for any given K at time 1. Thus, at time 0, the investors’ maximization problem is
(3)
The solution to this maximization problem yields the optimal investment level K*. Since fKθ > 0,
we obtain K* < K’.
Compared to the first-best case, less capital is invested when bargaining occurs after
investment decisions. This result is not surprising and quite similar to that obtained by Baldwin
(1983), Grout (1984), and van der Ploeg (1987) in which unions cause underinvestment when
labor contracts are nonbinding or are of shorter duration than the productive life of capital.
Underlying these results is investors’ expectations that unions will exploit “the valuable hostages
of large sunk investment” (Simons, 1944: 8) which makes it optimal for investors to adjust their
investment decision ex ante.
But consider the effects of labor policy changes on investment. Banning the use of all
replacements means that θ = 0. More generally, implementing restrictions or limitations on the
use of replacements decreases θ. Additionally, strike replacement bans are widely believed to
increase labor’s bargaining power which in the model is an increase in β . A policy which
weakens existing legal restrictions on unions’ abilities to engage in secondary boycotts enhances
union bargaining power (increases β) and reduces firms’ options during a strike (decreases θ).
Proposed changes to the current doctrine on the legality of various forms of picketing would be
),,(])1,()[1() , , wKwKfwK θπββθπ +−−=(
rKwKwKfK
−+−− ),,(])1,()[1(max}{
θπββ

7
quite similar.
Mandatory strike vote policies require a strike vote before a strike can occur. Employer-
initiated voting policies provide employers with the option of requiring the union’s rank and file
membership to vote on the company’s final offer before the union is allowed to strike the
company. Both of these policies potentially increase the firm’s bargaining power (decreases β).
If a newly unionized firm and the union are not able to negotiate a first contract, first
contract arbitration policies force the two parties to submit their dispute to binding arbitration. It
is widely accepted that unions have significant difficulties trying to mount an effective strike
when trying to negotiate the first contract so this arbitration policy increases labor’s bargaining
power.
Lastly, the ability to decertify a union enhances the firm’s bargaining power and
increases its options during a strike. Policies that prohibit decertification activity during a strike,
therefore, increases union bargaining power (increases β) and decreases the firm’s options during
a strike (decreases θ).
Now consider the passage of one of these labor policies. Letting ∂law denote the passage
of a law favoring labor (such as restricting strike replacements or prohibiting decertification
activity during strikes) and using the first order condition for the investors’ maximization
problem in equation (3) yields
(4)
By definition, ∂law/∂θ > 0 and ∂law/∂β > 0. It is easy to show that ∂K*/∂θ < 0 and ∂K*/∂β < 0 so
∂K*/∂law < 0. In other words, because of the change in the firm’s threat point resulting from the
lowered θ and the change in labor’s bargaining power, capital investment will decrease with the
0***
<∂∂
∂∂
+∂∂
∂∂
=∂∂
lawK
lawK
lawK β
βθ
θ

8
passage of labor policies that favor labor.
Equation (4) indicates that labor policies that strengthen labor’s bargaining power and
make it more difficult for employers to replace striking workers will reduce investment.
Empirically, we use data on investment from the 10 Canadian provinces to test four predictions.
One, investment is lower in provinces with a labor policy that reduces management’s options
during a strike. Two, investment is lower in provinces with a labor policy that increases labor’s
bargaining power. Three, the labor policy effects on investment will be greater for policies that
are stronger or more restrictive. Four, the effects will be greater when union density is higher.
Provincial Investment Data and Empirical Specification
To empirically analyze the relationship between investment and labor policy, variation in labor
policies is needed. U.S. labor policy, however, is quite centralized with most private sector labor
laws established at the federal level. Thus, the regulations are generally uniform across the U.S.
private sector which leaves minimal scope for empirical investigation. In contrast, Canadian
labor policies are generally established at the provincial level. While the foundations of labor
relations are similar across provinces (e.g., exclusive representation), there is significant labor
policy variation across both time and provinces (Adams, 1994). If this variation is exogenous, it
provides a natural experiment for testing the effects of these labor policies.
The policies analyzed are provincial policies on strike replacements, refusals to handle
the work of a struck employer, decertification petitions, and first contract arbitration and the
effective dates for specific provinces are listed in Appendix Table 1. Two strike replacement
policies are analyzed: a ban on replacements and reinstatement rights. The strike replacement
bans forbid employers from hiring someone to do bargaining unit work while the bargaining unit

9
is engaged in a legal strike and also restrict the use of existing employees. The second strike
replacement policy analyzed, reinstatement rights, includes two policies, permanent replacement
bans and reinstatement rights, that while worded differently, have the same effective implication
for strike replacements. Permanent strike replacement laws prohibit the use of permanent strike
replacements, but not temporary replacements, while reinstatement rights provisions grant
striking workers the right to return to their jobs.3
Another strike-related scenario relates to employees working for an employer that
receives products from a company that is on strike. Generally, in the absence of legislative
protections, an employee who refuses to handle these products would be subject to discipline and
the third policy analyzed is this legislative protection for those who refuse to handle struck work.
Once a union is certified as the bargaining agent for a group of employees, it generally
only loses this status through a decertification election. To obtain a decertification election, a
group of employees usually files a petition with the provincial labor board. As shown in
Appendix Table 1, several provinces do not allow these petitions to be filed during a strike.
Lastly, first contract arbitration policies mandate the submission of any disputes regarding the
negotiation of a first contract to binding arbitration rather than allowing the parties to strike.
The two strike replacement policies restrict management’s ability to use various types of
replacement workers during a strike so these policies are hypothesized to lower investment.
Protections for struck work refusals also potentially reduces management’s ability to maintain
production during a strike and is predicted to lower investment. Prohibiting decertification
3 Reinstatement rights policies effectively ban permanent strike replacements since
employees are granted the right to return to their jobs with priority over replacement employees.These permanent replacement bans / reinstatement rights policies are weaker than the morecomprehensive strike replacement ban because the latter also restrict the use of temporaryreplacements and existing employees. Between 1985 and 1995, the U.S. Congress considered,

10
petitions during a strike and providing for first contract arbitration both reduce management’s
options for trying to avoid unionization and are hypothesized to therefore decrease investment.
As with the empirical research on unions and investment, we estimate regression models
of investment activity on the variables of interest, in this case indicators for the presence of these
labor policies, and various controls. To undertake this analysis, we constructed a data set on
annual investment activity in each of the 10 Canadian provinces between 1967 and 1999.4 Two
indicators of investment activity were collected: data on capital stocks and flows and data on the
value of provincial building permits. These data series extend back farther than 1967, but 1967
to 1999 is the longest period that complete data are available once lagged control variables are
included. This data set consists of 330 observations in a balanced panel of 10 provinces and 33
years.
Previous empirical research on investment has utilized a variety of dependent variables.
In regression analyses of the relationship between unionization and investment using firm-level
data, the dependent variable is the log of the ratio of investment in plant and equipment to sales
in Bronars, Deere, and Tracy (1994) and Cavanaugh (1998), the log of annual capital investment
in Denny and Nickell (1991, 1992) and Hirsch (1992), and the investment to capital stock ratio in
Bronars, Deere, and Tracy (1994) and Fallick and Hassett (1999). In their analysis of aggregate
Canadian industry-level data, Odgers and Betts (1997) focus on the net investment rate (net new
investment normalized by the capital stock).
In the analyses reported below, we follow Odgers and Betts (1997) by using the net
investment ratio as the dependent variable in a multivariate regression. Analyses using the log of
new investment as the dependent variable as in Denny and Nickell (1991, 1992) and Hirsch
but did not pass, at least four proposals to limit the use of permanent strike replacements.

11
(1992) yield a similar pattern of results. To this end, the net investment rate is constructed from
Statistics Canada constant-dollar measures of gross fixed capital formation (new investment),
depreciation, and end of year capital stock. Depreciation and the net capital stock are calculated
by Statistics Canada using delayed (beta) depreciation (see Statistics Canada, 1994). The net
investment rate can be computed for three components: all components, building construction,
and machinery and equipment.5
In terms of independent variables, Odgers and Betts (1997) estimate a hybrid model
including independent variables to capture both accelerator and neoclassical investment models.
We further follow Odgers and Betts (1997) by constructing accelerator terms as the change in
real provincial gross domestic product normalized by the capital stock. We take a more flexible
approach to the neoclassical cost of capital component. Odgers and Betts (1997) construct the
user cost of capital as a function of the price of capital goods, the corporate tax rate, the interest
rate, and depreciation rates. While there may be inter-industry differences in the price of capital
goods and depreciation, we posit that for any given time period, there are not obvious differences
across provinces so we will control for these measures by using year effects. To try to capture
the price of capital goods, we include the provincial unemployment rate and average weekly
earnings. To the extent that corporate cash reserves may affect corporate investment decisions,
we also include the growth rate in corporate profits. We construct the corporate tax rate as the
ratio of provincial corporate taxes to corporate profits.
As indicated by the references above, the effect of unionization has received significant
attention and we need to control for union density. Odgers and Betts (1997) find a nonlinear
4 More complete details on data sources and construction are contained in the data appendix.5 Investment for all components equals the sum of building construction, machinery andequipment, and engineering construction.

12
effect so we tried various nonlinear specifications and the reported results include a linear spline
for union density with a single knot at the median density rate. To account for differences in
provincial structure, we also include the fraction of manufacturing employment and fraction of
public administration employment. A full set of year and province effects as well as province-
specific time trends are also included.
As an alternative indicator of investment activity, we also compiled Statistics Canada
data on the value of building permits by province.6 Empirically, we construct the building
permits rate analogous to the net investment rate, i.e., building permits value normalized by the
beginning of period capital stock, and include the same control variables in the regressions. We
use three measures of building permits – total, commercial, and industrial.
Sample means and standard deviations for the various dependent and independent
variables are reported in Table 1. The mean net investment rate for all industries and all
components is 0.031 which is similar to the 0.027 average rate reported in Odgers and Betts
(1997) across industries for 1967 to 1987. The net investment rate is higher in machinery and
equipment than in building construction.
The sample fractions for the labor policy indicators show that nearly 10 percent of the
province-year observations had a strike replacement ban in place while another 21 percent
provided for reinstatement rights (recall that this includes permanent strike replacement bans).
The struck work refusal protections policy is the most frequent at 43 percent. The remaining two
policies are in effect between 28 and 37 percent of the time.
6 The building permits data are available from Statistics Canada as monthly series. We convertthese series to annual to be comparable with the annual stocks and flows data and also because ofthe large within-year variation in each province. The average within-year coefficient of variationranges between 43 and 100 for the monthly building permits series in contrast to coefficients ofvariation between 1 and 5 for other monthly time series such as employment, average weekly

13
Net Investment Rate Results
Table 2 presents the regression results using the net investment rate as the dependent
variable. We follow Odgers and Betts (1997) by including the contemporaneous accelerator
term as well as four lags and as in their results, the lagged terms are often stronger. Recall from
the previous section that we control for the user cost of capital in a more reduced form fashion
via various other controls and year-specific fixed effects. Province fixed effects control for
province-specific differences in investment while province-specific time trends are included to
allow each province to have its own trend.
As described above, the two strike replacement policies, the struck work refusal
protection provisions, the decertification restriction laws, and first contract arbitration policies
are all hypothesized to be associated with lower investment activity. However, we also posit that
the relationship will be weakest for machinery and equipment investment relative since
machinery and equipment investment is more portable and also that the relationship will be
strongest for building construction because it less portable..
The baseline regression results are reported in columns 1, 3, and 5 of Table 2. For all
components (column 1), only the strongest labor policy, the general strike replacement ban, is
statistically significant at conventional levels of significance. More specifically, the –0.007
coefficient implies that years in which provinces that ban the use of strike replacements have a
net investment rate 0.007, or about 23 percent relative to the mean rate of 0.031, less than years
in which provinces do not ban strike replacements, ceteris paribus.
Consistent with our expectations that the labor policy results would be strongest for
earnings, and the consumer price index.

14
building construction and weakest for machinery and equipment, including the replacement ban
which is significant at the 10 percent level, four of the five policy coefficients are significantly
negative for building construction (column 3) whereas none are for machinery and equipment
(column 5). We also estimated log investment models, as in Denny and Nickell (1991, 1992)
and Hirsch (1992), omitting the accelerator terms and including log capital stock and log
employment variables to control for scale differences across the provinces. The pattern of results
is the same: only the strong replacement ban is statistically significant for the aggregate model,
four of the five are negative and significant for building construction, and none are for machinery
and equipment.
The labor policies have the potential to affect nonunion as well as unionized
establishments through the specter of becoming unionized, but they most directly bind unionized
establishments. One may expect, therefore, that the effect on investment is stronger when union
density is higher. Columns 2, 4, and 6 present the regression results of adding a high union
density interaction with each labor policy indicator to the baseline specification. High union
density is defined as above the median union density for that year.
For aggregate investment (column 2) and building construction (column 4), no significant
differences are uncovered between below union density median and above median provinces. In
the machinery and equipment regression (column 6), the high union density interaction for the
strike replacement ban policy is statistically significant and implies that the effect of this policy
on investment is greater (more negative) in high density province-years.
However, if taken at face value, the 0.027 strike replacement ban coefficient implies that
the effect of this ban is positive in low density province-years. The natural experiment provided
by the variation in these policies may not be rich enough to sufficiently answer this high density

15
union question since only three provinces have enacted this legislation so the interacted term is
relying on variation within these three provinces for identification.
Another potential problem with this natural experiment methodology is that the policy
changes must be exogenous for the regressions to produce reliable inferences. If, for example,
violent strikes caused a provincial government to restrict the use of replacements and also caused
business to reduce investment, then the legislation is not exogenous. Lacking suitable
instruments, however, we are left searching for evidence regarding the appropriateness of the
exogeneity assumption. If legislative response to these violent strikes, for example, is slower
than the business response, we would expect to see investment activity significantly lower just
before the policies are enacted.
Table 3 therefore presents the regression results adding dummy variables indicating 0-3
years prior to the start of each policy. Of the 15 coefficients of interest (five policies, three
measures of investment), the only one that is statistically significant is for no decertification
petitions for machinery and equipment. There does not appear to be significant changes in
investment just prior to the start of these labor policies.
The regression specifications reported in Table 3 also allow the effect each policy to vary
over time. More specifically, each policy variable is decomposed into two dummy variables: one
indicating 1-3 years after the policy starts and the other indicating the period more than three
years after the policy.
The negative effect of the strike replacement ban on building construction reported in
Table 2 is revealed in column 2 of Table 3 to primarily be concentrated in the first few years
after the policy’s start. The point estimate for the policy’s effect after three years is still
negative, but only half the magnitude of the 1-3 year estimate and not statistically significant.

16
The reinstatement rights policy is estimated to have more persistent effects on building
construction investment. Moreover, the protections for struck work refusals is also estimated to
have a significantly negative effect on investment within the first three years.
Again, the results for log investment models are quite similar. The only significant
qualitative difference between the log investment models and the results reported in Table 3 is
that struck work refusal protections are estimated to have a significantly negative effect on
investment in both the 1-3 and 4+ years time periods.
Building Permits Results
As an additional measure of investment activity, consider the value of building permits
issued in each province. To be comparable with the net investment rate analyses, we convert this
to a rate relative to the beginning of year capital stock and estimate regression models with the
same independent variables as in Tables 2 and 3.
The baseline results for the building permits rate are presented in columns 1, 3, and 5 of
Table 4. The decertification restriction policy has consistently negative effects for the three
categories of building permits: total, commercial, and industrial. The strike replacement ban has
a negative effect on commercial building permits that is close to significant at the five percent
level (p-value = 0.059). The estimates in column 4 suggest that this effect is stronger in higher
union density situations, but the statistical significance is marginal by conventional standards (p-
value 0.075).
Table 5 parallels Table 3 and presents the estimates for the building permits rate when the
policies are allowed to have different effects for 1-3 years and after three years of the policy’s
start and also includes indicator variables for the three-year period prior to each policy. As with

17
the building construction net investment rate results, the replacement ban effect on commercial
building permits is concentrated in the first few years after the policy’s start. The decertification
restriction policy has significant effects that are more persistent across the various time periods.
Investment and Union Density
While not the focus of this paper, the results for union density are worth mentioning
given the previous literature on unionization and investment and given the similarities between
our approach and that of Odgers and Betts (1997) – the main difference being that we analyze
province-level data whereas Odgers and Betts (1997) analyze industry-level data. Ogden and
Betts (1997) find a nonlinear, negative relationship between the net investment rate and
unionization. We tried various nonlinear representations of union density in the regressions of
Table 2 such as quadratic terms and linear splines with various knots. A linear spline with a
single knot at the median density rate worked best and is what included in the results reported in
Tables 2-5.
A quick review of the linear spline coefficients in Tables 2 and 4 reveal very few
negative point estimates and no negative estimates that are statistically significant. In contrast,
for the net investment rate, the union effect on the aggregate net investment rate is significantly
larger, and positive, when union density is high (above the median). The same pattern is true for
machinery and equipment, though not statistically significant.
It should be noted that Odgers and Betts (1997) have a much greater range of union
densities in their data. They do not report the range, but nearly a third of their industry-year cells
have union density rates in excess of 50 percent. Aggregating by province instead of industry
averages out the low and high union density industries and density in the provincial data set used
18
here ranges between 7.8 percent and 42.2 percent. Thus, the present data set might not be as well
suited for analyzing the relationship between union density and investment. Nevertheless, it is
worth noting that the previously-estimated negative relationship in other studies is not apparent
when comparing provinces.
Conclusion
While the business lobby claims that labor policy changes that favor labor, such as
restrictions on the use of strike replacements, will reduce investment, previous research on labor
policy often implicitly assumes that investment is fixed. In this paper, we developed a sequential
bargaining model in which a firm sets an optimal investment level knowing that unions will
exploit “the valuable hostages of large sunk investment” (Simons, 1944: 8). As in the models of
Baldwin (1983), Grout (1984), and van der Ploeg (1987), this sequential bargaining model
implies that unions cause underinvestment when labor contracts are nonbinding or are of shorter
duration than the productive life of capital. The theoretical contribution of this model, however,
is to show that labor policies that increase labor’s bargaining power and reduce management’s
options during a strike are also predicted to reduce investment.
Labor policies pertaining to strike replacements, struck work refusals, and
decertifications during strikes have been subjected to policy debates in Canada and the United
States in recent years, and a more sophisticated analysis which includes investment decisions is
warranted. To this end we assembled an annual data set on Canadian provincial investment for
1967 to 1999.
In hybrid accelerator-neoclassical model as in Odgers and Betts (1997) and reduced form
specifications for log investment as in Hirsch (1992), strike replacement laws and protections for

19
workers who refuse to handle struck work are estimated to reduce new investment, especially
within the first few years after the policy change. Restrictions on the use of permanent and
temporary strike replacements are also negatively associated with the value of commercial
building permits.
Since major labor policy changes, such as strike replacement legislation, are often
enacted as part of a larger labor relations reform package, it remains difficult to precisely
estimate the elasticities for specific policies. Nevertheless the evidence appears to support the
more general hypothesis that investment responds to labor policy changes. This echoes other
research which finds that foreign direct investment is affected by industrial relations factors and
regulations on the employment relationship (e.g., see Cooke, 1997). And as the world economic
system becomes increasingly integrated, debates over labor policies are likely to grow.
Investment decisions should be incorporated into these debates.

20
Data Appendix
To construct the net investment rate, annual data on new investment, depreciation, and
the capital stock by province was obtained by special order from Statistics Canada’s Investment
and Capital Stock Division (for details, see their publication CS13-568, Fixed Capital Flows and
Stocks). Values of monthly building permits were obtained from CANSIM (matrix 137) (see
CS64-001, Building Permits) and converted to annual measures.
The provincial gross domestic product, corporate taxes, and corporate profits measures
were obtained from various issues of the Statistics Canada publication Provincial Economic
Accounts (CS13-213-PIB). Series for 1961-1993 and 1992-1999 were spliced together using the
overlap to index-link and adjust the earlier series. Provincial unemployment rates were
calculated from labor force and employment series (see CS71-001, The Labour Force). These
data are available monthly on CANSIM for 1966-1994 (CANSIM matrices 2074-2096) and
1976-1999 (matrices 3452-3470) and the pre-1976 data were spliced onto the later series using
the 1976 overlap.
Manufacturing and public administration employment data (see CS72-002, Employment
and Earnings) were similarly obtained for 1983-1999 from CANSIM (matrices 4299-4425) and
1966-1983 (matrix 1714). Monthly provincial average weekly earnings are from CANSIM for
1983-1999 (matrices 4302-4428) for 1966-1983 (matrices 1433-1493) (see CS72-002,
Employment and Earnings). All of these series were spliced together using the 1983 overlap to
adjust the earlier series.
The union density rates were constructed using data on union membership and the
previously-described provincial employment series. Continuous measures of provincial union
membership are not available for 1966-1999 so these were constructed using three sources and

21
adjusting two of the series using the available overlap. Data for 1966-1995 are available from
the Corporations and Labour Unions Returns Act (CALURA) Annual Reports (CS 71-202) and
from Mainville and Olineck (1999). Unpublished data for 1986-1990 from the Labour Market
Activity Survey (LMAS) are available from Statistics Canada as are data for 1993-1999 from the
Labour Force Survey (LFS). The LMAS and LFS are household surveys so these data were used
when available. For the remaining years, the CALURA data – which are obtained from union
surveys – were used and adjusted using the available overlap with the household surveys.
The policy variables were constructed from the dates presented in Appendix Table 1.
These dates were obtained using the text of each bill amending existing provincial statutes as
reported in the annual Legislative Reports for each of the provinces.

22
References
Adams, George W. (1994) Canadian Labour Law, second edition, Aurora, Ontario: Canada LawBook Inc.
Baldwin, Carliss Y. (1983) “Productivity and Labor Unions: An Application of the Theory ofSelf-Enforcing Contracts,” Journal of Business, 56(2): 155-185.
Bronars, Stephen G., Donald R. Deere, and Joseph S. Tracy (1994) “The Effects of Unions onFirm Behavior: An Empirical Analysis Using Firm-Level Data,” Industrial Relations,33(4): 426-451.
Budd, John W. (1996) “Canadian Strike Replacement Legislation and Collective Bargaining:Lessons for the United States,” Industrial Relations, 35(2): 245-260.
Budd, John W. (2000) “The Effect of Strike Replacement Legislation on Employment,” LabourEconomics, 7(2): 225-247.
Budd, John W. and Yijiang Wang (1999) “The Ambiguity of Strike Replacement Legislation andWages: A Sequential Investment-Bargaining Model,” Advances in Industrial and LaborRelations, 9: 239-252.
Canadian Chamber of Commerce (1995) “Submission of the Canadian Chamber of CommerceConcerning the Proposed Ban on Replacement Workers in the Federal Sector,” Ottawa,Ontario, April.
Cavanaugh, Joseph K. (1998) “Asset-Specific Investment and Unionized Labor,” IndustrialRelations, 37(1): 35-50.
Cooke, William N. (1997) “The Influence of Industrial Relations Factors on U.S. Foreign DirectInvestment Abroad,” Industrial and Labor Relations Review, 51(1): 3-17.
Council of Ontario Construction Associations (1992) “The Impact of Proposed Changes toOntario’s Labour Relations Act: A Report from Ernst and Young,” Toronto, Ontario,February.
Cramton, Peter, Morley Gunderson, and Joseph Tracy (1999) “The Effect of CollectiveBargaining Legislation on Strikes and Wages,” Review of Economics and Statistics,81(3): 475-487.
Denny, Kevin and Stephen J. Nickell (1992) “Unions and Investment in British Industry,”Economic Journal, 102(413): 874-887.
Denny, Kevin and Stephen Nickell (1991) “Unions and Investment in British ManufacturingIndustry,” British Journal of Industrial Relations, 29(1): 113-121.

23
Fallick, Bruce C. and Kevin A. Hassett (1999) “Investment and Union Certification,” Journal ofLabor Economics, 17(3): 570-582.
Farès, Jean and Jacques Robert (1996) “Replacement Laws, Strikes and Wages,” unpublishedpaper, University of Montreal.
Grout, Paul A. (1984) “Investment and Wages in the Absence of Binding Contracts: A NashBargaining Approach,” Econometrica, 52(2): 449-460.
Gunderson, Morley and Angelo Melino (1990) “The Effects of Public Policy on StrikeDuration,” Journal of Labor Economics, 8(3): 295-316.
Gunderson, Morley, John Kervin, and Frank Reid (1989) “The Effect of Labour RelationsLegislation on Strike Incidence,” Canadian Journal of Economics, 22(4): 779-794.
Hirsch, Barry T. (1992) “Firm Investment Behavior and Collective Bargaining Strategy,”Industrial Relations, 31(1): 95-121.
Mainville, Diane and Carey Olineck (1999) “Unionization in Canada: A Retrospective,”Perspectives on Labour and Income, Statistics Canada CS75-001-SPE: 3-35.
Odgers, Cameron W. and Julian R. Betts (1997) “Do Unions Reduce Investment? Evidence fromCanada,” Industrial and Labor Relations Review, 51(1): 18-36.
Simons, Henry C. (1944) “Some Reflections on Syndicalism,” Journal of Political Economy,52(1): 1-25.
Statistics Canada (1994) Fixed Capital Flows and Stocks, 1961-1994 Historical, Catalogue 13-568, Ottawa: Statistics Canada.
van der Ploeg, F. (1987) “Trade Unions, Investment, and Employment,” European EconomicReview, 31(7): 1465-1492.

24
Table 1Annual Provincial Investment Data, 1967-1999: Summary Statistics
Variable
Mean(Standard Deviation)
(1)Net Investment Ratea, All Industries, All Components
0.031(0.018)
Net Investment Ratea, All Industries, Building Construction
0.031(0.019)
Net Investment Ratea, All Industries, Machinery and Equipment
0.040(0.034)
Building Permits Rateb, Total
0.026(0.014)
Building Permits Rateb, Commercial
0.006(0.003)
Building Permits Rateb, Industrial
0.002(0.002)
Labor Policy IndicatorsStrike Replacement Ban 0.096
Reinstatement Rights or PermanentReplacement Ban (and no repl. ban)
0.213
Protections for Struck Work Refusals 0.434
No Decertification Petitions During a Strike 0.366
First Contract Arbitration 0.283
Acceleratorc 0.017(0.026)
Union Membership Density (one year lag)
0.258(0.057)
Fraction Manufacturing Employment 0.124(0.055)
Fraction Public Administration Employment 0.067(0.015)
Provincial Corporate Taxes to Profits Ratio (one year lag)
0.116(0.036)
Corporate Profits Growth Rate (1992 dollars; one year lag)
0.053(0.231)

25
Table 1 (continued)
Provincial Unemployment Rate (one year lag)
0.090(0.041)
Log Provincial Average Weekly Earnings (1992 dollars; one year lag)
6.213(0.113)
Provincial Average Weekly Earnings Growth Rate (1992 dollars; one year lag)
0.009(0.024)
Sample Size 330Source: see textNotes: a The net investment rate is net investment (new investment less
depreciation) normalized by the beginning of year capital stock.b The building permits rate is the value of building permits normalized bythe beginning of year capital stock.c The accelerator is the change in provincial gross domestic productnormalized by the capital stock.

26
Table 2Regression Analysis of the Net Investment Rate, 1967-1999a
AllComponents
BuildingConstruction
Machinery &Equipment
Variable (1) (2) (3) (4) (5) (6)
Strike Replacement Ban-0.007(0.004)
-0.002(0.005)
-0.008(0.005)
-0.006(0.005)
0.001(0.008)
0.027(0.011)
Strike Replacement Ban ×High Union Density
--- -0.007(0.007) --- -0.004
(0.008) --- -0.035(0.014)
Reinstatement Rights (andno replacement ban)
-0.004(0.003)
-0.004(0.004)
-0.008(0.003)
-0.010(0.004)
-0.004(0.006)
0.003(0.008)
Reinstatement Rights ×High Union Density
--- 0.004(0.004)
--- 0.004(0.004)
--- -0.006(0.008)
Protections for Struck WorkRefusals
0.0001(0.004)
0.002(0.005)
-0.009(0.004)
-0.011(0.005)
-0.003(0.009)
0.004(0.011)
Protections for Struck Work× High Union Density --- -0.004
(0.004) --- 0.004(0.003) --- -0.005
(0.009)
No Decertification PetitionsDuring a Strike
0.0003(0.006)
-0.0001(0.006)
-0.006(0.006)
-0.003(0.006)
0.018(0.014)
0.017(0.015)
No Decertification Petitions× High Union Density
--- 0.002(0.003) --- -0.003
(0.003) --- 0.001(0.008)
First Contract Arbitration -0.002(0.004)
-0.003(0.006)
-0.009(0.003)
-0.007(0.004)
-0.007(0.007)
-0.020(0.011)
First Contract Arbitration ×High Union Density
--- 0.001(0.006)
--- -0.002(0.005)
--- 0.019(0.011)
Accelerator 0.095(0.035)
0.096(0.034)
0.098(0.038)
0.100(0.038)
0.216(0.071)
0.217(0.070)
Accelerator (one year lag) 0.164(0.041)
0.163(0.041)
0.106(0.039)
0.109(0.040)
0.391(0.071)
0.391(0.071)
Accelerator (two year lag) 0.148(0.040)
0.147(0.040)
0.126(0.040)
0.122(0.040)
0.325(0.095)
0.345(0.097)
Accelerator (three year lag) 0.108(0.041)
0.112(0.041)
0.079(0.038)
0.075(0.037)
0.323(0.081)
0.350(0.082)
Accelerator (four year lag) 0.112(0.042)
0.115(0.043)
0.103(0.037)
0.098(0.037)
0.241(0.078)
0.257(0.077)

27
Table 2 (continued)
Union Density Spline (lessthan median)
0.012(0.067)
0.018(0.068)
0.006(0.064)
-0.008(0.067)
-0.044(0.121)
0.014(0.123)
Union Density Spline(greater than median)
0.131(0.055)
0.136(0.054)
0.004(0.052)
-0.001(0.005)
0.142(0.101)
0.159(0.101)
Fraction ManufacturingEmployment
-0.413(0.111)
-0.389(0.114)
-0.111(0.141)
-0.116(0.144)
-0.224(0.257)
-0.256(0.266)
Fraction PublicAdministration Employment
-0.102(0.224)
-0.099(0.230)
0.165(0.268)
0.113(0.276)
1.437(0.470)
1.396(0.469)
Corporate Taxes to ProfitsRatio (one year lag)
-0.084(0.027)
-0.083(0.028)
-0.003(0.025)
0.003(0.025)
-0.096(0.050)
-0.107(0.051)
Corp. Profits Growth Rate(1992 dollars; one year lag)
-0.008(0.005)
-0.009(0.005)
-0.006(0.004)
-0.006(0.005)
-0.010(0.010)
-0.011(0.010)
Provincial UnemploymentRate (one year lag)
-0.112(0.079)
-0.133(0.082)
-0.235(0.098)
-0.235(0.100)
-0.169(0.148)
-0.172(0.149)
Log Provincial AWE (1992Dollars; one year lag)
-0.025(0.037)
-0.033(0.038)
0.129(0.038)
0.134(0.038)
-0.339(0.077)
-0.343(0.079)
Prov. AWE Growth Rate(1992 dollars; one year lag)
0.128(0.062)
0.132(0.064)
0.075(0.038)
0.080(0.071)
0.091(0.110)
0.077(0.109)
Province Effects Yes Yes Yes Yes Yes YesYear Effects Yes Yes Yes Yes Yes YesProvince-Specific TimeTrends Yes Yes Yes Yes Yes Yes
R squared 0.762 0.766 0.768 0.770 0.688 0.694Sample Size 330 330 330 330 330 330Source: see text.Notes: a Dependent variable: real net investment rate. Standard errors (in parentheses) arerobust to arbitrary forms of heteroskedasticity.

28
Table 3The Net Investment Rate: Time-Varying Policy Effectsa
AllComponents
BuildingConstruction
Machinery &Equipment
Variable (1) (2) (3)
Strike Replacement Ban
0 – 3 Years Prior to Policy 0.006(0.004)
0.006(0.005)
0.006(0.008)
1 – 3 Years After Policy -0.004(0.004)
-0.011(0.005)
0.001(0.009)
More than 3 Years After Policy -0.010(0.005)
-0.005(0.006)
-0.002(0.012)
Reinstatement Rights (and no replacement ban)
0 – 3 Years Prior to Policy -0.003(0.003)
-0.005(0.003)
-0.010(0.007)
1 – 3 Years After Policy -0.002(0.003)
-0.009(0.004)
-0.011(0.008)
More than 3 Years After Policy -0.003(0.004)
-0.012(0.004)
-0.006(0.009)
Protections for Struck Work Refusals
0 – 3 Years Prior to Policy -0.008(0.006)
0.004(0.006)
-0.019(0.011)
1 – 3 Years After Policy -0.012(0.006)
-0.014(0.006)
-0.007(0.013)
More than 3 Years After Policy 0.002(0.005)
-0.007(0.005)
-0.001(0.011)
No Decertification Petitions During a Strike
0 – 3 Years Prior to Policy -0.001(0.006)
0.001(0.006)
0.022(0.011)
1 – 3 Years After Policy 0.004(0.006)
0.005(0.007)
0.012(0.013)
More than 3 Years After Policy -0.004(0.008)
0.004(0.007)
0.012(0.015)

29
Table 3 (continued)
First Contract Arbitration
0 – 3 Years Prior to Policy 0.002(0.004)
0.001(0.004)
0.003(0.008)
1 – 3 Years After Policy -0.003(0.004)
-0.006(0.004)
-0.006(0.010)
More than 3 Years After Policy 0.0002(0.005)
-0.008(0.005)
0.006(0.011)
Control Variables from Table 2 Yes Yes Yes
Province Effects Yes Yes Yes
Year Effects Yes Yes Yes
Province-Specific Time Trends Yes Yes Yes
R squared 0.779 0.775 0.701
Sample Size 330 330 330
Source: see text.Notes: a Dependent variable: real net investment rate. Standard errors (in parentheses)are robust to arbitrary forms of heteroskedasticity.

30
Table 4Regression Analysis of Building Permits Rate, 1967-1999a
Total Commercial Industrial
Variable (1) (2) (3) (4) (5) (6)
Strike Replacement Ban-0.003(0.002)
-0.001(0.003)
-0.001(0.001)
0.0002(0.001)
-0.001(0.001)
-0.0004(0.001)
Strike Replacement Ban ×High Union Density
--- -0.003(0.004) --- -0.002
(0.001) --- -0.0001(0.001)
Reinstatement Rights (andno replacement ban)
-0.000(0.001)
0.001(0.002)
0.0002(0.001)
0.0002(0.001)
0.0002(0.0004)
0.001(0.001)
Reinstatement Rights ×High Union Density
--- -0.001(0.002)
--- 0.001(0.001)
--- -0.001(0.001)
Protections for Struck WorkRefusals
-0.001(0.002)
-0.001(0.003)
0.001(0.001)
0.001(0.001)
-0.0001(0.001)
-0.0001(0.001)
Protections for Struck Work× High Union Density --- 0.001
(0.002) --- -0.000(0.001) --- -0.0001
(0.0004)
No Decertification PetitionsDuring a Strike
-0.009(0.003)
-0.011(0.003)
-0.002(0.001)
-0.002(0.001)
-0.002(0.001)
-0.002(0.001)
No Decertification Petitions× High Union Density
--- 0.002(0.002) --- -0.0001
(0.001) --- 0.0001(0.0004)
First Contract Arbitration 0.001(0.002)
0.005(0.002)
-0.0002(0.001)
-0.0003(0.001)
-0.0003(0.0004)
-0.0004(0.001)
First Contract Arbitration ×High Union Density
--- -0.005(0.002)
--- 0.0002(0.001)
--- 0.0001(0.001)
Accelerator 0.102(0.020)
0.100(0.020)
0.033(0.006)
0.033(0.006)
0.011(0.004)
0.011(0.004)
Accelerator (one year lag) 0.090(0.023)
0.088(0.024)
0.025(0.009)
0.026(0.009)
0.003(0.004)
0.003(0.004)
Accelerator (two year lag) 0.106(0.025)
0.104(0.026)
0.033(0.006)
0.033(0.006)
-0.0004(0.005)
0.0003(0.005)
Accelerator (three year lag) 0.022(0.024)
0.021(0.024)
0.019(0.007)
0.019(0.007)
-0.003(0.006)
-0.003(0.006)
Accelerator (four year lag) 0.040(0.024)
0.041(0.024)
0.017(0.008)
0.017(0.008)
-0.0003(0.004)
0.0001(0.004)

31
Table 4 (continued)
Union Density Spline (lessthan median)
0.121(0.035)
0.121(0.037)
0.018(0.008)
0.018(0.009)
0.016(0.007)
0.018(0.007)
Union Density Spline(greater than median)
0.048(0.024)
0.045(0.024)
0.014(0.008)
0.014(0.008)
0.002(0.006)
0.002(0.006)
Fraction ManufacturingEmployment
-0.160(0.061)
-0.174(0.063)
-0.056(0.021)
-0.055(0.023)
-0.017(0.018)
-0.019(0.020)
Fraction PublicAdministration Employment
0.003(0.145)
-0.003(0.149)
-0.095(0.040)
-0.102(0.041)
0.036(0.027)
0.040(0.029)
Corporate Taxes to ProfitsRatio (one year lag)
-0.035(0.014)
-0.035(0.015)
-0.012(0.004)
-0.011(0.004)
-0.008(0.004)
-0.009(0.004)
Corp. Profits Growth Rate(1992 dollars; one year lag)
-0.001(0.002)
-0.001(0.002)
-0.001(0.001)
-0.001(0.001)
0.0004(0.001)
0.0004(0.001)
Provincial UnemploymentRate (one year lag)
-0.319(0.041)
-0.323(0.041)
-0.040(0.012)
-0.042(0.013)
-0.046(0.009)
-0.045(0.009)
Log Provincial AWE (1992Dollars; one year lag)
0.070(0.025)
0.063(0.026)
0.010(0.006)
0.009(0.006)
0.011(0.004)
0.011(0.004)
Prov. AWE Growth Rate(1992 dollars; one year lag)
0.009(0.034)
0.011(0.034)
0.006(0.009)
0.007(0.009)
-0.008(0.007)
-0.009(0.006)
Province Effects Yes Yes Yes Yes Yes YesYear Effects Yes Yes Yes Yes Yes YesProvince-Specific TimeTrends
Yes Yes Yes Yes Yes Yes
R squared 0.870 0.872 0.811 0.814 0.642 0.645Sample Size 330 330 330 330 330 330Source: see text.Notes: a Dependent variable: real building permits value normalized by the capital stock (x1000). Standard errors (in parentheses) are robust to arbitrary forms of heteroskedasticity.

32
Table 5The Building Permits Rate: Time-Varying Policy Effectsa
Total Commercial Industrial
Variable (1) (2) (3)
Strike Replacement Ban
0 – 3 Years Prior to Policy -0.001(0.002)
-0.0001(0.001)
-0.0002(0.001)
1 – 3 Years After Policy -0.003(0.003)
-0.002(0.001)
-0.0004(0.001)
More than 3 Years After Policy -0.002(0.003)
-0.0003(0.001)
-0.0001(0.001)
Reinstatement Rights (and no replacement ban)
0 – 3 Years Prior to Policy -0.003(0.002)
-0.001(0.001)
-0.0001(0.0004)
1 – 3 Years After Policy 0.0001(0.002)
-0.0002(0.001)
0.0002(0.001)
More than 3 Years After Policy -0.004(0.002)
-0.001(0.001)
-0.0001(0.001)
Protections for Struck Work Refusals
0 – 3 Years Prior to Policy -0.006(0.003)
0.0002(0.001)
-0.002(0.001)
1 – 3 Years After Policy -0.005(0.003)
0.0003(0.001)
-0.002(0.001)
More than 3 Years After Policy -0.004(0.002)
0.0003(0.001)
-0.001(0.001)
No Decertification Petitions During a Strike
0 – 3 Years Prior to Policy -0.004(0.004)
-0.0001(0.001)
0.001(0.001)
1 – 3 Years After Policy -0.010(0.004)
-0.002(0.001)
-0.002(0.001)
More than 3 Years After Policy -0.012(0.004)
-0.003(0.001)
-0.002(0.001)

33
Table 5 (continued)
First Contract Arbitration
0 – 3 Years Prior to Policy 0.0003(0.002)
0.0003(0.001)
-0.001(0.0004)
1 – 3 Years After Policy 0.0004(0.002)
0.0001(0.001)
-0.001(0.0006)
More than 3 Years After Policy -0.001(0.003)
-0.001(0.001)
-0.001(0.0007)
Control Variables from Table 2 Yes Yes Yes
Province Effects Yes Yes Yes
Year Effects Yes Yes Yes
Province-Specific Time Trends Yes Yes Yes
R squared 0.877 0.816 0.664
Sample Size 330 330 330
Source: see text.Notes: a Dependent variable: real building permits value normalized by the capital stock(x 1000). Standard errors (in parentheses) are robust to arbitrary forms ofheteroskedasticity.

34
APPENDIX TABLE 1Labor Policy Variable Codings, 1967-1999
Strike Replacement Ban
Quebec February 1978 to December 1999
British Columbia January 1993 to December 1999
Ontario January 1993 to October 1995
Reinstatement Rights / Permanent Replacement Ban (and no replacement ban)
Ontario November 1970 to December 1992November 1995 to December 1999
Manitoba January 1985 to December 1999
Prince Edward Island May 1987 to December 1999
Alberta December 1988 to December 1999
Saskatchewan November 1994 to December 1999
Protections for Struck Work Refusals
Saskatchewan January 1967 to December 1999
Alberta January 1972 to December 1999
Manitoba January 1972 to December 1999
Nova Scotia August 1972 to December 1999
Newfoundland February 1978 to December 1999
British Columbia January 1993 to December 1999
No Decertification Petitions During a Strike
Quebec January 1967 to December 1999
Ontario January 1967 to December 1999
New Brunswick April 1972 to December 1999
Manitoba January 1973 to December 1999
First Contract Arbitration
British Columbia February 1974 to December 1999
Quebec February 1978 to December 1999
Manitoba July 1982 to December 1999
Newfoundland July 1985 to December 1999
Ontario May 1986 to December 1999
Source: Authors’ calculations from Provincial Legislative Reports.