Embed Size (px)
Citation preview

Laboratory and Full-Scale Evaluation of 1 4.75 mm NMAS Superpave Overlay 2
3 4
Xinjun Li, ESCINC/FHWA, [email protected] 5
Nelson Gibson, Federal Highway Administration, [email protected] 6
Xicheng Qi, SES / FHWA, [email protected] 7
Trenton Clark, Virginia Asphalt Association, [email protected] 8
Kevin McGhee, Virginia DOT, [email protected] 9
10
11 12 13 14 15 16 17 18 19 20 21 22 23 24 25 26 27 28 29
Submission date: August 1, 2011 30 Word Count: 7591, Abstract 151, Body 4190; 2 Tables & 11 Figures (13 x 250 = 3,250) 31
32 33 34
35 Submitted for Presentation and Publication at the 91st 36
Annual Meeting of the Transportation Research Board 37 38 39 40
TRB 2012 Annual Meeting Original paper submittal - not revised by author.

2
ABSTRACT 1
A 4.75mm NMAS Superpave mix developed by Virginia DOT was placed as a thin 2 treatment on existing accelerated pavement test sections. Half of the loaded wheel path was 3 paved with and without the treatment to quantify the effect, explore the rutting susceptibility 4 and the ability to defer cracking. Loose mix was collected during construction to verify the 5 mix design and for laboratory dynamic modulus, flow number, Hamburg wheel tracking and 6 axial fatigue tests. The mix was produced according to the volumetric specifications, but the 7 in place density was higher than the target. Laboratory tests indicated poor resistance to 8 rutting. Nonetheless, the full scale performance illustrated rutting is not a large concern 9 because the thin structure and compliant material properties do not induce stresses that 10 contribute to rutting. Top down cracking was significantly delayed due to the presence of the 11 thin overlay but once aged and brittle the treatment cannot delay cracking. 12
13 14 15
16 17 Key Words: 4.75mm, Nominal Maximum Aggregate Size, Accelerated Loading, 18 Accelerated Aging, Performance Test 19 20 21 22 23 24 25 26 INTRODUCTION 27
Thin overlays of fine asphalt concrete (AC) are an effective pavement 28 preservation strategy when appropriate. A 2004 survey of state agencies by the National 29 Center for Asphalt Technologies (NCAT) indicated several states were using 4.75 mm 30 nominal maximum aggregate size (NMAS) mixtures or mix types reasonably close to the 31 AASHTO criteria (1). The survey also confirmed that more agencies were interested in using 32 4.75 mm NMAS mixes in the future. Thin lift 4.75 mm NMAS mixes restore surface texture 33 and ride quality but also have advantages such as providing a use for excess fine aggregate 34 screenings and leveling courses to decrease construction time. 35 36
Several states have many years of successful experience in using 4.75mm NMAS mix 37 thin overlays with both Superpave and Marshall mix design methods (2). However, the 38 success of these applications was mostly based upon local experience until the development 39 of the AASHTO specifications for 4.75mm Superpave mixtures in 2002 (3). The original 40 NCAT study with two aggregate sources provided initial criteria for a 4.75mm NMAS 41 Superpave mix design. Other criteria for refinement were recommended such as the 42 maximum and minimum voids of mineral aggregate (VMA), aggregates properties, binder 43 content and design air voids. A recently completed study by NCAT refined and field 44 validated these criteria (1). In that study, a very comprehensive work plan was developed and 45 incorporated 29 laboratory Superpave mixes designed with materials from nine states. These 46
TRB 2012 Annual Meeting Original paper submittal - not revised by author.

3
mixes were tested and evaluated for permanent deformation, permeability, moisture damage 1 susceptibility, and durability. The proposed mix design criteria and field construction criteria 2 were validated and established by four of the original nine participating state highway 3 agencies in constructed projects. 4 5
Compared to the number of comprehensive studies regarding the mix design, a 6 thorough literature search found limited published research on the performance of the 7 4.75mm Superpave mix, which could be due to the fact that this kind of mix is mostly used in 8 thin lifts for light traffic application. Most researchers paid most attention to the durability 9 and moisture sensitivity. Zaniewski et al. (2) studied 4.75mm NMAS mixes with 100% 10 crushed and a 60/40 blend of crushed limestone and natural sand. The rutting potential of the 11 mixes with natural sand was much greater than that of the mixes with 100% crushed material. 12 Recent research by Rahman et al. (4) evaluated the performance of 12 laboratory designed 13 Superpave mixes using the Hamburg Wheel Tracking Device (HWTD) and found the rutting 14 performance of the 4.75mm mixes was aggregate-source specific. The research finished by 15 NCAT (1) also evaluated the permanent deformation using a Mixture Verification Tester 16 which is similar to the Asphalt Pavement Analyzer. Experimental results show great potential 17 for permanent deformation and suggest it could be due to the higher asphalt content in the 18 4.75mm mixes. However, it must be recognized such performance tests are applied to 19 materials placed in thicker layers where stress conditions imposed by tires can be quite 20 different and thus performance. Direct comparisons between lab tests from thin lift mixes and 21 thicker structural layers may not be entirely appropriate. 22
23 As agencies like Virginia implement the NCAT recommendations, trial sections of 24
new mix design specifications are utilized to confirm materials, design and construction and 25 identify any potential adjustments. Consequently, it is of interest to compare and contrast 26 the laboratory properties with other mixtures and gather any full scale performance 27 observations. It is also important to note that the FHWA / AASHTO Transportation 28 System Preservation (TSP) Research, Development, and Implementation Roadmap 29 identifies research needed in areas relating to preservation performance data collection, 30 tools to quantify of benefits and life, and incorporation of preservation into design. Test 31 section trials bring opportunities to address this research topic. 32
33 The research presented herein focused on exploratory evaluation of cracking and 34
rutting performance of a 4.75mm NMAS thin overlay replicating a thin overlay 35 preservation treatment using full-scale accelerated aging and loading. A trial 4.75mm 36 NMAS mix from Virginia DOT was placed as a 25mm thick inlay on existing accelerated 37 pavement test sections which were reserved and left unloaded from a preceding study. 38 The ALF placement was the second in a series of trial sections where the first trial on a 39 low volume road identified some changes in the design air void content and fine 40 aggregate content to decrease the permeability. 41
42 The construction produced a test section where half of the loaded wheelpath was 43
paved with the 4.75mm NMAS mix allowing a direct comparison of cracking 44 performance with and without the thin treatment. Full scale accelerated aging was 45 utilized to compare the fatigue cracking performance for four combinations of with and 46 without the 4.75mm NMAS treatment plus with and without aging. Loose material was 47 collected from construction for laboratory testing. Test specimens compacted to the same 48
TRB 2012 Annual Meeting Original paper submittal - not revised by author.

4
air void level as the test sections were prepared using the production mix without any 1 further artificial aging and also long-term oven aged. Various performance tests to 2 characterize the engineering properties of the material were dynamic modulus, Hamburg 3 Wheel Tracking, flow number and axial fatigue tests. 4
5 6 Research Objective 7 8
The objectives of this study can be summarized as follows: 9 10 1. To develop an adjusted mix design to decrease permeability and improve 11
compactability; 12 2. To evaluate the mix performance characteristics in full-scale rutting and cracking 13
as well as laboratory characterization; 14 3. To quantify the changes in mix performance due to aging; and 15 4. To quantify the performance and benefits as a thin inlay in aged pavements, 16
particularly the effect on the development of top down cracking. 17 18 19 MATERIALS AND MIX DESIGN 20 21
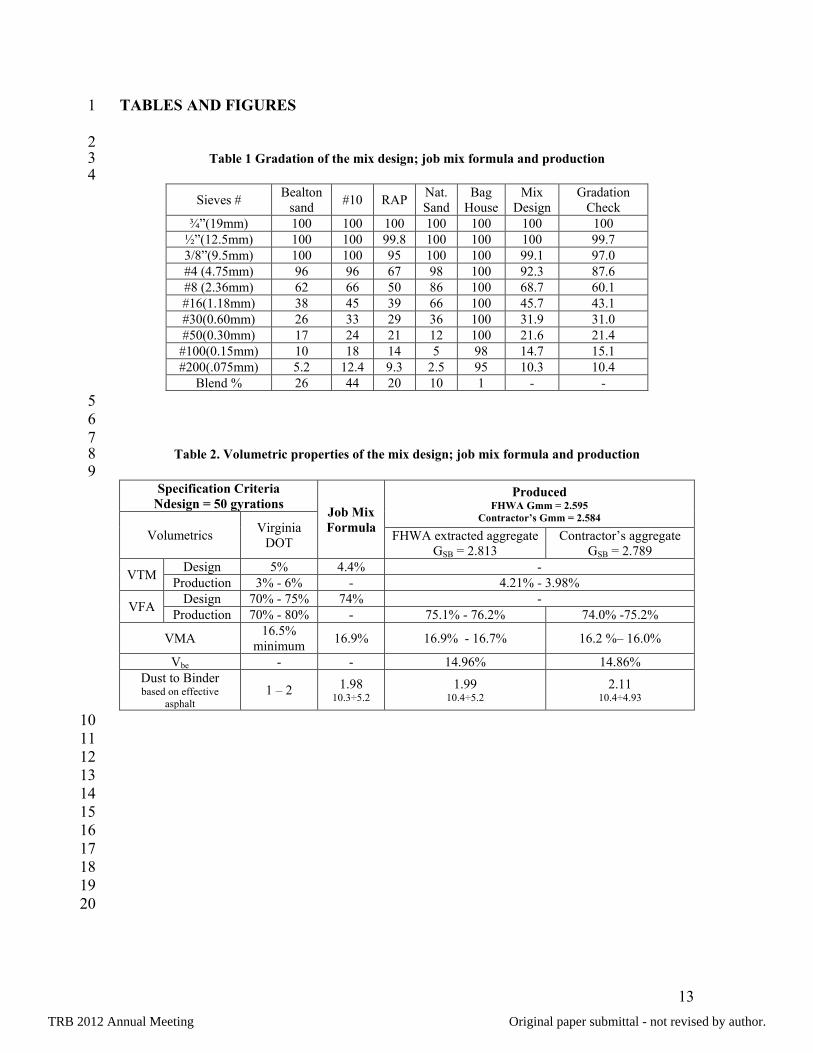
A Superpave 4.75mm mix was designed by the Superior Paving Corporation 22 headquartered in Bristow, Virginia. The aggregate blend is 44% fine aggregate screening, 23 26% manufactured sand, 20% fine recycled asphalt pavement (RAP) and #10% natural 24 sand. The aggregate gradation and volumetrics are summarized in Table 1 and Table 2. A 25 PG 76-22 polymer modified asphalt binder was used to produce the mix. It can be seen 26 that the final mix design basically met most of the Superpave mix design criteria for 50 27 gyrations recommended by James et al (3). Specifically it has as high as 10% passing the 28 0.075mm sieve, 30% to 54% passing on the 1.18mm sieve, over 16% VMA and 29 approximately 75% VFA. The dust-to-binder ratio is above 1.5 and the volume of 30 effective binder is less than 13.5%- both criteria recommended by NCAT for good rutting 31 resistance (1). 32
33 The gradation and asphalt content of the production mix was checked by 34
extraction using Trichloroethylene (TCE) solvent. Two replicates were tested and the 35 average gradation is shown in the last column in Table 1. The gradation from the loose 36 mix is plotted with that of the mix design in Figure 1. Consistent gradation was found for 37 the sieve 1.18mm (#16) and smaller sizes. A noticeable difference for the 2.36mm (#8) 38 and 4.75mm (#4) sieves was observed. The loose mix was found to be slightly coarser 39 than the design and the loose mix could actually be classified as a 9.5mm NMAS mix. 40 The extracted asphalt binder was tested to be a PG82-22 binder reflecting the 41 contributions from 20% RAP used. The volumetrics, including the asphalt content, VMA, 42 VFA and ratio of dust to effective binder content meet all mix design targets. 43
44 45
CONSTRUCTION AND SAMPLE PREPARATION 46
TRB 2012 Annual Meeting Original paper submittal - not revised by author.

5
1 A layout of the inlay construction of the ALF is provided in Figure 2 where a 4-2
meter wide lane (paved width) is divided into two sites for two separate ALF tests (wheel 3 paths with lateral wander). Each loaded area site can then be further divided into two 4 sections. The inlay was installed across three existing test lanes; Lane 8 control PG70-22, 5 Lane 9 SBS “64-40” and Lane 10 Air Blown. The pavement was milled to an average 6 depth of 28 mm +/- 4 mm and then a tack coat was applied before placing the mix. The 7 temperature of the mix behind the paver was 124°C (255°F). The mix was foamed at the 8 plant at the contractor’s discretion although Warm Mix Asphalt (WMA) was not 9 specifically prescribed. Density was approximately monitored during rolling with a 10 nuclear gauge. Three slabs were cut from Lane 8 to verify the air void level and for 11 falling head permeability tests conducted by VDOT (Test Method 120). One slab was 12 found to have an air void content of 10.4% and the other two have 13.1% and 13.2% air 13 voids. The permeability test shows 142x10-5, 708 x10-5 and 772 x10-5 cm/sec for the three 14 specimens. Two of three are higher than that recommended by the NCAT study 15 suggesting more susceptible to permeability related distress (moisture damage and 16 aging). A total of 18 extra field cores were also taken from various locations a few days 17 after the construction. The cores were trimmed to remove the overlay and density was 18 measured using the surface saturated dry method (AASHTO T-166). The field cores were 19 found to have an average in-place air voids of 13.2% and a range from 10.4% to 16.3% 20 with a standard deviation of 1.4%. This is noticeably higher than VDOT’s specification 21 target of 10% air void content, but consistent with that of the four field validation projects 22 as reported by the NCAT study (1). This was mostly attributed to the types of rollers 23 used. It now recommended that larger rollers (27,000 lb) are necessary for construction 24 rather than the 15,000 lb and 8,000 lb roller used for breakdown and finish rolling. 25
26 Production mix was sampled from the haul truck at the construction site. The 27
loose mix was reheated and compacted using the Superpave gyratory compactor to 28 150mm in diameter and 180mm in height with a target air voids of 13% to match the in-29 place air voids. Only the gyratory compacted samples that are within 13±0.5% air voids 30 were then used to core and cut into the performance test specimens. One set of three 31 specimens was compacted with 10±0.5% air voids to investigate the impact of air voids 32 on the permanent deformation resistance. Four 60 mm high and 150 mm in diameter 33 specimens with 13% air voids were also compacted for Hamburg Wheel Tracking test. 34 35 36 CONDITIONING AND TESTING 37
38 Full-Scale Accelerated Performance Testing 39 40
The Accelerated Load Facilities (ALFs) are used to rapidly collect data on 41 pavement performance under conditions in which axle loading and pavement temperature 42 are controlled. The accelerated loading utilized a wide base tire type 425a, 71 kN wheel 43 load, and 827 kPa tire inflation pressure. The effective contact area was between 0.0715 44 m2 and 0.0761 m2 which was about 80% to 85% of the uniformly loaded circular contact 45
TRB 2012 Annual Meeting Original paper submittal - not revised by author.

6
area and results in an effective contact stress between 1032 kPa and 971 kPa. More 1 details of the accelerated testing are available in another FHWA research report (5). 2
3 The 4.75mm mix inlay in Lane 8 was not subjected to accelerated ageing while 4
the inlay in Lane 10 was exposed where the protocol is to use radiant heaters to heat the 5 pavement continuously at 74°C for a period of 8 weeks before loading. The half-and-half 6 layout of the 4.75mm mix inlay within the wheel path allows the performance of the ALF 7 sections with and without the treatment to be characterized at the same time. Fatigue 8 loading was controlled at 19oC. The ALF devices were stopped at regular intervals for 9 both pavement performance assessment and maintenance. Cracks were manually traced 10 onto clear Mylar plastic sheets as they formed at the surface of the pavements to measure 11 the percentage of area cracked in the loaded area. Rut depth is quantified by essentially 12 the change in the thickness of the asphalt layer due to permanent deformation. The Layer 13 Deformation Measurement Assembly (LDMA) was installed in the asphalt. 14 15 Laboratory Performance Testing 16 17
Three groups of differently conditioned laboratory specimens were tested for 18 performance in this study; as produced without any aging and long-term oven aging 19 following AASHTO R30 both with and without constraint meshes recommended by 20 NCHRP 9-23 to minimize specimen slump during oven aging. 21
22 The Hamburg Wheel-Track Device (HWTD) has been successfully used to screen 23
mixtures for susceptibility to moisture damage or stripping. The test was conducted at 24 the same 64oC as the ALF mixes to be able to make direct comparisons. 25 26
NCHRP Project 9-19 (6) found dynamic modulus test results at 37.8 and 54.4 °C 27 correlated well with rutting resistance and a fair correlation between cracking. The 28 mechanistic–empirical pavement design guide (MEPDG) uses the dynamic modulus of 29 asphalt mixtures as the key parameter in the flexible pavement design that controls the 30 permanent deformation and fatigue cracking resistance of asphalt pavements. In this 31 study, dynamic modulus was measured at 4.4, 21.1, 37.8 and 54.4°C, and frequencies of 32 20, 10, 5, 1, 0.5 and 0.1Hz on three replicates. The test was performed on an Asphalt 33 Mixture Performance Tester (AMPT) following the AASHTO TP79 test procedure. 34 35
The flow number test simulates repeated wheel passes from traffic, and the output 36 from this test is the number of load cycles the material can tolerate until it reaches tertiary 37 flow, cycles to particular permanent strain value or, vice versa, strain at a particular 38 number of cycles. A stress state with 69 kPa confining pressure and 523 kPa deviator 39 stress approximated critical conditions at a depth near the edge of tires based on analysis 40 of induced stress states using an advanced viscoplastic model described by Gibson et al 41 (7). The deviator stress used in this study was increased to 827 kPa for practicality and 42 the temperature was set at 60°C for a direct comparison with the ALF structural mixes. 43 44
Flexural bending fatigue is the most standardized and practiced fatigue test 45 available for asphalt concrete. Christensen and Bonaquist (8) discussed the issues 46
TRB 2012 Annual Meeting Original paper submittal - not revised by author.
7
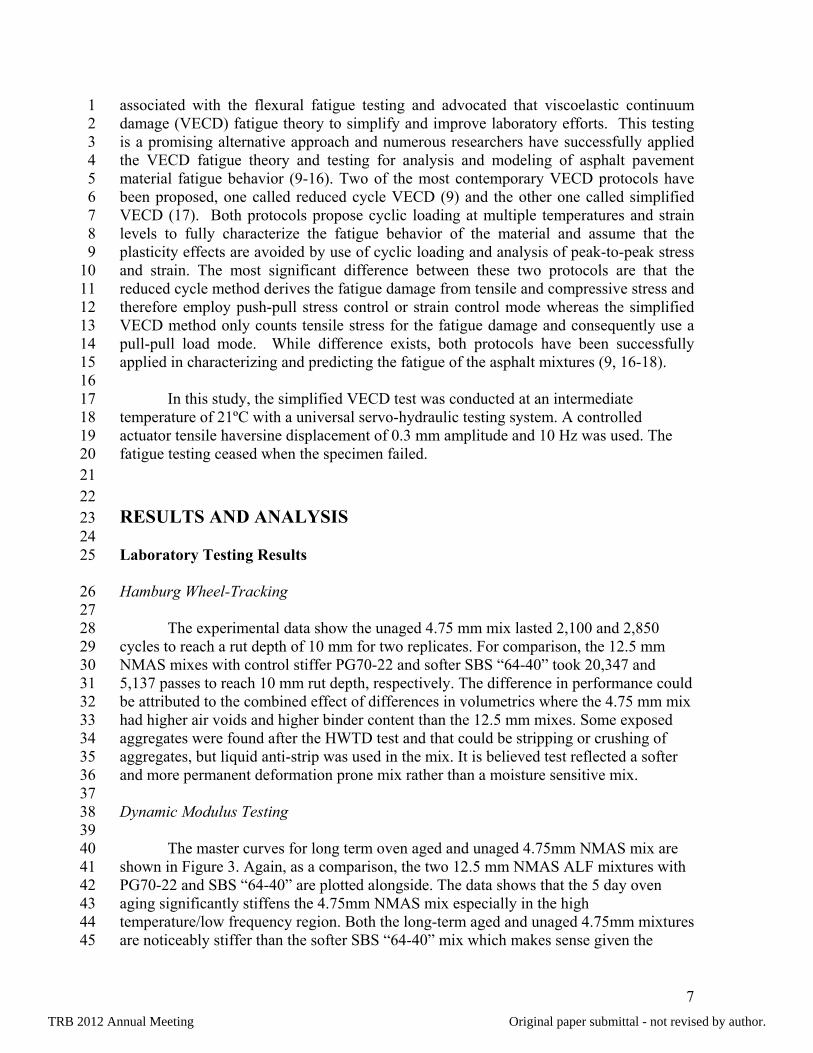
associated with the flexural fatigue testing and advocated that viscoelastic continuum 1 damage (VECD) fatigue theory to simplify and improve laboratory efforts. This testing 2 is a promising alternative approach and numerous researchers have successfully applied 3 the VECD fatigue theory and testing for analysis and modeling of asphalt pavement 4 material fatigue behavior (9-16). Two of the most contemporary VECD protocols have 5 been proposed, one called reduced cycle VECD (9) and the other one called simplified 6 VECD (17). Both protocols propose cyclic loading at multiple temperatures and strain 7 levels to fully characterize the fatigue behavior of the material and assume that the 8 plasticity effects are avoided by use of cyclic loading and analysis of peak-to-peak stress 9 and strain. The most significant difference between these two protocols are that the 10 reduced cycle method derives the fatigue damage from tensile and compressive stress and 11 therefore employ push-pull stress control or strain control mode whereas the simplified 12 VECD method only counts tensile stress for the fatigue damage and consequently use a 13 pull-pull load mode. While difference exists, both protocols have been successfully 14 applied in characterizing and predicting the fatigue of the asphalt mixtures (9, 16-18). 15 16
In this study, the simplified VECD test was conducted at an intermediate 17 temperature of 21ºC with a universal servo-hydraulic testing system. A controlled 18 actuator tensile haversine displacement of 0.3 mm amplitude and 10 Hz was used. The 19 fatigue testing ceased when the specimen failed. 20 21 22 RESULTS AND ANALYSIS 23 24 Laboratory Testing Results 25
Hamburg Wheel-Tracking 26 27
The experimental data show the unaged 4.75 mm mix lasted 2,100 and 2,850 28 cycles to reach a rut depth of 10 mm for two replicates. For comparison, the 12.5 mm 29 NMAS mixes with control stiffer PG70-22 and softer SBS “64-40” took 20,347 and 30 5,137 passes to reach 10 mm rut depth, respectively. The difference in performance could 31 be attributed to the combined effect of differences in volumetrics where the 4.75 mm mix 32 had higher air voids and higher binder content than the 12.5 mm mixes. Some exposed 33 aggregates were found after the HWTD test and that could be stripping or crushing of 34 aggregates, but liquid anti-strip was used in the mix. It is believed test reflected a softer 35 and more permanent deformation prone mix rather than a moisture sensitive mix. 36 37 Dynamic Modulus Testing 38
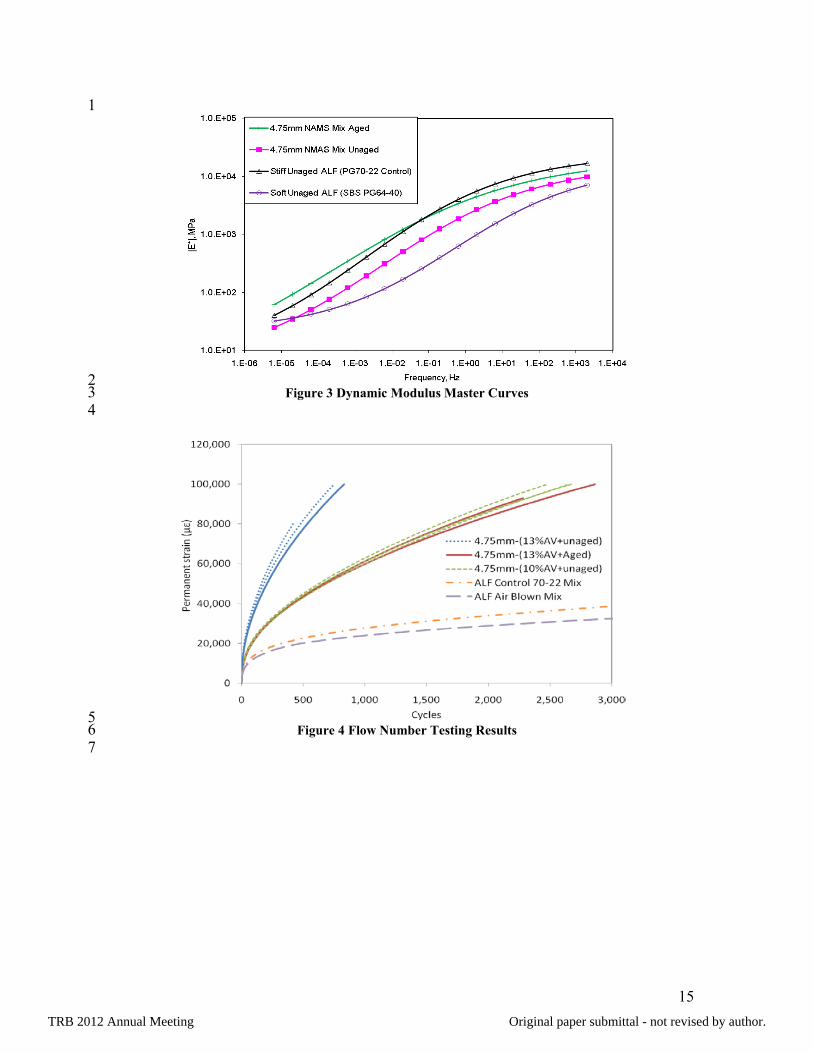
39 The master curves for long term oven aged and unaged 4.75mm NMAS mix are 40
shown in Figure 3. Again, as a comparison, the two 12.5 mm NMAS ALF mixtures with 41 PG70-22 and SBS “64-40” are plotted alongside. The data shows that the 5 day oven 42 aging significantly stiffens the 4.75mm NMAS mix especially in the high 43 temperature/low frequency region. Both the long-term aged and unaged 4.75mm mixtures 44 are noticeably stiffer than the softer SBS “64-40” mix which makes sense given the 45
TRB 2012 Annual Meeting Original paper submittal - not revised by author.

8
stiffness of the PG 76-22 binder combined with 20% RAP. However, the unaged 4.75mm 1 mix was softer than the ALF control mix, but long term aging increased it to a similar 2 magnitude where the aged 4.75mm mix was stiffer in the high temperature/low frequency 3 region yet softer in the low temperature /high frequency region. 4
5 Flow Number Testing 6 7
The results of the Flow Number testing for the 4.75mm NMAS mix are plotted in 8 Figure 4 in three conditions: unaged at 10% air voids, unaged at 13% air voids and long-9 term oven aged at 13% air voids. Results from the ALF control PG70-22 mix (Lane 8) 10 and ALF Air Blown mix (Lane 10) are plotted alongside. The Flow Number test results 11 show substantial effect of air voids on the rutting resistance of this 4.75mm NMAS mix. 12 Although no tertiary flow was observed from any of the testing at this stress state, 13 4.75mm NMAS mix may be classified as having a concerning level of rutting potential 14 when considered in light of the 12.5 mm NMAS mixes’ performance. This is consistent 15 with the results of the Hamburg test. However, because 4.75 mm type mixes are used as a 16 very thin layer the induced stresses in the upper region of the pavement should be 17 considered in light of the stresses in thicker pavement layers in the region several inches 18 deep under the edge of the tire. When a thin and soft layer such as the 4.75mm mix is 19 loaded by a tire, mostly multiaxial compressive stresses are induced whereas thicker 20 layers experience shear stresses deeper in the pavement. Thus, although the 4.75mm mix 21 may appear a rut susceptible, it should not be when placed very thin and near the surface. 22 Further, if the compaction met the 10% air void target, the rut resistance would be 23 notably higher. 24 25 Direct Tension Cyclic Fatigue Testing 26 27
Three replicates of long term oven aged and unaged (plant produced) 4.75mm 28 mix were tested in a cyclic, haversine direct tension fatigue test at 21°C with a frequency 29 of 10Hz. The protocol is written in a draft AASHTO format available from Hou et al 30 (18). The displacement level of the actuator was 0.3mm. Four loose core linear variable 31 displacement transducers (LVDTs) mounted on the specimens measured average strains 32 that actually increased during testing while stress decrease but at a much slower rate. The 33 stress and strain behavior is illustrated in Figure 5. The actual strains began between 300 34 and 400 microstrain and then grew until complete failure. The measured stress started 35 between 1,600 to 1,800 kPa and decreased gradually until failure. Compared to the strain, 36 the stress is more stable and therefore this kind of test is more like stress controlled. The 37 long term oven aging was found to clearly affect the behavior of the material with respect 38 to either stress or strain. 39
40 This is neither a strain-control nor a stress-control fatigue test, but the test 41
protocol is used because it is stable for test instruments to control when the specimen 42 loses its structural integrity during the test; thus controllability and repeatability. 43 Nonetheless, a classical reduction in dynamic modulus due to fatigue damage is observed 44 as shown in Figure 6. It is necessary to account for the test control using the viscoelastic 45 continuum damage (VECD) method where a damage characteristic curve is characterized 46
TRB 2012 Annual Meeting Original paper submittal - not revised by author.

9
which is independent of loading mode and frequency and temperature. Figure 7 shows 1 the damage characteristic curve that represents the loss in modulus or pseudostiffness (C) 2 as a function of the damage parameter (S) that represents the amount of micro cracking 3 damage. 4
5 Once the damage characteristic curve is obtained, the VECD-based fatigue life of 6
the mixture can be determined by simulating a pure strain control fatigue test with inputs 7 such as test temperature, frequency and strain levels. A strain range from 50 to 700 με 8 was selected for the simulation. The test specimens exhibited a localized macro crack and 9 thus failure interpreted from the peak in the phase angle when the pseudo stiffness 10 reached 0.42 and 0.51 for the unaged and long-term oven aged mixes. These different 11 values for each mix were taken as the definition of failure for the simulations. Figure 8 12 shows the predicted fatigue life as a function of strain. This figure shows that the long 13 term aging substantially decreases the fatigue life of the material. Aging reduced the 14 endurance limit (50million cycles) from 158 µε to 128 µε. Under a 200 µε loading the 15 unaged fatigue life is 5.4 times larger than the aged mixture. 16 17 Measured Rutting and Cracking from the ALF Pavement Tests 18
The average and standard deviation of the measured rut depths in Lane 8 with and 19 without the inlay and Lane 10 with and without the inlay are shown in Figure 9. The 20 plotted data are the rut depth in the fatigue cracking sections loaded using lateral wheel 21 wander whereas normally rutting is measured with less or no wander at an elevated 22 temperature. The subsections with the inlay had three locations for separate rut depth 23 measurements and the subsections without the inlay had four locations. It is clear that at 24 19oC the presence of the thin inlay does not present any poor rutting performance even 25 with high binder content, relatively low dynamic modulus and low resistance to 26 permanent deformation. The total rut depth of the HMA section with the underlying 27 structural mix and thin inlay is less than or equal to the rutting of the section without the 28 treatment. This behavior should still be checked with loading under high temperatures. 29
30 Full-scale fatigue at 19oC is illustrated and quantified in Figure 10 for cracking 31
performance up to the point of first crack initiation at the surface. Figure 11 shows the 32 cracking performance up to the point of about 15% cracked area. Normally, fatigue 33 cracking in this type of APT experiment is quantified from the entire site’s loaded area. 34 However, since Site 4 in Lane 8 and Lane 10 evaluated the 4.75 mm mix using half 35 subsections, the performance of these subsections must be compared against the 36 equivalent neighboring Site 3 subsections that were tested at a much younger unaged 37 condition. The unaged 4.75mm NMAS inlay first cracked at 425,000 passes which was 38 slightly lower than 500,000 passes to produce an initial crack in the corresponding 39 neighboring subsection unaged without the treatment loaded at an earlier date. In 40 contrast, the aged subsection without the treatment cracked with much less loading at 41 50,000 passes. This illustrates that a soft (compliant), unaged 4.75mm NMAS overlay has 42 a substantial ability to delay top-down cracking. The same conclusion is reached when 43 the passes to 15% cracked area are considered in Figure 11. 44
45
TRB 2012 Annual Meeting Original paper submittal - not revised by author.

10
The relative performance of an aged 4.75mm NMAS overlay is evaluated from 1 the Lane 10 performance in Figure 10 and Figure 11. The performance of the aged inlay 2 is nearly identical to the performance of the aged subsection without the treatment. This 3 illustrates that once thin overlay becomes brittle with age there is little to no benefit and 4 preservation should be considered again. 5 6 7 CONCLUSIONS 8
The laboratory tests, full-scale construction and performance has revealed several 9 key aspects regarding Superpave designed 4.75mm NMAS thin overlays: 10
• The NCAT recommendations for 4.75mm NMAS Superpave criteria appear very 11 sound and valid. A mix was able to be designed and produced using local 12 materials including a relatively large quantity of RAP. The contractor elected to 13 produce the mix as a WMA using water foaming. 14
• Construction should still utilize an aggressive rolling pattern. Do not be misled by 15 the notion that a fine mix having high binder content will be easier to compact 16 and require smaller rollers. This is likely due to fine aggregate surface area and 17 contact points. Fine mixes can and do out-perform coarse-graded mixes. 18
• Volumetrics with high binder content and relatively high in place density targets 19 relative to larger NMAS mixes would suggest that rutting will be a problem. The 20 in place density criteria specified by Virginia DOT is 10% VTM. Laboratory tests 21 for dynamic modulus, Hamburg wheel tracking and flow number further suggest a 22 rut prone mix which can be misleading. 23
• Full-scale rutting measured at 19°C during fatigue loading indicated no concerns. 24 A higher level of in place density would have improved the performance even 25 more. 26
• The relatively low stiffness and thin application work to the advantage of the mix 27 by resulting in mostly compressive stresses (less shear and tensile) likely 28 explaining the rutting which was better or equal to a full structural layer of a 29 larger 12.5mm NMAS layer. 30
• Laboratory aging with wire mesh supports had no effect on dynamic modulus 31 master curve and fatigue resistance possibly due to stiff binder with RAP. 32
• Thin 4.75mm NMAS overlays used as a preservation treatment have the ability to 33 significantly delay top down cracking, but once such thin layers becomes brittle 34 with age that benefit is lost. A higher level of in place density would have 35 improved the performance even more. 36
37 38
ACKNOWLEDGEMENTS 39
The authors want to thank Dave Helmick and Dickie Maddox from Superior Paving 40 whose cooperation and assistance was vital to the trial section. Scott Parobeck and Frank 41 Davis in the Bituminous Mixtures Laboratory; Adrian Andriescu, LaKesha Perry and 42 Monte Simpson in the Binder Rheology Laboratory; and Dennis Lim, Jason Metcalf and 43 Mario Tinio in the Accelerated Load Facility at the FHWA Turner-Fairbank Highway 44
TRB 2012 Annual Meeting Original paper submittal - not revised by author.

11
Research Center are recognized for providing their expert attention in the performance 1 data collection, specimen preparation and running the laboratory tests. 2 3 4 REFERENCES 5
1. West R., M. Heitzman, D. Rausch and G. Julian. Laboratory Refinement and Field 6 Validation of 4.75 mm Superpave Designed Asphalt Mixtures. Research Report. 7 National Center for Asphalt Technology, 2011. 8 9
2. Zaniewski J. and D. Diaz. Evaluation of 4.75 mm Superpave Mix Criteria for West 10 Virginia. Research Report. University of West Virginia, 2004. 11 12
3. James R., A. Cooley and S. Buchanan. Development of Mix Design Criteria for 4.75-13 mm Superpave Mixes. Transportation Research Record 1819, Transportation 14 Research Board, National Research Council, Washington, DC, 2003, pp. 125-133. 15 16
4. Rahman F., M. Hossain, S. Romanoschi and C. Hobson. Evaluation of 4.75-mm 17 Superpave Mixture. Transportation Research Board Annual Meeting CD-ROM, 18 National Research Council, Washington, DC, 2010. 19 20 21
5. Gibson N., X Qi, A. Shenoy, G. Al-Khateeb, M. Kutay, A. Andriescu, K. Stuart, J. 22 Youtcheff and T. Harman. Full-Scale Accelerated Performance Testing for Superpave 23 and Structural Validation. Report FHWA-RD-XX-XX. FHWA, U.S. Department of 24 Transportation, 2010. 25 26
6. Witczak, M. W., K. Kaloush, T. Pellinen, M. El-Basyouny, and H. Von Quintus. 27 NCHRP Report 465: Simple Performance Test for Superpave Mix Design. 28 Transportation Research Board, National Research Council, Washington, D.C., 2002. 29 30
7. Gibson, N., M. E. Kutay, D. Keramat, and J. Youtcheff. Multiaxial Strain Response 31 of Asphalt Concrete Measure During Flow Number Simple Performance Test. 32 Journal of the Association of Asphalt Paving Technologists, Vol. 78, 2009, pp. 25–33 66. 34 35
8. Christensen, D. and R. Bonaquist. Practical Application of Continuum Damage 36 Theory to Fatigue Phenomena in Aspahlt Concrete Mixtures. Journal of the 37 Association of Asphalt Paving Technologists, Vol. 74, 2005, pp. 963-1001. 38
39
9. Christensen, D. and R. Bonaquist. Analysis of HMA Fatigue Data Using the Concepts 40 of Reduced Loading Cycles and Endurance Limit. Journal of the Association of 41 Asphalt Paving Technologists, Vol. 78, 2008, pp. 377-416. 42 43
TRB 2012 Annual Meeting Original paper submittal - not revised by author.

12
10. Kim, Y. R., and D. N. Little. One-Dimensional Constitutive Modeling of Asphalt 1 Concrete. Journal of Engineering Mechanics, Vol. 116, No. 4, April 1990, pp. 751–2 772. 3 4
11. Daniel, J. S. Development of a Simplified Fatigue Test and Analysis Procedure Using 5 a Viscoelastic Continuum Damage Model and Its Implementation to Westrack 6 Mixtures. Ph.D. Dissertation. North Carolina State University, Raleigh, 2001. 7 8
12. Chehab, G. R. Characterization of Asphalt Concrete in Tension Using a 9 Viscoelastoplastic Model. Ph.D. Dissertation. North Carolina State University, 10 Raleigh, 2002. 11 12
13. Lundstrom, R., and U. Isacsson. Asphalt Fatigue Modeling Using Viscoelastic 13 Continuum Damage Theory. Road Materials and Pavement Design, Vol. 4, No. 1, 14 2003. 15 16
14. Christensen, D. W., and R. F. Bonaquist. Practical Application of Continuum Damage 17 Theory to Fatigue Phenomena in Asphalt Concrete Mixtures. Journal of the 18 Association of Asphalt Paving Technologists, Vol. 74, 2005, pp. 963–1002. 19 20
15. Gibson, N. H. A Viscoelastoplastic Continuum Damage Model for the Compressive 21 Behavior of Asphalt Concrete. Ph.D. dissertation. University of Maryland, College 22 Park, 2006. 23 24
16. Kutay, M., N. Gibson and J. Youtcheff. Conventional and Viscoelastic Continuum 25 Damage (VECD) – Based Fatigue Analysis of Polymer Modified Asphalt Pavements. 26 Journal of the Association of Asphalt Paving Technologists, Vol. 78, 2008, pp. 395-27 425. 28 29
17. Underwood, S., R. Kim and M. Guddati. Improved Calculation Method of Damage 30 Parameter in Viscoelastic Continuum Damage Model. International Journal of 31 Pavement Engineering, Volume 11, Issue 6, pp. 459-476, 2010. 32 33
18. Hou, T., S. Underwood and R. Kim. Fatigue Performance Prediction of North 34 Carolina Mixtures Using the Simplified Viscoelastic Continuum Damage Model. 35 Journal of the Association of Asphalt Paving Technologists, Vol. 79, 2010, pp. 35-80. 36 37
38
TRB 2012 Annual Meeting Original paper submittal - not revised by author.
13
TABLES AND FIGURES 1
2 Table 1 Gradation of the mix design; job mix formula and production 3
4 Sieves # Bealton
sand #10 RAP Nat. Sand
Bag House
Mix Design
Gradation Check
¾”(19mm) 100 100 100 100 100 100 100 ½”(12.5mm) 100 100 99.8 100 100 100 99.7 3/8”(9.5mm) 100 100 95 100 100 99.1 97.0 #4 (4.75mm) 96 96 67 98 100 92.3 87.6 #8 (2.36mm) 62 66 50 86 100 68.7 60.1 #16(1.18mm) 38 45 39 66 100 45.7 43.1 #30(0.60mm) 26 33 29 36 100 31.9 31.0 #50(0.30mm) 17 24 21 12 100 21.6 21.4
#100(0.15mm) 10 18 14 5 98 14.7 15.1 #200(.075mm) 5.2 12.4 9.3 2.5 95 10.3 10.4
Blend % 26 44 20 10 1 - - 5
6 7
Table 2. Volumetric properties of the mix design; job mix formula and production 8 9
Specification Criteria Ndesign = 50 gyrations Job Mix
Formula
Produced FHWA Gmm = 2.595
Contractor’s Gmm = 2.584 Volumetrics Virginia
DOT FHWA extracted aggregate GSB = 2.813
Contractor’s aggregate GSB = 2.789
VTM Design 5% 4.4% - Production 3% - 6% - 4.21% - 3.98%
VFA Design 70% - 75% 74% - Production 70% - 80% - 75.1% - 76.2% 74.0% -75.2%
VMA 16.5% minimum 16.9% 16.9% - 16.7% 16.2 %– 16.0%
Vbe - - 14.96% 14.86% Dust to Binder based on effective
asphalt 1 – 2 1.98
10.3÷5.2 1.99
10.4÷5.2 2.11
10.4÷4.93
10 11 12 13 14 15 16 17 18 19
20
TRB 2012 Annual Meeting Original paper submittal - not revised by author.

14
1
Figure 1 Mix Design Gradation 2 3
4
1 2 3 4 5 6 7 8 9 10 11 12
RuttingTest
FatigueTest
Completed Fatigue Test
Completed Rutting Test
ALF2
ALF1
4.75 mm Mix Tests 5
6 Figure 2 Layout of ALF Test Sites with 4.75mm Mix Inlay 7
8 9
10 11 12 13
TRB 2012 Annual Meeting Original paper submittal - not revised by author.
15
1
2 Figure 3 Dynamic Modulus Master Curves 3
4
5 Figure 4 Flow Number Testing Results 6
7
TRB 2012 Annual Meeting Original paper submittal - not revised by author.

16
1 (a) 2
3
4 (b) 5
6 Figure 5 Measured Stress and Strain in the Fatigue Test: (a) Stress; (b) Strain 7
8 9
10 Figure 6 Modulus Reduction During the Fatigue Test 11
12
TRB 2012 Annual Meeting Original paper submittal - not revised by author.

17
1 2
Figure 7 Damage Characteristic Curve 3 4
5
6 7
Figure 8 Predicted Fatigue Life for Various Strains 8 9
TRB 2012 Annual Meeting Original paper submittal - not revised by author.

18
1 (a) 2
3 (b) 4
Figure 9. Measured Rut Depth (a) Lane 8 without Inlay and with Unaged Inlay and (b) Lane 10 5 without Inlay and with Aged Inlay. 6
7
TRB 2012 Annual Meeting Original paper submittal - not revised by author.

19
1 Figure 10 Digitized Crack Maps of Subsections Showing Cracks at first Appearance Annotated by 2
the Number of Passes When Cracks Appeared 3 4
5
TRB 2012 Annual Meeting Original paper submittal - not revised by author.

20
1 Figure 11 Digitized Crack Maps of Subsections Showing Cracks at First Appearance Annotated by 2
the Number of Passes When 15% Cracked Area Appeared 3 4
TRB 2012 Annual Meeting Original paper submittal - not revised by author.


![[ THE EVENT ] - Artscape · 5 Artscape Wrap-Up Report ... Gamescape honcho . Baltimore Business Journal . ... 4.75" x 4.75"/1.1 Million Readers Per Week/2 Ad Runs](https://img.pdfslide.net/doc/110x75/5b50267d7f8b9a256e8dc992/-the-event-5-artscape-wrap-up-report-gamescape-honcho-baltimore-business.jpg)


![[ Sample Image: Place a 9.5” x 4.75” image here ]](https://img.pdfslide.net/doc/110x75/568151c6550346895dbffbe6/-sample-image-place-a-95-x-475-image-here-.jpg)


