Embed Size (px)
Citation preview
LABORATORY COMPACTION CHARACTERISTICS AND MOISTURE-
DENSITY RELATIONSHIP OF SUBGRADE, EMBANKMENT SOILS, AND
BACKFILL MATERIAL
TXDOT DESIGNATION: TEX-114-E
CONSTRUCTION DIVISION 1 – 14 EFFECTIVE DATE: FEBRUARY 2011
Test Procedure for
LABORATORY COMPACTION CHARACTERISTICS
AND MOISTURE-DENSITY RELATIONSHIP OF
SUBGRADE, EMBANKMENT SOILS, AND BACKFILL
MATERIAL
TxDOT Designation: Tex-114-E
Effective Date: February 2011
1. SCOPE
1.1 Use this test method to determine the relationship between water content and the dry unit
mass (density) of sub-grade and embankment materials.
1.1.1 Part I is a subgrade or embankment sample, 4 in. (101.6 mm) in diameter and 6 in.
(152.4 mm) high, is molded in four layers, using a 5.5 lb. (2.5 kg) hammer dropped
25 times per layer from a height of 12 in. (304.8 mm). This part is intended for plastic
and fine-grain soils, such as silts and clays (ML, MH, CL, and CH classifications as
determined by Tex-142-E.)
1.1.2 Part II is a subgrade or embankment sample, 6 in. (152.4 mm) in diameter and 8 in.
(203.2 mm) high, is molded in four layers using a 5.5 lb. (2.5 kg) hammer dropped
75 times per layer from a height of 12 in. (304.8 mm). This part is intended for plastic,
and coarse-grain soils, such as sands and gravels with fines (GM, GC, SM, and SC
classifications as determined by Tex-142-E.)
1.1.3 Part III is a cohesionless backfill (sand/silt) sample, 4 in. (101.6 mm) in diameter and
6 in. (152.4 mm) in height, is molded in four layers, using a 10 lb. (4.54 kg) hammer
dropped 61 times per layer from a height of 12 in. (304.8 mm). Perform the test in Part III
on prepared materials passing the 1/4 in. (6.3 mm) sieve. This part is intended for clean,
cohesionless sands used for MSE backfill (SW and SP classifications as determined by
Tex-142-E.)
1.2 Follow Tex-113-E to determine moisture-density relationships of flexible base materials,
coarse-grained materials containing particles larger than 7/8 in. (22.4 mm), and treated
subgrade and embankment materials. Use of the Soil Compactor Analyzer (SCA) is
required at this time for flexible base materials only.
1.3 The values given in parentheses (if provided) are not standard and may not be exact
mathematical conversions. Use each system of units separately. Combining values from
the two systems may result in nonconformance with the standard.
LABORATORY COMPACTION CHARACTERISTICS AND MOISTURE-
DENSITY RELATIONSHIP OF SUBGRADE, EMBANKMENT SOILS, AND
BACKFILL MATERIAL
TXDOT DESIGNATION: TEX-114-E
CONSTRUCTION DIVISION 2 – 14 EFFECTIVE DATE: FEBRUARY 2011
2. DEFINITIONS
2.1 Maximum Dry Density (Da)—Maximum dry density is the maximum value obtained by
the compaction curve using the specified compactive effort.
2.2 Optimum Water Content (Wopt)—Optimum water content is the water content at which
the soil can be compacted to the Da.
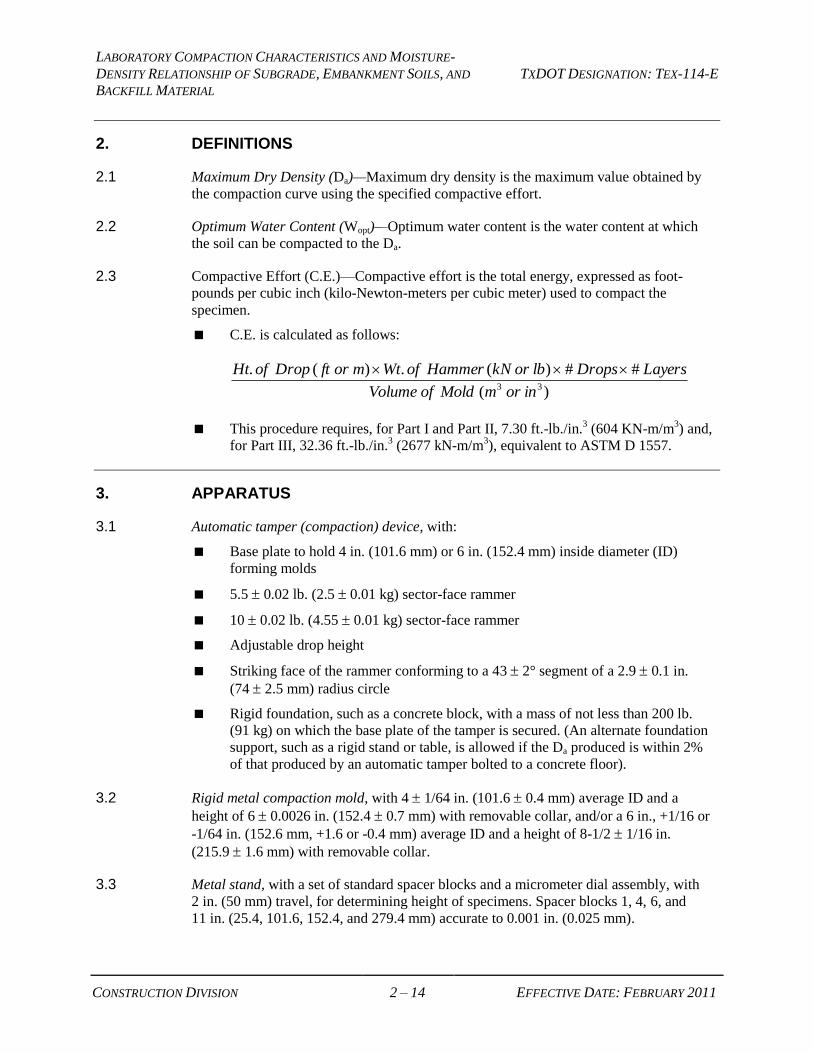
2.3 Compactive Effort (C.E.)—Compactive effort is the total energy, expressed as foot-
pounds per cubic inch (kilo-Newton-meters per cubic meter) used to compact the
specimen.
C.E. is calculated as follows:
)(
##)(.)(.33 inormMoldofVolume
LayersDropslborkNHammerofWtmorftDropofHt
This procedure requires, for Part I and Part II, 7.30 ft.-lb./in.3 (604 KN-m/m
3) and,
for Part III, 32.36 ft.-lb./in.3 (2677 kN-m/m
3), equivalent to ASTM D 1557.
3. APPARATUS
3.1 Automatic tamper (compaction) device, with:
Base plate to hold 4 in. (101.6 mm) or 6 in. (152.4 mm) inside diameter (ID)
forming molds
5.5 0.02 lb. (2.5 0.01 kg) sector-face rammer
10 0.02 lb. (4.55 0.01 kg) sector-face rammer
Adjustable drop height
Striking face of the rammer conforming to a 43 2° segment of a 2.9 0.1 in.
(74 2.5 mm) radius circle
Rigid foundation, such as a concrete block, with a mass of not less than 200 lb.
(91 kg) on which the base plate of the tamper is secured. (An alternate foundation
support, such as a rigid stand or table, is allowed if the Da produced is within 2%
of that produced by an automatic tamper bolted to a concrete floor).
3.2 Rigid metal compaction mold, with 4 1/64 in. (101.6 0.4 mm) average ID and a
height of 6 0.0026 in. (152.4 0.7 mm) with removable collar, and/or a 6 in., +1/16 or
-1/64 in. (152.6 mm, +1.6 or -0.4 mm) average ID and a height of 8-1/2 1/16 in.
(215.9 1.6 mm) with removable collar.
3.3 Metal stand, with a set of standard spacer blocks and a micrometer dial assembly, with
2 in. (50 mm) travel, for determining height of specimens. Spacer blocks 1, 4, 6, and
11 in. (25.4, 101.6, 152.4, and 279.4 mm) accurate to 0.001 in. (0.025 mm).
LABORATORY COMPACTION CHARACTERISTICS AND MOISTURE-
DENSITY RELATIONSHIP OF SUBGRADE, EMBANKMENT SOILS, AND
BACKFILL MATERIAL
TXDOT DESIGNATION: TEX-114-E
CONSTRUCTION DIVISION 3 – 14 EFFECTIVE DATE: FEBRUARY 2011
3.4 Balance, Class G2 in accordance with Tex-901-K, with a minimum capacity of 35 lb.
(15 kg).
3.5 Extra base plate, secured on a rigid stand to hold the forming mold.
3.6 Hydraulic press, to extrude molded specimens.
3.7 Drying oven, maintained at 230 9F (110 5C).
3.8 Metal pans, wide and shallow for mixing and drying materials.
3.9 Circular porous stones, slightly less than 6 in. (152.4 mm) in diameter and 2 in. (51 mm)
high.
3.10 Supply of small tools, including a 4–5 lb. (1.8–2.3 kg) rawhide hammer, level, finishing
tool, and others.
3.11 Standard U.S. sieves, meeting the requirements of Tex-907-K, in the following sizes:
1-3/4 in. (45 mm)
7/8 in. (22.4 mm)
3/8 in. (9.5 mm)
No. 4 (4.75 mm).
4. CALIBRATING EQUIPMENT
4.1 Calibrate equipment in accordance with Tex-198-E. In addition, calibrate equipment
before initial use, after repair, or after any occurrence that might affect the test results.
4.2 Follow the steps outlined in Tex-113-E, Section 4.
PART I—MEASURING MOISTURE-DENSITY RELATIONSHIP OF SUBGRADE AND EMBANKMENT SOILS
5. SCOPE
5.1 Part I uses a 4-in. (102 mm) ID mold and applies only to soils with:
100% passing the 3/8 in. (9.5 mm) sieve
≥ 80% passing the 1/4 in. (6.3 mm) sieve
ML, MH, CL, and CH soil classification as determined by Tex-142-E.
LABORATORY COMPACTION CHARACTERISTICS AND MOISTURE-
DENSITY RELATIONSHIP OF SUBGRADE, EMBANKMENT SOILS, AND
BACKFILL MATERIAL
TXDOT DESIGNATION: TEX-114-E
CONSTRUCTION DIVISION 4 – 14 EFFECTIVE DATE: FEBRUARY 2011
6. PREPARING SAMPLE
6.1 Prepare the material in accordance with Tex-101-E, Part II. Do not use materials that
have been previously laboratory compacted.
7. PROCEDURE
7.1 Determine the percent hygroscopic moisture of a representative sample of prepared
material in accordance with Tex-103-E.
7.2 Separate sample on 7/8 in. (22.4 mm), 3/8 in. (9.5 mm), and 1/4 in. (6.3 mm) sieves and
determine particle size distribution.
7.3 Estimate the mass of air-dried material that will fill the mold when wetted and
compacted.
7.4 Using this estimated mass, and the percentages of the various sizes of particles obtained
in Section 7.2, compute the cumulative masses of each size to combine to make a
specimen.
7.5 Using the masses calculated in Section 7.3, recombine at least four specimens of
approximately 7.7 lb. (3.5 kg) each.
7.6 Estimate the optimum percent moisture required to attain maximum density.
Note 1—The plastic limit is a good indicator of optimum moisture content, typically
within 2%, or 3–4% higher for PI >35 material.
7.7 Start the M-D curve using a sample with a moisture content of 2% below the estimated
optimum moisture content. For soils with a low to moderate plasticity index (PI < 35),
adjust the moisture content of the remaining samples in approximately 2% increments to
attain two samples above and two samples below the optimum moisture content. For soils
with high plasticity index (PI ≥ 35), the moisture content may be adjusted in 4%
increments to attain two samples above and two samples below the optimum moisture.
Note 2—After compacting the first two or three specimens, construct the initial M-D
curve to aid in evaluation of the shape of the curve. If necessary, adjust the water content
of the other prepared samples by adding additional water or air-drying to obtain a well-
defined compaction curve.
7.8 Calculate the mass of the water to be added based on the air-dry mass of the material.
7.9 Weigh out this amount of water into a tared sprinkling jar.
7.10 Sprinkle water onto the soil during mixing, in increments.
7.11 Thoroughly mix each specimen to ensure even distribution of water throughout specimen.
LABORATORY COMPACTION CHARACTERISTICS AND MOISTURE-
DENSITY RELATIONSHIP OF SUBGRADE, EMBANKMENT SOILS, AND
BACKFILL MATERIAL
TXDOT DESIGNATION: TEX-114-E
CONSTRUCTION DIVISION 5 – 14 EFFECTIVE DATE: FEBRUARY 2011
7.12 Cover the mixed sample and allow sample to stand and cure for at least 12 hr. before
compacting. When the PI is less than 12, reduce the curing time to no less than 3 hr. Cure
split or referee samples for the full 12 hr.
7.13 Assemble and secure the mold and collar to the base plate.
7.14 Thoroughly remix the cured sample.
7.15 Obtain approximately 1 lb. (453.6 g) of the sample and determine water content as
described in Tex-103-E, Section 7.
7.16 Place loose soil into the mold and spread into a layer of uniform thickness.
7.17 Before compaction, use hand tools to tamp the soil lightly until it is not fluffy or loose.
7.18 Separate the material in the pan into four equal portions. Each portion must contain
representative quantities of all sizes and adequate material to compact four 1.5-in.
(38-mm) layers.
7.19 For each layer, dump the material into the mold. Spade and level the layer of material
with a spatula to fill cavities around the edge and to ensure an even distribution of
material in each layer before compacting. Do not push this layer down by hand or other
means than that described above.
7.20 Compact each layer using 25 per lift with a drop height of 12 in. (304.88 mm).
7.21 Use the soil mass and compacted thickness of the first lift to adjust the mass and
thickness of the subsequent lifts.
7.22 Upon completion of compacting each of the first three lifts, use a knife or other
convenient tool to scarify the surface to a depth of 1/4 in. (6.3 mm). Dislodge
uncompacted soils that extend above the compacted surface.
7.23 Upon completion of the fourth lift, the compacted specimen should extend above the top,
but by no more than 1/4 in. (6.3 mm). Discard the compacted specimen if it does not
extend above the top of the mold at any point.
7.24 After compaction of the last lift, remove the collar and use a straight edge or draw knife
to carefully trim the compacted specimen even with the top of the mold.
7.25 Invert the mold and trim the bottom of the specimen even with the bottom of the mold.
7.26 Use trimmed soil from the specimen to fill holes on the trimmed surfaces. Trim again as
needed to ensure a smooth, level surface.
7.27 Determine and record the mass of the specimen and mold as WT to the nearest 0.001 lb.
(0.5 g) under Tex-113-E, Section 9.
7.28 Record the data on Form 113,4, “Moisture Density Relations of Base Material and Sand
or Subgrade and Embankment Soils.”
LABORATORY COMPACTION CHARACTERISTICS AND MOISTURE-
DENSITY RELATIONSHIP OF SUBGRADE, EMBANKMENT SOILS, AND
BACKFILL MATERIAL
TXDOT DESIGNATION: TEX-114-E
CONSTRUCTION DIVISION 6 – 14 EFFECTIVE DATE: FEBRUARY 2011
7.29 Use the hydraulic jack press to remove the specimen from the mold.
7.30 Place the compacted specimen and identification tag into a large pan and break into
several pieces.
7.31 Obtain the mass of the drying pan and wet sample and record to 0.001 lb. (0.5 g).
7.32 Place the specimen in an oven at a temperature of 230 ± 9°F (110 ± 5°C) and dry to
constant weight.
Note 3—Use a 140 ± 9°F (60 ± 5°C) oven for ML or MH soils (as determined by
Tex-145-E).
7.33 Record the mass of the oven-dried material to the nearest 0.001 lb. (0.5 g) under
Tex-113-E, Section 9.
7.34 Repeat Sections 7.8–7.33 for all samples.
8. CALCULATIONS
8.1 Use the equations in Tex-113-E, Section 9.
9. GRAPHS
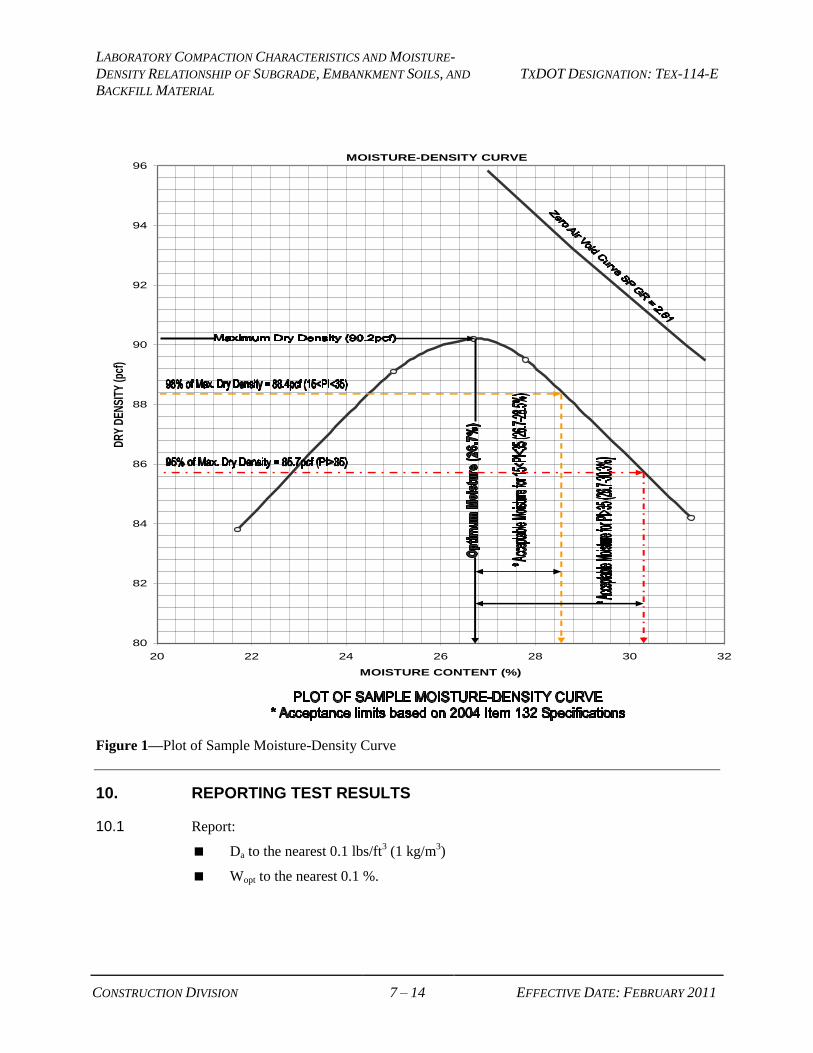
9.1 Plot the molding moisture and dry density curve for Da as shown in Figure 1.
LABORATORY COMPACTION CHARACTERISTICS AND MOISTURE-
DENSITY RELATIONSHIP OF SUBGRADE, EMBANKMENT SOILS, AND
BACKFILL MATERIAL
TXDOT DESIGNATION: TEX-114-E
CONSTRUCTION DIVISION 7 – 14 EFFECTIVE DATE: FEBRUARY 2011
MOISTURE-DENSITY CURVE
80
82
84
86
88
90
92
94
96
20 22 24 26 28 30 32
MOISTURE CONTENT (%)
DR
Y D
EN
SIT
Y (p
cf)
Figure 1—Plot of Sample Moisture-Density Curve
10. REPORTING TEST RESULTS
10.1 Report:
Da to the nearest 0.1 lbs/ft3 (1 kg/m
3)
Wopt to the nearest 0.1 %.
LABORATORY COMPACTION CHARACTERISTICS AND MOISTURE-
DENSITY RELATIONSHIP OF SUBGRADE, EMBANKMENT SOILS, AND
BACKFILL MATERIAL
TXDOT DESIGNATION: TEX-114-E
CONSTRUCTION DIVISION 8 – 14 EFFECTIVE DATE: FEBRUARY 2011
PART II—MEASURING MOISTURE-DENSITY RELATIONSHIP OF SUBGRADE AND EMBANKMENT SOILS
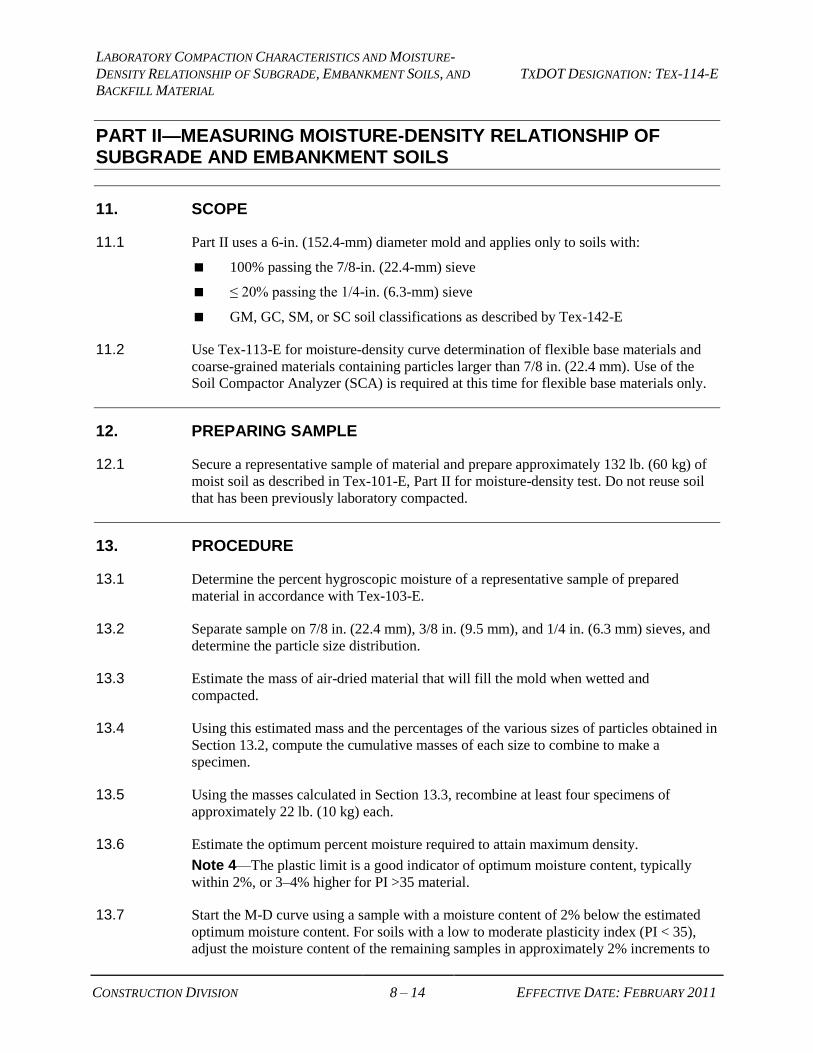
11. SCOPE
11.1 Part II uses a 6-in. (152.4-mm) diameter mold and applies only to soils with:
100% passing the 7/8-in. (22.4-mm) sieve
≤ 20% passing the 1/4-in. (6.3-mm) sieve
GM, GC, SM, or SC soil classifications as described by Tex-142-E
11.2 Use Tex-113-E for moisture-density curve determination of flexible base materials and
coarse-grained materials containing particles larger than 7/8 in. (22.4 mm). Use of the
Soil Compactor Analyzer (SCA) is required at this time for flexible base materials only.
12. PREPARING SAMPLE
12.1 Secure a representative sample of material and prepare approximately 132 lb. (60 kg) of
moist soil as described in Tex-101-E, Part II for moisture-density test. Do not reuse soil
that has been previously laboratory compacted.
13. PROCEDURE
13.1 Determine the percent hygroscopic moisture of a representative sample of prepared
material in accordance with Tex-103-E.
13.2 Separate sample on 7/8 in. (22.4 mm), 3/8 in. (9.5 mm), and 1/4 in. (6.3 mm) sieves, and
determine the particle size distribution.
13.3 Estimate the mass of air-dried material that will fill the mold when wetted and
compacted.
13.4 Using this estimated mass and the percentages of the various sizes of particles obtained in
Section 13.2, compute the cumulative masses of each size to combine to make a
specimen.
13.5 Using the masses calculated in Section 13.3, recombine at least four specimens of
approximately 22 lb. (10 kg) each.
13.6 Estimate the optimum percent moisture required to attain maximum density.
Note 4—The plastic limit is a good indicator of optimum moisture content, typically
within 2%, or 3–4% higher for PI >35 material.
13.7 Start the M-D curve using a sample with a moisture content of 2% below the estimated
optimum moisture content. For soils with a low to moderate plasticity index (PI < 35),
adjust the moisture content of the remaining samples in approximately 2% increments to
LABORATORY COMPACTION CHARACTERISTICS AND MOISTURE-
DENSITY RELATIONSHIP OF SUBGRADE, EMBANKMENT SOILS, AND
BACKFILL MATERIAL
TXDOT DESIGNATION: TEX-114-E
CONSTRUCTION DIVISION 9 – 14 EFFECTIVE DATE: FEBRUARY 2011
attain two samples above and two samples below the optimum moisture content. For soils
with high plasticity index (PI ≥ 35), adjust the moisture content in 4% increments to
attain two samples above and two samples below the optimum moisture.
Note 5—After compacting the first two or three specimens, the initial M-D curve can be
constructed to aid in evaluation of the shape of the curve. If necessary, adjust the water
content of the other prepared samples by adding additional water or air-drying to obtain a
well-defined compaction curve.
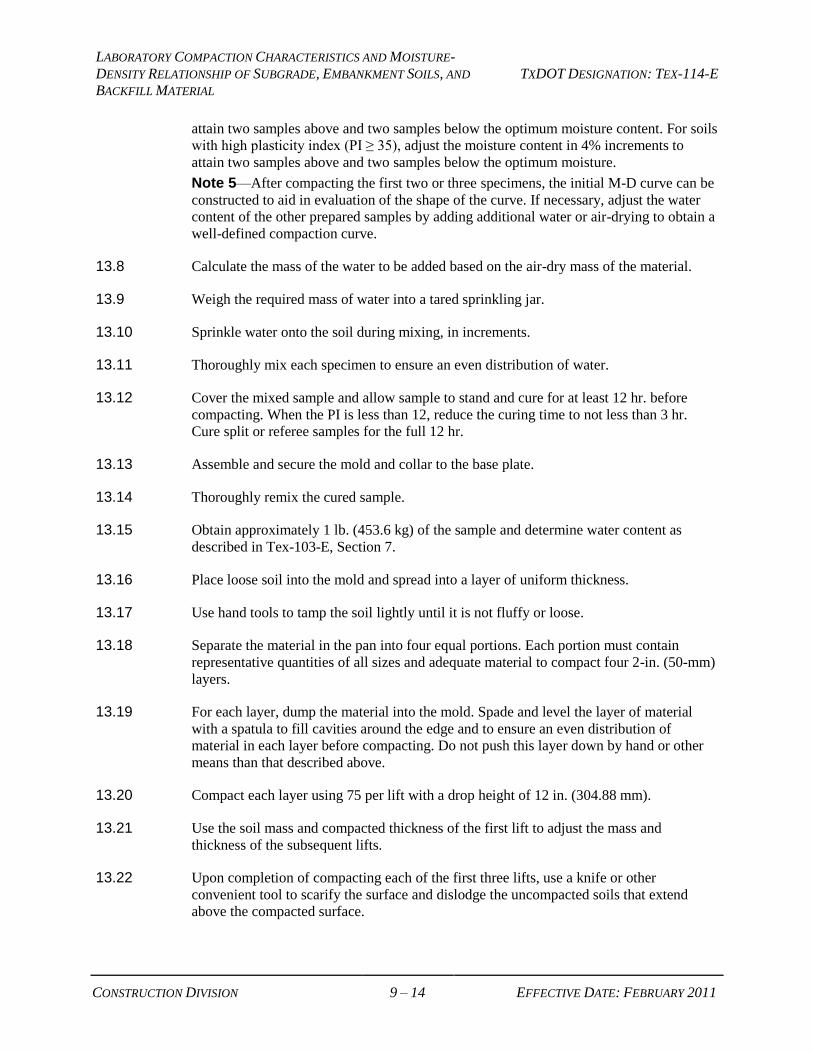
13.8 Calculate the mass of the water to be added based on the air-dry mass of the material.
13.9 Weigh the required mass of water into a tared sprinkling jar.
13.10 Sprinkle water onto the soil during mixing, in increments.
13.11 Thoroughly mix each specimen to ensure an even distribution of water.
13.12 Cover the mixed sample and allow sample to stand and cure for at least 12 hr. before
compacting. When the PI is less than 12, reduce the curing time to not less than 3 hr.
Cure split or referee samples for the full 12 hr.
13.13 Assemble and secure the mold and collar to the base plate.
13.14 Thoroughly remix the cured sample.
13.15 Obtain approximately 1 lb. (453.6 kg) of the sample and determine water content as
described in Tex-103-E, Section 7.
13.16 Place loose soil into the mold and spread into a layer of uniform thickness.
13.17 Use hand tools to tamp the soil lightly until it is not fluffy or loose.
13.18 Separate the material in the pan into four equal portions. Each portion must contain
representative quantities of all sizes and adequate material to compact four 2-in. (50-mm)
layers.
13.19 For each layer, dump the material into the mold. Spade and level the layer of material
with a spatula to fill cavities around the edge and to ensure an even distribution of
material in each layer before compacting. Do not push this layer down by hand or other
means than that described above.
13.20 Compact each layer using 75 per lift with a drop height of 12 in. (304.88 mm).
13.21 Use the soil mass and compacted thickness of the first lift to adjust the mass and
thickness of the subsequent lifts.
13.22 Upon completion of compacting each of the first three lifts, use a knife or other
convenient tool to scarify the surface and dislodge the uncompacted soils that extend
above the compacted surface.
LABORATORY COMPACTION CHARACTERISTICS AND MOISTURE-
DENSITY RELATIONSHIP OF SUBGRADE, EMBANKMENT SOILS, AND
BACKFILL MATERIAL
TXDOT DESIGNATION: TEX-114-E
CONSTRUCTION DIVISION 10 – 14 EFFECTIVE DATE: FEBRUARY 2011
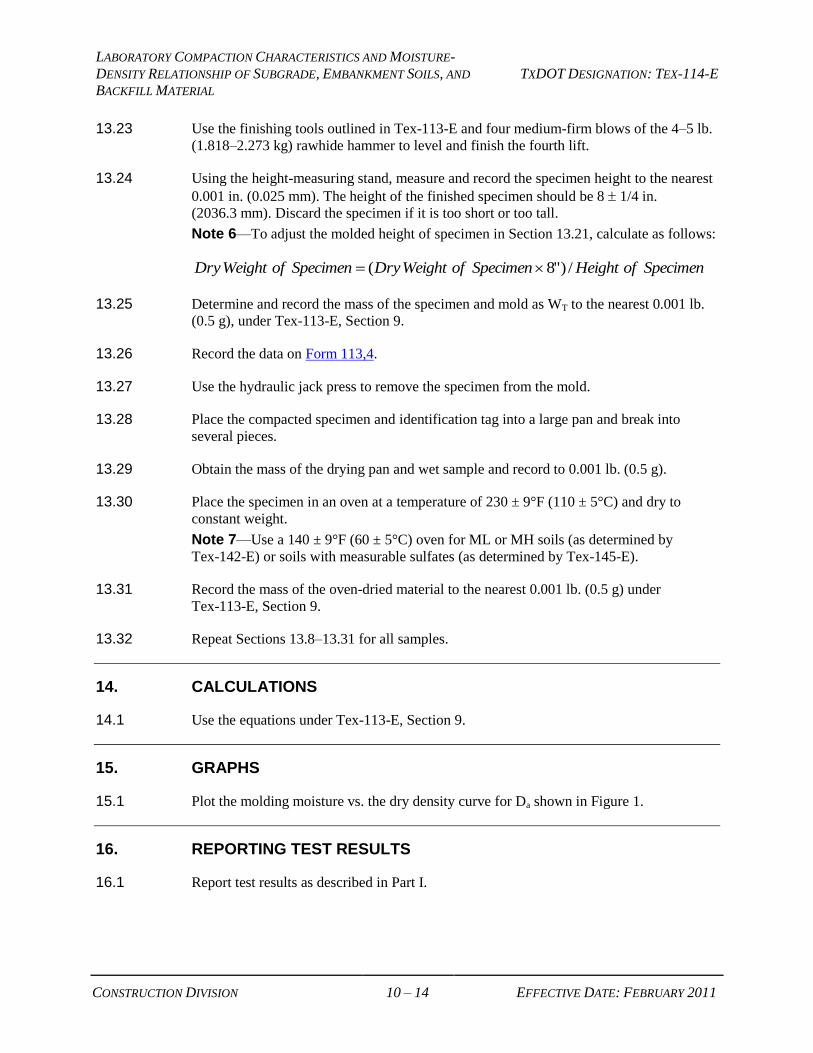
13.23 Use the finishing tools outlined in Tex-113-E and four medium-firm blows of the 4–5 lb.
(1.818–2.273 kg) rawhide hammer to level and finish the fourth lift.
13.24 Using the height-measuring stand, measure and record the specimen height to the nearest
0.001 in. (0.025 mm). The height of the finished specimen should be 8 1/4 in.
(2036.3 mm). Discard the specimen if it is too short or too tall.
Note 6—To adjust the molded height of specimen in Section 13.21, calculate as follows:
SpecimenofHeightSpecimenofWeightDrySpecimenofWeightDry /)"8(
13.25 Determine and record the mass of the specimen and mold as WT to the nearest 0.001 lb.
(0.5 g), under Tex-113-E, Section 9.
13.26 Record the data on Form 113,4.
13.27 Use the hydraulic jack press to remove the specimen from the mold.
13.28 Place the compacted specimen and identification tag into a large pan and break into
several pieces.
13.29 Obtain the mass of the drying pan and wet sample and record to 0.001 lb. (0.5 g).
13.30 Place the specimen in an oven at a temperature of 230 ± 9°F (110 ± 5°C) and dry to
constant weight.
Note 7—Use a 140 ± 9°F (60 ± 5°C) oven for ML or MH soils (as determined by
Tex-142-E) or soils with measurable sulfates (as determined by Tex-145-E).
13.31 Record the mass of the oven-dried material to the nearest 0.001 lb. (0.5 g) under
Tex-113-E, Section 9.
13.32 Repeat Sections 13.8–13.31 for all samples.
14. CALCULATIONS
14.1 Use the equations under Tex-113-E, Section 9.
15. GRAPHS
15.1 Plot the molding moisture vs. the dry density curve for Da shown in Figure 1.
16. REPORTING TEST RESULTS
16.1 Report test results as described in Part I.
LABORATORY COMPACTION CHARACTERISTICS AND MOISTURE-
DENSITY RELATIONSHIP OF SUBGRADE, EMBANKMENT SOILS, AND
BACKFILL MATERIAL
TXDOT DESIGNATION: TEX-114-E
CONSTRUCTION DIVISION 11 – 14 EFFECTIVE DATE: FEBRUARY 2011
PART III—MEASURING MOISTURE-DENSITY RELATIONSHIP OF COHESIONLESS BACKFILL
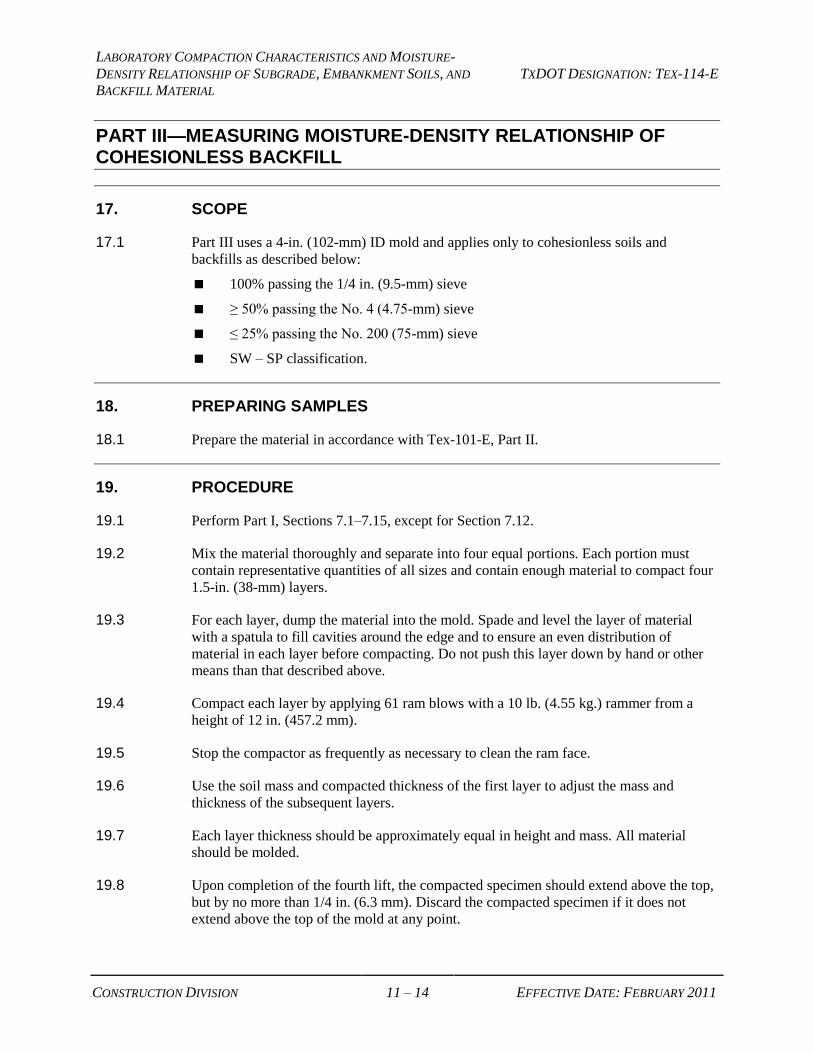
17. SCOPE
17.1 Part III uses a 4-in. (102-mm) ID mold and applies only to cohesionless soils and
backfills as described below:
100% passing the 1/4 in. (9.5-mm) sieve
≥ 50% passing the No. 4 (4.75-mm) sieve
≤ 25% passing the No. 200 (75-mm) sieve
SW – SP classification.
18. PREPARING SAMPLES
18.1 Prepare the material in accordance with Tex-101-E, Part II.
19. PROCEDURE
19.1 Perform Part I, Sections 7.1–7.15, except for Section 7.12.
19.2 Mix the material thoroughly and separate into four equal portions. Each portion must
contain representative quantities of all sizes and contain enough material to compact four
1.5-in. (38-mm) layers.
19.3 For each layer, dump the material into the mold. Spade and level the layer of material
with a spatula to fill cavities around the edge and to ensure an even distribution of
material in each layer before compacting. Do not push this layer down by hand or other
means than that described above.
19.4 Compact each layer by applying 61 ram blows with a 10 lb. (4.55 kg.) rammer from a
height of 12 in. (457.2 mm).
19.5 Stop the compactor as frequently as necessary to clean the ram face.
19.6 Use the soil mass and compacted thickness of the first layer to adjust the mass and
thickness of the subsequent layers.
19.7 Each layer thickness should be approximately equal in height and mass. All material
should be molded.
19.8 Upon completion of the fourth lift, the compacted specimen should extend above the top,
but by no more than 1/4 in. (6.3 mm). Discard the compacted specimen if it does not
extend above the top of the mold at any point.
LABORATORY COMPACTION CHARACTERISTICS AND MOISTURE-
DENSITY RELATIONSHIP OF SUBGRADE, EMBANKMENT SOILS, AND
BACKFILL MATERIAL
TXDOT DESIGNATION: TEX-114-E
CONSTRUCTION DIVISION 12 – 14 EFFECTIVE DATE: FEBRUARY 2011
19.9 Remove the collar and use a straight edge or draw knife to carefully trim the compacted
specimen even with the top of the mold.
19.10 Use trimmed material from the specimen to fill holes on the trimmed surfaces. Trim
again, as needed to ensure a smooth, level surface.
19.11 Determine and record the mass of the specimen and mold as WT to the nearest 0.001 lb.
(0.5 g) under Tex-113-E, Section 9.
19.12 Record the data on Form 113,4.
19.13 Carefully center the specimen over a porous stone and place in the hydraulic press to
extrude the specimen from the mold.
19.14 Place the compacted specimen and identification tag into a large pan and break into
several pieces.
19.15 Obtain the mass of the drying pan and wet sample and record to 0.001 lb. (0.5 g).
19.16 Place the drying pan with wet material in an oven at a temperature of 230°F (110°C) and
dry to constant weight.
19.17 Record the mass of the oven-dried material to the nearest 0.001 lb. (0.5 g) under
Tex-113-E, Section 9.
19.18 Repeat Sections 19.2–19.17 for all samples.
Note 8—After compacting the first two or three specimens, the initial M-D curve can be
constructed to aid in evaluation of the shape of the curve. If necessary, adjust the water
content of the other prepared samples by adding additional water or air-drying to obtain a
well-defined compaction curve.
20. CALCULATIONS
20.1 Use the equations under Tex-113-E, Section 9.
21. REPORTING TEST RESULTS
21.1 Report test results as described in Part I.
22. FAMILY OF CURVES
22.1 The materials used for subgrade and embankment construction are variable in color,
texture, and moisture-density relationship.
22.2 To adequately control the compaction and field densities of these materials, it is
necessary to have several compaction curves prepared and plotted on the same graph to
LABORATORY COMPACTION CHARACTERISTICS AND MOISTURE-
DENSITY RELATIONSHIP OF SUBGRADE, EMBANKMENT SOILS, AND
BACKFILL MATERIAL
TXDOT DESIGNATION: TEX-114-E
CONSTRUCTION DIVISION 13 – 14 EFFECTIVE DATE: FEBRUARY 2011
assist the inspector to make a sound judgment as to which curve is representative of the
material being tested for field density.
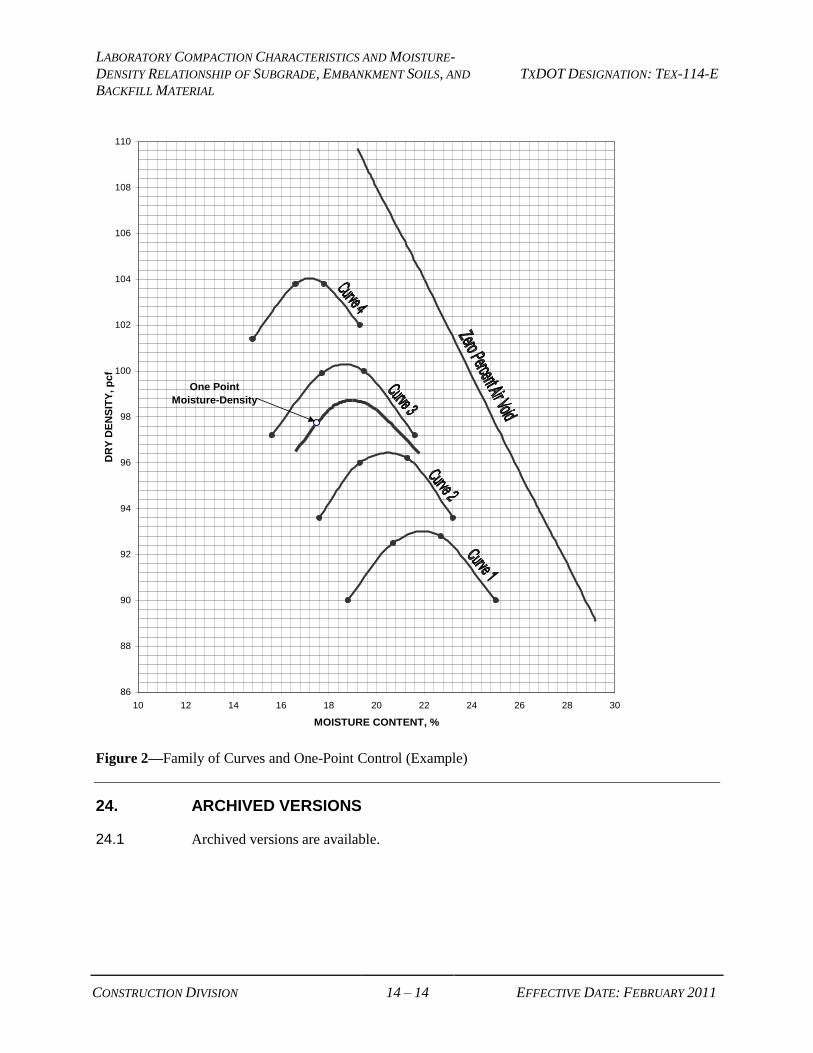
22.3 The family of compaction curves shown in Figure 2 illustrates that, as the material's
plasticity and fineness increase, the Da will decrease with a corresponding increase in
Wopt. The wet leg of the compaction curve is generally parallel with the 0% air void line.
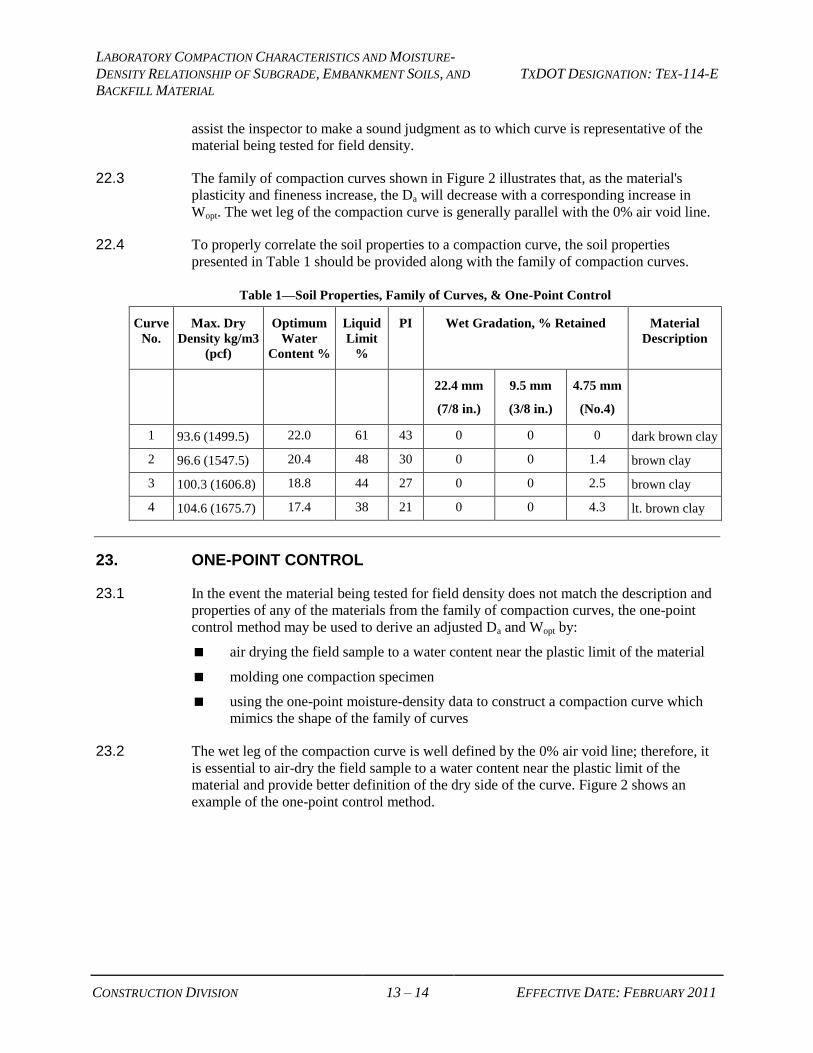
22.4 To properly correlate the soil properties to a compaction curve, the soil properties
presented in Table 1 should be provided along with the family of compaction curves.
Table 1—Soil Properties, Family of Curves, & One-Point Control
Curve
No.
Max. Dry
Density kg/m3
(pcf)
Optimum
Water
Content %
Liquid
Limit
%
PI Wet Gradation, % Retained Material
Description
22.4 mm
(7/8 in.)
9.5 mm
(3/8 in.)
4.75 mm
(No.4)
1 93.6 (1499.5) 22.0 61 43 0 0 0 dark brown clay
2 96.6 (1547.5) 20.4 48 30 0 0 1.4 brown clay
3 100.3 (1606.8) 18.8 44 27 0 0 2.5 brown clay
4 104.6 (1675.7) 17.4 38 21 0 0 4.3 lt. brown clay
23. ONE-POINT CONTROL
23.1 In the event the material being tested for field density does not match the description and
properties of any of the materials from the family of compaction curves, the one-point
control method may be used to derive an adjusted Da and Wopt by:
air drying the field sample to a water content near the plastic limit of the material
molding one compaction specimen
using the one-point moisture-density data to construct a compaction curve which
mimics the shape of the family of curves
23.2 The wet leg of the compaction curve is well defined by the 0% air void line; therefore, it
is essential to air-dry the field sample to a water content near the plastic limit of the
material and provide better definition of the dry side of the curve. Figure 2 shows an
example of the one-point control method.
LABORATORY COMPACTION CHARACTERISTICS AND MOISTURE-
DENSITY RELATIONSHIP OF SUBGRADE, EMBANKMENT SOILS, AND
BACKFILL MATERIAL
TXDOT DESIGNATION: TEX-114-E
CONSTRUCTION DIVISION 14 – 14 EFFECTIVE DATE: FEBRUARY 2011
FAMILY OF CURVES & ONE POINT CONTROL (EXAMPLE)
86
88
90
92
94
96
98
100
102
104
106
108
110
10 12 14 16 18 20 22 24 26 28 30
MOISTURE CONTENT, %
DR
Y D
EN
SIT
Y, p
cf
One Point
Moisture-Density
Figure 2—Family of Curves and One-Point Control (Example)
24. ARCHIVED VERSIONS
24.1 Archived versions are available.