Embed Size (px)
Citation preview

LABORATORY MANUAL
CENG 255
Introduction to Computer Architecture
Laboratory Experiment #0
This manual was prepared by
The many dedicated, motivated, and talented graduate students andfaculty members in the Department of Electrical and Computer
Engineering
Copyright c© University of Victoria, 2018preliminary

1
The laboratory experiments are developed to provide a hands-on introduction to the ARM archi-tecture. The labs are based on the open source tools Eclipse and OpenOCD.
You are expected to read this manual carefully and prepare in advance of your lab session. Payparticular attention to the parts that are bolded and underlined. You are required to address theseparts in your lab report. In particular, all items in the Prelab section must be prepared in a writtenform before your lab. You are required to submit your written preparation during the lab, whichwill be graded by the lab instructor.

Laboratory Experiment 0: Introduction toEclipse
1.1 GoalEclipse is an integrated development environment (IDE) that can be used to develop applicationswith various programming languages such as C and C++. With the proper plug-ins, one can de-velop ARM assembly applications in Eclipse and execute/debug programs on ARM developmentboards. This is a tutorial to introduce Eclipse and the process of developing a C program to beexecuted on the STM32F0 Discovery Boards in the lab.
1.2 Part 1: Create a Blinky C Project1.2.1 Configure Eclipse for STM32F0You develop and store your source code as projects. To create a project, go to Eclipse menu, File->New, and select C Project:
Figure 1.1: New C project
2

3
Inside the C Project window:
• In the Project name: field enter the name of a new project, for example, Blinky
• In the Project type: section expand the Executable type and select STM32F0xx C/C++Project
• In the Toolchains: select Cross ARM GCC
• Click the Next> button
Figure 1.2: Project name and processor selection

4
In the Target processor settings window, use all the default values:
• Chip family: default value (STM32F051) is the target ARM board
• Flash size (KB): the flash size of our ARM board
• RAM size (KB): the RAM size of our ARM board
• Clock (Hz): the default value of our ARM board
• Content: use this default value Blinky (blink a LED) as this tutorial is to create a Blinkyproject. If you want to create another new project, you can switch to Empty (add your owncontent)
• Click the Next> button
Figure 1.3: Target processor settings

5
In the Folders settings window:
• Leave the default folders unchanged and click the Next> button.
Figure 1.4: Project folder settings

6
In the Select Configurations window:
• Leave the default settings unchanged and click Next> button to the next step. button.
Figure 1.5: Project select configurations

7
In the Cross GNU ARM Toolchain window:
• Select the Toolchain name: GNU Tools for ARM Embedded Processors (arm-none-eabi-gcc)
• Click the Finish button
Figure 1.6: Cross GNU ARM toolchain
8
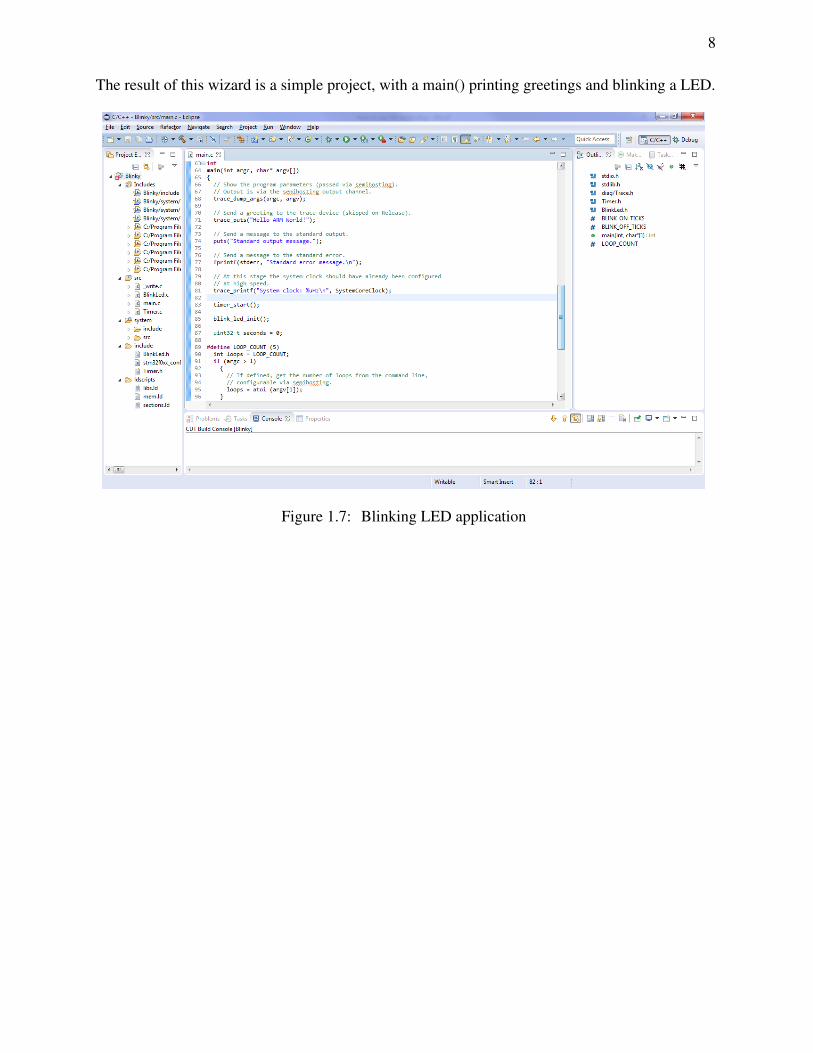
The result of this wizard is a simple project, with a main() printing greetings and blinking a LED.
Figure 1.7: Blinking LED application

9
1.3 Build the project• Select the Blinky project in the Project Explorer
• Click the hammer icon, which is the shortcut to build the selected project.
Figure 1.8: First method to build a project
Or
• Right click the Blinky project in the Project Explorer
• Select Build Project in the popup window
Figure 1.9: Second method to build a project
10
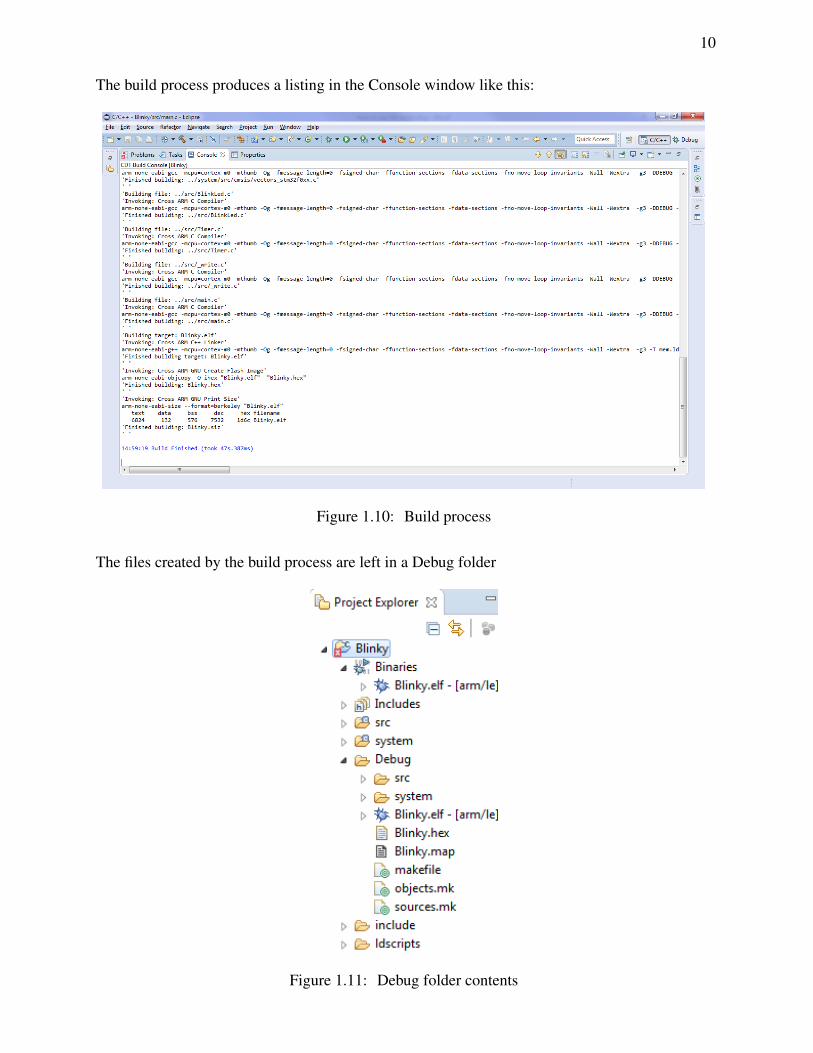
The build process produces a listing in the Console window like this:
Figure 1.10: Build process
The files created by the build process are left in a Debug folder
Figure 1.11: Debug folder contents

11
1.4 Configure debuggingTo set debugging:
• Select the forward button on the right side of the bug icon.
• Select Debug Configurations... in the popup window
Figure 1.12: Debug menu
In the Debug Configurations window:
• Double click GDB OpenOCD Debugging; this creates a project debug with the project nameBlinky Debug
Figure 1.13: Creating an GDB OpenOCD debug configuration file.

12
• Go to the Debugger tab
• In Executable: enter openocd.exe
• In Config options: fill in the following setting (f is a flag indicating the file to be used ) :
-f board\stm32f0discovery.cfg
Figure 1.14: OpenOCD settings

13
Go to the Startup tab
• In the rectangle above the Enable ARM semihosting checkbox, fill in the following setting(this command tells the debugger to stop at the beginning of the main function so that theprogrammer can debug the project step by step).
monitor reset halt
Figure 1.15: Startup tab
14
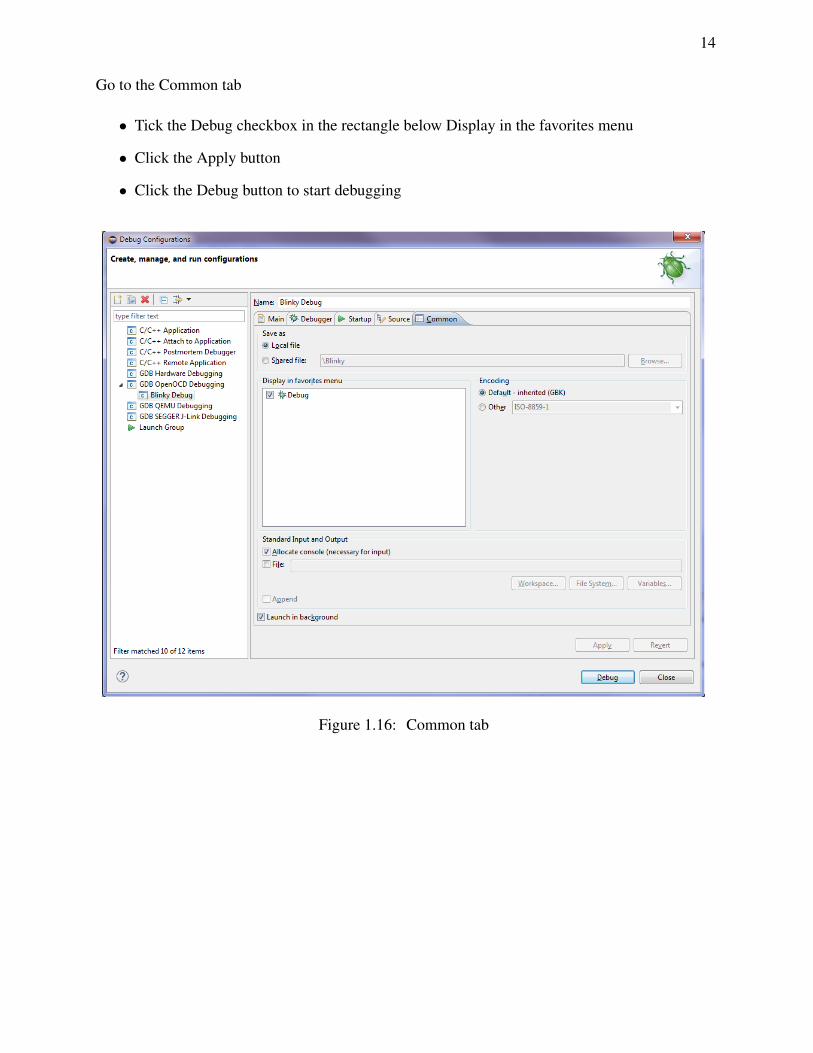
Go to the Common tab
• Tick the Debug checkbox in the rectangle below Display in the favorites menu
• Click the Apply button
• Click the Debug button to start debugging
Figure 1.16: Common tab

15
The debugging configuration wizard creates a debug setting for the Blinky project. The result ofdebugging installs the binary of the project into the ARM board (that is, the executable binary fileis downloaded to the RAM on board). At the beginning of debug process, the program stops at themain function waiting for the programmer to debug the program.
Figure 1.17: Debugging code

16
These icons labeled below in the toolbar of Eclipse are the ones used most frequently in debuggingand they help the programmer to interact with the debugger. Experiment/Play with these icons andsee how they work.
• Icon A: to skip all the breakpoints
• Icon B: to resume the program from debugging
• Icon C: to suspend the program and set it back to debug
• Icon D: to terminate the program
• Icon E: to step into a function
• Icon F: to step over a function
• Icon G: to step return to the function
• Icon H: to restart a process or debug target without terminating and re-launch
Figure 1.18: Debug icons

17
1.5 Part 2: Create an ARM Assembly Project• Follow the wizards in Part 1 of this tutorial that create an ARM C project.
• Change the .c extension of main.c to .asm or .S and remove all the contents in that file.
• Write assembly codes in the main.asm/main.S to implement your application.
• The build and debug steps are the same as described in Part 1.
Creating an assembly project: (using Blinky project as an example)
• Remove all the files except main.c in the src folder in Blinky project and replace the exten-sion of main.c by .asm.
• Clear the contents in main.asm and write some simple assembly codes for experimentation.
Figure 1.19: Assembly code

18
1.6 Part 3: Tips for using eclipseChanging displayed format in register tab: During the debugging process you will be examiningregisters in the processor. You can change the displayed format of a register by right clickingon the specific registers and selecting the Number Format option. You can also change a groupof registers. Changing the format is show in the image below. If the register tab is not beingdisplayed you can display it by selecting the Window option on the main menu then selectingShow View->Registers.
Note: In other sections of eclipse you find number format also called radix.
Figure 1.20: Changing number format
Changing cell size and format in the memory browser:
The memory browser allows you to examining sections of memory in you program. The cell sizeis the numbers Eclipse will use in each cell in the Memory Browser tab. To change your cell sizeright click on the displayed data in your Memory Browser tab and select the Cell Size option, thenselect the cell size to be used. This is shown in the image below.
Figure 1.21: Changing memory browser cell size

19
To change the formatted display also known as Radix right click on displayed data and select theRadix option then select displayed format. This is shown in the image below.
Figure 1.22: Changing memory browser displayed radix
Disabling console switching: During the debugging process when the debugger steps or encoun-ters a break point it will print information on the console tab. When this occurs Eclipse willautomatically switch to the console window to display this information. In specific labs such asthe bubble sort lab it would be more convenient to not have Eclipse switch to the console and justto stay in the Memory Browser tab. There are two ways to achieve this.
The first is to disable console switching. This option can be found in the windows-¿preferencesdialog box. In the preference dialog expand the Run/Debug section and select console. Unselectthe options “Show when program writes to standard out” and ”Show when program writes tostandard error” as shown in the image below. This is a global setting and will apply to all projectsin the Eclipse workspace.
Figure 1.23: Disabling console switching

20
The second method is by dragging the Memory browser to a vacant area on the computer screennot being used by any program. Eclipse will automatically create a new window specifically forthe memory browser. This feature can be used with any view in Eclipse.
Disassembly not showing in disassembly window: If you are using the disassembly view there isa known issue with this feature. When you first enter debug mode you will notice that the windowdoes not update. See picture on the left. The simple resolution is to close the current disassemblytab and open it from the main menu. Windows->Show View->Disassembly. See pictureto the right.
Figure 1.24: Disassembly windows


![BIM472 Image Processing - Ceng Anadoluceng.anadolu.edu.tr/serkangunal/BIM472/odev/BIM472 - 03...BIM472 Image Processing ... [192, 255]. • and so on... Bit Plane Slicing. 12 BIM472](https://img.pdfslide.net/doc/110x75/5b01d0ee7f8b9a89598eb912/bim472-image-processing-ceng-03bim472-image-processing-192-255-.jpg)