Embed Size (px)
Citation preview
351
Laboratory measurements of the dielectronic recombination satellite transitions of He-like Fe XXV and H-like Fe XXVI
M.F. Gu, P. Beiersdorfer, G.V. Brown, A. Graf, R.i... Kelley, C.A. Kilbourne, F.S. Porter, and S.M. Kahn
Abstract: We present laboratory spectra of dielectronic recombination (DR) satellite tnmsitions attached to the He-like and H-like iron resonance lines obtained widt me NASA Goddard Space Flight Center X-ray calorimeter and produced by a thermal plasma simu1ation technique on the EBIT-I electron beam ion trap at the Lawrence Livennore National Laboratory. We demonstrate that the ca10rimeter has sufficient spectral resoiution in the 6-9 keY range to provide reliable measurements not only of standard DR satellite to resonance line intensities but also of DR satellite to DR satellite ratios that can be used to diagnose nonthermal electron distributions. Electron temperatures derived from the measured line intensities are consistent with the temperature of the simulated plasma. Temperature measurements based on DR satellite transitions have significant advantages over those based on collisional ionization equilibrium or continuum shape. Thus, successful demonstration of this method with the X-ray calorimeter is an important step fur its application in X-ray astronomy.
PACS Nos: 32.30.Rj, 32.70.Fw, 95.30.Ky, 95.55.Ka
Resume: Nous presentons des spectres en laboratoire de transitions satellites a recombinaison die]ectronique (DR), re1iees aux raies de resonance dans Ie fer de types He et H obtenus ~ l'aide du calorimetre ~ rayon-X du Goddard Space Flight Center de la NASA et produits par technique de simulation de plasma tbermique aI ' aide du pi~ge ionique a faisceau d' electrons EBIT-I au Lawrence Livennore National Laboratory. Nous d~montrons que Ie calorim~tre a suffisamment de ~solution spectrale dans Ie domaine 6-9 keY pour fournir des mesures fiables, non seulement des intensit6s de raie, de satellites DR ~ resonance, mais aussi des rapports de satellite DR a satellite DR, qui peuvent etre utilises dans les diagnostiques de distributions i:lectroniques non thennalisees. Les tem¢ratures ~Iectroniques obtenues ~ partir des intensi~ de raie meswees sont cohcrentes avec Ia tem¢rarure du plasma' de simulation. Les mesures de temperarute basees sur les transitions satellites DR ont un avantage significatif sur celles basees sur 1'6quiHbre de I'ionisation par collision ou la forme du continuo Ainsi, la demonstration reussie de cette mi:thode avec Ie calorim~tre ~ rayon-X est une etape importante pour son application en astronomie dans Ie domaine des rayons-X.
[Traduit par la Redaction]
1. Introduction
The electron temperature, or the electron energy distribution in general, is an important property of laboratory plasmas, but is an even more important property of astrophysical plasmas. For example. the temperature of the intracluster gas can be used to determine the mass distribution function and baryonic gas fraction of galaxy clusters, providing an important c""mological probe [I). The temperature distribution throughout a cluster of ga1axies is also an important indicator of recent merger activity [2). The development of diagnostic methods to inrer the temperature of astropliysical objects, especially those of extended X-ray sources, is, therefore, of prime importance.
There are several X-ray spectroscopic methods for the temperature measurements of hot plasmas. The temperature dependence of the continuum shape, the collisional ionization equilibrium of highly charged ions, intensity ratios of collisional excitation (CE) lines, and ratios to dielectronic recombination ·(DR) satellite transitions to resonance lines are among the most widely used temperature diagnostics. The methods based on continuum shape and CE line ratios often suffer from poor sensitivity as the quantities are slowly varying functions of the temperature. Collisional ionization equilibrium provides a sensitive probe of the electron temperature, but it depends on a multitude of recombination and ionization atomic processes with large uncertainties in present-day models. The intensity ratios of DR satellite tran-
Received 5 December 2011. Accepted 7 January 2012. Published at www.nrcresearchpress.com/cjp on 13 March 2012.
M.F. Gu. Space Sciences Laboratory, University of California, Berkeley, CA 94720. USA. P. Beiersdorfer, G.V. Brown, and A. Grat. Lawrence Livermore National Laboratory, 7000 East Ave., Livermore, CA 94550, USA. R-L_ Kelley, CA- Kllboume, and F.S. Po ....... NASA Goddard Space Flight Center, Greenbel~ MD 20771, USA. S,M, Kahn, Department of Physics, Stanford Univenity, Stanford, CA 94305, USA.
Corresponding author: P. Beiersdorfer (e-mail: [email protected]).
Can. J . Ph:",. 90: 351-357 (2012) doi: 1D. 1 139/P201 2-025 Published by NRC Research Press
https://ntrs.nasa.gov/search.jsp?R=20120016517 2018-11-29T20:37:22+00:00Z
352
sitions to their parent 'resonance lines in He-like and H-Iike ions are strong functions of the temperature, and, thus, are sensitiv:! indicators of the temperature. They are routinely used as temperature diagnostics in magnetic fusion plasmas, which have a relatively low electron density" and are among the mOlit comparable to hot astrophysical plasmas, and, most importmltly, the required atomic theory has been thoroughly benchmarked against independent temperature measurement techniques [3, 4]"
There are extensive theoretical studies of DR satellite transitions, Is'nI-Is2pnl of He-like ions and Isnl-2pnl of H-like ions, ar!d of their applications in solar and X-ray astrophysical observations. Gabriel [5] extensively developed the theory of the n = 2 He-like satellites intensities, whose alphabetic labeling of the twenty two n = 2 satellite lines and the four He-like CE lines have been widely adopted today. Further improvements to the theory were made in subsequent work, including better inner-shell and He-like CE rates and highern satellite contributions [6-9]. The satellite lines of H-like iron were investigated by Dubau et al. [10]. Vainshtein and Safronova [II, 12] also made extensive tabulations of atomic paramete", of H-like and He-like satellite transitions.
The principal difficulty of applying DR satellite measurements in X-ray astronomy is the high spectral resolution required to separate them from their parent resonance lines. This is particularly true for highly charged ions, such as Fe XXV and Fe XXVI. For these ions, the spectral lines of interest are located below 2 A, where high resolution and high throughput X-ray spectrometers are difficult to build, especially those that are able to obtain information on extended sources. On Ule other hand, Fe XXV and Fe XXVI are the most relevant ions for diagnosing hot plasmas with temperab.lI'es of a few kiloelectronvolts, such as those present in clusten; of galaxies. In the last decade, a new type of energy dispersive X-ray spectrometer, the X-ray microcalorimeter [13], has emerged, and such a device has operated briefly on the Suzaku mission [14, 15]. Microcalorimeters determine the photon energy by measuring the temperature rise of the photon-absorbing materials. The state-of-the-art instruments reach energy resolutions of 4 e V at 6 ke V with further improvements possible [16, 17]. The flight engineering model of the X-ray spectrometer XRS, as the Suzaku microcalorimeter was furmally known, was installed at the EBIT-I electron beam ion trap of the Lawrence Livermore National Laboratory [P, 18], and has made important contributions to the laboratcry astrophysics measurements carried out with this device. Many of these measurements have been centered on studying the L-shell emission of iron [19-24]. In this paper, we report XRS measurements of the K-shell emission of iron. In particular, we report measurements of the DR satellite transitions and their parent resonance lines of Fe XXV and Fe XXVI. Earlier measurements of the K-shell X-ray emission of highly charged ions conducted with the microcalorirneter on EBIT-I have been limited to lines" produced by electron-impact excitation [25-29], measurements of the associated X-ray polarization [30], and lines produced by charge exchange [31-34]. The present measurements were obtained with a thermal plasma sinnulation technique implemented on EBIT-I. They demonstrate that the spectral resolution of :he XRS is sufficient to provide reliable DR satellite
Can. J. Phys. V~. 90, 2012
intensities and electron temperature values under plasma conditions similar to those found in astrophysical sources.
2. Experimental setup EBIT-I is a device to study highly charged ions with spec
troscopic methods [35]. In the present measurement, we make use of the thermal plasma sinnulator developed at Lawrence Livermore National Laboratory, as described and reviewed by Savin et al. [36, 37]. In this technique, we sweep the nearly monoenergetic electron beam in a specially designed timing pattern, so that the time the beam spends at a particular energy is proportional to the Maxwell--Boltzmann (MB) distribution. The period of the timing pattern is typically chosen to be a fi:w milliseconds, which is small compared to the recombination and ionization time scales of the Fe24+ and Fe25+ ions, so that they experience a time averaged MB energy distribution.
There are several technical problems one must address in operating an electron beam ion trap in this mode. The flrst is to maintain a constant electron density in the beam as the energy is swept. This is achieved by changing the anode voltage of the electron gun so that the beam cwrent varies in such a way as to compensate for the change in the electron velocity. The second problem is the limitation on the electron energy range the beam may take. The lower limit of -200 eV is innposed by the beam stability, while the upper limit of -6T, (for a typical electron temperature, Too of a few kiloelectronvolts) is innposed by the maximum slew rate of the high voltage power supplies. The low energy limit is of no particular importance in the present measurement because all lines of interest are excited ~ energies greater than a few kiloelectronvolts, and the high energy cutoff fails to sample only 2%-3% of the electrons in the MB probability function. The inaccuracy associated with this approach is much smaller than the uncertainties in atomic theories of CE.
The fidelity of the MB simulation technique was verified by measuring the intensity ratios of the DR satellite transition j to the resonance line w of the He-like Mg with a high resolution crystal spectrometer [36]. However, in that measurement, the line j was not spectroscopically resolved as it blended with the CE line z of Mg XI. Instead, it was resolved by the fact that j was excited by DR at a particular resonance energy below the CE threshold of z, and that the beam energy that excited the photon can be tagged in the measurement. Obviously, such techniques cannot be relied upon in astrophysical applications. In the present experiment we show that the XRS can be used to spectroscopically resolve the DR satellite transitions of Fe XXV and Fe XXVI.
For our measurement we set the MB simulator to produce a temperature of 4 keY (45 MK), and the MB timing pattern had a period of 10 ms. The iron ions were ini.ected with a metal vapor vacuum arc (Me VVA) source. The trap was dumped and refilled every I s to minimize the effects of accumulating background ions [38]. The XRS was operated at a detector temperature of 50 mK, and had a spectral resolution of -6.7 e V in the 6.6-8.5 ke V range after combining photons from 14 active pixels. We used the photometrically calibrated &pectral response of the XRS to correct the intensities of lines at different X-rey energies. Because the lines of interest are located in a relatively narrow band of 6.6-
Published by NRC Research Press
Gu et al. 353
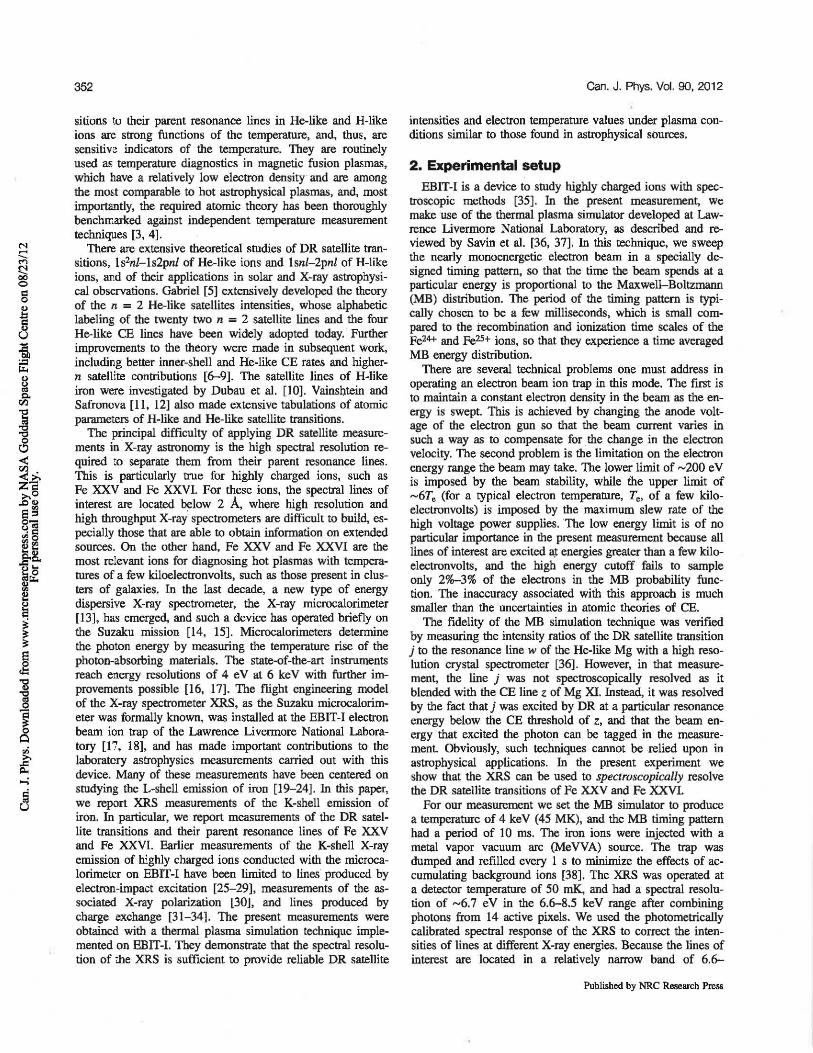
Fig. 1. Iron emission recorded with the XRS calorimeter on the EBIT-I electron beam ion trap. A MB plasma simulator was employed to produce an electron distribution corresponding to a temperature of 4 keY.
104r-~-----.----~----.-----__ ----,-----__ ----,-----,
Ka
Lya
2 4 6 8 X-ray Energy (keV)
8.5 keY, the uncertainties in the response corrections are estimated to be <5%. A total of -14 h of data were taken, resulting in the spectrum shown in Fig. 1. The spectrum is dominated by the L-shell Fe emission near 1 ke V, which is a consequence of the high CE cross sections of L-shell ions. The K-shell emission of iron, however, is clearly visible.
3. Measurement and analysis The detailed lrnn K-shell spectrum is shown in Figs. 2 and
3. The spectral range between 6.59--1l.50 keV is broken up into four regions: the 6.6()...{).72 keV region containing the K" lines and associated satellite transitions of Fe XXV; the 6.88-7.02 keV region containing the Ly. lines and the associated satellite transitions of Fe XXVI; the 7.65-7.95 keV region containing the ~ lines and associated satellite transitions of Fe XXV; and the 8.15--1l.52 keV region containing the Ky and Ks lines and associated satellite transitions of Fe XXV. For the K" spectrum, the standard line labels of Gabriel [5] are used. The satellite transitions to the Ly. lines of Fe XXVI are collectively labeled n2h, those to the ~, Ky, and Ka lines of Fe XXV are labeled n3, n4, and n5, reflecting the fact that they are transitions of types Is221-ls21nl with n = 3, 4, and 5, respectively. The alternative radiative decay branch of the I s21nl upper levels, the I s2nl-1 s21nl transitions, . is very close to the w line for n ~ 3, and cannot be resolved with the present spectrometer.
The n2h satellite transitions are well separated from the Ly. CE lines, and DR is the only mechanism that can form these satellite transitions. Aoalysis is thus relatively simple. By contrast, the satellite transitions of Fe XXV may have severe blends from parent resonance transitions, and some satellite transitions are actually fonned to varying degree by inner-shell excitation of Fe XXIV (see, e.g., ref. 39). To extract meaningful line intensities in such cases, we use a more complex analysis technique than fitting isolated lines.
In the first step of our analysis, we carry out a global fit of the entire spectrum with a single temperature thermal plasma model. The atomic parameters used to construct the plasma model are calculated with the Flexible Atomic Code (FAC) [40]. This code has also been used to calculate the K-shell satellite spectrum of Ar XVII for application in magnetic fusion, and the temperatures derived based on the calculated atomic parameters have been benchmarked against independ-
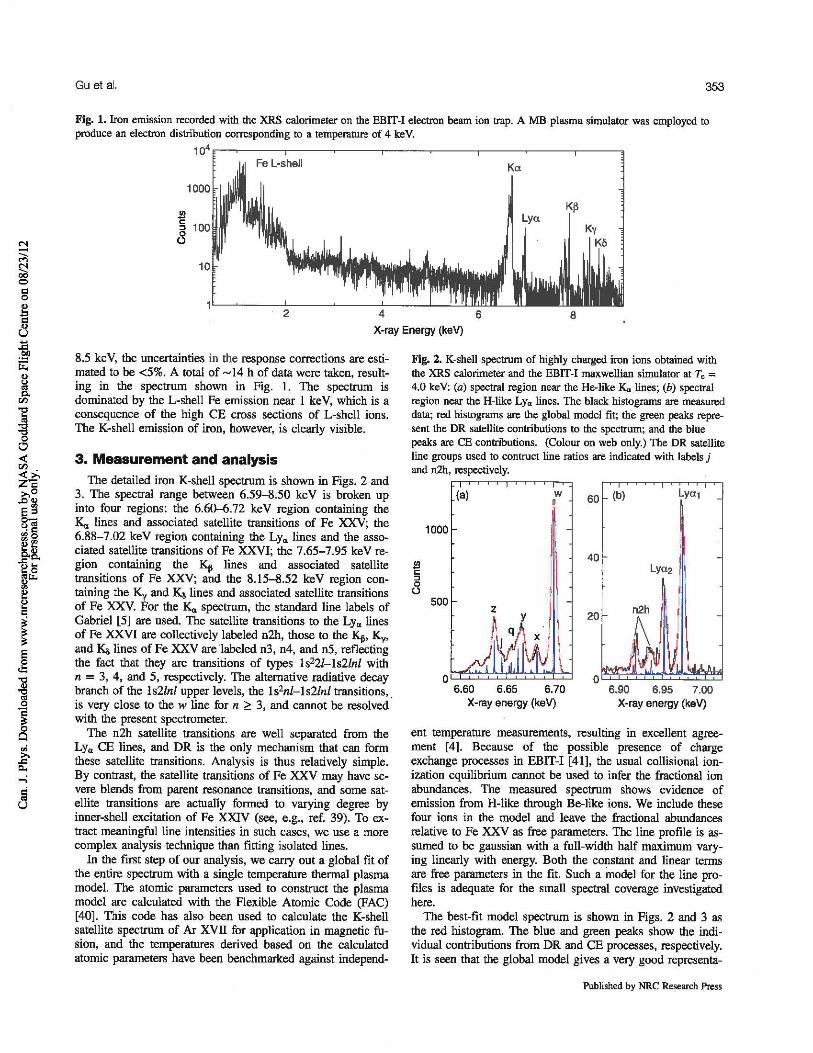
Fig. 2. K-shell spectrum of highly charged iron ions obtained with the XRS calorimeter and the EBIT-I maxwellian simulator at Te = 4.0 keY: (a) spectral region near the He-like Ka lines; (b) spectral region near the H-like LYa lines. The black histograms are measured data; red histograms are the global model fit; the green peaks represent the DR satellite contributions to the spectrum; and the blue peaks are CE contributions. (Colour on web only.) The DR satellite line groups used to contruct line ratios are indicated with labels j and n2h, respectively.
(a) w p 60 (b)
1000
40 11'. Lya2
500
ot::e:~~~~
~ /1 : W~ U I '~.'" o
20
6.60 6.65 6.70 6.90 6.95 7.00 X-ray energy (keV) X-ray energy (keV)
ent temperature measurements, resulting in excellent agreement [4]. Because of the possible presence of charge exchange processes in EBIT-I [41], the usual collisional ionization equilibrium cannot be used to infer the fractional ion abundances. The measured spectrum shows evidence of emission from H-like through Be-like ions. We include these four ions in the model and leave the fractional abundances relative to Fe XXV as free parameters. The line profile is assumed to be gaussian with a full-width half maximum varying linearly with energy. Both the constant and linear terms are free parameters in the fit. Such a model for the line profiles is adequate for the small spectral coverage investigated here.
The best-fit model spectrum is shown in Figs. 2 and 3 as the red histogram. The blue and green peaks show the individual contributions from DR and CE processes, respectively. It is seen that the global model gives a very good representa-
Published by NRC Research Press
354
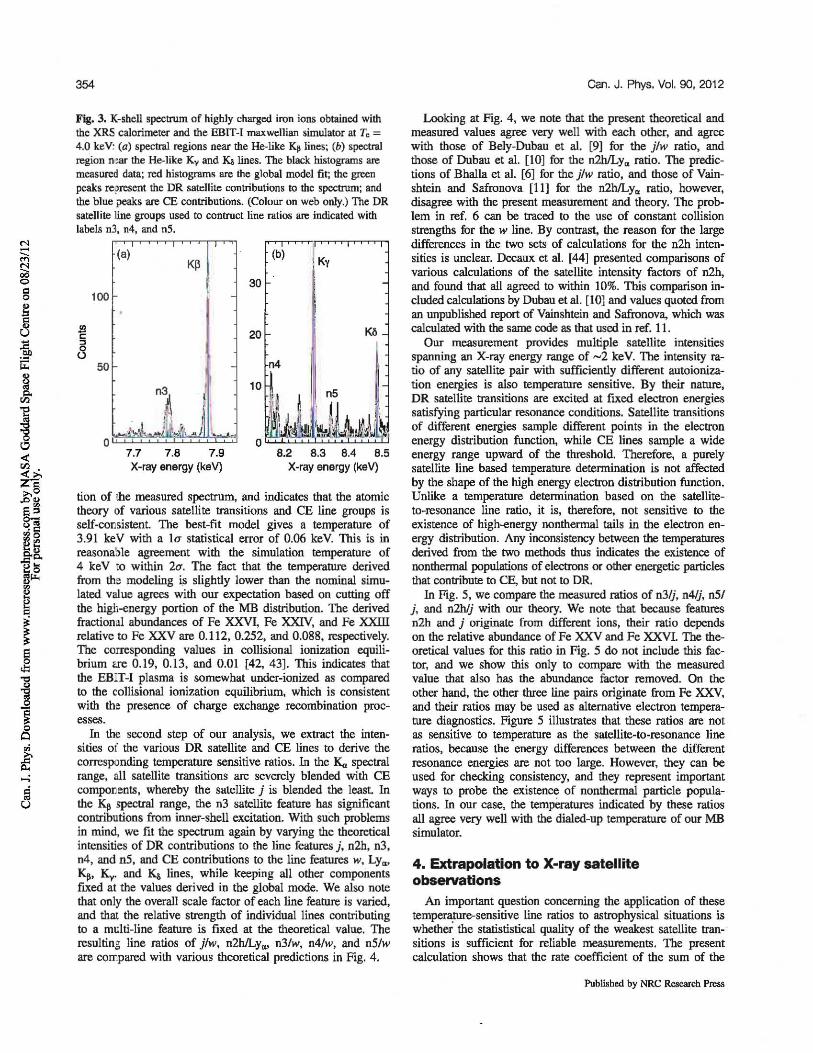
Fig. 3. K-shell spectrum of highly charged iron ions obtained with the XRS calorimeter and the EBIT-I maxwellian simulator at Te = 4.0 keV: (0) spectral regions near !he He-like K", lines; (b) spectra) region n~ the He-like Ky and ~ lines. The black. histograms are measured data; red histograms are the global mode] tit; the green peaks re?resent the DR satellite contributions to the spectrum; and the blue peaks are CE contributions. (Colour on web only.) The DR satellite line groups used to contruct line ratios are indicated with labels n3, n4, and 05.
tion of the measured spectrum, and indicates that the atomic theory of various satellite transitions and CE line groups is self-consistent. The best-fit model gives a temperature of 3.91 keV with a la statistical error of 0.06 keY. This is in reasonable agreement with the simulation temperature of 4 keV to within 2a. The fact that the temperature derived from the modeling is slightly lower than the nominal simulated val ue agrees with our expectation based on cutting off the high-energy portion of the MB distribution. The derived fraction.l abundances of Fe XXVI, Fe XXIV, and Fe XXUI relative to Fe XXV are 0.112,0.252, and 0.088, respectively. TIle corresponding values in collisional ionization equilibrium = 0.19, 0.13, and 0.0\ [42, 43]. This indicates that the EBIT-I plasma is somewhat under-ionized as compared to the co1lisional ionization equilibrium, which is consistent with the presence of charge exchange recombination processes.
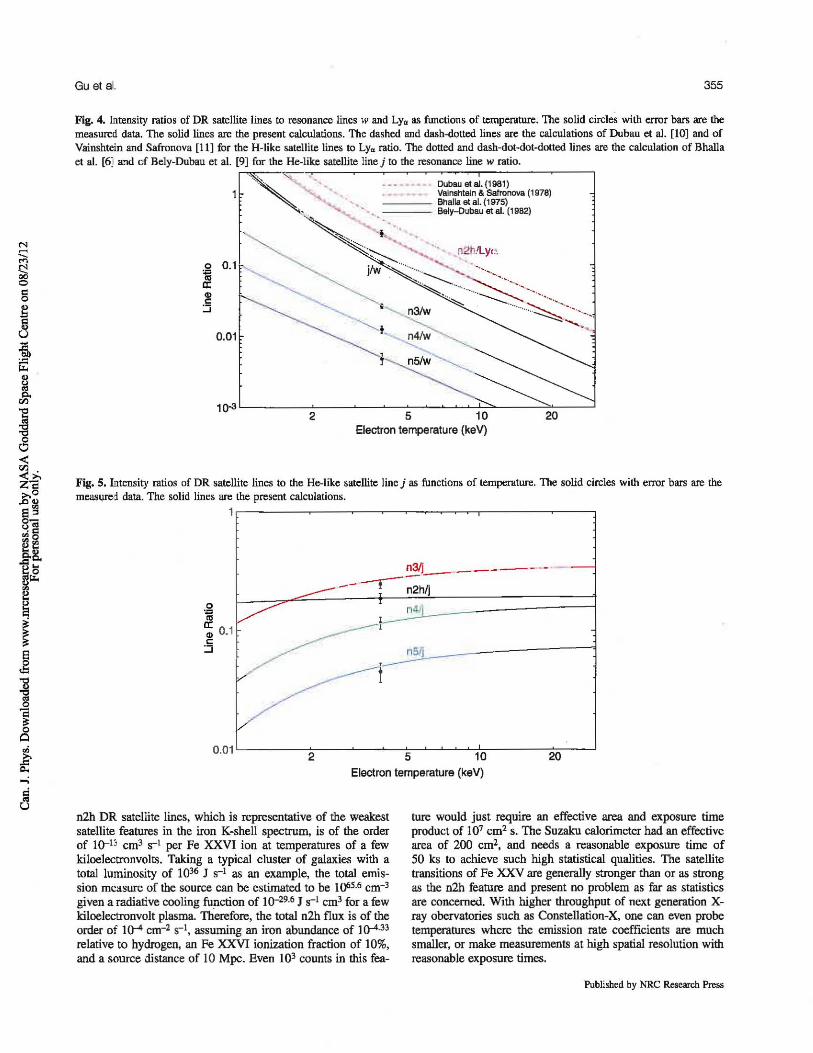
In the second step of our analysis, we extract the intensities of the various DR satellite and CE lines to derive the corresponding temperature sensitive ratios. In the K. spectral range, .11 satellite transitions are severely blended with CE components, whereby the satellite j is blended the least. In the ~ specual range, the n3 satellite feature has significant contributions from inner-shell excitation. With such problems in mind, we fit the spectrum again by varying the theoretical intensities of DR contributions to the line features j. n2h, 03, 04, and 05, and CE contributions to the line features w, Ly .. ~, Ky. and K" lines, while keeping all other components fixed at the values derived in the global mode. We also note that only the overall scale factor of each line feature is varied, and that the relative strength of individual lines conUibuting to a multi-line feature is fixed at the theoretical value. The resulting line ratios of jlw, n2hlLy., n3lw, n4/w, and n51w are compared with various theoretical predictions in Fig. 4.
can. J. Phys. Vol. 90, 2012
Looking at Fig. 4, we note that the present theoretical and measured values agree very well with each other, and agree with those of Bely-Dubau et aI. [9] for the j1w ratio, and those of Dubau et al. [10] for the n2h1Ly. ratio. The predictions of Bhalla et al. [6] for the jlw ratio, and those of Vainshtein and Safronova [11] fur the n2h1Ly. ratio, however, disagree with the present measurement and theory. The problem in ref. 6 can be traced to the use of constant collision strengths fur the w line. By contrast, the reason for the large differences in the two sets of calculations for the n2h intensities is unclear. Decaux et al. [44] presented comparisons of various calculations of the satellite intensity factors of n2h, and found that all agreed to within 10%. This comparison included calculations by Dubau et al. [10] and values quoted from an unpublished report of Valnshtein and Safronova, which was calculated with the same code as that used in ref. II.
Our measurement provides multiple satellite intensities spanning an X-ray energy range of -2 keY. Tbe intensity ratio of any satellite pair with sufficiently different autoionization energies is also temperature sensitive. By their nature, DR satellite transitions are excited at fixed electron energies satisfying particular resonance conditions. Satellite tran~itions of different energies sample different points in the electron energy distribution function, while CE lines sample a wide energy range upward of the threshold. Therefore, a purely satellite line based temperature determination is not affected by the shape of the high energy electron distribution function. Unlike a temperature determination based on the satelliteto-resonance line ratio, it is, therefore, not sensitive to the existence of high-energy nontherma1 tails in the electron energy distribution. Any inconsistency between the temperatures derived from the two methods thus indicates the existence of nonthermal populations of electrons or other energetic particles that contribute to CE, but not to DR.
In Fig. 5, we compare the measured ratios of n3/j, n4/j, n51 j, and n2h1j with our theory. We note that because features n2h and j originate from different ions, their ratio depends on the relative abundance of Fe XXV and Fe XXVL Tbe theoretical values for this ratio in Fig. 5 do not include this factor, and we show this only to compare with the measured value that also has the abundance factor removed. On the other hand, the other three line pairs originate from Fe XXV, and their ratios may be used as alternative electron temperature diagnostics. Figure 5 illustrates that these ratios are not as sensitive to temperature as the satellite-to-resonance line ratios, because the energy differences between the different resonance energies are not too large. However, they can be used for checking consistency, and they represent important ways to probe the existence of nonthermal particle populations. In our case, the temperatures indicated by these ratios all agree very well with the dialed-up temperature of our MB simulator.
4. Extrapolation to X-ray satellite observations
An important question concerning the application of these tempenl;ture-sensitive line ratios to astrophysical situations is whether the statististical quality of the weakest satellite transitions is sufficient for reliable measurements. The present calculation shows that the rate coefficient of the sum of the
Published by NRC Research Press
..;
Gu at a . 355
Fig. 4. Intensity ratios of DR satellite lines to resonance lines w and LYa as functions of temperature. The solid circles with error bars are the measured data. The solid lines are the present calculations. The dashed and dash~dotted lines are the calculations of Dubau et aI. (10] and of Vainshtein and Safronova [11] for the H-like satellite lines to LYIl ratio. The dotted and dash-dot-dot-dotted lines are the calculation of Bhalla et aI. [6) a'1d. cf Bely-Dubau et al. [9] for the He-like satellite line j to the resonance line w ratio.
~ Oubau et 81.(1981) Yalnshtain & Safronova (1978)
==== BhaJla at aI. (1975)
""' . Bely-Oubau at aI. (1982)
"', I ....
~~ "-0.1 - Vw','" .....
. ;;;::---... ~""'" 0
~ a: . "'" ...... ~ .. ", ,
n3lw ~" '" ............ "'.
<D
" ::::;
O.ot ,~~ !~~
Electron temperature (keV)
Fig. S. Intensity ratios of DR satellite lines to the He-like satellite line j as functions of temperature. The solid circles with error bars are the rneasQ.Ted data. The solid lines are the present calculations.
1 r-----------------------~--,_----------_,
o .'" /}, " 0.1 " :::J
n
j
0.01 L-----2=--~-~~5,-~~~-!10=----~2:;;-0---.J
Electron temperature (keV)
n2h DR satellite lines, which is representative of the weakest satellite features in the iron K-shell spectrum, is of the order of 10-13 cm3 S-i per Fe XXVI ion at temperatures of a few kiloelectronvolts. Taking a typical cluster of galaxies with a total luminosity of 1036 J S-i as an example, the total emission measure of the source can be estimated to be 1 ()6S.6 cm-3
given a radiative cooling filp.ction of 10-29.6 J 8-1 em3 for a few kiloelectronvolt plasma, Therefore, the total n2h flux is of the order of 10-' cm-1 s-', assuming an iron abundance of 10-'33 relative to hydrogen, an Fe XXVI ionization fraction of 10%, and a source distance of 10 Mpc. Even 103 counts in this fea-
ture would just require an effective area and exposure time product of 107 cm2 s. The Suzaku calorimeter had an effective area of 200 cm2• and needs a reasonable exposure time of 50 ks to achieve such high statistical qUalities. The satellite transitions of Fe XXV are generally stronger than or as strong as the n2h feature and present no problem as far as statistics are concerned. With higher throughput of next generation xray obervatories such as Constellation-X, one can even probe temperatures where the emission rate coefficients are much smaller, or make measurements at high spatial resolution with reasonable exposure times.
Published by NRC Research Press
356
6. Conclusions We have presented .0 laboratory measurement of the
Fe XXV and Fe XXVI K-shell spectrum obtained with a thermal plasma simulator on the Livermore EBIT-I facility and the Goddard Space Flight Center XRS microcalorimeter. It is shown that the spectral resolution of the XRS is sufficient fc, reliable temperature diagnostics using the DR satellite transitions and CE resonance lines of both Fe XXV and Fe XXVI. This bodes well for future calorimeter-based satellite missions, especially as these may be equipped with X-ray calorimeters with even better energy resolution. High-n Fe XXV satellite transitions of type Is221-ls21nl with n up to 5 are detected and show promise to constrain electron tern· peratu= with just DR satellite intensity ratios. Comparison with temperatu= derived from the satellite to resonance line ratios provides a possible probe of the existence of nonthermal populations of energetic particles.
Our measured line ratios involving the DR satellite transitions and resonance CE lines are in good agreement with various theoretical calculations, except for the early results of Bhalla , t al. [6) and of Vainshtein and Safronova [11). This is not surprising, as lhe same theories have also been benchmarked against independent temperature measurement techniques in magnetic fusion applications.
Acknowledgements This work was performed under the auspices of the US
Department of Energy by Lawrence Livermore National Laboratory under Contract DE-AC52-07NA27344, and supported by NASA APRA grants to Lawrence Livermore National Laboratory and Goddard Space Flight Center.
References I. J.R. Peterson and A.C. Fabian. Phys. Rep. 427, I (2006).
dei: I 0.1 0 16/j .physrep.2005 .12.007. 2. M. Watanabe, K. Yamashita, A. Fwuzawa, H. Kunieda, and Y.
nwara. Pub!. Astron. Soc. Jpn. 53, 605 (200 I). 3. M. Bitter, S. von Goeter, S. Cohen, et a1. Phys. Rev. A, 29, 661
(1984). doi:10.1103IPhysRevA.29.661. 4. M. BiUer, M.F. Gu, L.A. Vainshtein. P. Beiersdorfer. G.
Bertsclringer, O. Marchuk, R. Bell, B. LeBlanc, K.W. Hill, D. Johnson, and L. Roquemore. Pbys. Rev. Lett. 91, 265001 (2003). doi:10.ll03IPhysRevl.ett.91.265001. PMID: 1475405B.
5. A.H. Gabrie!' Mon. Not R. Astran. Soc. 160, 99 (1972). 6. C.P. Bhalla. A.H. Gabriel, and L.P. Presnyakov. Mon. Not R.
A,Iron. Soc. 172, 359 (1975). 7. F. Bely-Dubau, A.H. Gabriel, and S. Volon~. Mon. Not. R.
Astran. Soc. 186, 405 (1979). B. F. Bely-Dubau, A.H. G.brie~ and S. Volante. Mon. Not. R.
A,tron. Soc. 189, 801 (1979). 9. F. Bely-Dubau, J. Duhan, P. Faucher, and A.H. Gabriel. Mon.
Not. R. Astron. Soc. 198, 239 (1982). 10. J. Dubau, M. Loulergue, A.H.G.I.. Steenman-Clark, and S.
Volontt. Mon. Not. R. Astran. Soc. 195, 705 (1981). 11. L.A. Vainshtein and U.I. Safronova. At Data Noel. Data
Tables, 21 , 49 (1978). doi:IO.lOl61OO92-640X(78)90003-7. 12. L.A. Vainshtein and HI. Safronova. At Data Nucl. Data
Tables, 25, 311 (1980). doi:IO.10IMJ092-640X(BO)90007-8. 13. C.K. Stahle, D. McCammon, and K.D. Irwin. Phys. Today, 52,
32 (1999). doi:IO.1063/1.882776.
Can. J. Phys. Vol. 90, 2012
14. R.I.. Kelley, K. Mitsuda, C.A. Allen, et aI. Pub!. Astran. Soc. Jpn. 59, 77 (2007).
IS. R.L. Kelley, S.R. Sandler, W.B. Doriese, et a1. American Institute of Physics Conference Series. Edited by B. Young, B. Cabrera, and A. Miller. AlP, New York. 2009. Vol. 1185, p.757.
16. F.S. Porter, G.V. Bmwn, K..R. Boyce, et aI. Rev. Sci. Instrum. 75,3772 (2004). doi:1O.1063/1.1781758.
17. F.S. Porter, B.R. Beck, P. Beiersdorfer, et aI. Can. J. Phys. 86, 231 (2008). doi:1O.1.1391P07-147.
18. F.S. Porter, P. Beiersdorfer. O.v. Brown, M.F. Gu, R.L. Kelley, S.M. Kahn, C.A. Kilbourne, and D.B. Thorn. J. Phys. Conf. Ser. 163, 012105 (2009). doi:10.108811742-65961163/lf 012105.
19. H. Chen, P. Beiersdorfer, I .H. Scofleld, et aI. Astrophys. J. 567, L169 (2002). doi:IO.10861340007.
20. P. Beiersdorfer, E. Behar, K.R. Boyce, et aI. Astrophys. J. 576, L169 (2002). doi: 10. 10861343785.
21. M.-F. Gu, P. Beiersdorfer, G.V. Brown, H. Chen, K.R. Boyce, R.I.. Kelley, C.A. Kilbourne, F.S. Porter, and S.M. Kahn. Astrophys. J. 607, 1.143 (2004). doi:IO.1086/421975.
22. H. Chen, P. Beiersdorfer, J.H. Seofield, et aI. Astrophys. J. 618, 1086 (2005). doi:10.1086/426135.
23. G.V. Brown, P. Beiersdorfer, H. Chen, I.H. Scofield, K.R. Boyce, R.I.. Kelley, C.A. Kilbourne, F.S. Porter, M.F. Gu, S.M. Kahn, and A.B. Szymkowiak. Phys. Rev. Lett. 96, 253201 (2006). doi:IO.l103IPhysRevLett.96.253201. PMID: 16907303.
24. P. Beiersdorfer. Annu. Rev. Astron. Astraphys. 41, 343 (2003). doi: 10.1 146/annurev.astra.41.01 1802.094825.
25. D.B. Thorn, G.v. Brown, I .H.T. Clementson, et aL Can. 1. Phys. 86, 241 (2008). doi: 1O.11391P07-134.
26. D.B. Thorn, M.F. Gu, G.V. Brown, P. Beiersdorfer, F.S. Porter, C.A. Kilbourne, and R.I.. Kelley. Phys. Rev. Lett. 103, 163001 (2009). doi: I 0.11 03lPhysRevLett.103 .16300 1. PMID: 19905691.
27. P. Beiersdorrer, M.P. Gu, G.V. Brown, et aJ. 1. Phys. Conf. Ser. 163,012021 (2009). doi:10. IOBB/1742-6596/163111012021.
28. P. Beiersdorfer, G.v. Brown, I.H.T. Clementson, et aI. 1. Phys. Conf. Ser. 163, 012022 (2009). doi:IO.108B/1742-6596/163/lf 012022.
29. D.B. Thorn, P. Beiersdorfer, G.V. Brown, R.I.. Kelley, C.A. Kilbourne, and F.S. Porter. J. Phys. Conf. Ser. 163, 012036 (2009). doi: 10.1 088/1742-6596/163/1/012036.
30. D.L. Robbins, P. Beiersdorfer, A.Y. Faenov, et aJ. Phys. Rev. A, 74, 022713 (2006). doi:IO.1103IPhysRevA.74.022713.
31. P. Beiersdorfer, K.R. Boyce, G;V. Brown, H. Chen, S.M. Kahn, R.I.. Kelley, M, May, R.E. Olson, ES. Porter, C.K. Stahle, and W.A. Tillotson. Science, 300, 1558 (2003). doi:lO. 1126/science.1084373. PMID:12791989.
32. BJ. Wargelin, P. Beiersdorfer. and G.V. Brown. Can. J. Phys. 86, 151 (2008). doi:IO.l1391P07-125.
33. M. Frankel, P. Beiersdorfer, G.V. Brown, M.F. Gu, R.L. Kelley, C.A. Kilbourne, and F.S. Porter. Astraphys. J. 702,171 (2009). doi: 10.1 088!1lOO4·637xn02/1/171.
34. M.A. Leutenegger, P. Beiersdorfer, G.v. Brown, RL. Kelley, C.A. Kilbourne, and F.S. Porter. Phys. Rev. Lett. IDS, 063201 (2010). doi:IO.IL03IPhysRevl.ett.105.06320!. PMID: 2086797B.
35. P. Beiersdorfer. Can. 1. Phys. 86, I (2008). doi: 10.11391P07-135.
36. D.W. Savin, P. Beiersdorfer, S.M. Kahn, B.R. Beck, G.V. Brown, M.-F. Gu, D.A. Liedahl, and J.H. Scofield. Rev. Sei. Instrum. 71, 3362 (2000). doi:1O.1063/1.1287045.
Published by NRC Research Press
Gu at al.
37. D.W. Savin. N.R. Badnell. P. Beiersdorfer, et aJ. Can. J. Phys. 86.209 (2008). doi:10.11391P07-159.
38. RE. Marrs. Can. I. Phys. 86, 11 (2008). doi:1O.1l391P07-1I0. 39. P. Beiern!orfer, T. Phillips, Y.L 1acobs, K.W. Hill, M. Bitter,
S. von Goeler, and S.M. Kahn. Astrophys.1. 409, 846 (1993). doi:1O.10861172715.
40. M.F. Gu. Can. I. Phys. 86, 675 (2008). doi:1O.11391P07-197. 41. P. Beiersdorfer, A.I.. Osterheld, M.H. Chen, I .R. Henderson,
D.A. Knapp, M.A. Levine, R.E. Marrs, IU. Reed, M.B. Schneider, and D.A. Yogel. Phys. Rev. Lett. 65, 1995 (1990). doi: 10. I 103IPhysRevLett.65.1995. PMID:lOO42420.
357
42. P. Mazzotta, G. Mazzitelli, S. Colafrancesco. and N. Vinorio. Astron. Astrophys. Suppl. Sor. 133, 403 (1998). doi:1O.10511 aas: 1998330.
43. P. Bryans, N.R. Badnell, T.W. Gorczyca, I.M. Lanring, W. Minburnsiri, and D.W. Savin. Astrophys. J. 167, Suppl., 343 (2006). doi:1O.10861507629.
44. V. Decaux, M. Bitter, H. Hsuan. S. von Goetee, K.W. Hill, R. A. Hulse, G. Taylor, H. Park, and C.P. Bhalla. Phys. Rev. A. 43, 228 (1991). doi:1O.1103IPhysRevA.43.228. PMID: 9904773.
Published by NRC Research Press