Embed Size (px)
Citation preview
Laboratory Restructuring and Development for the Course of Electric
Machinery Using Software and Hardware IT Tools
Shuhui Li
Department of Electrical Engineering & Computer Science Texas A&M University – Kingsville
Kingsville, TX 78363
ABSTRACT
The paper presents the laboratory restructuring and development for the course of Electric Machines, also known as Electric Machinery or Energy Conversion, for an integrative teaching approach. It shows the restructuring by using modern computer software and hardware information technology (IT) tools, by introducing DSP and digital control technology, and by restructuring a traditional energy conversion laboratory at TAMUK. The paper illustrates laboratory experiments developed for both dynamic controls of electric drives and traditional steady-state measurements of transformers and electric machines, and demonstrates the effectiveness of the power-pole and average models for developing real-time control systems for power electronic converters and electric drives. It presents typical experiments designed for students to do simulation using Simulink and actual measurement using dSPACE, and to compare simulation with measurement. It shows various computer hardware and software IT tools used in the restructured laboratory for effective control, measurement, design, data acquisition, and result analysis of electric drive systems and power electronic converters.
Index Terms – Electric machines and drives, power electronics, feedback controls,
education, MATLAB® Simulink, dSPACE, OpenChoice, MathCad, Microsoft Excel, Microsoft PowerPoint.
1. INTRODUCTION
As the technology of Electrical and Computer Engineering (ECE) grows, an undergraduate ECE program is under constant pressure to keep content up-to-date within a four-year context of a fixed number of credit hours allowed for graduation. These technology changes also challenge the traditional teaching structure to one of the core courses, Energy Conversion or Electric Machinery, in a general ECE program.
At Texas A&M University – Kingsville (TAMUK), the course of Electric Machinery, a
required course in the ECE curriculum, used to cover steady-state three-phase circuits, transformers, DC generators and motors, AC synchronous generators, and AC induction motors
Proceedings of the 2005 American Society for Engineering Education Annual Conference & Exposition Copyright © 2005, American Society for Engineering Education
Page 10.861.1

[1, 2]. It basically dealt with line-fed and steady-state DC/AC electric machines with no attempt of controlling machine speed, torque, and/or position. Students used to think that the course was old-fashioned and boring. This had seriously limited students’ capability to recognize wide control applications of electric machines in the modern ECE field and the integrative characteristics of electric machines with many other ECE courses.
In 2003, the lecture part of the Electric Machinery course was restructured at TAMUK by
using an integrative teaching approach which presents students a complete view of controllable energy conversion or electric drive systems with topics covering electric machines, power electronics, feedback controls, power supply systems, and mechanical loads. The reformation has resulted in great positive feedbacks from students. In the restructured course, a diverse set of topics are covered in a rapid succession so that it is important to have corresponding hardware-based laboratory experiments performed concurrently by students to re-emphasize students’ learning of theories.
This paper presents the laboratory restructuring and development for the restructured
Electric Machinery course by using modern computer software and hardware information technology (IT) tools, by introducing DSP and digital control technology, and by restructuring a traditional energy conversion laboratory at TAMUK. The reformed laboratory has been implemented and applied concurrently to the restructured Electric Machinery course at TAMUK. This paper first gives the basic lecture structure of the course and then shows the laboratory experiments developed to be tightly coupled with the lecture. It presents various modern and state-of-the-art computer hardware and software IT tools used in the laboratory for control, measurement, design, data acquisition, and result analysis. It finally gives conclusions.
2. AN INTEGRATIVE TEACHING APPROACH
The basic teaching structure of the restructured Electric Machinery course is based on the integrative and controllable energy conversion or electric drive system of Figure 1 [3, 4]. In the figure, the power-processing unit (PPU), consisting of power electronics based converters, gets its power from the utility source with single-phase or three-phase sinusoidal voltages of a fixed frequency and constant amplitude. The controller, by comparing the input command with actual measured values of speed and/or position through sensors, provides appropriate control signals to the PPU. The PPU, in response to the controller outputs, converts efficiently the fixed-form input voltages into an output of the appropriate form (in frequency, amplitude, and/or the number of phases) that is optimally suited for operating the machine. Although electric machinery is still a major teaching topic, the integrative approach is also intended to give students a complete knowledge view on all the other subsystems in Figure 1 that include power electronic converters, mechanical system requirements, feedback control designs, and utility systems. However, the introduction of those subsystems should be just enough for students to be able to analyze and design typical energy conversion or electric drive systems with feedback controls [3].
The fundamental knowledge and concepts for traditional steady-state analysis of electric
machines is still covered in the new teaching structure. This is done by developing steady-state models from dynamic models for DC machines and from space vectors for AC machines [3]. The characteristics of the electric machines working as generators and motors are taught in both
Proceedings of the 2005 American Society for Engineering Education Annual Conference & Exposition Copyright © 2005, American Society for Engineering Education
Page 10.861.2

controlled and uncontrolled ways (steady-state). From machine control points of views, the block diagram of Figure 1 represents more realistically the concept of the power flowing in and out of a machine by controlling a PPU.
Utility System
PowerProcessingUnit (PPU)
ElectricMachine
MechanicalDrive/Load
Sensors
Controller
Power
Signal
Fixed form
Input command(speed/position)
speed/position
Adjustableform
Figure 1. Block diagram of a controllable energy conversion/electric drive system
The integrative approach covers many topics. For a course of 3 hours in one semester, the teaching module of Table 1 is used. Appropriate models and approaches have been developed and/or used for quick introduction of mechanical systems, typical power electronic converters, feedback control designs, and AC machine space vectors as shown in [4]. Significant computer assisted teaching methodologies have been developed [4]. Although all these are important for successful teaching of the restructured course, a tightly coupled hardware-based laboratory is critical to ensure that concepts and theories in the restructured course are properly grasped by the students and also to prepare them to the “real world” where they can build, test or use real hardware [20].
Table 1. Restructured Electric Drives Course Modules
No. Topics Lectures (39 hours)
1 Introduction to Energy Conversion/Electric Drive Systems 1 2 Understanding Mechanical System Requirements 2 3 Review of Basic Electric and Three Phase Circuits 3 4 Basic Understanding of Switch-mode Power Electronic Converters 3 5 Magnetic Circuits and Transformers 4 6 Basic Principle of Electromechanical Energy Conversion 2 7 DC Generators and DC Motor Drives 4 8 Designing Feedback Control for DC Motor Drives 4 9 Introduction to AC Machines and Space Vectors 3
10 Sinusoidal PMAC Drives and Synchronous Generators 4 11 Induction Machines: Balanced, Sinusoidal, Steady State Operation 3 12 Adjustable Speed Induction Motor Drives 3 13 Vector-control of induction motor drives 2
Proceedings of the 2005 American Society for Engineering Education Annual Conference & Exposition Copyright © 2005, American Society for Engineering Education
Page 10.861.3

3. A HARDWARE-BASED LABORATORY
A hardware-based laboratory of the restructured course should be strongly coupled with the integrative teaching approach of Figure 1 and the teaching structure of Table 1. A diode rectifier plus a switch-mode converter as shown in Figure 2 can represent a typical laboratory configuration of Figure 1. The switch-mode converter can be either a four-quadrant converter for DC machines or a three-phase inverter for AC machines. The bi-positional switch of a power-pole is used to represent the same functionality of a practical electronic switch under the ideal switching condition, making it much easier and faster for students to understand and analyze fundamental characteristics of switch-mode power electronic converters.
P ow er P o lesP ow er P o les
Figure 2. Switch-mode converter and its power-pole representation in electric drive systems
A corresponding hardware implementation of the switch-mode converter is shown in Figure 3 [5, 6]. The drives board has been designed to enable a variety of experiments on AC/DC machines and have introduced digital control and DSP technologies by using Simulink and dSPACE. It has a 42 V dc-bus voltage input from a rectified dc power supply, two completely independent 3-phase PWM inverters for complete simultaneous control of two DC or AC machines, digital PWM input channels for real-time digital control of converters, and complete digital/analog interface with dSPACE board [5]. Each of the three phase converters can be used to control a DC machine when only two of the three power-poles are used or a three-phase AC machine when all the three poles are used.
a) Block Diagram b) Hardware Implementation
Figure 3. Power electronic converter drive board for DC and AC machine drives
Proceedings of the 2005 American Society for Engineering Education Annual Conference & Exposition Copyright © 2005, American Society for Engineering Education
Page 10.861.4

Several traditional experiments are also included for students to gain knowledge of steady-state characteristics of transformers and DC/AC electric machines. These are developed and restructured based upon the traditional energy conversion laboratory facility from Feedback Instruments Limited at TAMUK. Figure 4 presents the laboratory workstation setup. For most lab experiments, a short animated PowerPoint presentation as illustrated in Figure 3 b) has been used to demonstrate basic concepts and operations of an experiment. Appropriate methodologies and approaches have been developed and/or employed to let students get hands-on experience related to mechanical systems, typical power electronic converters, feedback control designs, and DC and AC machine characteristics as shown in the following sections. Significant computer software and hardware IT tools have been utilized. All these are important for successful teaching of the restructured laboratory.
Figure 4. Laboratory setup for traditional steady-state measurement of electric machines/transformers
4. UNDERSTAND MECHANICAL SYSTEM REQUIREMENTS AND SIMULINK THROUGH A SIMULATION EXPERIMENT From the mechanical drive point of view, a typical combined electrical and mechanical
drive system can be represented as Figure 5 a), where Tem is the electromagnetic torque produced by the motor, TL is the load (or mechanical drive) torque, and Jeq is the moment of inertia of the combined system. The torque difference, TJ = Tem - TL, will accelerate the system according to the Newton’s rotation law, i.e., TJ = Jeq · α. The electromagnetic torque Tem can be controlled by controlling the PPU and TL can be either a constant or variable torque depending on the mechanical system performance. When frictions such as viscous are considered, the mathematical model of the combined system can be represented by the equations in Figure 5 a).
A simulation experiment (Figure 5 b) is used to assist students’ virtual understanding of
the combined system represented by the Figure 5 a). It is also used as an experiment for students to familiarize themselves with Simulink and to learn approaches and techniques of building mathematical models in Simulink. After building the Simulink model, students can adjust the electric drive or the load torques through the Tem and TL slider bars to see how the torque changes may affect the angular acceleration, speed, and position of the combined electric drive system, giving them a practical way to understand the above mechanical equations and relationships. The experiment also develops appropriate foundation for students to use Simulink later on to build real-time DSP systems for electric machine controls.
Proceedings of the 2005 American Society for Engineering Education Annual Conference & Exposition Copyright © 2005, American Society for Engineering Education
Page 10.861.5

( )J em L m frictionT T T B t Tω= − − − (1)
( ) ( )m Jt d t dt T Jeqα ω= = (2)
0( ) (0) ( )
t
m mt dω ω α τ= + ∫ τ
d
(3)
0( ) (0) ( )
ttθ θ ω τ= + ∫ τ (4)
a) Electric drive system b) Simulink model Figure 5. An electric drive mechanical system and its Simulink model
5. UNDERSTAND DSPACE BY BUILDING A REAL-TIME SYSTEM
One of the best features of the dSPACE package is the ease of building real-time applications. Basically a real-time application can be created by means of two methods: 1) using Simulink for building the model and then automatically generating the C code and downloading it into the DSP memory, and 2) hand-coding in C and compiling the model into DSP code. The fastest way is developing the model in Simulink. Once one has completed a Simulink model, dSPACE software creates the real-time DSP code, downloads it on the DS1104 board (a dSPACE controller board used in the laboratory), and then automatically starts the hardware execution in real-time.
Figure 6 gives an overview of the architecture and the functional units of the DS1104
controller board [7]. The DS1104 R&D controller board provides the following features: 1) a Master PPC, based on the PowerPC 603e microprocessor, representing the computing power of the board and featuring several I/O units such as ADC and DAC units, 2) Slave DSP, based on Texas Instruments TMS320C31 floating-point DSP processor, featuring further I/O units such as PWM and digital I/O units, 3) Interrupt controller providing various hardware and software interrupts, 4) Memory comprising DRAM and flash memory, 5) Timers providing a sample rate timer, a time base counter, and 4 general-purpose timers, and 6) Host interface for setting up the DS1104, downloading programs and transferring runtime data from/to the host PC.
Figure 6. An overview of the architecture and the functional units of the DS1104
Proceedings of the 2005 American Society for Engineering Education Annual Conference & Exposition Copyright © 2005, American Society for Engineering Education
Page 10.861.6

A simple real-time experiment, as shown by Figure 7, is used to introduce dSPACE as well as its relationship with Simulink to let students understand the primary functional units of DS1104. It consists of developing a second order DSP system to process an input signal in both simulation and real-time implementation. For simulation, the model of Figure 7 a) is built in Simulink and the input signal is the simulation data generated by Simulink according to a selected waveform format. The input signal is processed by a second order system represented by a Laplace transform in the Simulink and the simulation results of Figure 7 c) is displayed on the host PC monitor.
For real-time implementation of the same system, however, the model of Figure 7 b) is
built in Simulink but is complied into DSP codes which are then loaded on the DS1104 board. After that, the DSP codes run on the master PPC of the DS1104 instead of the host PC. The DSP board receives a signal from an external source such as a function generator through one of its ADC channels, digitally processes the input signal by its master PPC, and then presents the output signal to an external device such as an oscilloscope through one of its DAC channels. The input and output signals to/from the DS1104 can also be transferred to the host PC through the host interface to be displaced on the monitor as shown in Figure 7 d) and control signals from the host PC can also be sent to the DS1104 as shown by the slider bar in the figure. Through both the simulation and real-time implementation of the simple second-order system, it presents a clear and effective way for students to quickly understand the major characteristics and concepts of building a real-time DSP system using dSPACE and the difference between the simulation and the real-time system.
a)
b)
c)
d)
Figure 7. Simulation and Real-time Implementation of a 2nd Order System 6. SWITCH-MODE CONVERTER CONTROLS BASED UPON POWER-POLE
AND AVERAGE MODELS
Proceedings of the 2005 American Society for Engineering Education Annual Conference & Exposition Copyright © 2005, American Society for Engineering Education
Page 10.861.7

The typical switch-mode converter can be either a four-quadrant converter for DC machines or a three-phase inverter for AC machines as illustrated by the power-pole models in Figure 2. The average model of a power-pole [8], represented by an ideal transformer with controllable turn-ratio as shown in Figure 8, makes it possible for students to quickly develop Simulink duty-ratio generation models in a laboratory environment to control power electronic converters for both simulation and real-time implementation. Based on the average model representation, it is really easy to build Simulink models for real-time controls of power electronic converters or electric machines in a laboratory environment.
a) Average model of a four-quadrant DC/DC converter
b) Average model of a DC/AC inverter for AC drives
Figure 8. Average model representation Figure 9 gives Simulink models for both the simulation and real-time implementation of
a switch-mode four-quadrant converter. In the simulation model of Figure 9 a), the duty-ratio calculator can be easily obtained based upon the average model concepts, and the converter model can be simply acquired based upon the power-pole model concepts. Then, the same duty-ratio calculator model is used in Figure 9 b) for real-time open-loop control of the actual switch-model converter (Figure 3). Through such an experiment, students can more clearly understand theoretical concepts of the power-pole and the average models and how to apply them to implement real-time DSP systems to control switch-mode converters for different output voltage needs as illustrated in Figure 9 c) and d) for both simulated and measured results.
a) b)
c)
d)
Figure 9. Simulation and real-time implementation of open-loop switch-mode converter control
Proceedings of the 2005 American Society for Engineering Education Annual Conference & Exposition Copyright © 2005, American Society for Engineering Education
Page 10.861.8

7. UNDERSTAND DYNAMIC AND STEADY-STATE MODELS OF DC MACHINES
The traditional teaching approaches and experiments of DC machines usually only deal
with the steady-state operating conditions [6, 7]. However, this is unsuitable for feedback control analysis and design of a DC machine. In our teaching practice, both DC machine dynamic and steady-state models are presented and tested experimentally. Figure 10 shows the DC machine equivalent circuit [3]. The corresponding dynamic and steady-state equations of the DC machine are shown in Table 2. In the table, the lower case represents instant value of an electric variable and the upper case represents steady-state value. Both the dynamic and steady-state models are suitable for DC machines working as generators or motors as well as running in forward or backward direction. This will not only give students the four-quadrant operation concept of a DC machine but also provide a proper experimentation example to Figure 1 to implement the four-
Figure 10. A DC
quadrant operation by controlling the PPU.
machine equivalent model
Table 2 odels Explanations teady-State
J m e ch
T m e ch
. DC motor dynamic and steady-state m Dynamic S
Induced Voltage Equation ble B )
(constant B )E f
aE m
k Be
k ω⎧
= ⎨⎩
le B )
(constant B )E f
aE m
kE
k ω⎧
= ⎨⎩
'
f
f
(variamω'
f
f
(variabmB ω
Developed Torque Equation ( )( )
'f
f
variable Bconstant B
T f aem
T a
k B iT
k i⎧⎪= ⎨⎪⎩
( )( )
'f
f
variable Bconstant B
T f aem
T a
k B IT
k I⎧⎪= ⎨⎪⎩
Electrical Equation aa a a a a
div e R i Ldt
= + + a a aV E R Ia= +
Mechanical Equation em L frictiondT T B T Jdtωω= + + + em L frictionT T B Tω= + +
a) b) Figu 1. Test circuits for measurement of DC machine characteristics re 1
Proceedings of the 2005 American Society for Engineering Education Annual Conference & Exposition Copyright © 2005, American Society for Engineering Education
Page 10.861.9

The first D nder steady-state conditi
After the above experiment, it is much easy for students to understand DC machine four-quadran
C machine experiment is the measurement of DC machines uons as shown by Figure 11 which is based on the facility as illustrated in Figure 4. In the
figure, there are two DC machines axially coupled together, one as a motor (Figure 11 a) and the other as a generator (Figure 11 b). Without the use of digital control and power electronic converters, this experiment is more proper to give students explicit preliminary view on how to apply an external voltage to run a DC machine as a motor and how to drive a DC machine as a generator as well as DC machine characteristics for different field exciting modes [9].
t operation and dynamic equations through a PPU controlled experiment. Figure 12 gives the dSPACE control desk layout for such an experiment. It has two axially coupled permanent magnet DC machines digitally controlled through two power-poles (Figure 9 b) so that either machine can be open-loop controlled as a generator or a motor. The Vmotor and Im represent the average voltage applied on and current flowing into one machine, and Vload and IL represent the voltage and current of the other. By controlling Vmotor and Vload through the slider bars in Figure 12 and looking at the polarity changes of Im, IL, and speed ωm, students can effectively and clearly understand the theoretical meaning of four-quadrant operations and how to practically implement four-quadrant operations by controlling the PPU.
Figure 12. dSPACE control desk layout for DC motor parameter measurement
The experiment has also been used for students to measure DC machine dynamic parameters such as armature winding inductance, La, and the moment of inertia, J, so as to re-euphemize their understanding of DC machine dynamic equations. Those parameters are also critical for DC machine feedback control designs. To estimate the armature inductance of a DC machine, for example, the motor is blocked standstill (ω = 0) and then applied by a step voltage at the armature terminal. This makes the armature current, ia, will increase exponentially in time as shown in Figure 12 [10]. The slope of this exponential curve (Figure 12), measured at t = 0 for a given voltage, would lead to the determination of the motor inductance from (5).
0
0
a
a
RLa a a a
t a a a
di V R Vedt R L L
− ⋅
=
= = (5)
Proceedings of the 2005 American Society for Engineering Education Annual Conference & Exposition Copyright © 2005, American Society for Engineering Education
Page 10.861.10

8. FEEDBACK CONTROL EXPERIMENT FOR DC MOTOR DRIVES
greatly
To design a controller in laboratory environment, a student just needs to modify the open-loop bo
hen, the controller performance can be first examined in simulation as shown in Figure
14 a) b
t is needed to specify that the understanding and knowledge gained by students on feedba
In the traditional teaching, feedback controls of electric machines were not covered. This affected students’ interests in the course and understanding of electric machines and
drives applied to wide control applications. Introducing feedback controls of electric machines has been demonstrated beneficial and successful. However, it is not required for students to have the linear control background [11, 12]. The methodology has been illustrated in [4] for controller design through bode plots which students normally have extensive practices from previous courses [10, 13, 14].
de plot of an electric drive system to achieve desired gain and phase margin requirements at cross-over frequencies by using Mathcad. Figure 13 shows the Mathcad worksheet used in the laboratory for the speed-loop PI controller design of an electric drive system. For any given design specification or DC machine parameters, the mathematical IT tool does all the calculations automatically. This not only makes it much faster to get a design solution but also makes the theoretical concepts of the controller design easy to see and understand.
Minerr k iΩ k pΩ,( )0.097970.02701
⎛⎜⎝
⎞
⎠=
Controller P and I gains: •
arg
1s k pΩ⋅
k iΩ+
s 2
⎛⎜⎜⎜⎝
⎞
⎟
⎠180− deg φ PM_ Ω+
k iΩ k T⋅
J eq
1s k pΩ⋅
k iΩ+
s 2⋅ 1
Given
k pΩ 0.0001:=k iΩ 0.0001:=s j ω cΩ⋅:=
Frequency response approach (gain cross-over & phase margin): •
ω cΩ 2 π f cΩ⋅:=φ PM_ Ω 60 deg:=f cΩ 1:=
Design specifications: •
J eq 407 10 6−⋅:=k T 0.082:=
Machine parameters needed for the controller design: •
Design DC Machine Speed Loop PI Controller Using Mathcad
Figure 13. Block diagrams of feedback control systems
Tefore hardware implementation. In the software simulation environment, it is easier and
more effective for students to check possible design errors, evaluate transients of the voltage, current, and/or speed of the DC machine close-loop control system (Figure 14 b). After the analysis and design, students can quickly build Simulink model (Figure 14 c) and dSPACE control desk layout (Figure 14 d) for real-time DSP based feedback control implementation, preventing them from possible errors or mistakes that could damage any electric and electronic component or device, and obtain more meaningful experimental results.
I
ck controls from the restructured Electric Drives course and laboratory cannot be replaced by other courses. In other words, students will have a comprehensive view on how to obtain a
Proceedings of the 2005 American Society for Engineering Education Annual Conference & Exposition Copyright © 2005, American Society for Engineering Education
Page 10.861.11

more practical plant transfer function with combined consideration of electric machines, power electronic converters, and mechanical loads (Figure 1), how to design a controller to achieve the desired control goal on torque, speed, and/or position of the integrated system, and how to implement the integrated feedback control system with DSP technology. This is one of the critical factors to motivate strong students’ interests in the course.
a) b)
c) d)
Figure 14. Blo agrams of a feedback control system for DC motor dr in Simulink
9. ROM SPACE VECTORS TO STEADY-STATE AC MACHINE EXPERIMENT
ntroducing ac machine space vectors [15] is necessary in leading seamlessly to how AC machin
he space vector concepts are beneficial in developing both dynamic and steady-state models and analytical approaches for AC synchronous and induction machines. On the one hand,
ck di ives
F Ie speed and position ought to be controlled optimally. However, this was not covered in
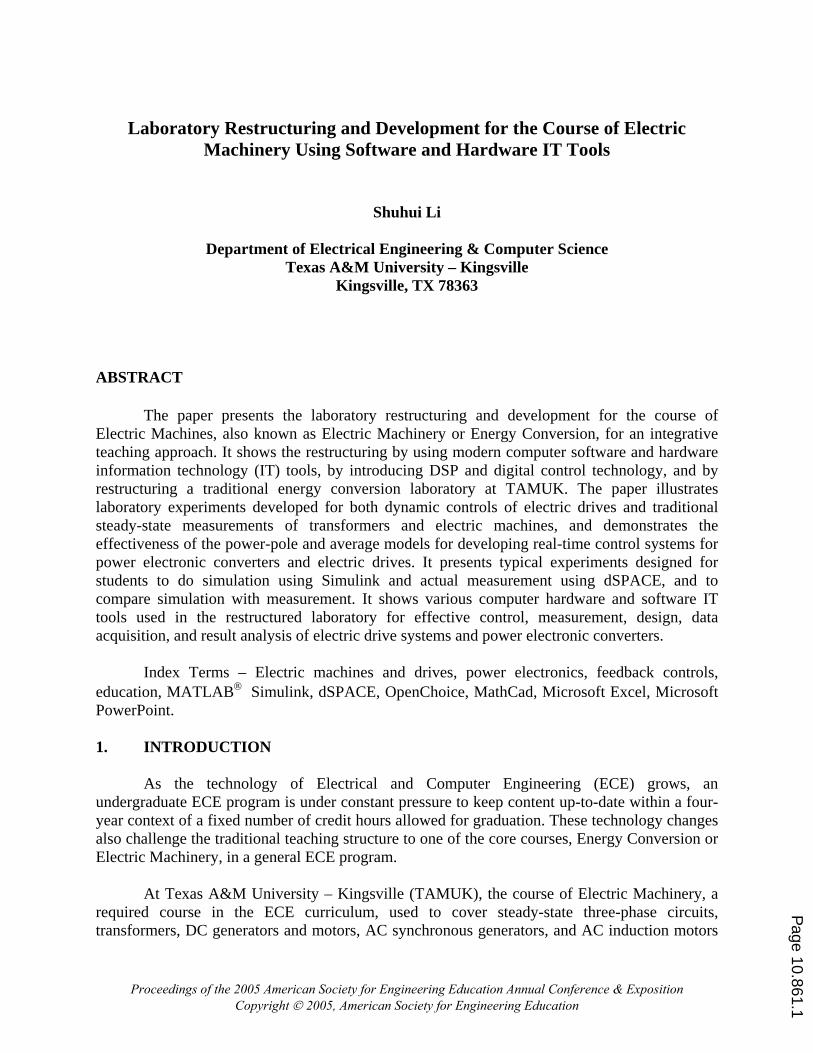
the traditional teaching structure of AC machines [2, 9, 16]. In order to avoid time-consuming issues related to AC machine windings, a hypothetical sinusoidally distributed winding [3, 4] is used as an equivalent representation of the field distribution generated by each phase winding of a practical AC machine (Figure 15). When sinusoidal flux density distributions or space vectors produced by the three phase stator windings are added together, a rotating field distribution or space vector will be generated. This hypothetical sinusoidally distributed winding presents a clear and straightforward approach about the sinusoidal flux density distribution in the air gap as well as its space vector representations [3].
T
Proceedings of the 2005 American Society for Engineering Education Annual Conference & Exposition Copyright © 2005, American Society for Engineering Education
Page 10.861.12
this ma
traditional steady-state model for a synchronous machine. With the application of the resultant stator c
kes it possible to teach fundamental issues related to AC machine controls. On the other hand, the traditional steady-state analysis of AC machines can still be covered. However, due to the limited laboratory hours, only steady-state AC machine experiments (Figure 4) are included in the laboratory section of the restructured course. The following gives an example of developing synchronous machine steady-state model and equivalent circuit through space vectors as well as an associated AC machine experiment.
Figure 15. Hypothetical sinusoidally distributed winding and space vector representation of sinusoidal flux density distribution
The space vector concep d to good understanding of the ts as shown in Figure 15 can lea
urrent space vector and the rotor magnetic field space vector, the induced voltages contributed from the two in the equivalent hypothetical sinusoidally distributed winding of Figure 15 c) can be obtained as shown in (6) and (7) [3, 12]. The resultant induced voltage (8) in the hypothetical sinusoidally distributed winding can then be transformed to per-phase induced voltage (9) [4]. Then, an equivalent circuit for steady-state synchronous motor drives can be obtained (Figure 16). The same equivalent circuit can be well introduced for a synchronous generator when the direction of power flow is changed from in to out. With this equivalent circuit, the real and reactive power generation of a synchronous generator can be obtained (10) when neglecting stator winding resistance.
Figure 16. Steady-state equivalent circuit for synchronous generators and motors
mse t ( ) ( )m m sj L i t t, ( ) ω ω= ∠ (6)
si
( )3 3( ) ( ) ( ) 902 2r E m m E m mt j k t k tω θ ω θ,
3( )2 2r
smms B
Ne t j rl Bω π⎛ ⎞= =⎜ ⎟⎝ ⎠
∠ = ∠ + ° (7)
( ),,
3( ) ( ) ( ) ( ) 90 ( )2srms E m m m m sms ims Be t e t e t k t j L i tω θ ω= + = ∠ + ° + (8)
Proceedings of the 2005 American Society for Engineering Education Annual Conference & Exposition Copyright © 2005, American Society for Engineering Education
Page 10.861.13

,ma Br
ma E m a a m m a
E
E k I I j L Iω ω= + (9)
ˆ ˆ ˆ ˆcos3 E Vδsin3 , 2 2
f a f aem em
s s
E VP Q
X Xδ −
= = (10)
An experiment of measuring the externa tor (Figure 17) is adopted to assist students’ understanding of the steady-state equivalent circuit and relevan
l characteristics of a synchronous genera
t theories of synchronous machines developed via space vectors. Such an experiment is suitable for students to experience how to build and control rotor field Br, how to connect three stator windings to output three-phase power to a load, and how to control real and reactive power generation (10) [16]. They can see rotor induced voltage (7), Ema,Br, by performing generator open circuit test. They can apply resistive, reactive and capacitive loads to the generator and measure its external characteristics to help them more clearly comprehending the equivalent circuit of Figure 16 developed according to the space vector concepts.
Figure 17. Test circuits for measurement of AC synchronous machine characteristics
10. APP
computer IT tools have been used esign, simulation and result analysis.
The use
digital comput
LICATION OF COMPUTER IT TOOLS
In the restructured laboratory, various modern significantly for measurement, control, data acquisition, d
of MATLAB® Simulink and dSPACE has made it practical for students to build various experiments associated with open or close loop controls of power electronic converters or electric machines. The real time control or measurement systems built upon Simulink give students clear block diagram presentations to effectively understand the functionalities of various hardware parts. The comparison between Simulink simulation and real-time measurement, such as Figures 9 and 14, has well re-emphasized students’ understanding of theories [17, 18].
Significant computer data acquisition techniques have been used in the laboratory. These
include 1) getting measured data or waveforms from the TDS2014 oscilloscope to a er by using the OpenChoice software (Figure 9 d), and 2) getting data through a
completely computer data acquisition system by using dSPACE and corresponding hardware DS1104 (Figures 12 and 14). The computer data acquisition and measurement systems have greatly improved the ways of teaching and learning. Rather than focusing on tedious and/or time
Proceedings of the 2005 American Society for Engineering Education Annual Conference & Exposition Copyright © 2005, American Society for Engineering Education
Page 10.861.14

consuming methods of gathering data, students can obtain measured results much faster and more efficiently. Results can be obtained by capturing the screen and/or by saving to data files for future analysis. This not only makes it possible to have much more contents in an experiment but also makes students more focused on results, concepts, relation to theories, and/or design aspects of an experiment, providing an improved and favorable methodology for quality education.
The mathematical IT tools such as Mathcad [19, 20] makes it possible for quick design of
a contr r in a laboratory environment. The designed controller parameters can then be applied to both
recording, certain automa c theoretical calculations, and result analysis. This has greatly saved the time of an experim
olle simulation and real-time system to examine the dynamic performance of an electric drive
system. In this way, the performance and theory of the integrated system of Figure 1 as well as how to implement the close-loop control can be more effectively understood.
For most experiments, spreadsheet tables have been used for data tient and made students more focused on other aspects of measurement and analysis.
Figure 18 shows an example of spreadsheet tables designed for data recording, partial theoretical calculations, and result analysis for an experiment to decide DC machine parameters such as damping ratio constant, B, and a constant friction torque, Tfriction as shown by the torque equations in Table 2. According to Table 2, B and Tfriction can be obtained by running the DC motor at no-load and by measuring the torque/speed characteristics of (11). The equation implies that the slope m should be the damping ratio constant, B, and the intercept n should be the constant friction torque, Tfriction.
em LT T B T B T m nfriction frictionω ω ω= + + = + = + (11)
Figure 18. A spreadsheet table for an experiment to determine DC machine parameters
For ue, Tem
calculated automatically. The formula used for D6, for instance, is
=IF(OR(C$4="",C6=""),"",C6*C$4) (12)
example, for each measurement of motor current and speed, the torq , is
Proceedings of the 2005 American Society for Engineering Education Annual Conference & Exposition Copyright © 2005, American Society for Engineering Education
Page 10.861.15

According to (12), the torque is shown only after results in cells C4, machine constant linked to the result from another spreadsheet table, and C6, motor current, are provided. After all the measuremen one can very easily draw then be obtaine
based upon the data obtained from the experiment of Figure 12. By using spreadsheet tables, it is very easy for students to record data, draw plots, analyze
elopment and restructuring based upon an integrative teaching approach for the course of Electric Machines/Energy Conversion at Texas A&M
paper presents the laboratory development by using modern computer software and hardware information technology (IT) tools, by introducing DSP and digital
esentation have been used to assist students to quickly understand basic concepts and operations of an experiment before starting
mber: 0311145.
ts are made for the values of the motor voltage shown in cell A6 to A14, the torque/speed characteristics in Excel (Figure 17). A trendline can
d by using the Add Trendline function in Microsoft Excel. Then, the slope m and the intercept n can be got and recorded in cells A18 and B18, and B and Tfriction will be calculated automatically by Excel based upon m and n.
The spreadsheet tables have been also used for many other data recording, calculation
and analysis such as the determination of DC machine dynamic parameters of armature winding inductance, La, and the moment of inertia, J,
results, and find trendlines for machine characteristic curves. It is worth to point out that the trendlines determined in this way give students better visions on the corresponding objectives than using a prewritten MATLAB® program [18]. This could result in higher quality educational goals from the hands-on experimentation.
11. CONCLUSIONS
The paper presents a laboratory dev
University - Kingsville. This
control technology, and by restructuring a traditional energy conversion laboratory at TAMUK. The paper demonstrates laboratory experiments developed for both dynamic control of electric drives and traditional steady-state measurements of transformers and electric machines, making students to be able to gain hands-on experience for both dynamic control and traditional steady-state operations of electric machines. It illustrates how MATLAB® Simulink and dSPACE are used in the laboratory experiments and how to let students quickly familiar with integrated electric drive laboratory systems, Simulink, and dSPACE.
The paper presents typical experiments designed for students to do simulation using
Simulink and actual measurement using dSPACE, and to compare simulation with measurement. For many lab experiments, highly animated Microsoft PowerPoint pr
it. The paper shows that various computer IT tools such as MATLAB®, MATLAB® Simulink, dSPACE ControlDesk, OpenChoice, Mathcad and Microsoft Excel software are effective and efficient for the students to do control, measurement, data acquisition, design, and result analysis in the newly developed and restructured laboratory at TAMUK.
12. ACKNOWLEDGEMENT
This work is supported by National Science Foundation USA, Award Nu
13. REFERENCES
Proceedings of the 2005 American Society for Engineering Education Annual Conference & Exposition Copyright © 2005, American Society for Engineering Education
Page 10.861.16
[1] http://www.engineer.tamuk.edu/departments/eecs/Faculty/Li/eeen4421/eeen4421.html. [2] Stephen J. Chapman, “Electric Machinery Fundamentals,” WCB/McGraw-Hill, 1999.
An Integrative Approach,” ISBN 0-99715292-1-3, MNPERE, 2003. “Restructuring Energy Conversion Course Using An Integrative Approach and
Computer Assisted Teaching Approaches,” in the Proceedings of 2004 ASEE Annual Conference, Salt Lake
omputer Engineering,
[3] Ned Mohan, “Electric Drives –4] Shuhui Li and Rajab Challoo, [
City, USA, June 20 – 23, 2004. [5] “DSP Based Electric Drives Laboratory User Manual,” Department of Electrical and C
University of Minnesota, 2003. [6] Shuhui Li, “Lab Manual for Electric Drives Lab,” available from
http://www.engineer.tamuk.edu/departments/eecs/Faculty/Li/EEEN3212/eeen3212.html, last date that the sitewas viewed is December 1, 2004
.
[8] N Drives,” ISBN 0-9715292-2-1, Minnesota Power Electronics Research &
[9] B
, Inc.,
[12] tric Motor Drives - Modeling, Analysis, and Control,” Prentice Hall, 2001.
Digital Measurement and Analysis Laboratory in Circuits and
– 23, 2004.
duction to Electrical Machines and Transformers,”
[17] JULINK,” ISBN: 0-
ftware in
[21] crosoft Corporation, Redmond, WA, Version 9.0, 1999.
SHUHCheng ina in 1983 and 1988 respectively and Ph.D. degree in Electrical Engineering in 1999 from Texas Tech
otong University, here his research interests were in the areas of modeling and simulation of large dynamic systems, dynamic
[7] “DS1104 R&D Controller Board Features (Release 4.0),” dSPACE Incorporation, German, August 2003. . Mohan, “Power Electronics andEducation, 2003. . S. Guru and H. R. Hiziroglu, “Electric Machinery and Transformer,” HBJ, 1988. . B. Carlson, “Circuits”, Brooks/Cole[10] A , 2000.
[11] John J. D’Azzo and Constantine H. Houpis, “Linear Control System Analysis and Design,” McGraw-Hill1995.
R. Krishnan, “Elec[13] Allan R. Hambley, “Electronics,” Prentice Hall, 1999. [14] Shuhui Li and Abrar A. Khan, “Developing
Electronics Lab at TAMUK,” in the Proceedings of 2004 ASEE Annual Conference, Salt Lake City, USA, June 20
[15] D.W. Novotny and T.A. Lipo, “Vector Control of AC Drives,” Clarendon Press, 1997. [16] George McPherson and Robert D. Laramore, “An Intro
John Wiley & Sons, 1990. .J. Cathey, “Electric Machines: Analysis and Design Applying MATLAB®,” McGraw-Hill, 2000.
[18] Chee-Mun Ong, “Dynamic Simulations of Electric Machinery: Using MATLAB® /SIM13-723785-5, Prentice Hall, 1998.
[19] “Mathcad 11 User Guide,” Mathsoft Engineering & Education, Inc., Cambridge, MA, 2002. [20] G.G. Karady and K.A. Nigim, “Improve learning efficiency by using general purpose mathematics so
power engineering,” IEEE Transactions on Power Systems, Volume Aug. 2003, Page: 18, Issue: 3, (s): 979-985.
“Microsoft Excel User’s Guide,” Mi
UI LI received his B.S. and M.S. degrees in Electrical Engineering from Southwest Jiaotong University in du, Ch
University. From 1988 to 1995, he was with the School of Electrical Engineering at Southwest Jiawprocess simulation of electrified railways, power electronics, power systems, and power system harmonics. From 1995 to 1999, he involved into the research areas of renewable energies, neural networks, and applications of massively parallel processing. He joined the Department of Electrical Engineering and Computer Science at Texas A&M University - Kingsville (TAMUK) in 1999. He is currently an associate professor at TAMUK. He is a member of IEEE and ASEE.
Proceedings of the 2005 American Society for Engineering Education Annual Conference & Exposition Copyright © 2005, American Society for Engineering Education
Page 10.861.17