Embed Size (px)
Citation preview
Labour force status and workplace provisions: Examining the relationship between work and parental involvement
in couple families1
Edith Gray*
Negotiating the Life Course Discussion Paper Series Discussion Paper DP-005
2000
* Demography Program, Research School of Social Sciences, Australian National University
1 This paper was original presented at the Population Association of America Conference 2000 held in Los Angeles
Page 1
Introduction Research into parental involvement spans many disciplines including sociology and
developmental psychology. Within sociological research, it is often considered together
with the division of household labour for men and women (see Oakley, 1974; Baxter,
1998). Following changes in women’s labour force participation trends, which have
shown increases in women’s paid labour involvement since WWII (among others see,
Young, 1990), researchers anticipated an increase in men’s involvement in domestic
labour. Some researchers have indeed found changes (see for example, Bittman, 1995;
Gershuny and Robinson, 1988; Presser, 1995), but the transfer is not as great as expected,
considering the extensive changes in women’s labour force participation (Hochschild,
1989).
Much of the research into the division of household labour examines the relationship
between paid work and household labour (Baxter, 1998). Corresponding research
interests include demographic theories highlighting the importance of social policies,
including family friendly work policies on maintaining birth-rates in developed countries
(Hoem, 1990; Chesnais, 1996; McDonald 1997). As involvement in the labour force is
such an integral part of people’s lives, it is important to consider how work and
workplace policies affect people’s behaviour.
Developmental psychologists are also considering the impact of work. Martha
Moorehouse has suggested that many developmental psychologists use a problem-
oriented perspective when considering the impact of mother’s work on child
development. She suggested that the first task in overcoming this outlook is to
‘understand how parents’ (both mothers’ and fathers’) experiences at work transfer to
Page 2
family life in positive as well as negative ways’ (1993:267). Lamb in his overview of
paternal influences on child development, did not mention how father’s involvement in
paid work may influence child development, but discusses the growth of the investigation
of father’s influence (Lamb, 1995). There is a strong recognition that men’s behaviour
does impact on child well-being, and many researchers are currently investigating the
pathways through which men’s involvement works.
Ihinger-Tallman, Pasley and Buehler, created a theoretical model of the paths through
which paternal involvement affects child well-being (1995:58). They hypothesised that
identification with the parental role determines father involvement, which in turn
influences child well-being, and tested this relationship of identity to involvement with a
group of non-resident fathers. The application of father role identities is a useful one for
explaining father involvement, and has also been used by Marsiglio (1995). However,
considering the relationship between work and household labour, it may be useful to see
if people who identify with certain aspects of the parenting role are involved in work
which makes negotiating work and home life easier.
The examination of family-friendly policies which have been used to help people juggle
work and family life tend to emphasise which workplace arrangements make life better
for workers. There have been various suggestions about what types of policies are
appropriate to help people negotiate work and family life. These include the availability
of paid maternal/paternal leave, the ability to hold a work position after maternity
absence, family or carers leave, sick leave, flexible working hours, the ability to work on
a casual or part-time basis, the availability of child-care options, and numerous other
initiatives.
Page 3
In Australia, The Department of Employment, Workplace Relations and Small Business
examined workplace initiatives in Work and Family – State of Play 1998. In asking the
question, ‘What are family-friendly practices?’ the report found that tangible items such
as on-site child care centres, family rooms and brochures about employee assistance
programs are measures. So too are conditions such as paid parental leave, career breaks
and purchased leave schemes. The report says that maternity and paternity leave are
obviously important conditions, but arguably as important, are provisions such as
flexitime, control over start and finish times, and access to regular part-time work
(DEWRSB, 1998, Executive Report). The report found that the most common family-
friendly provision provided by the organisations surveyed was flexible hours, as they are
able to assist many employees and are also cost effective.
This paper examines further the impact of work and workplace experiences on men and
women’s parental involvement. The conditions outlined above will be investigated to see
what impact work has on parental involvement. The purpose is to examine whether
identity is related to the type of work the respondent is involved in, and the types of
workplace arrangements that the respondent received, and whether these in turn affect
parental involvement for men and for women.
Theoretical perspective The paper examines whether a person’s identification as a parent impacts on the types of
work that they are involved in, and whether they receive certain benefits. In the way
Ihinger-Tallman, Pasley and Beuhler conceptualised a relationship between identity and
father involvement, it is hypothesised that people who identify with the parental role are
likely to choose work which is conducive to the negotiation of work and family time.
Page 4
While there is a difficulty with the causality of this argument, that is, that people who
have flexible workplace are likely to identify with their parental roles more, it is
worthwhile determining whether there is in fact a relationship between them. The
question then remains, what is the relationship between work and workplace experiences
and parental involvement. As Moorehouse suggested, it is important to look at family
behaviour as a function of workplace experience (1993: 267). This paper looks at those
relationships with regard to parental involvement, and background variables are also
considered.
Data and methodology The data used in this study were obtained from the first wave of a longitudinal study, and
a sub-sample of this study who were re-surveyed. The longitudinal survey is an Australia
wide national random sample obtained by a randomised phone method. The survey is
called Negotiating the Life Course (NLC). Only one eligible respondent per household
was interviewed, the person being randomly selected from the household. It was
conducted in November 1996 and March-April 1997. Information on areas such as
demographic characteristics, relationships, children, work experiences, and attitudes, was
collected from 2,231 respondents, 1247 women and 984 men, ranging in age from 18-54.
The sub-sample survey is titled the Parenting Survey 1999, and respondents were
surveyed by mail questionnaire. Questions related to parental identity, workplace
experiences, childcare, child-rearing and parenting styles were asked. Information was
gathered from 501 respondents, a response rate of 65 per cent. A statistical comparison of
background variables concluded that those who returned the survey were more likely to
have completed high school education and to be currently employed, but there was no
Page 5

statistically significant difference by sex, age, marital status, or number of children aged
under 12 years.
Measures Identity indicators. Parents were asked a series of questions related to how they identify
as parents. The scale is titled ‘Self-Perceptions of the Parental Role Scale’ (SPPR), and
was developed by MacPhee, Benson and Bullock. A report on the scales development
and psychometric measures is described in a conference paper presented at the
International Conference on Infant Studies in Los Angeles, 1986 (MacPhee, Benson and
Bullock, 1986). Use of the SPPR is to examine how parents feel they perform on four
dimensions of the parental role. The roles are satisfaction, competence, investment and
integration.
There were twenty-two questions which were reduced to the fewer four scales. The scales
were then changes to scores out of ten, with a score of zero representing the lowest score,
and a score of ten representing the highest score. The satisfaction scale measured whether
respondents where satisfied as opposed to resentful or regretful with their parenting role
and the competence scale indicated competence, or confidence in the parenting role
(McPhee, Fritz & Miller-Heyl, 1996). Investment indicates the importance of the parental
role and integration measures the integration of parent, spouse, career and friend roles
(McPhee, Benson & Bullock, 1986).
Work and workplace provision indicators. Parents were asked a series of questions
related to their involvement at work. Standard questions such as whether they were
involved in work last week, what type of job they hold, how many people do the same
kind of work as them, and how many hours they work, were asked. These same questions
Page 6
were asked about their partner’s current work status. Respondents were also asked
whether they were happy with the number of hours they work, and whether they received
a selection of workplace benefits, or had particular workplace arrangements at their place
of work. Workplace benefits include whether they have access to paid sick leave, family
or carers leave, paid paternity/maternity leave, paid holiday or recreation leave, and for
how many days or weeks per year. Workplace arrangements include options like job
sharing, working flexible hours, working from home, or working part-time. Information
on whether people are happy with items such as working overtime, working at night,
travelling away were also collected.
Three standard questions of work involvement are used in this paper. They are whether
the respondent was employed in the previous week, whether both partners work in the
household, and how many hours the respondent usually works.
Three indicators representing workplace benefits, workplace arrangements, and whether
the respondent is happy with their work arrangements are examined. Access to workplace
benefits such as sick leave, paid carers leave, were combined in a variable which scores
the number of benefits the respondent receives. Similarly, a variable representing high or
low eligibility to workplace arrangements was created, with two categories – one with
access to less than three types of workplace arrangements, and one with access to three or
more of arrangements. Finally, respondents were asked whether they were happy with
arrangements such as working broken shifts, working overtime, and travelling away for
work, which were coded into not completely happy with these arrangements, or
completely happy with these arrangements.
Page 7
Parental involvement indicators. The measurement of parental involvement includes
indicators of who does more of certain tasks related to child maintenance, and an analysis
of types of parenting styles.
A series of questions were asked about tasks which related to child maintenance. These
included questions like who gets the child up in the morning, reads to the child, plays
with the child, washes the child’s clothes etc. These questions were asked of parents with
children who were not of school age, and also of parents whose children who were
attending school, but were under age 12.
Factor analysis was then used to reduce the number of responses related to child tasks.
Three factors held up in the questions asked about children under age 5, and two factors
were found in the questions related to children over age 5. The factors represented
different dimensions of child maintenance activities. The factors were scored out of ten,
with a higher score meaning the respondent did more of this type of child maintenance
work.
To measure parenting styles, a 29-item scale based on the work of Baumrind was used.
Respondents were asked the amount they engaged in a particular behaviour, and also the
amount their partner did. In order to analyse the data that was provided through this
number of questions, factor analysis was used to reduce the 29 items to fewer ‘factor
scales’. Four important factors were found in the data. The factors have been called the
‘warmth and understanding scale’, the ‘disciplinary scale’, the ‘boundary setting scale’
and the ‘democratic participation scale’. The disciplinary scale is a measure of
authoritarian parenting style, whilst the other three are dimensions of authoritative
parenting style.
Page 8

Background indicators. A large number of questions were asked to determine
respondents’ sociodemographic background. Responses used in this analysis include sex
of the respondent, age, marital status, highest education level achieved, age of youngest
child, number of children, and country of birth. A bivariate analysis of background
variables and their relationship with identity, work and parental involvement indicators
are presented at Table 1a, Table 1b and Table 1c.
Results
Background analysis
Firstly, Table 1(a, b & c) outlines the relationship of background variables to the three
areas of investigation. In examining, the relationship between background variables and
identity indicators (Table 1a), the most consistent relationship is by gender and marital
status of the respondent. There was also some difference by education, but little by other
explanatory variables. Men and women felt around the same levels of confidence with
their parenting, but women were much more likely to be satisfied, to invest, and to
integrate other components of their life into their parenting roles.
Page 9

Table 1a: Mean (with standard deviation) identity scores by background variables.
Background Competence Satisfaction Investment Integration
Characteristics Mean (SD) Mean (SD) Mean (SD) Mean (SD)
Sex
Male 7.02 (1.84) 8.34 (1.65) 3.25 (2.01) 6.63 (1.92)
Female 7.05 (1.89) 8.53 (1.65) 4.77 (2.24) 6.94 (1.80)
Age group
Under 30 7.00 (1.73) 8.53 (1.57) 4.50 (2.63) 6.90 (1.97)
30-34 6.98 (1.83) 8.47 (1.48) 4.48 (2.15) 6.72 (1.68)
35-39 7.09 (1.78) 8.50 (1.67) 3.97 (2.19) 6.77 (1.88)
40-44 7.00 (2.01) 8.49 (1.66) 4.10 (2.31) 6.87 (1.92)
45+ 7.17 (2.14) 8.01 (2.13) 3.06 (1.93) 6.92 (2.02)
Marital Status
Living together 6.28 (2.02) 7.87 (2.50) 3.84 (1.99) 6.54 (2.30)
Married 7.10 (1.84) 8.50 (1.56) 4.14 (2.29) 6.83 (1.82)
Born in Australia?
Yes 6.99 (1.86) 8.44 (1.67) 4.11 (2.27) 6.74 (1.86)
No 7.26 (1.87) 8.49 (1.55) 4.16 (2.30) 7.12 (1.82)
Highest Education
Incomplete Yr 12 7.03 (1.95) 8.39 (1.65) 3.87 (2.19) 6.87 (1.83)
Complete Yr 12 6.98 (1.77) 8.45 (1.71) 4.34 (2.31) 6.80 (1.84)
Other/higher 7.22 (1.96) 8.60 (1.47) 4.08 (2.31) 6.68 (1.98)
Age youngest child
0 6.97 (1.66) 8.86 (1.08) 4.55 (2.23) 6.70 (1.59)
1-4 6.99 (1.91) 8.47 (1.58) 4.42 (2.29) 6.65 (1.90)
5-12 7.01 (1.86) 8.30 (1.80) 3.69 (2.19) 6.97 (1.84)
Source: Parenting Survey 1999
Looking at the relationship between background variables and standard work variables
(Table 1b), the sex or the respondent was again important, as was age and education
level. Related to the age variable is the age of youngest child where there were also
significant differences by age of youngest child and work involvement.
Page 10
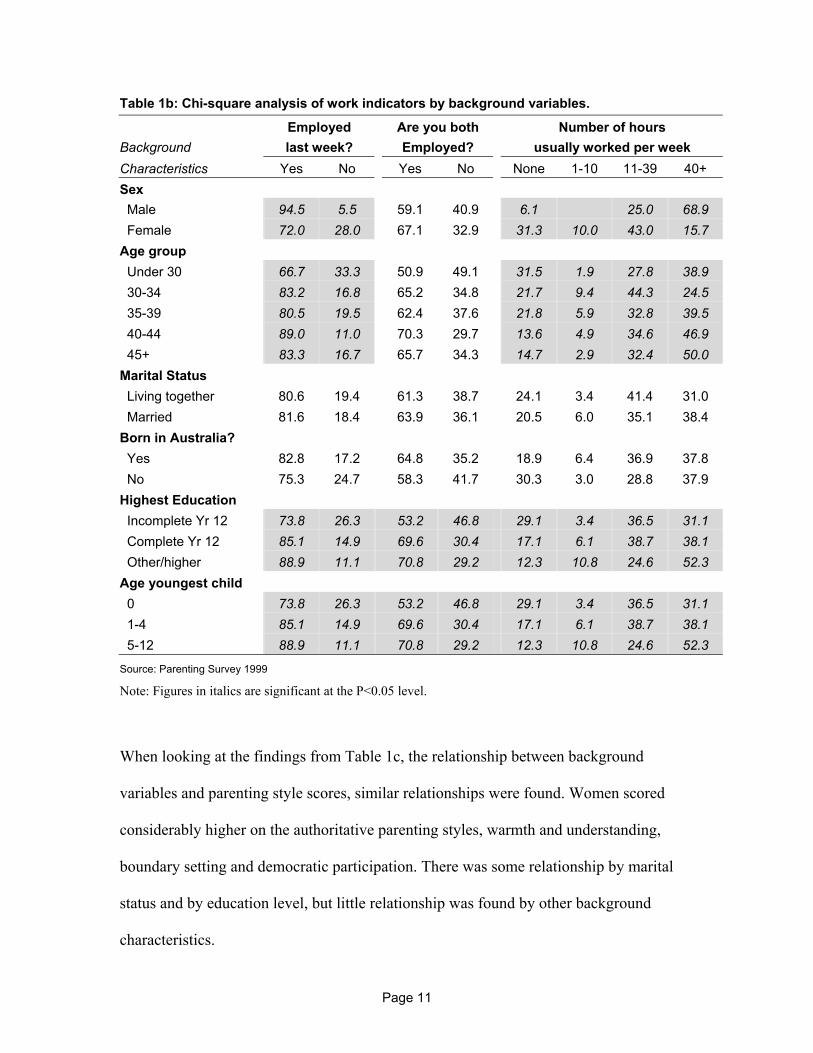
Table 1b: Chi-square analysis of work indicators by background variables.
Employed Are you both Number of hours Background last week? Employed? usually worked per week Characteristics Yes No Yes No None 1-10 11-39 40+ Sex Male 94.5 5.5 59.1 40.9 6.1 25.0 68.9 Female 72.0 28.0 67.1 32.9 31.3 10.0 43.0 15.7 Age group Under 30 66.7 33.3 50.9 49.1 31.5 1.9 27.8 38.9 30-34 83.2 16.8 65.2 34.8 21.7 9.4 44.3 24.5 35-39 80.5 19.5 62.4 37.6 21.8 5.9 32.8 39.5 40-44 89.0 11.0 70.3 29.7 13.6 4.9 34.6 46.9 45+ 83.3 16.7 65.7 34.3 14.7 2.9 32.4 50.0 Marital Status Living together 80.6 19.4 61.3 38.7 24.1 3.4 41.4 31.0 Married 81.6 18.4 63.9 36.1 20.5 6.0 35.1 38.4 Born in Australia? Yes 82.8 17.2 64.8 35.2 18.9 6.4 36.9 37.8 No 75.3 24.7 58.3 41.7 30.3 3.0 28.8 37.9 Highest Education Incomplete Yr 12 73.8 26.3 53.2 46.8 29.1 3.4 36.5 31.1 Complete Yr 12 85.1 14.9 69.6 30.4 17.1 6.1 38.7 38.1 Other/higher 88.9 11.1 70.8 29.2 12.3 10.8 24.6 52.3 Age youngest child 0 73.8 26.3 53.2 46.8 29.1 3.4 36.5 31.1 1-4 85.1 14.9 69.6 30.4 17.1 6.1 38.7 38.1 5-12 88.9 11.1 70.8 29.2 12.3 10.8 24.6 52.3
Source: Parenting Survey 1999
Note: Figures in italics are significant at the P<0.05 level.
When looking at the findings from Table 1c, the relationship between background
variables and parenting style scores, similar relationships were found. Women scored
considerably higher on the authoritative parenting styles, warmth and understanding,
boundary setting and democratic participation. There was some relationship by marital
status and by education level, but little relationship was found by other background
characteristics.
Page 11
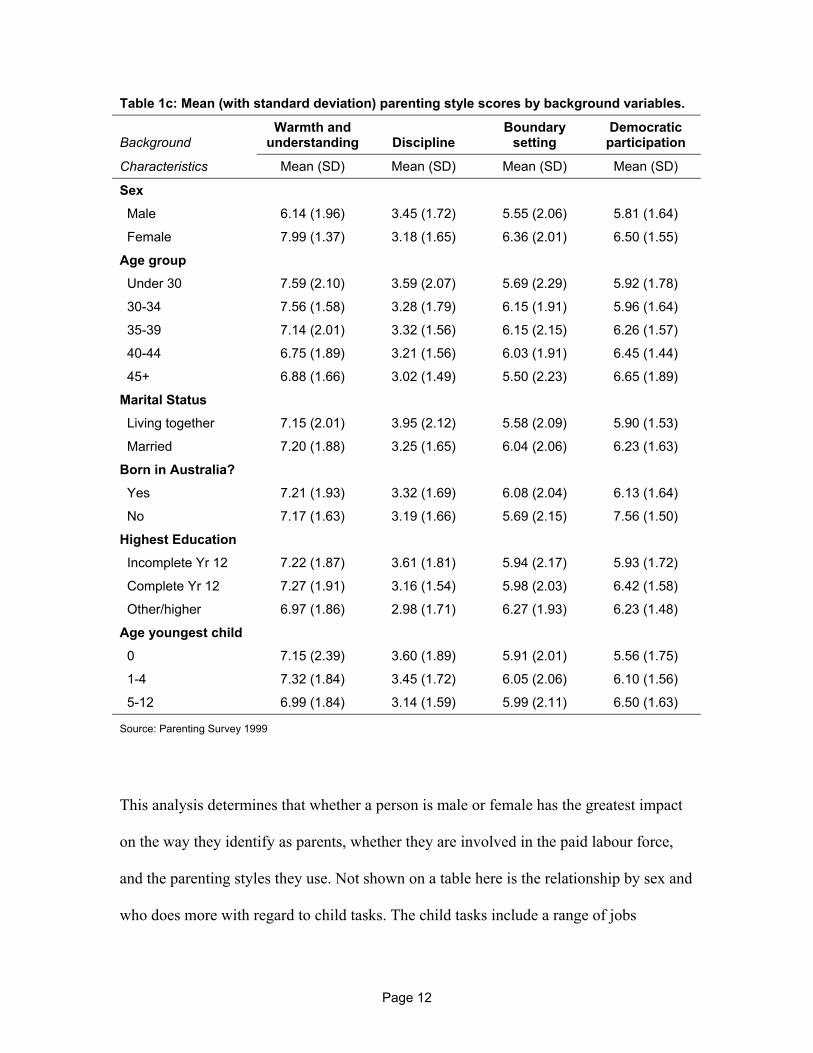
Table 1c: Mean (with standard deviation) parenting style scores by background variables.
Background
Warmth and understanding
Discipline
Boundary setting
Democratic participation
Characteristics Mean (SD) Mean (SD) Mean (SD) Mean (SD)
Sex
Male 6.14 (1.96) 3.45 (1.72) 5.55 (2.06) 5.81 (1.64)
Female 7.99 (1.37) 3.18 (1.65) 6.36 (2.01) 6.50 (1.55)
Age group
Under 30 7.59 (2.10) 3.59 (2.07) 5.69 (2.29) 5.92 (1.78)
30-34 7.56 (1.58) 3.28 (1.79) 6.15 (1.91) 5.96 (1.64)
35-39 7.14 (2.01) 3.32 (1.56) 6.15 (2.15) 6.26 (1.57)
40-44 6.75 (1.89) 3.21 (1.56) 6.03 (1.91) 6.45 (1.44)
45+ 6.88 (1.66) 3.02 (1.49) 5.50 (2.23) 6.65 (1.89)
Marital Status
Living together 7.15 (2.01) 3.95 (2.12) 5.58 (2.09) 5.90 (1.53)
Married 7.20 (1.88) 3.25 (1.65) 6.04 (2.06) 6.23 (1.63)
Born in Australia?
Yes 7.21 (1.93) 3.32 (1.69) 6.08 (2.04) 6.13 (1.64)
No 7.17 (1.63) 3.19 (1.66) 5.69 (2.15) 7.56 (1.50)
Highest Education
Incomplete Yr 12 7.22 (1.87) 3.61 (1.81) 5.94 (2.17) 5.93 (1.72)
Complete Yr 12 7.27 (1.91) 3.16 (1.54) 5.98 (2.03) 6.42 (1.58)
Other/higher 6.97 (1.86) 2.98 (1.71) 6.27 (1.93) 6.23 (1.48)
Age youngest child
0 7.15 (2.39) 3.60 (1.89) 5.91 (2.01) 5.56 (1.75)
1-4 7.32 (1.84) 3.45 (1.72) 6.05 (2.06) 6.10 (1.56)
5-12 6.99 (1.84) 3.14 (1.59) 5.99 (2.11) 6.50 (1.63)
Source: Parenting Survey 1999
This analysis determines that whether a person is male or female has the greatest impact
on the way they identify as parents, whether they are involved in the paid labour force,
and the parenting styles they use. Not shown on a table here is the relationship by sex and
who does more with regard to child tasks. The child tasks include a range of jobs
Page 12
including washing the child’s clothes, reading to the child, feeding the child, getting the
child to bed, dressing the child etc, and different questions were asked depending on the
age of the child. The findings show that women are more involved in every type of child
maintenance task, and the one area that sees men more involved than other areas is
playing with the child. This relationship between men being involved in play activities,
whilst women are involved in caring and nurturing activities has been noted by other
researchers (see Lamb, 1995:150).
Given that gender is inextricably linked with a person’s involvement in the paid labour
force, an examination of workplace provision indicators with gender was made (Table 2).
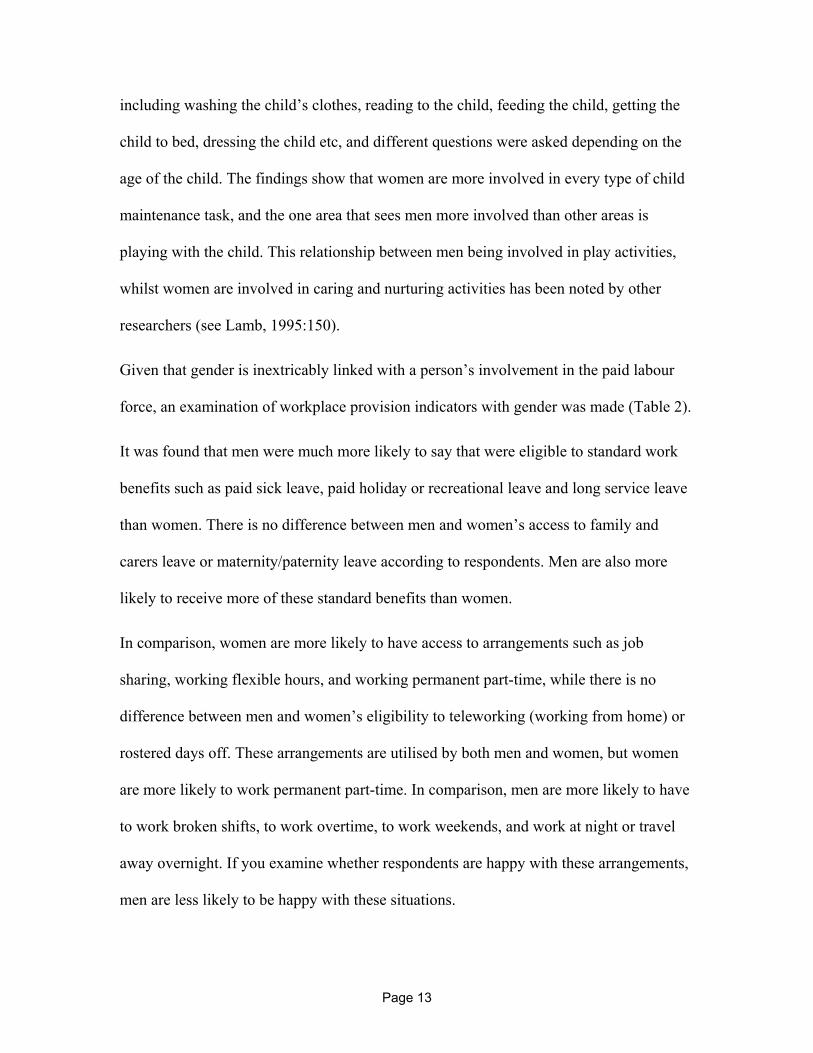
It was found that men were much more likely to say that were eligible to standard work
benefits such as paid sick leave, paid holiday or recreational leave and long service leave
than women. There is no difference between men and women’s access to family and
carers leave or maternity/paternity leave according to respondents. Men are also more
likely to receive more of these standard benefits than women.
In comparison, women are more likely to have access to arrangements such as job
sharing, working flexible hours, and working permanent part-time, while there is no
difference between men and women’s eligibility to teleworking (working from home) or
rostered days off. These arrangements are utilised by both men and women, but women
are more likely to work permanent part-time. In comparison, men are more likely to have
to work broken shifts, to work overtime, to work weekends, and work at night or travel
away overnight. If you examine whether respondents are happy with these arrangements,
men are less likely to be happy with these situations.
Page 13
Table 2: Chi-square analysis of selected work benefits and arrangements by gender.
Work Men Women characteristic Yes % No % Yes % No % Standard work benefits Paid sick leave* 84.3 15.7 59.4 40.6 Paid holiday/rec leave* 84.3 15.7 59.2 40.8 Long service leave* 85.8 14.2 58.6 41.4 Paid mat/paternity leave 38.8 61.2 34.8 65.2 Family or carers leave 50.0 50.0 45.7 54.3 Workplace arrangements Job sharing* 18.9 81.1 39.0 61.0 Flexible working hours** 42.4 57.6 54.5 45.5 Teleworking 18.4 81.6 15.5 84.5 Permanent part-time* 30.1 69.9 58.6 41.4 Rostered days off 24.8 75.2 23.2 76.8 Work requirements Work shifts/irregular hours* 57.1 42.9 37.1 62.9 Work overtime/long hours* 79.1 20.9 46.3 53.7 Work weekends** 68.2 31.8 54.5 45.5 Work nights** 53.2 46.8 36.4 63.6 Take work home 53.5 46.5 45.1 54.9 Travel away overnight* 39.3 60.7 18.4 81.6 “Are you happy with…?” working shifts/irregular hours 84.7 15.3 90.8 9.2 working overtime/long hours** 74.4 25.6 84.0 16.0 working weekends 74.8 25.2 81.5 18.5 working nights** 79.2 20.8 87.6 12.4 taking work home 80.0 20.0 85.6 14.4 travelling away overnight** 84.6 15.4 95.5 4.5
Source: Parenting Survey 1999
Notes: ** significant at the P<0.05 level, * significant at the P<0.0001 level.
So what we have is women having access to work situations which are conducive to
juggling work and family life, while men have access to standard benefits, but are
required to work in less flexible arrangements. This is a situation that they are not
necessarily happy about.
Page 14

Examining work and parental identity
Whilst parental role identification may impact on parental involvement, little relationship
was found between identity and work. It was hypothesised that respondent’s parental role
identity may influence the type of work they were involved in, or at least be related to
their work experiences. The most consistent relationship is that there is an inverse
relationship for women and men with how they identify as parents as the number of
workplace arrangements that they have. Mean scores for competence, satisfaction,
investment and integration drop for men, but increase for women, if they have less than
three, or 3 or more workplace arrangements. So women who have 3 or more workplace
arrangements such as flexible leave, permanent part-time work etc., feel that they are
more competent, more satisfied, invest more and are better integrated in their parenting
roles. For men, the opposite was found.
However, on the whole, there appears to be little relationship between identity and work.
This questions whether people who identify with the parental role, and who think that
their family life is important, are able to negotiate satisfactory work arrangements. More
research should investigate whether people seek out certain work arrangements based on
their familial requirements.
Work indicators and parental involvement: Child maintenance tasks
As discussed, an examination of child maintenance tasks show a definite division by
gender. This is visible on Table 4 (child under 5), where women’s mean scores are higher
for the caring tasks scale, daily maintenance scale and the scale that represents tasks such
as reading, bathing and playing with the child. Men are likely to score higher on this third
scale. However, there are also differences by work and work provisions.
Page 15
First looking at the three standard work indicators, employment in the previous week,
whether both partners are working, and the number of hours worked, together with scores
on child tasks scale, the results show that for women there is a definite decrease in
responsibility for child maintenance tasks by their involvement with work. For men, if
they have a partner who is working their participation is lowest, but the relationship
between the number of hours worked and involvement is varied and depends on the type
of child activity. For example, men who work 40+ are likely to be more involved in tasks
such as reading to the child or getting the child ready for bed (reading/bathing/playing
scale). But they are less likely to be involved in tasks such as staying home with the child
when sick, or washing the child’s clothes (caring tasks scale).
However, there are other workplace experiences that should be considered. Three
indicators of workplace experience are measured against parental involvement. Firstly the
number of standard benefits the respondent receives, secondly the number of flexible
workplace arrangements they are eligible for, and thirdly, whether they are happy with
their work arrangements.
One consistent finding is related to the number of standard benefits received. Men who
receive more benefits are more likely to be involved in child maintenance tasks, whilst
women who receive less than three benefits are the most likely to do these tasks. This
appears to be due to the type of work they are involved in, with men’s access to work
benefits related to their full-time work status, whilst women’s lack of access related to
their more casual employment. Similarly, men who have access to flexible workplace
arrangements are slightly more likely to be involved in child tasks than men who have
Page 16
fewer arrangements, but for women there is no difference. Men who are not happy with
their work arrangements are less likely to help with child tasks.
This pattern is also found in the relationship between work and child tasks for children
over age five (Table 5).
Work indicators and parental involvement: Parenting styles
Moving to the relationship with parenting styles (Table 6), the results show that men who
worked in the previous week scored on average the lowest scores for the parenting styles
warmth and understanding, and democratic participation. There was little difference for
women by whether they worked or not. Similarly, men who were in couples where both
parents were not working had the lowest scores for warmth and understanding and
democratic participation. Men who worked over 40 hours scored higher for boundary
setting and discipline, than their counterparts who worked fewer hours, while women
who worked longer hours were more likely to score higher for democratic participation.
The pattern of parental involvement by work benefits and arrangements is slightly
different for the parenting styles. Firstly, these work experiences only impact on the
warmth and understanding parenting style. Secondly, men with the greatest access to
work benefits have the lowest scores for warmth and understanding, but men and women
who have flexible work arrangements receive higher scores, as do those who are not
completely happy with their work arrangements.
Page 17
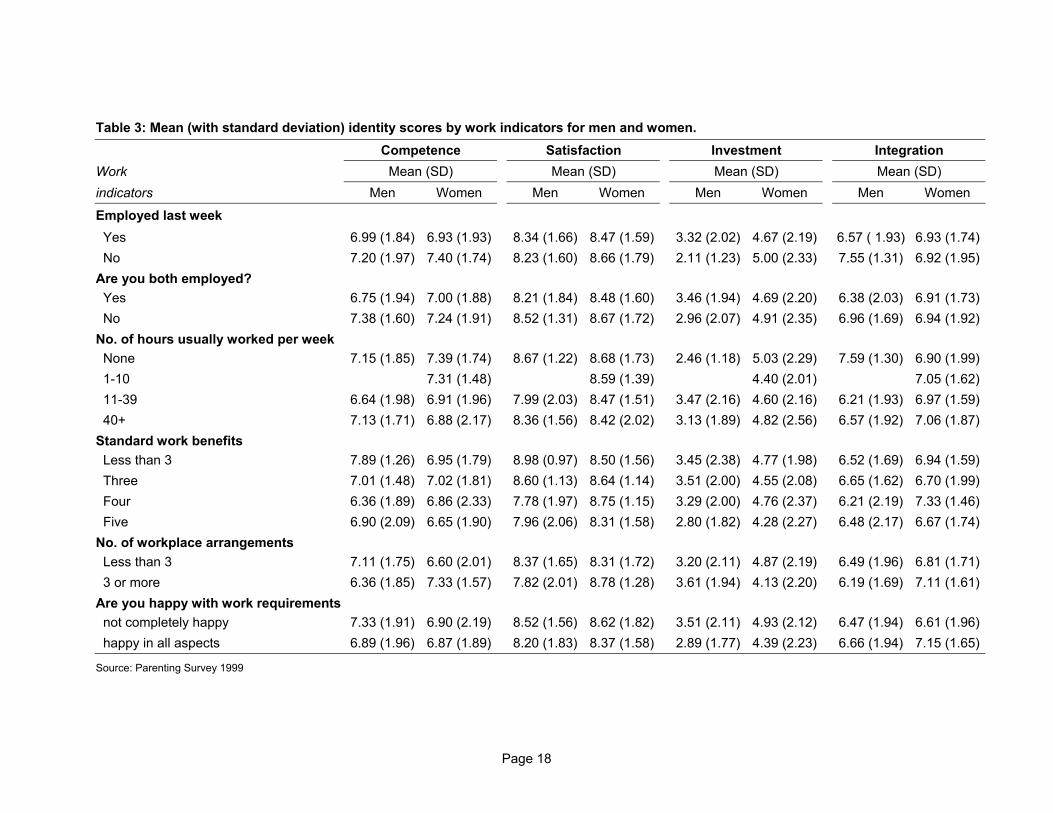
Table 3: Mean (with standard deviation) identity scores by work indicators for men and women. Competence Satisfaction Investment IntegrationWork Mean (SD) Mean (SD) Mean (SD) Mean (SD) indicators Men Women Men Women Men Women Men WomenEmployed last week Yes 6.99 (1.84) 6.93 (1.93) 8.34 (1.66) 8.47 (1.59) 3.32 (2.02) 4.67 (2.19) 6.57 ( 1.93) 6.93 (1.74) No 7.20 (1.97) 7.40 (1.74) 8.23 (1.60) 8.66 (1.79) 2.11 (1.23) 5.00 (2.33) 7.55 (1.31) 6.92 (1.95) Are you both employed?
Yes 6.75 (1.94) 7.00 (1.88) 8.21 (1.84) 8.48 (1.60) 3.46 (1.94) 4.69 (2.20) 6.38 (2.03) 6.91 (1.73) No 7.38 (1.60) 7.24 (1.91) 8.52 (1.31)
8.67 (1.72) 2.96 (2.07)
4.91 (2.35) 6.96 (1.69)
6.94 (1.92)
No. of hours usually worked per week None 7.15 (1.85) 7.39 (1.74) 8.67 (1.22) 8.68 (1.73) 2.46 (1.18) 5.03 (2.29) 7.59 (1.30) 6.90 (1.99) 1-10 7.31 (1.48) 8.59 (1.39) 4.40 (2.01) 7.05 (1.62) 11-39 6.64 (1.98) 6.91 (1.96) 7.99 (2.03) 8.47 (1.51) 3.47 (2.16) 4.60 (2.16) 6.21 (1.93) 6.97 (1.59) 40+ 7.13 (1.71) 6.88 (2.17) 8.36 (1.56) 8.42 (2.02) 3.13 (1.89) 4.82 (2.56) 6.57 (1.92) 7.06 (1.87) Standard work benefits Less than 3 7.89 (1.26) 6.95 (1.79) 8.98 (0.97) 8.50 (1.56) 3.45 (2.38) 4.77 (1.98) 6.52 (1.69) 6.94 (1.59) Three 7.01 (1.48) 7.02 (1.81) 8.60 (1.13) 8.64 (1.14) 3.51 (2.00) 4.55 (2.08) 6.65 (1.62) 6.70 (1.99) Four 6.36 (1.89) 6.86 (2.33) 7.78 (1.97) 8.75 (1.15) 3.29 (2.00) 4.76 (2.37) 6.21 (2.19) 7.33 (1.46) Five 6.90 (2.09) 6.65 (1.90) 7.96 (2.06)
8.31 (1.58) 2.80 (1.82)
4.28 (2.27) 6.48 (2.17)
6.67 (1.74)
No. of workplace arrangements Less than 3 7.11 (1.75) 6.60 (2.01) 8.37 (1.65) 8.31 (1.72) 3.20 (2.11) 4.87 (2.19) 6.49 (1.96) 6.81 (1.71) 3 or more 6.36 (1.85) 7.33 (1.57) 7.82 (2.01) 8.78 (1.28) 3.61 (1.94) 4.13 (2.20) 6.19 (1.69) 7.11 (1.61) Are you happy with work requirements not completely happy 7.33 (1.91) 6.90 (2.19) 8.52 (1.56) 8.62 (1.82) 3.51 (2.11) 4.93 (2.12) 6.47 (1.94) 6.61 (1.96) happy in all aspects 6.89 (1.96) 6.87 (1.89) 8.20 (1.83) 8.37 (1.58) 2.89 (1.77) 4.39 (2.23) 6.66 (1.94) 7.15 (1.65)
Source: Parenting Survey 1999
Page 18

Table 4: Mean (with standard deviation) child task (under 5 years) scores by work indicators for men and women. Caring tasks Daily maintenance Reading/Bathing/Playing Work Mean (SD) Mean (SD) Mean (SD) indicators Men Women Men Women Men WomenEmployed last week Yes 2.05 (1.90) 8.50 (1.69) 3.56 (2.05) 7.40 (1.86) 3.84 (1.80) 6.53 (1.79) No 7.08 (2.50) 9.35 (1.01) 4.69 (0.36) 7.56 (1.51) 4.84 (1.29) 7.15 (1.68) Are you both employed?
Yes 2.36 (1.82) 8.71 (1.44) 3.83 (1.92) 7.49 (1.84) 3.70 (1.73) 6.62 (1.80) No 2.28 (2.62)
8.92 (1.69)
3.40 (2.12)
7.40 (1.61)
4.10 (1.85)
6.94 (1.73) No. of hours usually worked per week
None 5.83 (3.54) 9.28 (1.11) 3.75 (2.12) 7.42 (1.67) 4.00 (2.19) 7.07 (1.71) 1-10 9.25 (0.93) 7.67 (1.82) 7.58 (1.68) 11-39 2.94 (3.04) 8.52 (1.82) 3.75 (2.58) 7.44 (1.83) 3.75 (2.47) 6.41 (1.74) 40+ 1.85 (1.44) 8.47 (1.51) 3.64 (1.90) 7.41 (1.85) 4.10 (1.50) 6.00 (1.55) Standard work benefits Less than 3 1.71 (3.10) 9.02 (1.15) 3.69 (2.21) 7.77 (1.79) 3.44 (3.15) 6.85 (1.70) Three 2.25 (1.36) 8.40 (1.70) 2.96 (2.18) 6.56 (2.23) 4.13 (1.15) 6.67 (1.96) Four 2.34 (1.88) 7.81 (1.93) 3.70 (1.97) 6.88 (2.03) 3.61 (1.91) 6.04 (2.05) Five 2.36 (0.98)
7.92 (2.18)
4.79 (1.88)
7.25 (1.76)
4.03 (1.13)
6.22 (1.85) No. of workplace arrangements
Less than 3 2.14 (1.91) 8.45 (1.79) 3.55 (2.18) 7.24 (1.79) 3.84 (2.01) 6.45 (1.89) 3 or more 2.43 (1.94) 8.31 (1.68) 4.38 (1.37) 7.26 (2.02) 4.17 (1.35) 6.64 (1.74) Are you happy with work requirements not completely happy 1.71 (1.02) 8.36 (1.56) 3.37 (2.02) 7.53 (1.84) 3.70 (1.50) 6.35 (1.94) happy in all aspects 2.32 (2.17) 8.56 (1.54) 3.84 (1.99) 7.30 (1.90) 3.91 (1.73) 6.90 (1.72)
Source: Parenting Survey 1999
Page 19

Table 5: Mean (with standard deviation) child task (over 5 years) scores by work indicators for men and women. Daily maintenance Taking to appointments Work Mean (SD) Mean (SD) indicators Men Women Men WomenEmployed last week Yes 2.63 (1.89) 8.02 (1.60) 4.07 (2.25) 6.93 (2.00) No 5.43 (3.33) 8.98 (0.95) 4.83 (3.25) 7.27 (2.09) Are you both employed?
Yes 2.99 (2.13) 8.16 (1.46) 4.11 (2.47) 7.04 (2.00) No 2.33 (1.77)
8.51 (1.64)
4.09 (1.98)
6.96 (2.10) No. of hours usually worked per week
None 5.14 (3.75) 9.04 (0.92) 4.00 (3.46) 7.30 (2.11) 1-10 8.79 (0.93) 7.55 (1.93) 11-39 3.71 (2.69) 8.12 (1.52) 4.62 (2.69) 7.04 (1.97) 40+ 2.26 (1.39) 7.26 (2.01) 3.93 (1.93) 6.23 (2.01) Standard work benefits Less than 3 2.70 (3.18) 8.63 (1.04) 3.07 (3.32) 7.28 (1.83) Three 2.65 (1.94) 7.89 (1.74) 4.20 (1.72) 6.58 (1.98) Four 2.18 (1.32) 8.10 (1.70) 4.05 (2.06) 6.93 (2.27) Five 2.72 (1.71)
7.30 (1.87)
4.25 (2.22)
6.44 (1.69) No. of workplace arrangements
Less than 3 2.32 (1.74) 7.89 (1.77) 3.81 (2.39) 6.89 (2.00) 3 or more 3.66 (2.57) 8.19 (1.41) 4.56 (1.59) 6.97 (1.84) Are you happy with work requirements not completely happy 2.41 (1.48) 7.05 (2.00) 4.00 (2.17) 6.48 (2.11) happy in all aspects 2.62 (2.03) 8.36 (1.33) 4.02 (2.51) 7.09 (1.92)
Source: Parenting Survey 1999
Page 20

Table 6: Mean (with standard deviation) parenting style scores by work indicators for men and women. Warmth&understanding Disciplinary Boundary setting Democratic participat’n Work Mean (SD) Mean (SD) Mean (SD) Mean (SD) indicators Men Women Men Women Men Women Men WomenEmployed last week Yes 6.10 (2.01) 7.96 (1.30) 3.50 (1.75) 3.14 (1.65) 5.53 (2.01) 6.56 (1.99) 5.80 (1.65) 6.62 (1.55) No 6.72 (0.89) 8.05 (1.30) 2.61 (1.11) 3.26 (1.68) 5.40 (2.63) 5.88 (1.97) 6.20 (1.41) 6.22 (1.55) Are you both employed?
Yes 6.34 (2.08) 7.96 (1.42) 3.43 (1.63) 3.11 (1.68) 5.64 (1.98) 6.54 (2.03) 6.11 (1.58) 6.60 (1.53) No 5.85 (1.77) 8.04 (1.31) 3.49 (1.86)
3.26 (1.63) 5.37 (2.12)
6.12 (1.91) 5.42 (1.65)
6.30 (1.58)
No. of hours usually worked per week None 6.50 (1.22) 7.90 (1.46) 2.28 (1.00) 3.27 (1.64) 5.08 (2.24) 5.85 (2.03) 6.33 (1.45) 6.11 (1.47) 1-10 8.05 (1.31) 3.38 (1.76) 6.82 (1.80) 6.15 (1.58) 11-39 6.22 (1.91) 7.98 (1.36) 3.94 (1.71) 3.22 (1.80) 5.08 (2.28) 6.61 (2.02) 6.17 (1.91) 6.79 (1.61) 40+ 7.13 (2.05) 8.28 (2.26) 3.46 (1.75) 2.85 (1.37) 5.68 (1.88) 6.41 (2.03) 5.68 (1.60) 6.77 (1.44) Standard work benefits Less than 3 6.82 (2.09) 7.88 (1.65) 3.30 (1.47) 3.37 (1.91) 6.03 (2.33) 6.62 (1.88) 6.19 (1.55) 6.39 (1.49) Three 6.63 (1.89) 8.29 (1.12) 3.45 (1.84) 2.82 (1.58) 5.54 (1.40) 6.81 (2.21) 5.64 (1.66) 7.28 (1.37) Four 5.75 (2.03) 8.31 (1.01) 3.26 (1.36) 2.73 (1.20) 5.52 (2.44) 6.62 (1.96) 5.98 (1.85) 6.73 (1.73) Five 5.50 (2.16) 7.94 (1.21) 3.99 (1.31)
3.36 (1.83) 5.19 (2.29)
6.25 (2.18) 5.96 (1.48)
6.76 (1.28)
No. of workplace arrangements Less than 3 6.01 (2.03) 7.90 (1.47) 3.67 (1.78) 3.31 (1.70) 5.57 (2.00) 6.39 (2.04) 5.83 (1.59) 6.45 (1.46) 3 or more 6.39 (2.21) 8.24 (1.07) 3.25 (1.49) 2.92 (1.81) 5.29 (2.55) 6.98 (1.99) 6.25 (1.82) 7.17 (1.46) Are you happy with work requirements not completely happy 6.38 (1.51) 8.31 (1.34) 3.41 (1.63) 2.79 (1.27) 5.92 (1.77) 6.65 (2.00) 5.84 (1.37) 6.76 (1.79) happy in all aspects 5.93 (2.24) 7.78 (1.42) 3.52 (1.79) 3.21 (1.78) 5.19 (2.16) 6.53 (2.00) 5.86 (1.74) 6.68 (1.49)
Source: Parenting Survey 1999
Page 21

Conclusion Although it appeared there was no real relationship between identity and work, these
findings demonstrate the relationships between work involvement and parental
involvement. Clearly men who are the main workers, or work the longest hours have less
time left for particular types of parenting behaviours.
In looking at the picture of work and its impact on parental involvement, it is important to
look at a full range of work responses, as it is not as simple as just allowing flexibility for
working parents.
Researchers should not just look at work and family negotiation, but how different work
experiences impact on what happens at home. We shouldn’t just look at who works, and
what working hours, but realise that the workplace situation is very important. Men who
have least access to good work arrangements, are also least likely to be involved in child
maintenance tasks and use good parenting styles. What we don’t know from this
investigation is the direction of this relationship. Instead we simply know that there is
one. At the outset, I discussed Moorehouse’s criticism of the fact that we don’t look at
how men’s work experience impacts on children, just the so called, detrimental effects of
mother’s employment considered under the social problem perspective. Interestingly, as
I’ve shown, it is women’s experiences in the workplace which are the least volatile when
examining the relationship with parental involvement.
Page 22
References Baxter, J. (1998). ‘Moving Toward Equality? Questions of change and equality in household work patterns’, in eds. Moira Gatens and Alison Mackinnon Gender and Institutions, pp:55-74, Cambridge: Cambridge University Press.
Bittman, M. (1995). ‘Changes at the Heart of Family Households’, Family Matters, 40:10-15.
Chesnais, J-C. (1996). ‘Fertility, Family and Social Policy in Contemporary Western Europe’, Population and Development Review, 22(4):729-739.
DEWRSB. (1998). Work and Family State of Play 1998 – Executive Summary, DEWRSB: http://www.dewsrsb.gov.au/group_wrp/workfamily/state_1998.
Gershuny, J. & Robinson, J. (1988). ‘Historical Changes in the Household Division of Labor’, Demography, 25(4):537-552.
Hochschild, A. (1989). The Second Shift: Working Parents and the Revolution at Home, USA: Penguin.
Hoem, J. (1990). ‘Social Policy and Recent Fertility Change in Sweden’, Population and Development Review, 16(4):735-748.
Ihinger-Tallman, M., Pasley, K. & Buehler, C. (1995). ‘Developing a Middle-Range Theory of Father Involvement Postdivorce’, in ed. William Marsiglio Fatherhood: Contemorary Theory, Research, and Social Policy, pp:57-77, Sage Publications: Thousand Oaks.
Lamb, M. (1995). ‘Paternal influences on child development’ in eds. Mirjam van Dongen, Gerard Frinking and Menno Jacobs Changing Fatherhood: A Multidisciplinary Perspective, pp: 145-157, Thesis Publishers: Amsterdam.
MacPhee, D. Fritz, J. & Miller-Heyl, J. (1996). ‘Ethnic Variations in Personal Social Networks and Parenting’. Child Development 67:3278-3295.
MacPhee, D., Benson, J. & Bullock, D. (1986). ‘Influences on Maternal Self-Perceptions’. Paper presented at the Biennial International Conference on Infant Studies, Los Angeles.
Marsiglio, W. (1995). ‘Stepfathers With Minor Children Living at Home’, in ed. William Marsiglio Fatherhood: Contemorary Theory, Research, and Social Policy, pp:211-229, Sage Publications: Thousand Oaks.
McDonald, P. (1997). ‘Gender Equity, Social Institutions and the Future of Fertility’, Working Papers in Demography, 69, Canberra: ANU.
Moorehouse, M. (1993). ‘Work and Family Dynamics’ in eds. P. Cowan, D. Field, D. Hansen, A. Skolnick and G Swanson Family, Self and Society: Toward a new agenda for Family Research, pp: 145-157, Lawrence Erlbaum Associates: New Jersey.
Oakley, A. (1974). The Sociology of Housework, Britain: Martin Robinson.
Presser, H. (1995). ‘Are the interests of women inherently at odds with the interests of children or the family? A viewpoint.’ in eds. Karen O. Mason and An-Magritt Jensen Gender and Family Change in Industrialized Countries, pp: 297-319, Clarendon Press: Oxford.
Young, C. (1990). ‘The Impact of Demographic change on Australia’s Labour Force with Reference to the Special Role of Women’, Working Papers in Demography, 19, Canberra: ANU.
Page 23


![DECENTWORKCHECK workplace is visited by the labour inspector at least once a year to check compliance of labour laws at my workplace \ ] ¬ ¤ 6 months of illness I …](https://img.pdfslide.net/doc/110x75/5ab34cef7f8b9ac66c8e2fbd/decentworkcheck-workplace-is-visited-by-the-labour-inspector-at-least-once-a-year.jpg)