Embed Size (px)
Citation preview

LABOUR MARKET PROFILE
2016 Kenya
LO/FTF Council, Analytical Unit
Copenhagen, Denmark

Danish Trade Council for International Development and Cooperation
Labour Market Profile 2016
Kenya 2016 Page ii
PREFACEThe LO/FTF Council presents this Labour Market Profile
as a yearly updated report that provides a
comprehensive overview of the labour market's
situation.
The report is divided in eleven thematic sections
including: trade unions, employers’ organizations,
tripartite structures, national labour legislation,
violations of trade union rights, working conditions,
situation of the workforce (with subsections such as
unemployment, sectoral employment, migration,
informal economy, child labour, gender, and youth),
education (with subsection vocational training), social
protection, general economic performance, and trade.
Additionally, Appendix presents new approved labour
market related legislations and status of ratification of
International labour Organization (ILO) Conventions.
Estimations are based on data from international
databanks (e.g. ILO’s Key Indicators of the Labour
Market (KILM) and NATLEX as well as the World Bank’s
World Development Indicators), national statistical
institutions and ministries. Other information is collected
from the International Trade Union Confederation
(ITUC) and U.S. Department of State’s Annual Country
Reports on Human Rights Practices. Facts are also
gathered from media sources (e.g. The Economist, the
British Broadcasting Corporation (BBC), LabourStart,
The Guardian, national news, etc.) along with trade
unions centers, employers’ organizations, NGOs, among
others.
Several indexes such as the Global Rights Index, the
Doing Business Index, the Governance Indicators, and
the Human Development Index are used as proxy
indicators of the labour market’s environment. The
indexes’ methodologies and the data quality can be
followed by the sources websites.
All sources, indicators and/or narrative inputs that are
used are available by links through footnotes.
This report was published in April 2017
ACKNOWLEDGEMENT
The LO/FTF Council is the Danish trade union council for
international development co-operation. It was
established, under a slightly different name, in 1987 by
the two largest Danish confederations: the Danish
Federation of Trade Unions (LO) and the Danish
Confederation of Salaried Employees and Civil
Servants (FTF). The organization activities are related
to: i) to support democratic development of the trade
union movements in Africa, Middle East, Asia and Latin
America; and ii) to contribute to democratic
development in the societies in which the unions operate.
This Labour Market Profile is prepared by the LO/FTF
Council’s Analytical Unit in Copenhagen with support
from our Sub-Region Office in Tanzania as well as the
Kenya’s Central Organisation of Trade Unions (COTU
(K)) in terms of data collection of trade union
membership.
This report and more than thirty other labour market
profiles from other developing countries are available
by our website:
http://www.ulandssekretariatet.dk/content/landeanaly
ser
Should you have questions about the profiles you can
contact Kasper Andersen ([email protected]), Manager of
the Analytical Unit.
Cover photo: Carsten Snejbjerg.

Danish Trade Council for International Development and Cooperation
Labour Market Profile 2016
Kenya 2016 Page iii
EXECUTIVE SUMMARY
enya is ranked as a middle-income country and
characterized as multi-ethnic, multi-cultural and
multi-religious. The country experienced a solid
economic growth during the last decade. The Gross
Domestic Product (GDP) per capita remains lower than
the sub-Saharan Africa average, though.
The economic structural transformation is not happening
in Kenya: Neither the industry and service sector are
increasing; instead the agricultural sector is growing.
Important to realize, the informal employment is on a
rise in the country.
Based on the latest poverty survey from 2005, close to
one out of two (48%) of the population lived below
US$3.1 per day in Kenya. Actually poverty was
increasing while the middle-class decreased. This
reflected a fragmentation between the labour market
and the economic growth. Data point towards that this
trend continued during the last decade. First of all,
wage employment dropping relative to total
employment. Secondly, unemployment rates remain
higher than the East Africa averages, particularly
among youth who often are poorly skilled and
experienced slow absorption into the labour market.
Thirdly, the coverage of social protection schemes is
narrow. Fourthly, a majority of the labour force (83%)
are operating in the informal economy with indecent
and vulnerable working conditions without benefitting
from the official wage regulations and collective
bargaining agreements.
There have been a few new labour related legislations
during the last three years. Notwithstanding, the
Employment Act was amended and the Employment and
Labour Relations Court (previously Industrial Court) is in
the process of decentralizing to county levels. There are
flaws on the labour related legislations in terms of
protecting trade union rights. And the government is
only enforcing the regulations to workers from the
formal sector, which is 17% of the total employment in
Kenya. Not to mention, in practice, workers are
confronting systematic violations of trade union rights.
Wages have been on a rise in nominal terms. However,
increasing cost of living has eroded the purchasing
power of wages. Employers often pay wages below
the approved minimum wage standards which has
compounded the problems that workers are facing.
Wage regulations only cover the slender wage
employment segment.
There are gender gaps on the labour market. Some
examples are that men are dominating the wage
employment; women are most active within service-
producing activities of households as well as community
and social services.
Kenya experienced a change in net migration flows
during the last two decades moving from a positive
value in the 1990s to a negative value in the 2000s,
along with the beginning of the 2010s. This suggests
that the country is now ‘exporting’ workers that are
looking for better job opportunities. Remittances
received in Kenya are still not a central part of the
GDP.
Child labour is relatively low in Kenya. This was an
impact of the free and compulsory primary education
program that triggered a high enrolments in primary
and secondary education levels. Vocational training has
been under-prioritized, though. As already indicated,
the country is struggling to improve the youth
population’s technical skills that could transition into
wage and salaried jobs in the formal sector. On the
positive side, the entrepreneurship movement is
flourishing. Regulations of starting a business have
improved in recent years, but, overall, it is still
somewhat cumbersome doing business in the country.
The trade union movement has experienced a fast
growth in membership in recent years with a relatively
high trade union density of 15% of the total labour
force. This was especially related to a high influx of
organizing workers from the informal economy. Albeit
application of Collective Bargaining Agreement (CBAs)
in Kenya is on a rise, there is an urgent need for more
awareness of basic labour rights as well as enforcement
of labour laws and regulations.
The industrial relations environment is confronting unrests
and delays in negotiation. By the same token, several
central tripartite structures demonstrate shortfalls, e.g.
the wage councils convene in few occasions and there
are disagreements on Industrial Court case procedures.
However, tripartite social dialogues intensified during
2016 which strengthened mutual relationship, e.g.
Central Organisation of Trade Unions (COTU (K)) and
Federation of Kenya Employers (FKE) jointly sought
financial support to undertake a Social Dialogue
Project.
K

Danish Trade Council for International Development and Cooperation
Labour Market Profile 2016
Kenya 2016 Page iv
COUNTRY MAP
Source: Google

Danish Trade Council for International Development and Cooperation
Labour Market Profile 2016
Kenya 2016 Page v
TABLE OF CONTENTS
Preface........................................................................................................................................................................ ii
Executive Summary ................................................................................................................................................... iii
Country Map .............................................................................................................................................................. iv
Trade Unions .............................................................................................................................................................. 1
Employers’ Organisations .......................................................................................................................................... 2
Central Tripartite Structures ......................................................................................................................................... 3
Collective Bargaining Agreements (CBAs) ........................................................................................................................................... 4
National Labour Legislation ........................................................................................................................................ 5
Observations on the labour legislation ................................................................................................................................................ 6
Ratified ILO Conventions ......................................................................................................................................................................... 6
Trade Union Rights Violations .................................................................................................................................... 6
Working Conditions .................................................................................................................................................... 7
Workforce ................................................................................................................................................................... 8
Unemployment ........................................................................................................................................................................................... 9
Sectoral Employment ..............................................................................................................................................................................10
Migration ..................................................................................................................................................................................................12
Informal Economy ....................................................................................................................................................................................13
Child Labour .............................................................................................................................................................................................13
Gender ......................................................................................................................................................................................................14
Youth ..........................................................................................................................................................................................................15
Education .................................................................................................................................................................. 15
Vocational training .................................................................................................................................................................................17
Social Protection ....................................................................................................................................................... 18
General Economic Performance ................................................................................................................................ 19
Trade ........................................................................................................................................................................ 22
Trade Agreements ..................................................................................................................................................................................22
Export Processing Zones (EPZ) ..............................................................................................................................................................23
Appendix: Additional Data ....................................................................................................................................... 25
Registered Trade Union membership in Kenya, 2016....................................................................................................................25
List of approved labour related legislations in Kenya, 2014-2016 ...........................................................................................26
Ratified ILO Conventions in Kenya, 2016 .........................................................................................................................................27
Reference .................................................................................................................................................................. 28

Danish Trade Council for International Development and Cooperation
Labour Market Profile 2016
Kenya 2016 Page vi
Tables Table 1: Status of trade unions in Kenya, 2016 ................................................................................................................................................................ 1 Table 2: Trade Union Centres members and affiliated unions in Kenya, 2016 ........................................................................................................ 1
Table 3: Status of Collective Bargaining Agreements (CBAs) in Kenya ....................................................................................................................... 4
Table 4: Number of approved national labour, social security and human rights related legislations in Kenya ............................................. 6
Table 5: Global Rights Index, Kenya ranking, 2014-2016 ........................................................................................................................................... 6
Table 6: Wages and Earnings in Kenya .............................................................................................................................................................................. 7
Table 7: Working Conditions in Kenya ................................................................................................................................................................................ 8
Table 8: Employment-to-population ratio, 2016, Age and Sex distribution, % ........................................................................................................ 8
Table 9: Inactivity rate in Kenya, 2016, % ........................................................................................................................................................................ 9
Table 10: Unemployment and youth unemployment in Kenya and Eastern Africa, 2016 ...................................................................................... 9
Table 11: Total and wage employment in Kenya 2010-2015 ................................................................................................................................... 10
Table 12: Wage Employment by Industry in Kenya, 2010-2015 .............................................................................................................................. 10
Table 13: Wage Employment by Industry in Kenya, 2014 .......................................................................................................................................... 10 Table 14: GDP share by sector (%) and per worker per year (US$), 2014........................................................................................................... 11
Table 15: Migration Facts ..................................................................................................................................................................................................... 12
Table 16: Total and informal employment in Kenya 2010-2015 .............................................................................................................................. 13
Table 17: Working Children, proportion of all children ages 5-17 ........................................................................................................................... 14
Table 18: Highest level attained and years of schooling in the population ............................................................................................................. 15
Table 19: Vocational Training facts ................................................................................................................................................................................... 17
Table 20: Social protection facts in Kenya, 2010 .......................................................................................................................................................... 18
Table 21: Pension Benefits, Coverage and Contributions in Kenya and sub-Saharan Africa, 2010, % ........................................................... 19
Table 22: Key Facts on General Economic Performance in Kenya, 2015 ................................................................................................................ 19
Table 23: Poverty and middle-class trends in Kenya, 1997-2005 ............................................................................................................................ 20
Table 24: Kenya’s Ease of Doing Business ........................................................................................................................................................................ 21
Table 25: Kenya's Governance Indicators, 2010-2015................................................................................................................................................ 21 Table 26: Trade and Foreign Direct Investment in Kenya, 2015 ................................................................................................................................ 22
Table 27: Registered Trade Union membership in Kenya, 2016 ................................................................................................................................ 25
Table 28: List of approved labour related legislations in Kenya, 2014-2016....................................................................................................... 26
Table 29: Ratified ILO Conventions in Kenya, 2016 ...................................................................................................................................................... 27
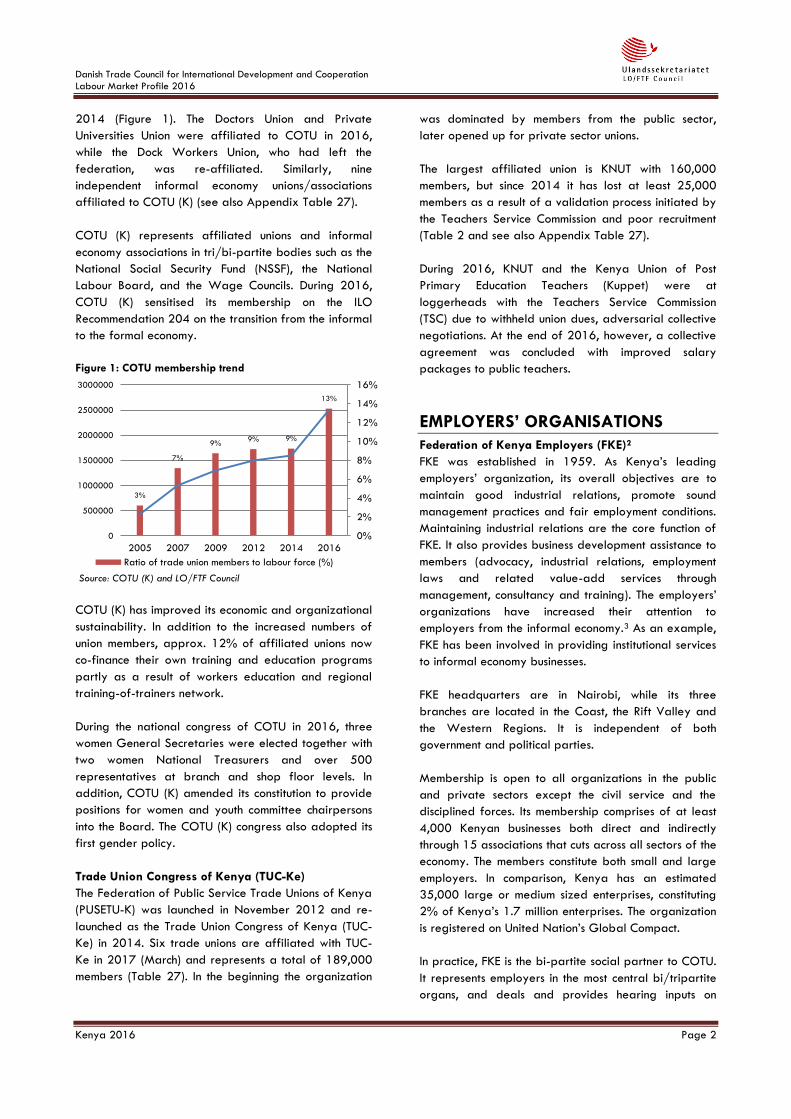
Figures Figure 1: COTU membership trend ....................................................................................................................................................................................... 2
Figure 2: Collective Bargaining Agreement trends in Kenya, 2007-2016 ................................................................................................................. 4
Figure 3: Minimum wage trend in Kenya, 2005-2016 .................................................................................................................................................... 7
Figure 4: Labour force employment rate, 1995-2016, % .............................................................................................................................................. 9
Figure 5: Inactivity rate trend in Kenya, 1995-2016, Sexes, % ................................................................................................................................... 9
Figure 6: Unemployment trend in Kenya and the Eastern Africa (EA) ......................................................................................................................... 9
Figure 7: Employment by sector level in Kenya, 2005 .................................................................................................................................................. 11
Figure 8: Sector Share in Kenya, % of GDP, 1995-2015 ............................................................................................................................................ 12
Figure 9: Labour productivity trend, 2007-2016 ........................................................................................................................................................... 12
Figure 10: Ratio of net migration to total population in Kenya and the sub-Saharan Africa (SSA), 1998-2012 .......................................... 12 Figure 11: Women in management and ownership in Kenya, 2013 .......................................................................................................................... 15
Figure 12: Enrolment in Primary Secondary and Tertiary schools ............................................................................................................................... 16
Figure 13: Pupils in vocational training to all pupils in secondary education, 2000-2009, % ............................................................................ 17
Figure 14: Total health-care expenditure not financed by private household's out-of-pocket payments ........................................................ 19
Figure 15: GDP growth per capita, 2006-2015, Kenya and sub-Saharan Africa, Annual % ............................................................................ 19
Figure 16: GDP per capita in Purchasing Power Parity (US$) and Gini Index, 2005-2015 ............................................................................... 20
Figure 17: Inflation in consumer prices trend .................................................................................................................................................................... 21
Figure 18: Gross Fixed Capital Formation trend ............................................................................................................................................................ 21
Figure 19: Trade and Foreign Direct Investment trends ................................................................................................................................................ 22
Figure 20: Kenya's main export markets, 2015 .............................................................................................................................................................. 22
Figure 21: Kenya’s main products share of exports, 2014 .......................................................................................................................................... 22 Figure 22: Kenya’s performance on EPZ key indicators, 2010-2014 ....................................................................................................................... 24
Figure 23: Average monthly minimum wage and EPZ wage in Kenya, 2010-2014, Schillings........................................................................... 24

Danish Trade Council for International Development and Cooperation
Labour Market Profile 2016
Kenya 2016 Page 1
TRADE UNIONS
The trade union movement in Kenya organizes 2.7
million workers with an estimated trade union density of
15% of the total labour force. This is high in comparison
with the neighbouring East African countries with
organizing rates as low as 2-3%. Based on an
assessment, around one out of four of the employed
workers are a member of a trade union. And close to
one out of two members is a woman (Table 1).
Table 1: Status of trade unions in Kenya, 2016
Number of trade unions 58
Dues 2 % *
Members of trade unions 2,719,848
Trade union members share of labour force 15 % **
Trade union members share of employed workers
26 % ***
Women member share of trade unions on average
49 %
Note: The number of trade union members should be treated with caution because many unions do not regularly update their membership record. * The estimation of dues is based on an average of the Communications Workers Union (CWU) dues as percent of salaries. ** Estimations include members from affiliated organized workers from the informal economy. *** Estimations are excluding affiliated organized workers from the
informal economy.
Source: COTU; LO/FTF Council.
The trade unions in Kenya are sector-based with a few
general unions that cover several industries such as the
Kenya Union of Commercial, Food and Allied Workers
that represents workers in varied sectors like banking,
food, retail, and finance. Civil servants are also active
members of worker organizations and exercise the
freedom of association rights.
In recent years, the labour market in Kenya has been
affected by an increasing outsourcing, casualization
and in-formalization. Although the Kenya labour market
has one of the most institutionalised industrial relations
in Africa, massive lay-offs and rising disputes triggered
off by non-compliance of collective agreements have in
recent years affected the labour market negatively. In
practice, this has challenged the trade unions’ ability to
organize and bargain collectively for better working
conditions. Trade unions have also suffered from
government interference in trade union activities. As an
example, tensions arose in 2014 between COTU, TUC-
Ke and the Government due to disagreements about
which organization was the most representative in
Kenya to enjoy the right to represent workers in a
number of tri-partite forums by law. Since then,
however, relations between COTU (K) and the Kenya
National Union of Teachers (KNUT) improved during
2015/2016 where COTU assisted KNUT in handling
the dispute with the public employer. While the national
teacher strike and collective negotiations were
eventually resolved in 2016, doctors and nurses
continued their strikes into 2017 (see also the section:
Trade Union Rights Violations).
The trade union movement has struggled with
demarcation lines. Data suggests that the Trade Union
Congress of Kenya (TUC-Ke) went through a drop of
23% in membership in the period from 2012 to 2016.
In contrast, the Central Organisation of Trade Unions
(COTU (K)) experienced a high growth of 101% in the
membership due to a high influx of members from the
informal economy in recent years (Table 2 & Figure 1).
Table 2: Trade Union Centres members and affiliated unions in Kenya, 2016
Total
Members
Growth in membership, 2012-2016
Women Members,
%
COTU (K) 2,522,717 101 % 48 % TUC-Ke 189,226 -29 % * 63 % Independent 7,905 N/a 20 %
Total 2,719,848 N/a 49 % * Data from TUC-Ke growth in membership cover only KNUT and KUSU.
Source: COTU; LO/FTF Council.
Central Organisation of Trade Unions (COTU (K))
COTU (K) is the largest trade union federation in Kenya
and it is considered as one of the strongest in Africa.
The organization is a well-established political actor on
general labour market issues. The role of COTU has
concentrated on negotiating improvement in salaries,
workplace safety, fringe benefits and generally better
terms and conditions of employment for the workers it
represents in the formal sector.
The organization represents 44 trade unions with a
registered 2.5 million members in 2016; one out of two
(48%) were women and around 58% are young
members.1 COTU is affiliated to the International Trade
Union Confederation (ITUC), the Organization of
African Trade Union Unity (OATUU), the Trade Union
Federation of Eastern Africa (TUFEA) and the East
African Trade Union Confederation (EATUC).
The organization’s trade unions range from the largest
Kenya Plantation and Agricultural Workers Union
(KPAWU) of 750,000 members to the small Seafarers
Working Union of 277 members. COTU (K) members
grew from 3% of the labour force in 2005 to a paek
of 13% in 2016. The high increase in membership is
partly caused by an improved collaboration with
organized workers from the informal economy since
Danish Trade Council for International Development and Cooperation
Labour Market Profile 2016
Kenya 2016 Page 2
2014 (Figure 1). The Doctors Union and Private
Universities Union were affiliated to COTU in 2016,
while the Dock Workers Union, who had left the
federation, was re-affiliated. Similarly, nine
independent informal economy unions/associations
affiliated to COTU (K) (see also Appendix Table 27).
COTU (K) represents affiliated unions and informal
economy associations in tri/bi-partite bodies such as the
National Social Security Fund (NSSF), the National
Labour Board, and the Wage Councils. During 2016,
COTU (K) sensitised its membership on the ILO
Recommendation 204 on the transition from the informal
to the formal economy.
Figure 1: COTU membership trend
Source: COTU (K) and LO/FTF Council
COTU (K) has improved its economic and organizational
sustainability. In addition to the increased numbers of
union members, approx. 12% of affiliated unions now
co-finance their own training and education programs
partly as a result of workers education and regional
training-of-trainers network.
During the national congress of COTU in 2016, three
women General Secretaries were elected together with
two women National Treasurers and over 500
representatives at branch and shop floor levels. In
addition, COTU (K) amended its constitution to provide
positions for women and youth committee chairpersons
into the Board. The COTU (K) congress also adopted its
first gender policy.
Trade Union Congress of Kenya (TUC-Ke)
The Federation of Public Service Trade Unions of Kenya
(PUSETU-K) was launched in November 2012 and re-
launched as the Trade Union Congress of Kenya (TUC-
Ke) in 2014. Six trade unions are affiliated with TUC-
Ke in 2017 (March) and represents a total of 189,000
members (Table 27). In the beginning the organization
was dominated by members from the public sector,
later opened up for private sector unions.
The largest affiliated union is KNUT with 160,000
members, but since 2014 it has lost at least 25,000
members as a result of a validation process initiated by
the Teachers Service Commission and poor recruitment
(Table 2 and see also Appendix Table 27).
During 2016, KNUT and the Kenya Union of Post
Primary Education Teachers (Kuppet) were at
loggerheads with the Teachers Service Commission
(TSC) due to withheld union dues, adversarial collective
negotiations. At the end of 2016, however, a collective
agreement was concluded with improved salary
packages to public teachers.
EMPLOYERS’ ORGANISATIONS
Federation of Kenya Employers (FKE)2
FKE was established in 1959. As Kenya’s leading
employers’ organization, its overall objectives are to
maintain good industrial relations, promote sound
management practices and fair employment conditions.
Maintaining industrial relations are the core function of
FKE. It also provides business development assistance to
members (advocacy, industrial relations, employment
laws and related value-add services through
management, consultancy and training). The employers’
organizations have increased their attention to
employers from the informal economy.3 As an example,
FKE has been involved in providing institutional services
to informal economy businesses.
FKE headquarters are in Nairobi, while its three
branches are located in the Coast, the Rift Valley and
the Western Regions. It is independent of both
government and political parties.
Membership is open to all organizations in the public
and private sectors except the civil service and the
disciplined forces. Its membership comprises of at least
4,000 Kenyan businesses both direct and indirectly
through 15 associations that cuts across all sectors of the
economy. The members constitute both small and large
employers. In comparison, Kenya has an estimated
35,000 large or medium sized enterprises, constituting
2% of Kenya’s 1.7 million enterprises. The organization
is registered on United Nation’s Global Compact.
In practice, FKE is the bi-partite social partner to COTU.
It represents employers in the most central bi/tripartite
organs, and deals and provides hearing inputs on
3%
7%
9% 9% 9%
13%
0%
2%
4%
6%
8%
10%
12%
14%
16%
0
500000
1000000
1500000
2000000
2500000
3000000
2005 2007 2009 2012 2014 2016
Ratio of trade union members to labour force (%)

Danish Trade Council for International Development and Cooperation
Labour Market Profile 2016
Kenya 2016 Page 3
labour policies and legislation. Among others, FKE is
incorporated in the Government's Employment Policy
and correspondent strategies alongside COTU.4 Most
importantly, however, FKE leads negotiations of
collective bargaining agreements on behalf of its
member enterprises at company, industrial or sectoral
level.
FKE has also been involved in programs such as
capacity building, developing small scale enterprise,
informal economy, child labour prevention, developing
micro finance, tackling youth unemployment, HIV/AIDS
at the workplace and expanding social protection.
FKE is concerned about Kenya’s competitiveness in
doing business and especially the low job creation in
the formal sector, the high growing youth population
and wage increases. Similarly, concerns have been
raised about the lacking infrastructure repair as well as
the negative value in the net migration i.e. ‘exporting’
jobs (see also the sub-section: Migration).
CENTRAL TRIPARTITE STRUCTURES5
National Labour Board
The tripartite National Labour Board advises the
Minister of Labour on labour legislation and labour
matters. The Minister of Labour consults the board, when
various sensitive changes to the labour laws are made.
Wages Councils
A total of 17 Wages Councils - the General Wages
Council, the Agricultural Wages Council and other
sectoral councils - consist of three representatives from
each of the tripartite parties plus three independent
members. The Councils monitor the enforcement of
minimum standards requirements and advices the
Minister of Labour on matters of minimum wages and
conditions of employment in formal and informal
economy.
Wage councils and several tripartite committees have
only convened on a few occasions. Several tripartite
bodies are currently not active and the Ministry of
Labour, the labour administration, the employment and
labour relations court and the labour inspection have
been criticised by social partners for reacting slowly on
labour issues and handling of day-to-day business.
By law informal economy workers are allowed to
establish associations as well as unions to negotiate
wages and conditions in line with the government’s
minimum wage guidelines. This also includes advocating
for better working conditions and representation in the
Employment and Labour Relations Court.
Productivity Centre of Kenya
The Productivity Centre of Kenya is a tripartite
institution that works to improve productivity,
sustainable growth and encourage better working
relationship between labour and enterprises. It gives
wage guidelines for various sectors based on
productivity, inflation and cost of living indices.
In August 2016, Kenya initiated to set up a National
Productivity Council in Nairobi to monitor the
implementation of programs aimed at improving labour
issues and standardization. The change follows minor
amendments to the Industrial Court Act of 2011 to align
it to an article of the Constitution.
Employment and labour relations court (former
Industrial Court)
The Employment and Labour Relations Court settles
employment and industrial relations disputes and
secures good labour relations in Kenya. Apart from
aligning the Industrial Court to the Kenyan constitution
from 2010 and re-naming it to the Employment and
Labour Relations Court, it was also decentralised to 7
out of 47 counties so far. Twelve (12) judges have been
appointed. COTU (K) are engaged in building the
capacity of the Employment and Labour Relations Court
by training paralegals for presentation of cases before
the court and familiarizing the courts functions to trade
unions as well as employers.
The function of the court has been challenged by
disagreements as to whether procedures for the court
cases should be aligned with procedures in ordinary
courts as well as if only employers and trade unions
have standing before the court.
The government continues to strengthening the labour
dispute system. Critics argue that decisions of the
employment and labour relations court are not enforced
consistently. Many employers do not comply with the
court’s reinstatement orders, while some workers accept
payment in lieu of reinstatement. According to sources,
the enforcement mechanisms of the Employment and
Labour Relations Court remain weak and its case
backlog raises concerns about its efficacy. With
reference to the latest data available, 3,651 cases
were filed with the Industrial Court during 2015 - up
from 3,540 in 2014. A total of 1,086 awards and
rulings were announced in 2015.6

Danish Trade Council for International Development and Cooperation
Labour Market Profile 2016
Kenya 2016 Page 4
The government established the courts to provide for
alternative dispute resolution structures to relieve
backlog of labour disputes cases at the Employment
and Labour Relations Court, but some cases dated back
from 2007. Conciliation is not compulsory in individual
employment matters.
National Economic and Social Council (NESC) NESC was established in 2004 as an advisory body to
the government on policies to fast track the socio-
economic transformation of the country. The institution
has contributed indirectly to social dialogue in the
preparation of strategies and policies. This supported a
more favourable environment for engagements
between employees, employers, government (executive,
legislature and judiciary) and new entrants in the social
dialogue space such as NGOs and think tanks.
Other important bi/tripartite organs
Kenyan Electricity Board
National Industrial Training Council
National AIDS Control Council and Global Fund on
AIDS
National Social Security Fund
National Health Insurance Fund
National Advisory committee on Occupational Health and Safety
National Tripartite Consultative Committee
Kenyan anti-corruption Board
Teacher Service Commission
Educational Task force
Collective Bargaining Agreements (CBAs)
Kenya’s Constitution recognizes the right of every trade
union to bargain collectively. However, it is not clear
whether this right can be enjoyed by all workers, e.g.
members of the Prison Department, the National Youth
Service, teachers under the Teachers' Service Commission,
and workers from the public sector (see also the section:
National Labour Legislation).7
A total 230 Collective Bargaining Agreements (CBAs)
were registered with 37 new agreements negotiated in
2016 with a 4% increment from 2015. 12% of total
employees are covered by agreements. It’s important
to note that the collective agreement between the
teachers' union KNUT and TSC were signed in 2016
after 48 years of negotiations.
Table 3: Status of Collective Bargaining Agreements (CBAs) in Kenya
Number of CBAs (2016) 230 *
Unionisable employees covered 270,431 **
Share of employees covered by CBAs 12 % **
* Number of CBAs from 2016 is based on 226 CBAs from COTU (K)
and 4 CBAs from TUC (Ke).
** The number covers only COTU (K).
Source: COTU; LO/FTF Council.
Based on research of comparative collective bargaining
agreements from development countries from 2015,
analysed 56 CBAs in Kenya out of which 98% were
covering the private sector and 11% were signed by
one or more employers’ associations. The agreements
contain clauses on wages. It does not include wage
amounts, but where the wage setting takes place, i.e. it
covered 97% of the agreements specify individual
contracts as the level where wages are to be
determined in Kenya. Wages were rarely set on the
industry level. In addition, 82% of 56 CBAs contained
indexation clauses, increasing basic pay on a
permanent basis. Only 4% of the Kenyan agreements
had pay scales.8
COTU (K) and its affiliated unions improved their
capacity to enter social dialogue with employers in the
formal sector. The coverage of CBA skyrocketed from
3.5% to 17% in 2013 and dropped slightly down on
12% in 2016. In contrast, the number of approved
CBAs fell during the last decade from 317 in 2007 to
226 in 2016. This indicates that the number of CBAs
have a relatively higher coverage today than during
the 2000’s (Figure 2).
Figure 2: Collective Bargaining Agreement trends in Kenya, 2007-2016
Source: Trade Union Approaches to Formalizing the Informal Economy
in Kenya, June 2015; COTU and LO/FTF Council research
In 2016, an increasing number of collective bargaining
were controversial and delayed, and indicated
3,2%
4,3% 4,3% 5,2%
4,6%
3,5%
17%
12%
0%
2%
4%
6%
8%
10%
12%
14%
16%
18%
0
50
100
150
200
250
300
350
400
2007 2008 2009 2010 2011 2012 2013 2016CBAs coverage of waged workers (%)
Number of CBAs

Danish Trade Council for International Development and Cooperation
Labour Market Profile 2016
Kenya 2016 Page 5
industrial unrest like for instance grievances about
health professionals’ payments, lack of promotions etc.
by county governments (as per constitution). This
triggered off the longest nationwide doctor and health-
care strike due to disputes over pay and working
conditions and lack of application of the 2013
collective agreement between health professionals and
the Kenyan government (see also the section: Trade
Union Rights Violations). This strike was eventually
called off in 2017. Similarly, teachers’ and university
strikes illustrated poor industrial relations between
unions and the Ministry of Education and inefficient
dispute resolution mechanisms in Kenya.
NATIONAL LABOUR LEGISLATION
Constitution9
The Constitution of 2010 enshrines several labour rights
including the freedom of association, independence of
social partners, a fair remuneration, reasonable
working conditions and the right to strike. Tenets of the
Decent Work Agenda are embedded in Chapter Four,
also known as the Bill of Rights.
The Employment Act10
The Employment Act of 2007 regulates various aspects
of employment, including rights at work, working hours,
sick and maternity leave, discrimination, sexual
harassment, forced and child labour, protection of
wages, termination of employment and dispute
settlement procedures.
The Act provides for the right of workers, to form and
join unions of their choice. It includes those in export
processing zones (EPZs). Any seven or more workers in
an enterprise have the right to form a union by
registering with the trade union registrar. The law also
covers the right of collective bargaining to every trade
union, employer’s organization, and employer.11
During 2016, tripartite partners produced a simplified
version of the five sets of Kenya labour laws of 2007
targeting the informal economy workers and created a
mobile application of the same in order to improve
accessibility.
The Labour Institutions Act12
Labour Institutions Act of 2007 defines rights to
freedom of association, establishment of labour and
employer organisations, member dues, and recognition
of trade unions and CBAs. The Act also establishes and
regulates the National Labour Board, the Industrial
Court, Committee of Inquiry, Labour Administration and
Inspection, Wage Councils and Employment Agencies.
The Labour Relations Act13
The Labour Relations Act of 2007 regulates trade
unions and employers’ organizations, collective
bargaining, strikes and lockouts, trade dispute
resolution and also recognizes the freedom of
association.
The Occupational Health and Safety Act14
Occupational Health and Safety Act of 2007 deals
with safety, health and welfare of persons employed at
workplaces. It defines the duties of social partners and
sets out occupational, health and safety standards and
codes of practices at any given workplace.
The Domestic Workers’ Act
The Domestic Workers’ Act of 2011 improve wages
and working conditions for Kenya’s domestic workforce,
thereby affording domestic workers greater job
security and wages to support their families.
The National Social Security Fund Act15
The National Social Security Fund (NSSF) Act of 2013
enhances workers’ social protection with two newly-
established funds: a pension fund and a new provident
fund. All employers with one or more employees are
obliged to register with the new pension fund.
Membership in the pension fund is mandatory for all
employed persons between the ages of 18 and 60.
Previous fixed sum contributions has been changed and
increased to a 6% + 6% contribution from employer
and employee. Members of the old provident fund will
be automatically enrolled in the pension fund.
Membership in the new provident fund is now voluntary
for employees covered by the pension fund.
The implementation of NSSF Act 2013 has been heavily
disputed by Government on one side and COTU and
FKE on the other side. Government decided to
implement the law at once, not allowing a transition
period of five years as otherwise agreed affecting the
tri-partite relations negatively. A legal row over the
substantial increase in contributions to workers’ pensions
was negotiated to a roadmap in September 2016 to
withdraw court cases barring the implementation of a a
new NSSF Act.
Other labour legislations
Several other labour related legislations regulate and
set standards and restrictions for the labour market.16
ILO has registered a total 430 of national labour,
Danish Trade Council for International Development and Cooperation
Labour Market Profile 2016
Kenya 2016 Page 6
social security and human rights legislations. Ten new
legal pieces were approved in the period from 2014 to
2016 (Table 4 & Appendix Table 28):
Table 4: Number of approved national labour, social security and human rights related legislations in Kenya
2014 2015 2016
Number of new legislations 5 3 2
Source: ILO, NATLEX, Kenya
Observations on the labour legislation
The International Trade Union Confederation (ITUC)
observations of the labour legislation protection of
trade union rights were among others:17
The Registrar of Trade Unions may refuse to
register a union if another union already exists
which is sufficiently representative of the whole or
of a substantial proportion of the workers the new
union seeks to represent.
The law imposes strict conditions and limitations on
the use and management of trade unions’ funds.
The Registrar of Trade Unions also has extensive
powers to audit these funds.
A union shall be recognized as a bargaining agent
if it represents a simple majority of those
employees eligible to become union members. This
provision extends to public sector employers.
While the new Constitution recognizes the right of
every trade union to bargain collectively, it is not
clear whether this right can be enjoyed by
members of the Prison Department, the National
Youth Service, by teachers under the Teachers’
Service Commission, and by workers in the public
sector.
If the parties cannot reach an agreement, they must
report the labour dispute to the Minister of Labour
who shall appoint a conciliator within 21 days. The
conciliator shall attempt to resolve the dispute
within 30 days, and only after that can a lawful
strike be called. A party can also refer the dispute
to the Industrial Court if conciliation fails, but not
where a union may call a protected strike, i.e. a
strike that concerns employment matters or the
recognition of a trade union.
Other sources have registered that some employers
unfairly dismissed workers for their union affiliation.
Equally important, the government has been criticized
for not effectively applying labour law regulations.18 A
point of concern is the need to extend the application
of labour legislation and regulations into the informal
economy where the majority (88%) of the labour force
is working.
Ratified ILO Conventions
With reference to Kenya’s ratification of international
labour standards, a total 50 of International Labour
Organization's (ILO) Conventions are ratified (see also
Appendix Table 29):19
Fundamental Conventions: 7 of 8.
Governance Conventions (Priority): 3 of 4
Technical Conventions: 40 of 177.
Out of 50 Conventions ratified by Kenya, of which
41 are in force, 9 Convention have been
denounced; none has been ratified in the past 12
months.
The ILO Convention 87 concerning Freedom of
Association and the Protection of the Right to Organize
has not been ratified. The latest ratified Convention
was the Maritime Labour Convention (MLC, 2006) from
July 2014.
TRADE UNION RIGHTS VIOLATIONS
Kenya was ranked 4 out of 5 of ITUC’s Global Rights
Index since 2015 (Table 5) and classified with
‘systematic violations of rights’. This is interpreted as
workers in countries with the rating 4 have reported the
government and/or companies are engaged in serious
efforts to crush the collective voice of workers putting
fundamental rights under threat.20
Table 5: Global Rights Index, Kenya ranking, 2014-2016
2014 2015 2016
Ranking on the Global Rights
Index 4 4 4
Note: Five clusters in total with ratings from 1 to 5. A country is
assigned the rating 5+ by default, if the rule of law has completely
broken down.
Source: ITUC, Global Rights Index
ITUC registered 13 cases on the systematic violations of
rights’ in 2015 none in 2016.21 These cases were
related to striking health professionals, nurses and
doctor workers who were sacked; denied teacher-
negotiated rights and a national strike, strikers
threatened with dismissals; striking nurses attacked;
members of parliament calling for union leaders to be
arrested for organizing teachers strike; death threats
against health workers’ leaders; two informal ‘sector’
union officials wrongfully arrested and detained; anti-

Danish Trade Council for International Development and Cooperation
Labour Market Profile 2016
Kenya 2016 Page 7
union action at Agility Logistics; 200 security guards
sacked for joining union; teachers’ leaders faces police
summons over strike; union members face pay
discrimination at Telkom Kenya; and union officials
sacked by flowers flower farm.
Other sources noted how employers increasingly avoid
compliance with reinstatement orders by Employment
and Labour Relations Court, and resist efforts to
establish unions. In addition, regulations allow
employers in some industries to dismiss workers
regardless of the provisions of their collective
bargaining agreements. There were also registered
violations with reference to debt bondage, trafficking
of workers, and even family members compelled to
work as domestic servants.22
WORKING CONDITIONS
Kenya has one of the highest minimum wages in the East
African region. Recent government increase minimum
wages were 12% in nominal terms in May 2015. The
lowest minimum wage (general labourer) was set at
10,955 shillings (US$111) per month with the highest
(cashier driver and salesmen-driver) at 24,720 shillings
(US$251). The minimum wage in the agricultural sector
is significantly lower with an estimated 6,702 shillings
(US$68) on average in 2015. The minimum wages were
not raised in 2016.
Overall the minimum wage experienced a growth on
149% in real terms from 2005 to 2016. However, in
many cases the increasing cost of living and inflation of
10% in 2017 often outpaced the wage growth.
Another point often overlooked is that the minimum
wage is applied in the formal sector not in the informal
economy where the large majority of the labour force
works (see also the sub-section: Informal economy). In
practice, only three out of ten informal workers are
paid above the minimum wage compared to nine out of
ten formal workers.
Kenya also had a relatively high nominal average
wage of 50,355 shillings (US$512) per month in 2015.
This nominal average wage growth was estimated at
105% in the period from 2005 to 2015 (see more in
Table 6). An unequal distribution of income in the
country is indicated by a higher nominal average
wages than the minimum wages.
Table 6: Wages and Earnings in Kenya Monthly average and legal minimum wages Shilling
Current US$
Current
Nominal average wages (2015) 50,355 512
Lowest minimum wage (2015-2016) 10,955 111
Highest minimum wage (2015-2016) 24,720 251
Medium agricultural minimum wage (2015-2016)
6,702 73
Ratio of minimum wage to value added per worker (2016)
1.2 %
Real wage growth (%) (2015) 2.1 %
Growth of nominal average wage (2005-2015)
105 %
Growth of real minimum wage (2005-2016) 149 %
Source: ILO, Global Wage Report 2016/17; Kenya Gazette
Supplement No.9l, 2015; Mywage.org/Kenya; World Bank, Doing
Business, Kennya 2016
The minimum wage has been on a steady increase since
2008. According to estimations, there has been a
significant gap between the nominal vs. real minimum
wage due to consumer price inflation at 8.1% on
average in the period from 2005 to 2016 (Figure 3
and Figure 17).
Figure 3: Minimum wage trend in Kenya, 2005-2016 Shillings and growth in %
Source: ILO, Global Wage Report 2016/17;
Working conditions are monitored by 95 labour
inspectors employed by the Ministry of Labour, Social
Security, and Services (MLSSS). It equals one inspector
per 188,921 workers of the total workforce and
23,849 of wage and salaried employment. In contrast,
the ILO recommends one inspector per 40,000 workers
in less developed countries.23 According to sources,
14%
2%
-11%
24%
18%
1%
19%
23%
-1%
12%
0%
-15%
-10%
-5%
0%
5%
10%
15%
20%
25%
30%
0
2000
4000
6000
8000
10000
12000
14000
16000
18000
20000
Real minimum wage growth (%)
Minimum wage
Real minimum wage

Danish Trade Council for International Development and Cooperation
Labour Market Profile 2016
Kenya 2016 Page 8
insufficient resource made a number of labour
inspection positions vacant which turned out to several
county labour offices had only one or no labour
inspector. By the same token, low salaries and the lack
of vehicles, fuel, and other resources made it very
difficult for labour inspectors to do their work
effectively and left them vulnerable to bribes and other
forms of corruption.24
With over 1.4 mio Kenyans living with HIV/AIDS, Kenya
has the 4th largest HIV epidemic globally. It constitutes
a serious public health problem with negative
repercussions in the labour market.25 In workplaces,
productivity and product quality have suffered because
of among others ignorance of the HIV pandemic, poor
public health and loss of lives, stigma, unfair
discrimination and dismissals, disclosure of status,
breach of confidentiality and lack of HIV/AIDS
prevention programs.
To mitigate the pandemic, some employers and trade
unions use the workplace as a joint platform for
sensitization, education, counseling, care and treatment
etc. of the workforce, but the labour market in Kenya is
today characterized by too few workplace HIV and
AIDS policies and CBAs having been implemented that
have integrated salient HIV/AIDS provisions.26 The HIV
and AIDS Tribunal adjudicate and redress cases
involving violations of labour and civil rights to protect
and promote rights of HIV/AIDS infected and affected
people.
Law puts the normal workweek to 52 hours, which is
relatively high in Africa. Agricultural workers are
excluded from the limitations. An employee in the non-
agricultural sector has the right to one rest day per
week and 21 days of combined annual and sick leave.
The law also requires that total hours worked (regular
time plus overtime) in any two-week period do not
exceed 120 hours (144 hours for night workers). The
law also provides premium pay for overtime (see more
on Table 7).
Table 7: Working Conditions in Kenya
Normal Weekly Hour Limit 52 hours
Overtime Limit
Maximum limit of 116
hours (incl. overtime) per
2 week period
Max. Weekly Hours Limit 58 hours
Min. Mandatory Overtime
premium/time off in Lieu of
Overtime Wages
50% increase; no universal
national entitlement to compensatory time off
Min. Annual Leave 18 hours
Duration of Maternity Leave
Benefits 3 months
Amount of Maternity Leave
Benefits 100 %
Source of Maternity Leave
Benefits Employer
Source: ILO, Working Conditions Laws Report 2012
WORKFORCE
Kenya’s total population was estimated at 46.8 million
out of which 18.5 million were workers in 2016. Each
year around 841,600 persons enter the job market of
which 107,800 were wage employment and 20,200
were self-employment or unpaid family employment in
the modern sector while 713,600 were in the informal
sector.
The employment-to-population rate was estimated at
61% in 2016 with gender gaps, e.g. 10% percentile
ranking between men (66%) and women (56%). The
youth employment-to-population ratio of 32% is
particularly low in Kenya in comparison with the sub-
Saharan Africa average at 59%. One of the reasons
for this low youth employment rate is related to the
relatively high enrolment in primary and secondary
education as well as high youth unemployment.
Actually, data show that the country has significantly
lower employment-to-population ratios on all levels in
comparison with the abovementioned region averages
(see more on Table 8).
Table 8: Employment-to-population ratio, 2016, Age and Sex distribution, %
Sex Age Kenya Eastern Africa
Men & women
Total 15+ 61 % 74 %
Youth 15-24 32 % 59 %
Adult 25+ 75 % 82 %
Men
Total 15+ 67 % 79 %
Youth 15-24 35 % 63 %
Adult 25+ 82 % 88 %
Women
Total 15+ 56 % 69 %
Youth 15-24 29 % 56 %
Adult 25+ 69 % 76 %
Sources: ILO, Key Indicators of the Labour Market (KILM), 9th Edition.
Based on estimations, during the last decade the
country’s total employment rate has been on a flat
growth and stayed 12 percentiles ranking lower than
the Eastern Africa average. The youth employment rate

Danish Trade Council for International Development and Cooperation
Labour Market Profile 2016
Kenya 2016 Page 9
also stayed flat during the same period with 28
percentiles lower than the region youth employment
rate average (Figure 4).
Figure 4: Labour force employment rate, 1995-2016, %
Sources: ILO, Key Indicators of the Labour Market (KILM), 9th Edition.
Inactivity
One out of three (33%) of the working-age population
(WAP) and almost two out of three (61%) of the youth
population (15-24 years old) are inactive on the labour
market (Table 9).
Table 9: Inactivity rate in Kenya, 2016, %
Total Men Women
Inactivity rate 33 % 28 % 38 %
Inactivity rate, youth 61 % 57 % 64 %
Note: Inactivity is measured as not engaged actively in the labour
market, either by working or looking for work.
Sources: ILO, Key Indicators of the Labour Market (KILM), 9th Edition.
The inactivity rate trends were estimated with a rise
during the 1990s and beginning of the 2000s; but
stayed on a flat growth after 2005 and stayed at
around 33% of the total labour force and 61% of the
youth (Figure 5).
Figure 5: Inactivity rate trend in Kenya, 1995-2016, Sexes, %
Sources: ILO, Key Indicators of the Labour Market (KILM), 9th Edition.
Unemployment
The most recent data estimations of total unemployment
and youth unemployment in Kenya stand at 9.2% and
18% in 2016, respectively. There is an unemployment
gender gap in terms of the total unemployment while it
is not present among youth unemployment (Table 10).
Unemployment occurs mostly in the urban areas while
underemployment occurs predominantly in rural areas.
All Kenya’s unemployment rates are higher than the
Eastern Africa averages. With this in mind, around 80%
of unemployed Kenyans are below 35 years old.
Table 10: Unemployment and youth unemployment in Kenya and Eastern Africa, 2016
Kenya Eastern
Africa
Unemployment
Total 9.2 % 6.8 %
Men 7.9 % 5.3 %
Women 11 % 8.2 %
Youth
Unemployment
(15-24 years old)
Total 18 % 11 %
Men 17 % 10 %
Women 18 % 12 %
Sources: ILO, Key Indicators of the Labour Market (KILM), 9th Edition
Both the total and youth unemployment trends show
steady rates during the last decade at around 9% and
18% in average, respectively (Figure 6).
Figure 6: Unemployment trend in Kenya and the Eastern Africa (EA) 2007-2016, Total and Youth, %
Sources: ILO, Key Indicators of the Labour Market (KILM), 9th Edition
The high youth unemployment rate is related to long-
term population changes, e.g. young Kenyans are
moving from rural to urban areas in large numbers.
Albeit there has been some increase in urban formal job
creation, it has been insufficient to cover the demand. It
is important to realize that the urban areas have not
only been unable to generate sufficient jobs in the
formal sector, but also many cannot readily find an
0
10
20
30
40
50
60
70
80
90
1995 2000 2005 2010 2016
Kenya - Total Kenya - YouthEA - Total EA - Youth
0
10
20
30
40
50
60
70
1995 2000 2005 2010 2016
Total Youth
0
5
10
15
20
2007 2008 2009 2010 2011 2012 2013 2014 2015 2016Kenya - Total Kenya - YouthEA - Total EA - Youth

Danish Trade Council for International Development and Cooperation
Labour Market Profile 2016
Kenya 2016 Page 10
adequate occupation in the informal economy. Data
shows that the proportion of workers with a formal job
decreased from about 13% in the early 1970s to 9%
in 2010.27
The low job creation in Kenya keeps many workers in
poverty. As demonstrated, the unemployment rates are
consistently higher for young people belonging to
households in the bottom 40% of income distribution.28
Also education level is central in terms of
unemployment, e.g. the youth high unemployment rate is
related to lower education levels. Only 1.5% of the
unemployed youth have formal education beyond the
secondary school level.
Kenya has with no legislative provision for
unemployment insurance and benefits. On the other
hand, the new Youth Employment and Opportunities
Project of US$150 million was launched in May 2016
directed towards persons aged between 18 and 29
years, who are without jobs and have experienced
extended spells of unemployment, or are currently
working in vulnerable jobs.29 The Ministries of Education
and Labour are currently drafting a skills development
policy. Also, there are initiatives to tackle Kenya’s high
youth unemployment through a better collaboration
between the private sector, academia and government
to develop innovative business models, industry-relevant
curricula and enabling national policies.30
Sectoral Employment
According to the Economic Survey 2016 approximately
2.5 million workers in Kenya are wage employees
which equal 16% of the total employment of 15.2
million workers in 2015. This data excludes small-scale
agriculture and pastoral activities; thus, it diverges from
the previously mentioned total labour force.
The total wage employees have increased with 23% in
the period from 2010 to 2015. In the same period the
total employment grew by 32%. It is interesting to
observe that the ratio of wage employment to the total
employment dropped by 2.0% and reached 16% of
the total employment (Table 11).
Table 11: Total and wage employment in Kenya 2010-2015
2010 2014 Change %
Wage employment 2,016,200 2,478,000 23%
Total employment 11,457,100 15,160,899 32%
Ratio of wage employment to total employment
18% 16% -2.0%
Sources: Kenya National Bureau of Statistics, Economic Survey 2015
The wage employment was growing more in the private
sector of 26% than the public sector of 16% in the
period from 2010 to 2015; and the former segment
constituted 68% of the total wage employment and the
latter of 32% in 2015 (Table 12).
Table 12: Wage Employment by Industry in Kenya, 2010-2015
2010 2015
Change %
Private sector 1,396,400 1,759,600 26 %
Public sector 619,800 718,400 16 %
Total wage employment 2,016,200 2,478,200 23 %
Sources: Kenya National Bureau of Statistics, Economic Survey 2016
In terms of the total wage employment by industry in
Kenya, almost two out of three (63%) are men who
dominate most sectors, except in the ‘other services’
sector. The community, social and personal services
sector has the highest employment share of 37% of the
total employment, which covers 874,000 workers with a
slight men dominance of 53% of the sector employment.
The second most dominating sector employment is the
agriculture sector (14%) followed by manufacturing
(12%) and trade and hotel/restaurant sector of 12%
(see more sector employment on Table 13).
Table 13: Wage Employment by Industry in Kenya, 2014
Sector Total sector
employment
Sector
employment
share, %
Ratio of men in
sector
employment, %
Agriculture 333,300 14% 66%
Mining & quarrying 12,800 0,5% 84%
Manufacturing 287,400 12% 82%
Electricity, gas &
water 25,700 1,1% 70%
Construction 143,700 6,1% 81%
Trade, restaurants &
hotels 293,300 12% 73%
Transport, storage &
communication 178,800 7,5% 67%
Finance, real estate
& business services 71,400 3,0% 61%
Community, social
and personal
services *
873,400 37% 53%
Other sources ** 150,400 6,3% 43%
Total 2,370,200 100% 63%
* This sector include: Professional, scientific and technical activities;
Administrative and support service activities; Public administration and
defence; compulsory social security; Education; and Human health and
social work activities.
** Other sources include: Arts, entertainment and recreation; Other
service activities; activities of households as employers; undifferentiated
Danish Trade Council for International Development and Cooperation
Labour Market Profile 2016
Kenya 2016 Page 11
goods- and services-producing activities of households for own use; and
Activities of extraterritorial organizations and bodies.
Sources: Kenya National Bureau of Statistics, Economic Survey 2015
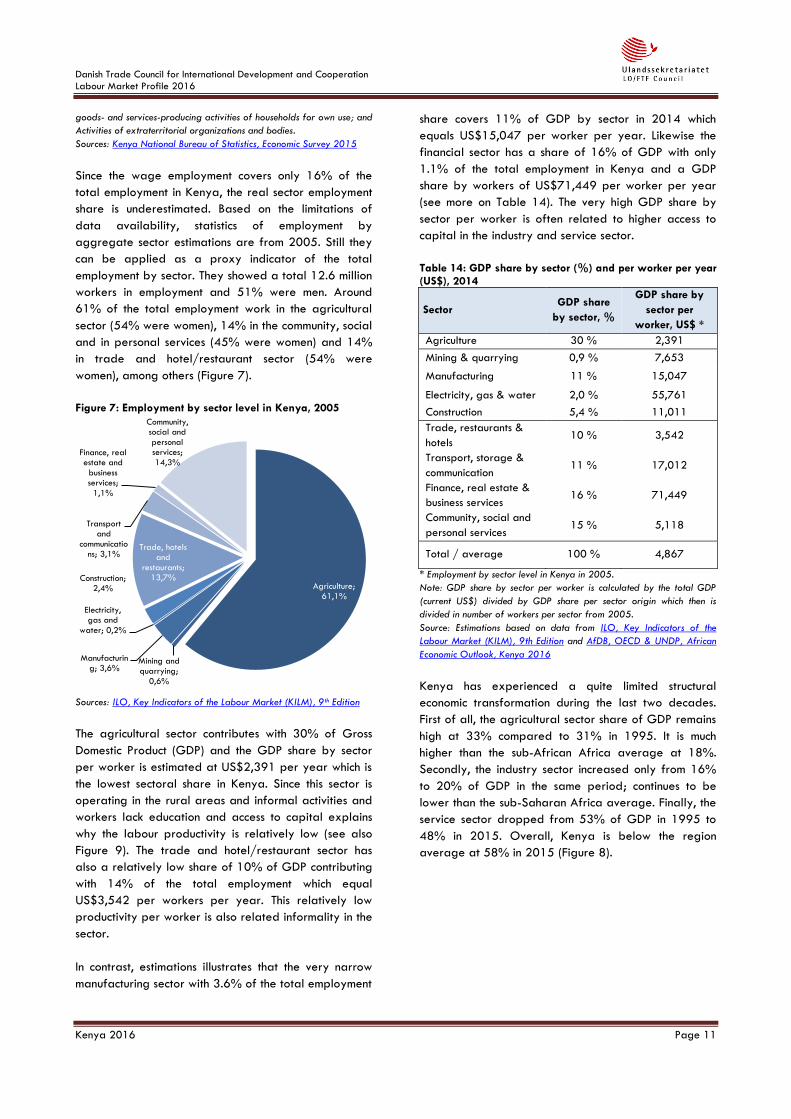
Since the wage employment covers only 16% of the
total employment in Kenya, the real sector employment
share is underestimated. Based on the limitations of
data availability, statistics of employment by
aggregate sector estimations are from 2005. Still they
can be applied as a proxy indicator of the total
employment by sector. They showed a total 12.6 million
workers in employment and 51% were men. Around
61% of the total employment work in the agricultural
sector (54% were women), 14% in the community, social
and in personal services (45% were women) and 14%
in trade and hotel/restaurant sector (54% were
women), among others (Figure 7).
Figure 7: Employment by sector level in Kenya, 2005
Sources: ILO, Key Indicators of the Labour Market (KILM), 9th Edition
The agricultural sector contributes with 30% of Gross
Domestic Product (GDP) and the GDP share by sector
per worker is estimated at US$2,391 per year which is
the lowest sectoral share in Kenya. Since this sector is
operating in the rural areas and informal activities and
workers lack education and access to capital explains
why the labour productivity is relatively low (see also
Figure 9). The trade and hotel/restaurant sector has
also a relatively low share of 10% of GDP contributing
with 14% of the total employment which equal
US$3,542 per workers per year. This relatively low
productivity per worker is also related informality in the
sector.
In contrast, estimations illustrates that the very narrow
manufacturing sector with 3.6% of the total employment
share covers 11% of GDP by sector in 2014 which
equals US$15,047 per worker per year. Likewise the
financial sector has a share of 16% of GDP with only
1.1% of the total employment in Kenya and a GDP
share by workers of US$71,449 per worker per year
(see more on Table 14). The very high GDP share by
sector per worker is often related to higher access to
capital in the industry and service sector.
Table 14: GDP share by sector (%) and per worker per year (US$), 2014
Sector GDP share
by sector, %
GDP share by
sector per
worker, US$ *
Agriculture 30 % 2,391
Mining & quarrying 0,9 % 7,653
Manufacturing 11 % 15,047
Electricity, gas & water 2,0 % 55,761
Construction 5,4 % 11,011
Trade, restaurants &
hotels 10 % 3,542
Transport, storage &
communication 11 % 17,012
Finance, real estate &
business services 16 % 71,449
Community, social and
personal services 15 % 5,118
Total / average 100 % 4,867
* Employment by sector level in Kenya in 2005.
Note: GDP share by sector per worker is calculated by the total GDP
(current US$) divided by GDP share per sector origin which then is
divided in number of workers per sector from 2005.
Source: Estimations based on data from ILO, Key Indicators of the
Labour Market (KILM), 9th Edition and AfDB, OECD & UNDP, African
Economic Outlook, Kenya 2016
Kenya has experienced a quite limited structural
economic transformation during the last two decades.
First of all, the agricultural sector share of GDP remains
high at 33% compared to 31% in 1995. It is much
higher than the sub-African Africa average at 18%.
Secondly, the industry sector increased only from 16%
to 20% of GDP in the same period; continues to be
lower than the sub-Saharan Africa average. Finally, the
service sector dropped from 53% of GDP in 1995 to
48% in 2015. Overall, Kenya is below the region
average at 58% in 2015 (Figure 8).
Agriculture; 61,1%
Mining and quarrying;
0,6%
Manufacturing; 3,6%
Electricity, gas and
water; 0,2%
Construction; 2,4%
Trade, hotels and
restaurants; 13,7%
Transport and
communications; 3,1%
Finance, real estate and
business services;
1,1%
Community, social and
personal services;
14,3%

Danish Trade Council for International Development and Cooperation
Labour Market Profile 2016
Kenya 2016 Page 12
Figure 8: Sector Share in Kenya, % of GDP, 1995-2015
Source: ILO, Key Indicators of the Labour Market (KILM), 9th Edition
Labour productivity in Kenya was growing slowly
during the last decade. The rate is still below the sub-
Saharan Africa average; the country remains with
significant lower labour productivity in comparison with
the global average (Figure 9). The relatively low
labour productivity growth is interrelated to the fact
that many jobs are low-productive self-employment
activities in the informal economy that generate lower
earnings.
Figure 9: Labour productivity trend, 2007-2016
Note: Labour productivity is defined as output per worker (i.e. GDP
constant 2011 international US$ in Purchasing Power Parity (PPP)); and
indexed year 2000 (=100).
Source: ILO, Key Indicators of the Labour Market (KILM), 9th Edition
Migration
Overall the net migration changed during the last 15
years. A positive value of the net migration (i.e. more
people coming into Kenya than leaving) was estimated
at 25,144 persons in the period 1998-2002. Since
then, negative net migration has characterised Kenya
with a negative value of 50,000 persons in the net
migration up to 2012. On a ratio of net migration to
the average population per year, 1 out of 4,036
Kenyans population left the country per year. This was
almost half of the ratio of net migration to the average
population per year of sub-Saharan Africa average
(Table 15 and Figure 10). Data also demonstrate that
remittances received were estimated at 2.4% of GDP in
the period from 2011 to 2015 on average and it is in
line with the region average (Table 15).
Table 15: Migration Facts
Net migration, number
of persons
(2008-2012)
Kenya - 50,000
Ratio of net migration to
the average population
per year (2008-2012)
Kenya - 1 : 4,036
inhabitants
Sub-Saharan
Africa
- 1 : 2,589
Inhabitants
Personal transfers, i.e.
remittances received, %
of GDP (2011-2015,
av.)
Kenya 2.4 %
Sub-Saharan
Africa 2.4 %
Note: Net migration rate is the difference of immigrants and
emigrants in a period of time. A positive value represents more
people entering the country than leaving it, while a negative value
means more people leaving than entering it.
Source: World Bank, World Development Indicators
Figure 10: Ratio of net migration to total population in Kenya and the sub-Saharan Africa (SSA), 1998-2012
Note. The net migration trend is estimated as the net migration rate
divided by the total inhabitants. Net migration rate is the difference of
immigrants and emigrants in a period of time. A positive value
represents more people entering the country than leaving it, while a
negative value means more people leaving than entering it.
Source: World Bank, World Development Indicators
Some key characters of Kenya’s migration trends are
related to the fact that the country is a regional hub for
irregular migration as a destination, origin and transit
31 32 27 28 33
16 17 19 21
20
53 51 54 51 48
0%
10%
20%
30%
40%
50%
60%
70%
80%
90%
100%
1995 2000 2005 2010 2015
Agriculture Industry Services
114 111 111 116
120 122 124 126 131
135
0
20
40
60
80
100
120
140
160
0
5000
10000
15000
20000
25000
30000
35000
40000
Kenya
Sub-Saharan Africa
World
Kenya - Index year 2000 (=100) -10000
-8000
-6000
-4000
-2000
0
2000
4000
6000
8000
1998-2002 2003-2007 2008-2012
Kenya Sub-Saharan Africa

Danish Trade Council for International Development and Cooperation
Labour Market Profile 2016
Kenya 2016 Page 13
country towards South Africa, the Middle East and
North Africa, West Africa, Europe and North America.
Secondly, the vast majority of immigrants in Kenya are
from other African countries; the majority is from East
African countries. Thirdly, Kenya hosts one of the largest
refugee populations in Africa with an estimated
533,000 refugees hosted in two camps. This segment
witnessed a drop in recent years, and has contributed
to the net migration changes in Figure 10 above to
some extent. Fourth, Kenya is affected by internal
displacements as a result of conflict, natural disasters,
climate change and environmental degradation, and
forced evictions.31
The emigration has been driven by a search for
employment and education opportunities in top-
destinations like the United Kingdom, the United States
of America, the United Republic of Tanzania and
Uganda.
Another issue is that under-development in western
Kenya has made many workers migrate towards the
urban zones. The relatively high youth unemployment
has been a main driver of rural–urban migration and
youth emigration.
Migrant workers often lack formal organization and
consequently miss benefits of collective bargaining. As a
means to protect Kenyan domestic workers from unfair
labour practices abroad particularly in the Gulf
countries, a Migrant Workers' Bill was approved into
law in 2016, while the Ministry of labour deployed
labour attaches to the affected countries (See Table 4).
Informal Economy
The labour market is divided into a formal and informal
economy. As already mentioned, the formal sector is a
minority in terms of the total employment 16% in 2015.
In contrast, informal employment was estimated at 83%
of the total employment in 2015. It increased with 1.3%
since 2010 (Table 16). Kenya’s informal employment
rate is near the sub-Saharan Africa average that was
estimated at around 80% of the labour force.32
Table 16: Total and informal employment in Kenya 2010-2015
2010 2015 Change
%
Informal employment 9,371,100 12,559,600 34 %
Total employment 11,457,100 15,160,800 32 %
Ratio of informal economy in total employment
82 % 83 % 1.3 %
Sources: Kenya National Bureau of Statistics, Economic Survey 2016
Other data revealed that 61% of non-agricultural
urban work was in informal economy where approx.
38% were in trade and 25% in non-domestic private
services, while 10% did domestic work. In terms of
gender, nearly half (48%) of women informal workers
in urban areas were in trade compared to 30% of men.
The 2nd largest category of urban informal workers was
services followed by domestic work.33
A survey rated workers on an informality scale from 1-
5, with 1 being workers not entitled to social benefits,
who do not contribute to social security and with no
contract. It shows that 44% are in the two most informal
categories and 23% in the most formal category. The
survey also showed that the informality index correlates
age, i.e. with more young people in informal
employment as well as correlates wages, i.e. with more
than double the median wage at very formal
employment compared to very informal; and youth is
particularly over-represented.34
The increase in the informal employment suggests that
most new jobs are created in the informal economy,
crowding out jobs in the formal sector. According to
sources, the informal economy is absorbing about two-
thirds of annual new employment opportunities in
Kenya.35
In recent years, both employers’ organizations and
trade union federations have found more interest of the
informal economy as new membership recruitment.36 As
previously mentioned, the informal workers are
becoming more organized into associations,
cooperatives, and unions. There are eleven umbrella
associations/unions representing informal workers in
Kenya. The associations represent more than 600
informal sector groups. Several informal ‘sector’ unions
are collaborating with COTU even though not yet being
affiliated.
There are a series of challenges of taxing enterprises in
the informal economy, e.g. mistrust and weak structural
dialogue between informal economy and government
as well as tax evasion and corruption as normal way of
doing business (see also Table 24).
Child Labour
The constitution gives children legal protection from
hazardous or exploitative labour as well as the
Children’s Act from 2001 explicitly prohibits forced
labour, trafficking, and other practices similar to
slavery. However, the government lacks sufficient
Danish Trade Council for International Development and Cooperation
Labour Market Profile 2016
Kenya 2016 Page 14
resources to monitor the law’s implementation in
practice. On the positive side, a list of specific jobs
considered hazardous that would constitute the worst
forms of child labour was published in February 2014.
The government collaborates with COTU, FKE and
donors to eliminate child labour. Among others they
participate in the National Steering Committee on the
Elimination of Child Labour and they meet quarterly
together with other stakeholders such as NGOs.
According to the 2009 National Census, almost three
million children between ages five and 14 (33%) were
engaged in child labour. According to sources, many
children worked on family plots or in family units on tea,
coffee, sugar, sisal, tobacco, and rice plantations.
Children also worked in mining and in the fishing
industry. In urban areas, businesses employed children
in hawking, scavenging, carrying loads, fetching and
selling water, and selling food. In addition, children
often worked long hours as domestic servants in private
homes for little or no pay.37
Based on the most recent survey in child labour in
Kenya, the total number of working children was
estimated of 1,012,184 children in 2006 out of which
53% were boys and 47% were girls. This suggests that
the number of working children dropped by 53% from
1999 where 1.9 million children were registered as
working children. According to the 2006 survey, about
90% of the total number of working children was found
in the rural areas. The age distribution of the working
children was highest among the age group 15-17
(48%), 10-14 (36%), and 5-9 (16%). Only 15% of
working children were in wage employment.
Table 17: Working Children, proportion of all children ages 5-17
Region Year Type Proportion
Kenya 2006 Working children 7.9 %
Hazardous work 2.5 % *
Sub-Saharan Africa
2008
Children in employment 28 %
Child labourers 25 %
Hazardous work 13 %
* This is data from 2008.
Note: Children in employment include all children who conduct some kind
of work, whereas child labourers are a narrower term without mild
forms of work. Hazardous work is the worst from of child labour as
defined in ILO C182.
Source: Kenya National Budget Survey, Kenya Integrated Household
Budget Survey, 2005/06; and ILO, Accelerating action against child
labour, International Labour Conference, 99th Session 2010
There are other reasons to believe that child labour fell
in Kenya due to the introduced free and compulsory
primary education in 2003 (see also the section:
Education).
The National Policy on Child Labour was approved in
October 2016 after 15 years of lobbying. This policy is
informed by the ILO Conventions 138 and Convention
182.
Gender
During this report, it has been demonstrated that the
labour market has a wide range of gender gaps that
most often favor men: Men have lower unemployment,
higher employment as well as waged workers rates
than women. Actually only 29% of those who are
earning a formal wage are women, leaving a huge
percentage of women to work under vulnerable
conditions in the informal economy. In practice, the
workplace has traditionally been men dominated,
especially at higher management levels where policy
issues are discussed. But women's voice is gradually
becoming more and more heard.38
Women have slightly less education than men with a
smaller difference than neighbouring countries.
Nevertheless, this has created some barriers for women
to obtaining better-paid jobs, including on commercial
farms.
ILO has noted a need for increased gender equity in
trade union membership and leadership levels in Kenya.
COTU has set the goal of having 30% women trade
union leaders. As mentioned, COTU (K) elected three
women General Secretaries in 2016 and the
constitution was amended to provide a definite position
of the Women Committee into the Board. The congress
also adopted the first COTU (K) Gender Policy. By the
same token, the organization is collaborating with the
trade union confederation for the East African
Community (EATUC) to promote gender equality, both
within the labour movement and in Kenya.
A 2013 Enterprise Survey reported that 49% of firms
had female participation in ownership, which is higher
than the sub-Saharan Africa average at 36%. Again,
firms with women managers remain low in Kenya
(Figure 11).

Danish Trade Council for International Development and Cooperation
Labour Market Profile 2016
Kenya 2016 Page 15
Figure 11: Women in management and ownership in Kenya, 2013
Source: The World Bank, Kenya Enterprises surveys, 2013
Other issue is that the government is establishing the
National Gender and Equality Commission (NGEC)
through the enactment of the National Gender and
Equality Commission Act from 2011.39
Youth
A critical issue that confronts the Kenya’s labour market
is that 800,000 youths leave school each year and
begin looking for formal sector employment. As
already mentioned, it is only a minority that succeed.
This is illustrated by the high youth unemployment,
growing informal economy with high underemployment;
many becoming pushed towards internal migration,
emigration or otherwise becomes inactive on the labour
market.
In 2016, the government launched the process of
reviewing the somewhat out of date National Youth
Policy. This includes focusing on improving the
employment issues for the youth in Kenya. So far, the
previous youth policy had identified skills development
of the youth through vocational training and imparting
life skills as an important issue. However, the youth
bulge has a frail entrepreneurship culture. This is a
result of some weaknesses in the education system.
Among others, although the enrolment in schooling is on
a rise on all levels, Kenya has a very low participation
rate in vocational training (see more in the sub-section:
Vocational Training). It is also cumbersome starting a
business with some improvements in recent years, though
(see also Table 24). On the positive side, Forbes Africa
recently released a list of Africa’s 30 best
entrepreneurs under 30 years old. It is notable that 7
out of the 30 entrepreneurs are Kenyan.40
The Youth Enterprise Development Fund (YEDF) financed
over 157,000 youth enterprises and contributed to
create over 300,000 jobs within five years.41 But an
analysis of YEDF concluded that most youth have not
been properly informed on how the fund can be
accessed as well as low repayment rates. Moreover,
there lack of monitoring and capacity building is
insufficient concerning gender imbalance.42
Many youth have become discouraged and have begun
to leave the labour market entirely. On this
background, the COTU (K) called the attention that the
youth seeking employment abroad due to the high
youth unemployment rate, and the risk of ending up in
slavery and servitude despite assurance from some
government officers and a clique of unscrupulous
employment agents and bureaus.43
The Government of Kenya’s Youth Employment Scheme
Abroad aims to match Kenyan youth to employment
opportunities abroad. Data has illustrated that between
2008 and 2013, 13,535 youth went abroad for
employment under this scheme.
EDUCATION
Population in Kenya has an average of almost seven
years of schooling. Males have higher rates on all
education levels. The Table 18 below shows the
educational attainment of all Kenyans above 25 years,
therefore gives a glance of the human capital of the
labour force.
Table 18: Highest level attained and years of schooling in the population 2010, Population 25+, Male and Female
Highest Level Attained Male Female
No Schooling 28 % 25 %
Primary Begun 45 % 49 %
Completed 24 % 22 %
Secondary Begun 26 % 18 %
Completed 19 % 11 %
Tertiary Begun 9.9 % 6.8 %
Completed 6.4 % 4.5 %
Average year of total schooling
7.2 years 5.8 years
Note: Primary, secondary and tertiary is the internationally defined distinction of education. In Denmark these corresponds to grundskole, gymnasium& university. Source: Barro, Robert and Jong-Wha Lee, April 2010, "A New Data Set of Educational Attainment in the World, 1950-2010." NBER Working Paper No. 15902
0%
10%
20%
30%
40%
50%
60%
Firms with female topmanager
Firms with femaleparticipation in ownership
Kenya Sub-Saharan Africa Lower income
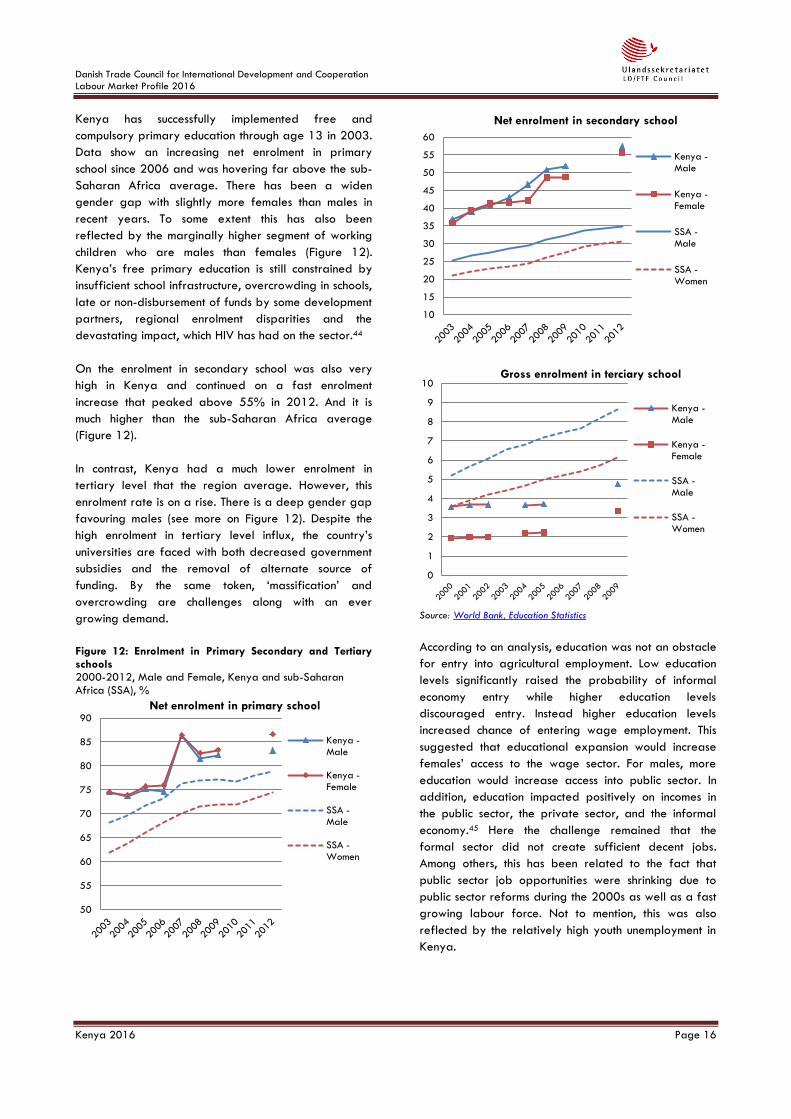
Danish Trade Council for International Development and Cooperation
Labour Market Profile 2016
Kenya 2016 Page 16
Kenya has successfully implemented free and
compulsory primary education through age 13 in 2003.
Data show an increasing net enrolment in primary
school since 2006 and was hovering far above the sub-
Saharan Africa average. There has been a widen
gender gap with slightly more females than males in
recent years. To some extent this has also been
reflected by the marginally higher segment of working
children who are males than females (Figure 12).
Kenya’s free primary education is still constrained by
insufficient school infrastructure, overcrowding in schools,
late or non-disbursement of funds by some development
partners, regional enrolment disparities and the
devastating impact, which HIV has had on the sector.44
On the enrolment in secondary school was also very
high in Kenya and continued on a fast enrolment
increase that peaked above 55% in 2012. And it is
much higher than the sub-Saharan Africa average
(Figure 12).
In contrast, Kenya had a much lower enrolment in
tertiary level that the region average. However, this
enrolment rate is on a rise. There is a deep gender gap
favouring males (see more on Figure 12). Despite the
high enrolment in tertiary level influx, the country’s
universities are faced with both decreased government
subsidies and the removal of alternate source of
funding. By the same token, ‘massification’ and
overcrowding are challenges along with an ever
growing demand.
Figure 12: Enrolment in Primary Secondary and Tertiary schools 2000-2012, Male and Female, Kenya and sub-Saharan Africa (SSA), %
Source: World Bank, Education Statistics
According to an analysis, education was not an obstacle
for entry into agricultural employment. Low education
levels significantly raised the probability of informal
economy entry while higher education levels
discouraged entry. Instead higher education levels
increased chance of entering wage employment. This
suggested that educational expansion would increase
females’ access to the wage sector. For males, more
education would increase access into public sector. In
addition, education impacted positively on incomes in
the public sector, the private sector, and the informal
economy.45 Here the challenge remained that the
formal sector did not create sufficient decent jobs.
Among others, this has been related to the fact that
public sector job opportunities were shrinking due to
public sector reforms during the 2000s as well as a fast
growing labour force. Not to mention, this was also
reflected by the relatively high youth unemployment in
Kenya.
50
55
60
65
70
75
80
85
90Net enrolment in primary school
Kenya -Male
Kenya -Female
SSA -Male
SSA -Women
10
15
20
25
30
35
40
45
50
55
60
Net enrolment in secondary school
Kenya -Male
Kenya -Female
SSA -Male
SSA -Women
0
1
2
3
4
5
6
7
8
9
10Gross enrolment in terciary school
Kenya -Male
Kenya -Female
SSA -Male
SSA -Women

Danish Trade Council for International Development and Cooperation
Labour Market Profile 2016
Kenya 2016 Page 17
Vocational training
The Technical and Vocational Education and Training
Authority (TVETA) is a State Corporation established
under the Technical and Vocational Education and
Training (TVET) Act from 2013. Reforms were launched
in 2015 aimed at streamlining TVET with the creation of
a funding board.
Kenya’s education system has placed emphasis on the
formal academic education. Currently there are about
748 Technical, Industrial, Vocational and
Entrepreneurship Training (TIVET) institutions and is
ambitiously pursuing a policy that will set up at least
one polytechnic in each county in an effort to train more
artisans. However, only 350 of the youth polytechnics
receive government assistance. The private sector
operates close to 1,000 commercial colleges that offer
courses in computers and non-technical areas of
training.46
According to Figure 12 in the previous section, Kenya
has a considerable higher enrolment in secondary
education than the rest of sub-Saharan Africa.
However, few of the pupils in secondary education are
in vocational training. The low share of vocational
training is not counterbalanced by higher tertiary
education.
Almost six times less Kenyans are in vocational training
in comparison with the sub-Saharan Africa average. It is
also interesting to observe that females (58%) have a
higher ratio of vocational training in secondary
education than males (42%) as well as hovering far
above the sub-Saharan Africa average (40%). By the
same token, the number of teachers in secondary
vocational training dropped significantly in Kenya by
41% from 2006 to 2009. More details are available
on (Table 19 & Figure 13). One of the reasons has
been related to emphasizing professional courses and
other factors were under-enrolment into technical
courses. This resulted in a fewer number of people with
technical skills.
Table 19: Vocational Training facts
Kenya 2006 2009
Pupils in Vocational Training 22,952 15,672
Enrolment in secondary
vocational, females 14,210 9,061
Teachers in secondary
vocational education 3,270 1,937
Comparative estimations Country/region %
Secondary education, Kenya 58 %
vocational pupils (% women) Sub-Saharan
Africa 40 %
Ratio of pupils in vocational
student to all pupils in
secondary education
Kenya 0.8 %
Sub-Saharan
Africa 5.7 %
Ratio of pupils in vocational
training out of 15-24 year
olds
Kenya 0.3 %
Sub-Saharan
Africa 2.8 %
Note: Kenya’s ratio of pupils in vocational training to all pupils in secondary education were calculated on average for the period 2006-2009, while the sub-Saharan Africa region is an average of the period 2001-2014. The 15-24 year olds are calculated as an average in the period 2005-2015.47 Source: World Bank, Education Statistics
Figure 13: Pupils in vocational training to all pupils in secondary education, 2000-2009, %
Source: World Bank, Education Statistics
Data presented above indicate that the country
produces insufficient trained workers with technical skills
to support a higher labour productivity, industrialization
and economic transformation. Some of the main
challenges of technical and vocational education
training in Kenya are coupled with a bias against
technical courses among youth because many believe
that they are of low value than professional courses
which promise a higher paying job as well as a higher
social status. In addition, the country has experienced a
weakening in the quality of training offered in training
centers as a result of declining number of quality
trainers, a lack of modern and efficient machine and
equipment. This has stymied more youth’s access to the
formal labour market as well as, to some extent,
presented the structural relatively high youth
unemployment.
By the same token, at least 92% have no vocational or
professional skills training which worsens the situation
and limits their chances of fully participating in the
formal sector. On this background, ILO argued that
0
5000
10000
15000
20000
25000
30000
35000
0%
1%
2%
3%
4%
5%
6%
7%
8%
9%
Kenya (%)
Sub-Saharan Africa (%)
Kenya - Enrolment in vocational training (left)

Danish Trade Council for International Development and Cooperation
Labour Market Profile 2016
Kenya 2016 Page 18
there is a weak linkage between education and training
institutions and industry in development of curricula just
as an absence of integrated industrial training and
attachment programs. Moreover, there is a gap
between the level of technology used by industry and
those used by the education and training service
providers to undertake training.48
In practice, the TIVET are unevenly distributed in Kenya.
The institutions are mostly concentrated in economically
endowed counties not in the more arid and semi-arid
areas. Moreover, the training centers often suffer from
under-funding as there are normally no or very small
allocations of funds to technical training centers in the
budget. Finally, there is a lack of relevance in skills
taught that match with occupational and social realities
present in today's economy. Some training centers
continue to teach skills that no longer have a market
and ignore those that do have, according to sources.49
Non-formal TVET sector has been neglected by the
government. The sector has been generally left to civil
societies organizations and few target groups are
reached.
SOCIAL PROTECTION
Kenya has traditional informal and formal social
protection systems. The coverage is high for the workers
from the formal sector at an estimated 98%. In contrast,
the coverage of workers from the informal economy
remains low at 16%.50 A National Social Protection
Policy was approved in 2012.51 The government is
moving towards an integrated social protection system.
There is a wide range of health related interventions,
e.g. the National Hospital Insurance Fund (NHIF)
provides hospital coverage for members and their
dependants. An enhanced package of National Health
Insurance Fund (NHIF) was initiated in 2015 and there
was an increased enrolment membership in 2016
peaking of 5,213,200 workers of whom 1,991,614 are
from the informal economy with access to
comprehensive treatment.
The National Social Security Fund (NSSF) protects
members – both from the formal sector and the informal
economy – against poverty and vulnerability at old
age. Total number of members enrolled into the
compulsory NSSF is about 3,981,300. The institution has
been criticised for giving low retirement benefits and
for 77% of funds being absorbed by administration
costs, giving both employers and employees incentive to
stay out of the NSSF.52
Safety nets programs are implemented by different
public, private or NGO agencies. They tend to have a
median size of 120,000 beneficiaries per program.
Overall, by June 2016, 822,408 households were
benefiting from cash transfers. The types of safety nets
other than relief and recovery are programs and
projects with specified targeted beneficiaries in the
domains social cash transfer, health, education, and
agriculture. During the period from 2013 to 2016
increased funding for the cash transfers from Ksh7.9
billion (US$91 million) to Ksh21.2 billion (US$209
million), respectively. The government launched a
registry to promote transparency in social protection
programs in September 2016. The development of the
new registry is meant to boost allocation of resources
and make sure only rightful beneficiaries access the
kitty.
Through the Social Protection Fund about 3,930 elderly
and vulnerable population are receiving monthly cash
transfers. There are also three active labour market
programs as well as a wide range of other social
empowerment programs and devolved funded
programs.
Around 39% of the total population is covered by
health social protection. This is a higher rate than the
Africa average at 25%. In reality, the government’s
expenditure in health has been on a declining trend at
1.0% per year in the period 2007-2011. Kenya has
also a low health-care expenditure not financed by
private household's out-of-pocket payments in
comparison with the neighbouring countries in the
Eastern African countries (Table 20 & Figure 14).
Table 20: Social protection facts in Kenya, 2010
Indicator Measure Kenya Africa
Total social protection expenditure
% of GDP 2.8 % 4.3 %
Public health care expenditure
% of GDP 1.5 % 2.6 %
Health social protection coverage
% of total population
39 % 25 %*
Trends in government expenditure in health
% change per year
-1.0 % N/a
* The average covers the entire Africa region.
Source: ILO, Social Protection, Statistics and indicators

Danish Trade Council for International Development and Cooperation
Labour Market Profile 2016
Kenya 2016 Page 19
Figure 14: Total health-care expenditure not financed by private household's out-of-pocket payments 1995-2011, Eastern African countries, %
Source: ILO, Addressing the Global Health Crisis: Universal Health
Protection Policies, Social Protection Policy Papers, Paper 13, 2014
Government spending was largely directed to Civil
Service Pensions. All government employees can claim
retirement when they are 60 years old onwards.
Around 16% are active contributors to pension schemes,
which is close to double as high than the sub-Saharan
Africa average (Table 21).
Table 21: Pension Benefits, Coverage and Contributions in Kenya and sub-Saharan Africa, 2010, %
Theme Measure Kenya SSA
Social benefits for active
age % of GDP 0.1 % 0.3 %
Pensionable age receiving
an old age pension (age
60+)
Proportion
of total 7.9 % 22 %
Active contributors to a
pension scheme 15+ 16 % 8.4 %
Active contributors to a
pension scheme
15-64
years 11 % 5.9 %
Source: ILO, Social Protection, Statistics and indicators
GENERAL ECONOMIC PERFORMANCE
Kenya is the largest economy as well as one of the most
dynamic members of the East Africa Community (EAC).
It is a transport regional hub based on a strong private
sector and a low-middle income country. The Gross
Domestic Product (GDP) grew by 5.3% on average in
the period from 2006 to 2015 (Table 22).
Table 22: Key Facts on General Economic Performance in Kenya, 2015
GDP 63.4 billion US$
GDP real growth
(2006-2015, av.) 5.3 %
Doing Business * (2017) +21 change in rank
92 of 190 countries
Human Development Index ** -1 change in rank
146 of 188 countries
Gini Index *** (2008) 42.5
51 of 145 countries
* A high ranking on the Ease of Doing Business Index means the
regulatory environment is more conducive to the start-up and operation
of a local firm.53 Doing Business ranking change is in the period 2016-
2017.
** The Human Development Index (HDI) measures the average of a
long and healthy life, access to knowledge, and a decent standard of
living. HDI ranking change is in the period 2009-2014.
*** A Gini coefficient of 1 (or 100 percent) expresses maximal
inequality among values. This Gini Index ranks the first country with the
highest inequality while the number 145 has the highest equality.
Source: CIA, The World Factbook, Kenya; World Bank, World
Development Indicators; World Bank & IFC, Ease of Doing Business
2016/2017 in Kenya; and UNDP, Human Development Index trends
The GDP per capita growth was hovering above the
region average during the last decade, except a
downturn in 2008 related to a depreciation of the
shilling relative to the US dollar along with a high
inflation (Figure 15). The economic growth is projected
to stay high during 2016 and 2017 based on a
positive outlook to low oil prices, good agriculture
performance, supportive monetary policy, and ongoing
infrastructure investments.54
Figure 15: GDP growth per capita, 2006-2015, Kenya and sub-Saharan Africa, Annual %
Source:World Bank, World Development Indicators;
On a different view, Kenya’s GDP per capita measured
in Purchasing Power Parity (PPP) is below the sub-
Saharan Africa average with a ranking 185 out of 229
countries (1 is highest). The country is slowly curbing this
gap. On the other hand, according to the Gini Index,
the inequality in the distribution of family income has
experienced a drop from 49% in 2005 to 43% in
40%
45%
50%
55%
60%
65%
70%
75%
80%
85%
90%
1995 2000 2005 2006 2007 2008 2009 2010 2011
Burundi Kenya Rwanda
Tanzania Uganda
-3
-2
-1
0
1
2
3
4
5
6
2006 2007 2008 2009 2010 2011 2012 2013 2014 2015Kenya Sub-Saharan Africa

Danish Trade Council for International Development and Cooperation
Labour Market Profile 2016
Kenya 2016 Page 20
2008 (Figure 16). Thus, the country has a relatively
high-medium level of income equality of 51 out of 145
countries, ranking next to Burundi and Israel.
Figure 16: GDP per capita in Purchasing Power Parity (US$) and Gini Index, 2005-2015
Note: The comparison of the inequality in the distribution of family
income (Gini Index) should be interpreted with some reservations due to
diverging sources, but can still be applied as proxy indicators.
Source: World Bank, World Development Indicators and
It has been noted that the Human Development Index
(HDI) ranking changed on a negative value on a margin
from 2009-2014 to 2010-2015 reaching HDI rank 146
out of 188 countries (1 is highest) (Table 22).
The latest measurements of working poor in Kenya were
from 2005. These data showed that 34% of the
population was extremely poor living with less than
US$1.9 per day and 24% were moderately poor living
between US$1.9 and US$3 per day. Stated
differently, 58% of the population lives below US$3
per day. It is interesting to note that the number of
extremely poor grew by 12 percentiles from 1997 to
2005 while the moderately poor’s was flat at 0%. In
the light of a middle-class it was registered that the
near poor and the developing middle class segments
dropped slightly in the same period, that is -4% and -
6%, respectively (Table 23). Factually, Kenya had a
much lower poverty and a higher middle-class during
the 1990s and the 2000s in comparison with the sub-
Saharan Africa average.
Table 23: Poverty and middle-class trends in Kenya, 1997-2005
Estimated poverty line 1997 2005 Growth
Percentile 1997-2005
Extremely poor (<US$1.9 a day)
22 % 34 % 12 %
Moderately poor (≥US$1.9 & <US$3 a day)
24 % 24 % 0 %
Near poor (≥ US$3 & <US$5 a day)
25 % 21 % -4 %
Developing middle class (≥US$5 & <US$13 a day)
23 % 17 % -6 %
Note: The poverty l ine i s based on headcount , i .e. % of
population on living in households with consumption or income per
person below the set poverty line.
Source: World Bank, PovcalNet
Attempts of reverting the poverty growth has been
supported by the relatively high minimum wage
increases along with the coverage of health social
protection, social safety nets and enrolment in
education. It explains, to some extent, the just
mentioned decreasing inequality in the country.
However, this report also shown that the wage
employment has relatively not increased, confronting a
relatively high unemployment rate and a large majority
of the labour force operates in the informal economy
during the 2010s, so far. On this background, the drop
of the middle-class during the 2000s is a signal that the
labour market does not include the continuous high
influx of workers into the modern formal sector. This
challenges the evolution of the middle-class during the
rest of the 2010s and onwards.
The inflation in consumer prices has been relatively high
and volatile in Kenya during the last decade and
hovering above the region average. As an example, in
2011 there was a drastic currency depreciation
followed by a rapid increasing inflation up to 14%. The
inflation decelerated afterwards standing at around
7% during the period from 2013 to 2015 (Figure 17).
As demonstrated on Figure 3 the inflation created a
significant gap between the nominal minimal wage and
the real minimum wage. According to sources, the
Inflation in 2016 has remained within the government
target rate, largely driven by food inflation. Kenya
continues to benefit from low fuel prices and good
rains, a stable macroeconomic environment, and good
monetary policy action.55
48,5
42,5
39
40
41
42
43
44
45
46
47
48
49
0
500
1000
1500
2000
2500
3000
3500
4000
Kenya Sub-Saharan Africa Kenya - GINI Index (rights)

Danish Trade Council for International Development and Cooperation
Labour Market Profile 2016
Kenya 2016 Page 21
Figure 17: Inflation in consumer prices trend 2006-2015, Kenya and sub-Saharan Africa, %
Source:World Bank, World Development Indicators;
Kenya’s capital formation has followed the sub-Sahara
Africa average with a slightly higher stance (Figure 18).
This figure signals how much of the new value added in
the economy is invested rather than consumed; thus,
Kenya is on a positive side in terms of strengthening its
economy and increasing the productivity.
Figure 18: Gross Fixed Capital Formation trend 2006-2015, Kenya and sub-Saharan Africa, % of GDP
Source:World Bank, World Development Indicators;
The Doing Business indexed Kenya as 92 out of 190
countries in 2017, improved pointedly from a 113
ranking in 2016. Not to mention, the country is scoring
better than the sub-Saharan Africa average, but it
remains a lower ranking than countries such as
Botswana (56) and Rwanda (49).
Out of ten indicators, the country still scores quite low
on dealing with construction permits (152), paying taxes
(125) and registering property (121). Especially
starting a business improved (from 150 to 116) and
protecting minority investors (from 112 to 87) improved
their stand. Albeit getting credit fell by three steps on
the ranking it remains the highest indicators of 32 out of
190 countries (see more on Table 24).
Table 24: Kenya’s Ease of Doing Business
Topics 2017 2016 Change
Starting a Business 116 150 34
Dealing with Construction Permits 152 155 3
Getting Electricity 106 127 21
Registering Property 121 122 1
Getting Credit 32 29 3
Protecting Minority Investors 87 112 25
Paying Taxes 125 122 3
Trading Across Borders 105 107 2
Enforcing Contracts 87 85 2
Resolving Insolvency 92 140 48
Note: Ease of doing business index (1=most business-friendly
regulations). Doing Business 2016/17 indicators are ranking from 1
(top) to 190 (bottom) among other countries. The rankings tell much
about the business environment, but do not measure all aspects of the
business surroundings that matter to firms and investors or that affect
the competitiveness of the economy. Still, a high ranking does mean that
the government has created a regulatory environment conducive to
operating a business.
Note: This Doing Business Index has been controversial due to flawed
data in some sections, e.g. undervalued paying taxes.56 However, the
table above can still be used as indicative measurement with
reservations.
Source: World Bank & IFC, Ease of Doing Business 2016/2017 in Kenya The governance environment in Kenya has experienced
some small improvements during the period from 2010
to 2015 in terms of rule of law, government
effectiveness as well as voice and accountability;
moving towards a medium level. The political stability
continues to be very fragile and the control of
corruption lingers with a very low ranking on the
Governance Indicators (see more on Table 25).
Table 25: Kenya's Governance Indicators, 2010-2015 Score, Percentiles and Change
Year Voice &
Accountability
Political
Stability
Government
Effectiveness
2010 -0.23/40%
-1.17/13%
-0.34 / 37%
2015 -0.18/42% -1.29/9.1% -0.29 / 44%
Year Regulatory
Quality Rule of Law
Control of
Corruption
2010 -0.07/50%
-0.99/ 17%
-0.93 / 17%
2015 -0.29/43% -0.49/ 36% -1.01 / 14%
Note: The Governance Indicators score from ‐2.5 to 2.5 while the
percentiles rank from 0 (lowest) to 100 (highest).57
Source: World Bank, Worldwide Governance Indicators
0
5
10
15
20
25
30
2006 2007 2008 2009 2010 2011 2012 2013 2014 2015
Kenya Sub-Saharan Africa
15
16
17
18
19
20
21
22
23
24
2006 2007 2008 2009 2010 2011 2012 2013 2014 2015
Kenya Sub-Saharan Africa

Danish Trade Council for International Development and Cooperation
Labour Market Profile 2016
Kenya 2016 Page 22
TRADE
Kenya plays an important role in East Africa as a
regional centre for trade and finance. The country has
a quite visible trade gap with an unfavourable balance
of trade, i.e. export of 16% of GDP and import of
29% in 2015. To point out, Kenya’s export is relatively
low in comparison with the region average as well as
on a declining trend during the last decade. The foreign
direct investment (FDI) has been very low but has been
on a rise in recent years peaking at 2.3% of GDP in
2015, and reaching the region average (see more on
Table 26 & Figure 19)
Table 26: Trade and Foreign Direct Investment in Kenya, 2015
Exports US$10 billion
16 % of GDP
Imports US$18 billion
29 % of GDP
FDI Flow US$1.4 billion
2.3 % of GDP
FDI Stock (2016) US$5.5 billion
8.0 % of GDP
Source: CIA, The World Factbook, Kenya; World Bank, World
Development Indicators
These above mentioned trade trends have been related
to the real appreciation of the Kenyan currency which
eroded the competitiveness and shifting the export
sector. Among others, there was a fast increase in the
export of refined petroleum, but the downturn of the
international oil prices has affected negatively on the
export sector. Other challenges in Kenya include the
underdeveloped infrastructure and lengthy shipping
times. On the other hand, Kenya, in collaboration with
Ethiopia and South Sudan, intended to begin
construction on a transport corridor and oil pipeline into
the port of Lamu in 2014.
Figure 19: Trade and Foreign Direct Investment trends 2006-2015, % of GDP
Source:World Bank, World Development Indicators
The country's main export market is the European Union
(EU) followed by Uganda, Tanzania and the United
States (Figure 20).
Figure 20: Kenya's main export markets, 2015
Source: European Commission, DG TRADE, Bilateral Relations, Statistics
Agricultural products are the majority of the country’s
export but refined petroleum is on a rise (Figure 20).
Figure 21: Kenya’s main products share of exports, 2014
Source: MIT, The Observatory of Economic complexity, What does
Kenya Export
Trade Agreements
Kenya is part of the EAC that includes: Burundi,
Rwanda, Tanzania & Zanzibar and Uganda. The EAC
free trade agreement from 1999 contains a labour
provision with cooperation on employment and working
conditions with an emphasis on gender equality and
discriminatory law and practices. Likewise, the labour
provision of the COMESA agreement extends to
cooperation on employment conditions and labour
law.58
In 2005 the EAC established a customs union and in
2010 the EAC agreed to establish full common market
with free movement for workers, goods, services and
capital.
0
10
20
30
40
50
2006 2007 2008 2009 2010 2011 2012 2013 2014 2015Kenya - Export Kenya - ImportKenya - FDI SSA - ExportSSA - Import SSA - FDI
EU; 21%
Uganda; 11%
Tanzania; 8%
United States; 8%
Zambia; 6%
Pakistan; 4%
Congo; 4%
Others; 39%
Tea 16%
Cut Flowers 12%
Coffee 4%
Refined Petroleum
12%
Legumes 3%
Other 53%

Danish Trade Council for International Development and Cooperation
Labour Market Profile 2016
Kenya 2016 Page 23
Kenya is also part of the 2000 Cotonou Agreement
between EU and African, Caribbean and Pacific (ACP)
countries, which reaffirms commitment to ILO’s
Fundamental Conventions and includes a labour
provision on cooperation on various labour and social
issues.
Freedom of association and collective bargaining is
protected in the EAC common market in the sense that
an EAC migrant worker has equal rights as a national.59
The free movement of labour within the EAC opens up
questions of how to achieve equal opportunities and
equal social and labour rights for migrant workers, for
example if workers can bring pensions with them across
borders. On the other hand, the free movement of
labour is also a source of concern in some of the EAC
countries, as the countries workforces have differences
in productivity and educational level. However, the
actual implementation of the economic integration have
slowed down the last few years especially with regards
to lifting barriers to trade and free movement of
labour. Although formal tariffs are increasingly being
abolished, trade is still challenged by non-tariff
barriers and corruption.
The objective of the East African trade union movement
is to safeguard workers’ interests in the EAC, ensure that
ILO standards are upheld and member states’ labour
policies are harmonized and the tripartite model is
institutionalized, while the free movement of labour is
promoted. The movement reached observer status in the
EAC in 2009, and along with employers’ organizations
they participate in ministerial summits, sectoral summits,
and other summits that involve labour market issues.
However, the EAC council of Ministers responsible for
Labour has not been convened since 2010.
Through the EAC, Kenya can export duty and quota
free to EU since 2008, and will have to gradually
remove duties and quotas from EU exports to Kenya on
most products, except the products deemed to need
protection from EU imports. These include agricultural
products, wines and spirits, chemicals, plastics, wood
based paper, textiles and clothing - the products which
dominates Kenya’s exports to EU.
The EAC commits Kenya to adopt measures to the free
movement of persons and labour from the other five
member states. Kenya has abolished work permit fees
for EAC citizens, but rejection rates on work permit
applications are still reported to be high. For migrants
from other countries an entry permit is granted if the
foreigner is of benefit to Kenya, and an employer who
employs a foreigner must submit a report to the
authorities.
Since 2001, Kenya has benefitted from the United
States’ African Growth and Opportunity Act (AGOA),
which is a Generalised System of Preferences. It allows
duty and quota free access for some products.
Export Processing Zones (EPZ)
Investors at EPZs in Kenya are entitled to a 10 year-
corporate tax holiday and 25% tax thereafter; a 10-
year withholding tax holiday, stamp duty exemption,
100% investment deduction on initial investment
applied over 20 years and VAT exemption on
industrial inputs. The investors are restricted to selling
only 20% of their produce to the Kenyan market while
80% is exported.
Prior to 2005, the Kenyan government did not allow
EPZ workers the freedom to unionize or engage in
collective bargaining. It triggered strikes during the
2000s. Due to reforms of the labour laws, including the
right to organize and bargain collectively, apply in the
EPZs. On the other hand, labour standards are often
worse in EPZs.
The Factories Act deals with the health, safety and
welfare of an employee, who works in a factory. Many
exemptions to the labour law are made, for example
with a law that prevents women from working in
industrial activities at night. Most firms in EPZs have still
refused to recognize trade unions and obstructed their
efforts to organize workers. The use of temporary
employment has an effect on workers’ ability to
unionize. Overall, union membership of workers within
the EPZs has remained low, i.e. an estimated 14% of
workers were unionized.60 As an example, the Kenya
Textile Workers' Federation adds that getting workers
to join a union is difficult because the managers in EPZ
companies use nonregistered organizations to recruit
casuals on their behalf.61
The EPZs are mainly in the sectors of clothing/garments
manufacturing, pharmaceuticals, and processing of
tea.62 Around 54% of EPZ exports go to the United
States under the AGOA.
The gazetted EPZs in Kenya increased from 42 in 2010
to 52 in 2014 and the employed grew by 33% from
31,502 to 46,738 in the same period (Figure 22). To
put it another way, the EPZs employment covered 2.0%
of the total wage employment in Kenya in 2014. The

Danish Trade Council for International Development and Cooperation
Labour Market Profile 2016
Kenya 2016 Page 24
EPZs employment of expatriates was very low at 1.1%
of the total EPZ employment.
Figure 22: Kenya’s performance on EPZ key indicators, 2010-2014
Source: Export Processing Zones Program, Annual Performance Report,
2014
The average wage in the Kenya EPZs was lower than
the minimum wage with a gap on around 18%. It was
noted that the EPZ average wage increased by 41% in
the period from 2010 to 2014 (Figure 23).
Figure 23: Average monthly minimum wage and EPZ wage in Kenya, 2010-2014, Schillings
Note: Average monthly EPZ wage covers local employees.
Source: Export Processing Zones Authority, Annual Performance Report
& ILO, Global Wage Report 2016/17
A study from 2013 investigated the effect of trade
unions on employees’ welfare with a specific focus on
EPZ Tailors and Textile Workers Union affiliated
companies in the area of Athi River. The study revealed
that collective bargaining has affected employees'
wages and benefits positively.63 It was estimated that
wages within the EPZs on average were 22% higher
than minimum wage. Although the average wage in
Kenyan EPZs is lower than in many other African EPZs, it
is still higher than in Asian countries, such as Bangladesh,
China, and India.
Collective bargaining in Kenyan EPZs is still fragile and
improvements of working conditions remains critical, e.g.
workers within the Kenyan EPZs have put up with long
hours, unpredictable work and many are only hired on
a casual basis. According to sources, inspectors often
found violations of health and safety conditions in the
EPZs.64
0
5000
10000
15000
20000
25000
30000
35000
40000
45000
50000
0
10
20
30
40
50
60
2010 2011 2012 2013 2014
Gazetted zones (left) Employed workers (right)
0
2000
4000
6000
8000
10000
12000
14000
16000
18000
2010 2011 2012 2013 2014
EPZ average monthly wages Minimum wage

Danish Trade Council for International Development and Cooperation
Labour Market Profile 2016
Kenya 2016 Page 25
APPENDIX: ADDITIONAL DATA Table 27: Registered Trade Union membership in Kenya, 2016
Trade unions Total members Women
members
Central Organisation of Trade Unions (COTU (K))
Amalgamated Union of Kenya Metal Workers 7,192 1,320 Kenya Petroleum Oil Workers Union 10,371 2,690 Bakery, Confectionery Manufacturing & Allied Workers Union 29,700 14,600 Kenya Building, construction, Timber, Furniture & Allied Trades Employees Union 70,780 3,410 Kenya Chemical & Allied Workers Union 5,560 1,860 Kenya Engineering Workers Union 39,600 1,940 Kenya Game Hunting & Safari Workers Union 6,540 1,090 Kenya Union of Printing, Publishing, Paper, Manufacturing & Allied Workers 7,065 1,410 Kenya Plantation & Agricultural Workers Union 750,550 417,000 Kenya Scientific, Research, International, Technical & Allied Institutions 3,340 885 Banking Insurance & Finance Union 7,390 3,000 Communications Workers Union (CWU) 12,673 5,950 Railway Workers Union 1,065 185 Tailors & Textiles Workers Union 257,210 193,700 Transport & Allied Workers Union 13,302 445 Kenya Union of Entertainment & Music Industry Employees 2,450 1,100 Kenya Union of Domestic, Hotels, Educational Institutions, Hospitals & Allied Workers 305,200 162,400 Kenya Union of Sugar Plantation Workers 194,017 67,100 Kenya Local Government Workers Union 196,040 83,300 Kenya Shipping, Clearing & Warehouses 3,466 950 Seafarers Workers Union 277 68 Kenya Quarry & Mine Workers Union 16,612 3,920 Kenya Electrical Trades Allied Workers Union 65,216 11,350 Kenya Shoe & Leather Workers Union 7,255 1,395 Kenya Jockey, Betting Workers Union 1,365 900 Union of National, Research Institutes 16,539 3,098 Kenya National Private Security Workers Union 155,544 41,500 Kenya Salon and Beauty Union 13,010 8,620 Kenya Hotels & Allied Workers Union 2,295 150 Kenya Union of Commercial, Food & Allied Workers 120,558 73,500 Kenya Aviation and Allied Workers Union 660 200 Kenya Union of Journalists 6,130 2,500 Kenya Long Distance Truck Drivers and Allied Workers Union 2,947 120 Kenya National Union of Nurses 61,900 36,100 Kenya Glass Workers Union 8,100 3,210 Kenya Water and Sewerage Workers Union 5,963 2,890 Kenya Union of Pre-Primary Education Teachers 2,140 1,705
Kenya Union of Post-Primary Education Teachers 94,700 51,300 Kenya Aviation Workers Union 4,575 2,390 Kenya Airline Pilots Association 570 90 Kenya Medical Practioners & Dentists Union 8,300 2,500 Kenya Private Universities Workers Union 600 120 Kenya Dock Workers Union 3,950 765 The Doctors Union and Private Universities Union - -
Trade Union Congress of Kenya (TUC-Ke)
Kenya National Union of Teachers 160,000 - Union of Kenya Civil Servants 23,300 10,950 University Academic Staff Union 3,680 1,870 Kenya Universities Staff Union 2,246 1,750 Kenya Union of Employees of Polytechnics - -
Independent Informal Economy Unions / associations partnering with COTU (K)
Matatu Workers Association 1,310 90 Women in Music Association N/A N/A Jua Kali Traders Association 1,110 10 Gikomba Traders Association 1,750 1,400 Public Transport Operators Union 650 9 Matatu Workers Union 1,200 15 Matatu Drivers and Conductors Workers Association 250 3 Nairobi Bodaboda Riders Association 1,600 0 Kenya Union of Employees of Voluntary and Charitable Organizations 35 25
Source: COTU; TUC-Ke; the LO/FTF Council; and the Kenya Economic Survey (2016).
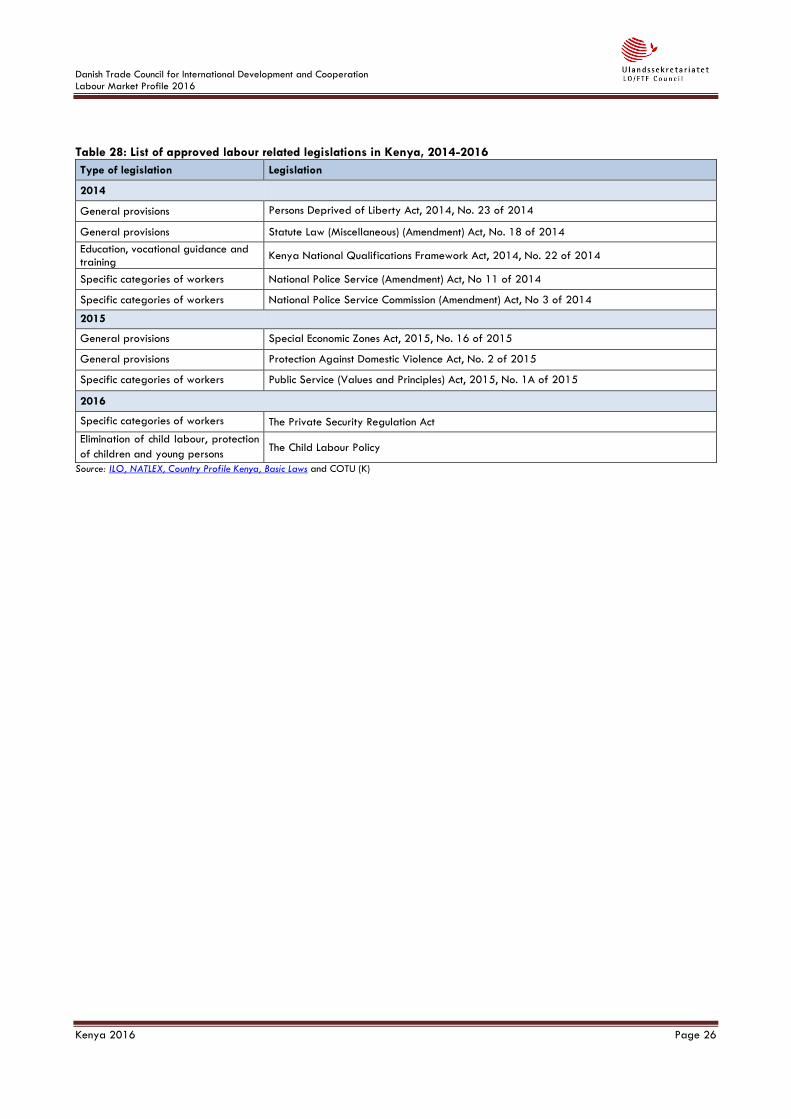
Danish Trade Council for International Development and Cooperation
Labour Market Profile 2016
Kenya 2016 Page 26
Table 28: List of approved labour related legislations in Kenya, 2014-2016
Type of legislation Legislation
2014
General provisions Persons Deprived of Liberty Act, 2014, No. 23 of 2014
General provisions Statute Law (Miscellaneous) (Amendment) Act, No. 18 of 2014
Education, vocational guidance and training
Kenya National Qualifications Framework Act, 2014, No. 22 of 2014
Specific categories of workers National Police Service (Amendment) Act, No 11 of 2014
Specific categories of workers National Police Service Commission (Amendment) Act, No 3 of 2014
2015
General provisions Special Economic Zones Act, 2015, No. 16 of 2015
General provisions Protection Against Domestic Violence Act, No. 2 of 2015
Specific categories of workers Public Service (Values and Principles) Act, 2015, No. 1A of 2015
2016
Specific categories of workers The Private Security Regulation Act
Elimination of child labour, protection
of children and young persons The Child Labour Policy
Source: ILO, NATLEX, Country Profile Kenya, Basic Laws and COTU (K)

Danish Trade Council for International Development and Cooperation
Labour Market Profile 2016
Kenya 2016 Page 27
Table 29: Ratified ILO Conventions in Kenya, 2016
Subject and/or right Convention Ratification date
Fundamental Conventions
Freedom of association and collective bargaining
C087 - Freedom of Association and Protection of the Right to Organise, 1948 1964
C098 - Right to Organise and Collective Bargaining Convention, 1949 Not ratified
Elimination of all forms of forced labour
C029 - Forced Labour Convention, 1930 1964
C105 - Abolition of Forced Labour Convention, 1957 1964
Effective abolition of child labour
C138 - Minimum Age Convention, 1973 1979
C182 - Worst Forms of Child Labour Convention, 1999 2001
Elimination of discrimination in employment
C100 - Equal Remuneration Convention, 1951 2001
C111 - Discrimination (Employment and Occupation) Convention, 1958 2001
Governance Conventions
Labour inspection C081 - Labour Inspection Convention, 1947 1964
C129 - Labour Inspection (Agriculture) Convention, 1969 1979
Employment policy C122 - Employment Policy Convention, 1964 Not ratified
Tripartism C144 - Tripartite Consultation (International Labour Standards) Convention, 1976 1990
Up-to-date Conventions
Working time C014 - Weekly Rest (Industry) Convention, 1921 1964
Wages C094 - Labour Clauses (Public Contracts) Convention, 1949 1964
C131 - Minimum Wage Fixing Convention, 1970 1979
Migrant workers C097 - Migration for Employment Convention (Revised), 1949 1965
C143 - Migrant Workers (Supplementary Provisions) Convention, 1975 1979
Social security C118 - Equality of Treatment (Social Security) Convention, 1962 1971
Rural workers and industrial relations
C135 - Workers' Representatives Convention, 1971 1979
C141 - Rural Workers' Organisations Convention, 1975 1979
Vocational guidance and training
C140 - Paid Educational Leave Convention, 1974 1979
C142 - Human Resources Development Convention, 1975 1979
Seafarers C146 - Seafarers' Annual Leave with Pay Convention, 1976 1990
MLC - Maritime Labour Convention, 2006 2014
Specific categories of workers
C149 - Nursing Personnel Convention, 1977 1990
Note: Fundamental Conventions are the eight most important ILO conventions that cover four fundamental principles and rights at work. Equivalent to
basic human rights at work.
Governance Conventions are four conventions that the ILO has designated as important to building national institutions and capacities that serve to
promote employment. In other words, conventions that promotes a well-regulated and well-functioning labour market.
In addition, there are 71 conventions, which ILO considers “up-to-date" and actively promotes.
Source: ILO, NORMLEX

Danish Trade Council for International Development and Cooperation
Labour Market Profile 2016
Kenya 2016 Page 28
REFERENCE 1 COTU-Kenya Affiliates Membership 2 http://www.fke-kenya.org 3 ILO, Federation of Kenya Employers: Case Study, Working Paper on the Informal Economy, 2002/11 4 MoLSS&S, Sessional Paper No. 4 of 2013 on Employment Policy and Strategy for Kenya, 2013 5 ILO, DIALOGUE, National Labour Law Profile: Kenya, June 2011 6 U.S. Department of State, Annual Country Reports on Human Rights Practices, 2016 7 ITUC, Survey of violations of trade union rights, Kenya, Legal 8 Janna Besamusca & Kea Tijdens, Comparing collective bargaining agreements for developing countries, 2015 9 ILO, NATLEX, Kenya, The Constitution of the Republic of Kenya 10 ILO, NATLEX, Kenya, The Employment Act (No. 11 of 2007) 11 U.S. Department of State, Annual Country Reports on Human Rights Practices, 2015 12 ILO, NATLEX, Kenya, The Labour Institutions Act (No. 12 of 2007) 13 ILO, NATLEX, Kenya, The Labour Relations Act (No. 14 of 2007) 14 ILO, NATLEX, Kenya, Occupational Safety and Health Act (No. 15 of 2007) 15 Kenya Gazette Supplement No. 179 (Acts No. 45), December 27, 2013 16 ILO, NATLEX, Country Profile Kenya 2016 17 ITUC, Survey of violations of trade union rights, Kenya 18 U.S. Department of State, Annual Country Reports on Human Rights Practices in Kenya, 2015 19 ILO, NATLEX, Country Profile, Ratifications for Kenya 20 ITUC, Global Rights Index, The World’s Worst Countries for Workers, 2016 21 ITUC, Survey of violations of trade union rights, Kenya 22 U.S. Department of State, Annual Country Reports on Human Rights Practices, 2015 23 ILO, Press Release, ILO calls for strengthening labour inspection worldwide, 16 November 2006 24 U.S. Department of State, Annual Country Report on Human Rights Practices in Kenya, 2015 25 UNDP, HIV/AIDS Tribunal of Compendium of cases, 2016 26 AIDS Strategic Framework, 2016. 27 UNDP, Kenya’s Youth Employment Challenges, January 2013 28 UNDP, Kenya’s Youth Employment Challenges, January 2013 29 World Bank, World Bank Approves US$150 Million Support for Kenya’s Youth, May 2016 30 The Guardian, Tackling youth unemployment in Kenya through public-private collaboration, March 2, 2016 31 IOM, Migration in Kenya: A country profile 2015 32 AfDB, Recognizing Africa’s Informal Sector, March 2013 33 WIEGO, Statistics on Informal Employment in Kenya, Wiego Statistical Brief No 5, 2011 34 WageIndicator.org, WageIndicator survey 2012, Wages in Kenya, 2012 & ILO, Key Indicators of the Labour Market Database 35 ILO, Unprotected labour: What role for unions in the informal economy?, Labour Education, No. 127, 2002/2 36 U.S. Department of State, Annual Country Reports on Human Rights Practices, 2013 37 U.S. Department of State, Annual Country Report on Human Rights Practices in Kenya, 2015 38 UNESCO, Gender Inequalities in Kenya, 2006
39 ILO, NORMLEX, Labour Standards, Observation (CEACR) - adopted 2013, published 103rd ILC session, 2014 40 World Policy Blog, Reducing Youth Unemployment in Kenya, October 15, 2013 41 Youth Enterprise Development Fund, About YEDF 42 Simon Amenya Simonsiro et al., An analysis of the challenges facing Youth Enterprise Development Fund: A case study of Nyaribari Chache constituency, 2011 43 COTU (K), KENYANS SEEKING JOBS ABROAD 44 European Commission, DG DEVCO, Kenya Country Strategy Paper, 2008-2013 45 Anthony Wambugu, The effects of educational attainment on employment outcomes in Kenya, International Journal of Education Administration and Policy Studies Vol. 3(7), pp. 94-102, July 2011 46 John Nyerere, Technical & Vocational Education and Training (TVET) Sector Mapping in Kenya, For the Dutch Schokland TVET programme Edukans Foundation, Zero Draft, 2009 47 UNdata, Population aged 15-24 (thousands) 48 ILO, Kenya Decent Work Country Programme 2013-2016 49 KENYAPLEX, Challenges facing technical and vocational education and training in Kenya, 2012 50 USAID, Case Study: Kenya National Hospital Insurance Fund (NHIF), June 9, 2014 51 Republic of Kenya, Kenya National Social Protection Policy, 2011 52 Republic of Kenya, Ministry of State for Planning, Kenya Social Protection Sector Review, June 2012 53 World Bank & IFC, Doing Business, Methodology 54 World Bank, Kenya Overview, February 2017 55 World Bank, Kenya Overview, February 2017 56 ITUC, WORLD BANK’S DOING BUSINESS MAKES UNSUBSTANTIATED ASSERTIONS, REWARDS COUNTRIES THAT HAVE NOT RATIFIED ILO CONVENTIONS, SEPTEMBER 10, 2008, & ILO, DEREGULATING LABOUR MARKETS: HOW ROBUST IS THE ANALYSIS OF RECENT IMF WORKING PAPERS?, CONDITIONS OF WORK AND EMPLOYMENT SERIES NO. 47, 2014, AND THE ECONOMIST, THE DOING BUSINESS REPORT, PULLING RANK, SEPTEMBER 26TH 2015 57 World Bank, The Worldwide Governance Indicators,
Methodology and Analytical Issues, Policy Research Working
Paper 5430, 2010 58 Ebert & Posthuma, ILO, IILS, 2010, Labour provisions in trade agreements: current trends and provisions 59 EAC, Annex on the Free Movement of Workers, November 2009 60 Vastveit, Lene Kristin, Export Processing Zones in Sub-Saharan Africa – Kenya and Lesotho, 2013 61 RefWorld, 2011 Annual Survey of violations of trade union rights - Kenya 62 ILO database on export processing zones (Revised), 2007 63 Ireri, Leah Muthoni, Effects of trade union activities on employee's welfare: a case of Epz tailors and textile workers union (TTWU) affiliated companies in Athi River, 2013 64 U.S. Department of State, Annual Country Reports on Human Rights Practices in Kenya, 2015