Embed Size (px)
Citation preview

1
LABOUR MIGRATION TO KERALA: A STUDY OF TAMIL MIGRANT LABOURERS IN KOCHI
SURABHI K.S. N.AJITH KUMAR
Working Paper No.16
October 2007
Centre for Socio-economic & Environmental Studies (CSES) Khadi Federation Building, NH By-Pass, Padivattom, Kochi – 682 024, Kerala Tel: +91 484 2805107, 2805108 E-mail: [email protected], www.csesindia.org
2
LABOUR MIGRATION TO KERALA: A STUDY OF TAMIL MIGRANT LABOURERS IN KOCHI
ABSTRACT
Kerala is witnessing large inflow of migrant labour from different parts of the country in recent
years. Though labourers from states as far as West Bengal, Bihar, Uttar Pradesh and Orissa
now flock to Kerala, those from the neighbouring state of Tamilnadu out number others by a big
margin. Higher wages for unskilled labour in the state, large opportunities for employment and
shortage of local labour, paradoxically despite the high unemployment rate in the state, led to
the massive influx of migrant labour to the state. With signs of rapid growth of state’s economy
and the increase in activities particularly in the infrastructure and construction sectors, the in-
migration is expected to grow faster in the coming years.
The study is of a pilot nature on internal migration in Kerala with a very limited sample size of
100 casual labourers from Tamilnadu seeking work at selected centres on a day to day basis.
The sample was drawn from the city of Kochi, which, it is believed accounts for the largest
number of in-migrants in view of its fast expansion in economic activities.
The study concludes that the migrant labourers get much higher monetary wages than in their
native places. But, they work for longer hours and their real wages may be lower as they have
to incur higher cost of living in Kochi on food, shelter and transport. They live in shanty
houses/rooms in slum like localities often on a sharing basis. A few of them live on verandas of
shops. They have limited access to sanitation facilities and safe water. Their practices of
waste disposal pose problems of public health and environment. Their working and living
conditions and habits make them suffer from a number of diseases. But their access to public
services like health and education is limited. They enjoy very limited protection from labour
laws. They also face problems of social integration in Kerala. There are reports of large
number of human rights violations. With the possibility of much larger influx in view of the large
scale expansion of economic activities in the State, the migrants can put heavy pressure on
urban infrastructure, environment and public services. They may also pose many challenges in
governance particularly of urban areas. Our study highlights the strong case for a much larger
multidisciplinary study on this emerging phenomenon in the State.

1
LABOUR MIGRATION TO KERALA:
A STUDY OF TAMIL MIGRANT LABOURERS IN KOCHI
1. Introduction Kerala is witnessing large inflow of migrant labour from different parts of the country in the
recent years. Though labourers from states as far as West Bengal, Bihar, Uttar Pradesh and
Orissa now flock to Kerala, those from Tamil Nadu outnumber others by a big margin. Within
the state, Ernakulam accounts for the largest number of migrants. While a relatively small
section of the migrants from other states are professionals and skilled workers, large majority of
them are unskilled or semi skilled workers engaged in construction, road works, pipe laying
etc1. Of late the migrants have also entered agriculture, labour intensive sub sectors of
industry and many services. The shortage of local labour, higher wages for unskilled labour in
the state and opportunities for employment led to the massive influx of migrant labour to the
state. It is interesting to note that while many Malayalees migrate to the ‘Gulf’ countries (Middle
East) both for skilled and unskilled work, many of the unskilled labourers from other parts of the
country consider Kerala as their ‘Gulf’. With signs of rapid growth of state’s economy and the
increase in activities particularly in the infrastructure and construction sectors, the in-migration
is expected to grow faster in the coming years.
2. Migrants in Kerala: What the Census and National Sample Survey Tell Us
Unlike in China, migrants are not required to be registered in India either at the place of origin
or at the place of destination2. In the absence of such a system, the two major sources of data
on internal migration in India are the Census-2001 (tabulated in D Series) and the National
Sample Survey for 1999-2000 (NSS)3. It may be noted that Census and NSS capture only
1 The distinction between skilled labour and unskilled labour is very important because the two groups interact with labour market differently. Skilled workers face fewer problems given their qualifications and bargaining power.
2 Ram B. Bhagat, “Conceptual Issues in Measurement of Internal Migration in India”, Paper Presented in 25th IUSSP International Conference held in Tours, France, 18-23, July 2005.
3 The latest report on migration is “Migration in India- 1999-2000", Report No. 470, NSSO 55th Round, September 2001.

2
permanent and semi-permanent migration. They fail to capture fully the short duration migrants
discussed in this paper because of their floating character4.
One way of categorising the migrants in the Census of India is by place of birth5. As per this
categorisation, migrants are classified into:
i. Those who migrated from other districts of the state (intra-state migration)
ii. Those who migrated from other states (inter-state migration)
According to the Census 2001, 1.3 per cent of the population of Kerala are migrants (by place
of birth) from other states. The largest number of in-migrants in the state is from the
neighbouring state of Tamil Nadu. Significant number of migrants also came from Karnataka.
While 67.8 per cent of those who have migrated to Kerala from other states had their place of
birth in Tamil Nadu, 13.5 per cent had their place of birth in Karnataka. Other regions from
where people have migrated to Kerala include Maharashtra (4.5 %), Andhra Pradesh (2.3 %),
Pondicherry (2.1%), Uttar Pardesh (1.4 %) and West Bengal (1.0%) (See Table 1). The Table
also indicates that 49.1 per cent of the migrants from other states are female migrants.
4 Census provides data on migrants based on place of birth and place of last residence. If the place of birth or place of last residence is different from the place of enumeration, a person is defined as a migrant. In the NSS, a member of the sample household is treated as a migrant if he/she had stayed continuously for at least six months in a place (village/town) other than the village/town where he/she was enumerated. For a discussion on reasons for the under-estimation of migrants, see Ravi Srivastava and S.K.Sasikumar, “An Overview of Migration in India, its Impacts and Key Issues”, paper presented at the Regional Conference on Migration, Development and Pro-Poor Policy Choices in Asia, 22–24 June 2003, Dhaka, Bangladesh.
5 The other classification in the Census is based on place of last residence.

3
Table 1: Statistics on Migrants (by place of birth) from other states/UTs in Kerala
Number of Migrants
State/Union Territory
Male Female Persons
Share of state/UT in
in-migration to Kerala
Share of Female
migrants
Tamil Nadu 148,021 131,681 279,702 67.75 47.08
Karnataka 22,037 33,648 55,685 13.49 60.43
Maharashtra 8,820 9,648 18,468 4.47 52.24
Andhra Pradesh 4,970 4,472 9,442 2.29 47.36
Pondicherry 3,612 5,157 8,769 2.12 58.81
Uttar Pradesh 3,331 2,556 5,887 1.43 43.42
West Bengal 2,666 1,566 4,232 1.03 37.00
Rajasthan 2,150 1,526 3,676 0.89 41.51
Gujarat 1,597 1,797 3,394 0.82 52.95
Bihar 2,045 1,292 3,337 0.81 38.72
Orissa 2,328 999 3,327 0.81 30.03
Delhi 1,458 1,555 3,013 0.73 51.61
Madhya Pradesh 1,203 1,277 2,480 0.60 51.49
Punjab 780 789 1,569 0.38 50.29
Haryana 667 750 1,417 0.34 52.93
Assam 671 508 1,179 0.29 43.09
Jharkhand 634 492 1,126 0.27 43.69
Chhatisgargh 493 561 1,054 0.26 53.23
Lakshadweep 606 262 868 0.21 30.18
Jammu & Kashmir 375 301 676 0.16 44.53
Goa 291 363 654 0.16 55.50
Uttaranchal 244 276 520 0.13 53.08
A & N Islands 261 276 537 0.13 51.40
Himachal Pradesh 219 249 468 0.11 53.21
Nagaland 162 131 293 0.07 44.71
Manipur 130 101 231 0.06 43.72
Chandigargh 115 101 216 0.05 46.76
Arunachal Pradesh 115 92 207 0.05 44.44
Meghalaya 72 85 157 0.04 54.14
Sikkim 40 34 74 0.02 45.95
Mizoram 50 40 90 0.02 44.44
Tripura 47 38 85 0.02 44.71
Daman & Diu 5 7 12 0.00 58.33
Dadra & Nagar Haveli 4 0 4 0.00 0.00
Total 210,219 202,630 412,849 100.00 49.08 Source: compiled from Census of India 2001- D Series.
The NSS data, which differs from the census data due to differences in definition of migrant,
also points to the massive inflow of migrants from other states to Kerala. According to NSSO
data, migrants to the State in 1999-2000, numbered 10,05,000. It may be noted that both these

4
surveys were conducted 5-6 years back. It is highly probable that larger number of people has
migrated during the last few years.
According to Census 2001, among the districts, Ernakulam district, where Kochi is located,
recorded the highest inflow of migrants from other states (See Table 2).
Table 2: Distribution of Migrants from Other States/UTs in the Districts of Kerala
District No.of in-migrants
Share of in-migrants
Ernakulam 55977 13.56
Idukki 53056 12.85
Thiruvananthapuram 48575 11.77
Palakkad 47955 11.62
Kasargod 31884 7.72
Kannur 28115 6.81
Thrissur 25358 6.14
Kozhikode 23118 5.60
Malappuram 22092 5.35
Wayanad 18710 4.53
Kollam 16797 4.07
Kottayam 16349 3.96
Pathanamthitta 13683 3.31
Aleppey 11180 2.71
Total 412849 100.00 Source: compiled from Census of India 2001- D Series.
Nearly 60 per cent of the migrants from other states in Ernakulam district came from the
neighbouring state of Tamil Nadu. Next in importance are the migrants from Maharashtra and
Karnataka (See Table 3).

5
Table 3: Migrants (by Place of Birth) from other States/UTs in Ernakulam District
State Persons Share of in-migrants
Tamil Nadu 33,146 59.21
Maharashtra 4,120 7.36
Karnataka 3,456 6.17
Uttar Pradesh 2,349 4.20
Andhra Pradesh 2,286 4.08
Bihar 1,193 2.13
West Bengal 1,116 1.99
Orissa 1,097 1.96
Rajasthan 1,026 1.83
Gujarat 934 1.67
Haryana 843 1.51
Delhi 755 1.35
Punjab 600 1.07
Other states and UTs 3056 5.46
Total 55,977 100.00 Source: compiled from Census of India 2001- D Series.
3. Tamil Workers in Kochi
Tamil unskilled workers are broadly of two types viz., those working on contract basis and
those seeking work in the labour market on a day to day basis. While the former works under a
contractor or an agent for a fixed period of time, the latter waits for the employer almost every
day in some of the centres in Kochi which have become literally “labour markets”. Some of the
centres are: Vathuruthy, Kadavanthra Junction, Kaloor Junction, Market Junction in Banerjee
Road, Edappally and Thrikakkara . One can also find spatial concentration of migrants’ dwelling
places in certain neighbourhoods such as Vathuruthy, Vazhakkala, Edappally and Thrikkakara.
Discussions with some of the employers and contractors indicate that there is a preference for
migrant workers over local labour because of the former’s willingness to work for longer hours.
There is also a feeling among the contractors and employers that the migrant workers are more
obedient and non-complaining than their Malayalee counterparts.
4. Objectives of the Study
� To understand the socio-economic characteristics of Tamil migrant labourers in Kochi
and the push and the pull factors taking them to Kochi
� To understand their working and living conditions

6
� To examine the present and future implications of large scale in-migration on
governance particularly of urban areas
5. Methodology
The study is based primarily on a sample survey conducted among Tamil migrant workers in
Kochi. Only those who do not possess a Ration Card in Kerala were included in our survey.
The study is of a pilot nature on internal migration in Kerala with a very limited sample size of
100 casual workers, seeking work in the labour market on a day-to-day basis. Equal number of
male and female workers was selected. The respondents were selected randomly from some
of the major centres in the city of Kochi where the migrant workers wait for the employers. The
present study did not cover migrants working on regular contract basis6. Most of those waiting
for jobs in these labour markets are unskilled workers. Pre-tested semi-structured schedule
was employed for collecting information from the respondents. The sample survey was
supplemented by in-depth interviews with a few migrant workers, employers and local labour.
6. Findings of the Study
The findings of the sample survey are presented in the following section.
6.1 Place of Origin
Table 4 provides the details about the native districts of the respondents. Of the 30 districts in
Tamil Nadu, migrants from only 13 districts found a place in the sample. Of this, migrants from
neighbouring Dindigul district (a district with high incidence of poverty according Tamil Nadu
Human Development Report 2003) constitute more than half (53 per cent) of the sample.
Other districts found to have significant representation in the sample include Tiruchirappally (16
per cent), Theni and Madurai (8 per cent each). Thus, 85 per cent of the Tamil migrants in our
sample are from the four districts mentioned above. While Dindigul, Theni and Madurai are
neighbouring districts with the first two having borders with Kerala, Tiruchirappally district is
located far off from Kerala border. It is possible that the regular daily train service to
Tiruchirappally has facilitated migration from this far off district (See Figure 1). Most of these
migrant workers came from the rural areas of Tamil Nadu. Only three per cent of them were
hailing from urban areas (not shown in the Table).
6 But in large scale construction as well as infrastructure works, migrant workers are largely recruited through contractors or agents who settle wages, after retaining part of their earnings from the payments received from employer. Sometimes they also play supervisory roles.

7
Table 4: Distribution of Sample Migrants According to the Native District (%)
District Male Female Total
Dindigul 48.0 58.0 53.0
Thiruchirappally 14.0 18.0 16.0
Madurai 14.0 2.0 8.0
Theni 8.0 8.0 8.0
Karoor 6.0 2.0 4.0
Thirunelveli 4.0 2.0 3.0
Selam 2.0 2.0 2.0
Thanjavur 2.0 2.0 2.0
Toothukudi 2.0 __ 1.0
Pudukkottai __ 2.0 1.0
Ramanathapuram __ 2.0 1.0
Kanyakumari __ 2.0 1.0
Total 100.0 100.0 100.0
Figure 1: Map of Tamil Nadu
Kerala

8
6.2 Educational Level
Nearly half of the respondents did not have any schooling. The proportion of female workers
with no formal schooling was double that of male workers. However, 19 per cent of the
migrants were matriculates. The matriculates were more among male workers (Table 5).
Table 5: Migrants by Educational Level (%)
Level of Schooling Male Female All
No formal schooling 32.0 64.0 48.0
School up to 4 years 6.0 10.0 8.0
5-9 years 30.0 14.0 22.0
Failed matriculation 4.0 2.0 3.0
Matriculated 24.0 10.0 17.0
Above matriculation 4.0 __ 2.0
Total 100.0 100.0 100.0
6.3 Marital Status
Three-fourths of the respondents were married. Thirteen per cent of the respondents were
either widowed or separated. While unmarried workers were more among the males,
widowed/separated were more among the females.
Table 6: Marital Status of Migrant Labourers (%)
Marital status Male Female All
Single 22.0 2.0 12.0
Married 72.0 78.0 75.0
Widowed 6.0 16.0 11.0
Separated -- 4.0 2.0
Total 100.0 100.0 100.0
Fifty nine per cent of the married respondents reside in Kochi with their spouses while the
remaining left their spouse in the village. Among the married male migrants, 72 per cent left
their wives in the village. Only 13 per cent of the married women have come to Kochi leaving
their husbands in the home village (not shown in the Table).

9
6.4 Religion/Caste in which they were Born
Large majority of the sample workers are Hindus (94 per cent). Five of them are Christians and
the remaining one is a Muslim. Scheduled Castes constituted 14 per cent and Scheduled
Tribes three per cent of the sample.
6.5 Push and Pull Factors of Migration
According to ‘push’ and ‘pull’ theory, migration may occur as a search for an opportunity to
improve one’s lot in life. The destination exerts a ‘pull’ on the migrants. Migration can also
occur as a flight from undesirable social or economic situations which constitute an expulsive
push by the community (Bogue, 1969). As may be noted from Table 7, it was the low wages
and the lack of opportunities in their native village which were the primary factors that have
pushed them out of their villages. Drought/water scarcity in their villages also has forced some
of the respondents to migrate temporarily. The high wage rates and more employment
opportunities were the factors that pulled them to Kochi. (See Section 6.7 for a comparison of
the wage rates in Kochi and in the native places of the migrant workers).
Table 7: Push and Pull Factors of Migration (%)
Causes of migration Male Female Total
Low wage in the village 66.0 63.0 63.0
Lack of job opportunities in the village
40.0 48.0 44.0
Water scarcity/drought in the village
28.0 42.0 35.0
Migration of spouse 0.0 4.0 2.0
Family problems 2.0 2.0 2.0
Others 10.0 0.0 5.0
Note: Multiple response question
6.6 Occupation – Before and After Migration
The details of primary occupation of workers before their migration to Kochi are given in Table
8. One-fourth of the migrant workers were engaged in agriculture or were running small scale
businesses in their native places. Majority of them (56%) were unskilled workers.

10
Table 8: Primary Occupation of the Respondents before Migration
Category Per cent of respondents
Skilled Labour
Mason 7.0
Gold smith 2.0
Industrial worker 2.0
Other skilled jobs 4.0
Skilled - Total 15.0
Agriculture 20.0
Small Scale business 6.0
Unskilled labour 56.0
No occupation 3.0
Grand - Total 100.0
It was noticed during the survey that the Tamil labourers were ready to take up any job. For
instance, even if some respondents mentioned their main occupation as ‘construction work’,
they added “we do any job which the employers offer us”. In such a situation, the respondents
who work in a construction site one day will go for cleaning canals or digging wells the next
day. But majority of the respondents reported that their primary employment is in the
construction sector. Most of the respondents whom we met are unskilled labourers. Only nine
per cent of them were engaged in some form of skilled jobs. Skilled migrant labourers were
engaged in masonry work, painting and plumbing.
6.7 Wages The average wage per day of the migrant workers is Rs. 211. Women migrants are generally
paid less than male migrants. While the male migrants are getting, on an average, Rs. 226 per
day, the female workers get only Rs. 196 per day. Table 9 provides the details about the per
day earnings of the migrant labourers.

11
Table 9: Per Day Wages Earned by Migrant Workers (%)
Wages Male Female Total
Below Rs. 200 2.0 18.0 11.0
Rs. 200 to Rs. 224 34.0 66.0 50.0
Rs. 225 to Rs.249 28.0 12.0 20.0
Rs. 250 and above 36.0 2.0 19.0
Total 100.0 100.0 100.0
The migrant labourers were asked about the current wages in their home village. The results
are presented in Table 10.
Table 10: Average Wage Rates in Kochi and in the Places of origin
Particulars Wage in Kochi Wage in Home
Village
Male 226 96
Female 196 56
Total 211 76
Gender parity index 86.7 58.3
On an average, the earnings of the workers after migration were three times their earlier
earnings in Tamilnadu. The difference was much higher in the case of women migrants. While
women migrant workers get about three and half times what their counterparts in their home
villages get for a day’s work, male migrants get about two and half times (235 per cent) the
wages in their home villages. The differentials in wage rates of men and women in Kochi were
less than in their native villages as may be seen from the more favourable gender parity index
of wage rates. As against 58.3 in the villages of Tamil Nadu, the index for Kochi was 86.7.
While there is substantial difference between the monetary wages for casual work in Kochi and
in the rural areas of Tamil Nadu, it is important to note that the difference in real wage rates to
the migrant workers may not be as high, as they have to incur much higher costs for living in
Kochi than in their native places (eg. Rent, cost of hotel food, transportation, communication
etc.,).

12
6.8 Number of Hours of Work
The average number of hours of work per day was found to be nine. As high as 93 percent of
the workers reported that they have to work for more than 8 hours on a working day. Thirty per
cent reported that they work for more than 9 hours.
6.9 Number of Months Migrants Work in Kochi in a Year The migrant workers covered by the study have not migrated permanently to Kerala. Most of
them do not work for the whole year in Kochi. This finding has implications for the labour
market and economic activities dependent on migrant workers. The details about the number
of months the respondents usually work in Kochi are presented in Table 11. Half of the male
migrant workers work for less than eight months in Kochi. Women migrant workers stay for
longer periods than male workers. This may be because these female migrant workers have
come along with their husbands while many of the male migrants are not accompanied by their
spouses. Moreover, some of them were engaged in agriculture before migration. These
workers leave Kochi during the cropping seasons.
Table 11: Number of Months Migrants Work in Kochi in a Year (%)
Number of months Male Female Total
Less than 6 months 13.2 0.0 6.5
6-8 months 36.8 28.2 32.5
8-11 months 7.9 7.7 7.8
Full year 42.1 64.1 53.2
Total 100.0 100.0 100.0
Note: Excluding those who came to Kochi during the last one year.
6.10 Remittances of Migrant Workers
As noted earlier, the labourers surveyed by us have not migrated permanently to Kerala and in
many cases have their family members staying in the Tamil Nadu villages. Therefore, they
transfer a good portion of their wages to their home base. When asked about how the money
sent to the villages is being utilised, most of them (86 percent) reported that it is being used for
household consumption. Majority of them (59 per cent) also said that it is being used for the
education of their children. Eleven per cent reported that it was used to pay off debt. Nearly
one-in-ten was able to build a new house or modify their houses after migrating to Kochi. Few
of them have used the remittances for marriage and other ceremonies in the house.

13
6.11 Networking
It was found that the migrants reach Kochi through the networks of friends and relatives already
working here. All the respondents reported that they have been helped by relatives or friends in
finding jobs in Kochi. Informal discussions with some of the migrants indicated that people
from the same region act as a network in many cases. Often, when employers tell a migrant
worker about the requirement for a certain number of workers, the latter arranges the required
number from those who have migrated from his birth place.
According to anecdoted evidences and news paper reports, the unskilled workers from Tamil
Nadu are relatively better off in terms of wages and living and working conditions compared to
unskilled migrant workers from other states in the country. The wide network of Tamil workers
in the region and their concentration in some places help them in finding jobs and also provides
them considerable bargaining power. It is reported that the contractors, of late, have been
preferring cheaper labour from North and East India. These workers are more tolerant to
poorer working and living conditions and it is easier to extract labour from them. They also do
not leave for home frequently. Many of the human rights violations are reportedly happening in
contract work particularly employing unskilled migrant workers from North and Eastern parts of
the country.
.
6.12 Concentration of Migrants The migrants are concentrated in particular areas in the city. This happens because it will be
easier for them to establish their social networks and maintain their linguistic and cultural
identities. There are such obvious advantages for the migrants in such a settlement pattern.
Another reason for the concentration of migrant workers in certain pockets could be the
unwillingness of the local people to rent out houses to migrants from other states due to cultural
and other reasons. In a meeting of one of the residents’ associations in the city, a Police
Officer in the local police station is reported to have warned the residents of the need for taking
additional precautions while renting out the premises to the migrants. While, it may be
justifiable to some extent seen from the crime detection angle, the message that is passed on
to the local people can act against accessing houses by the migrants.
14
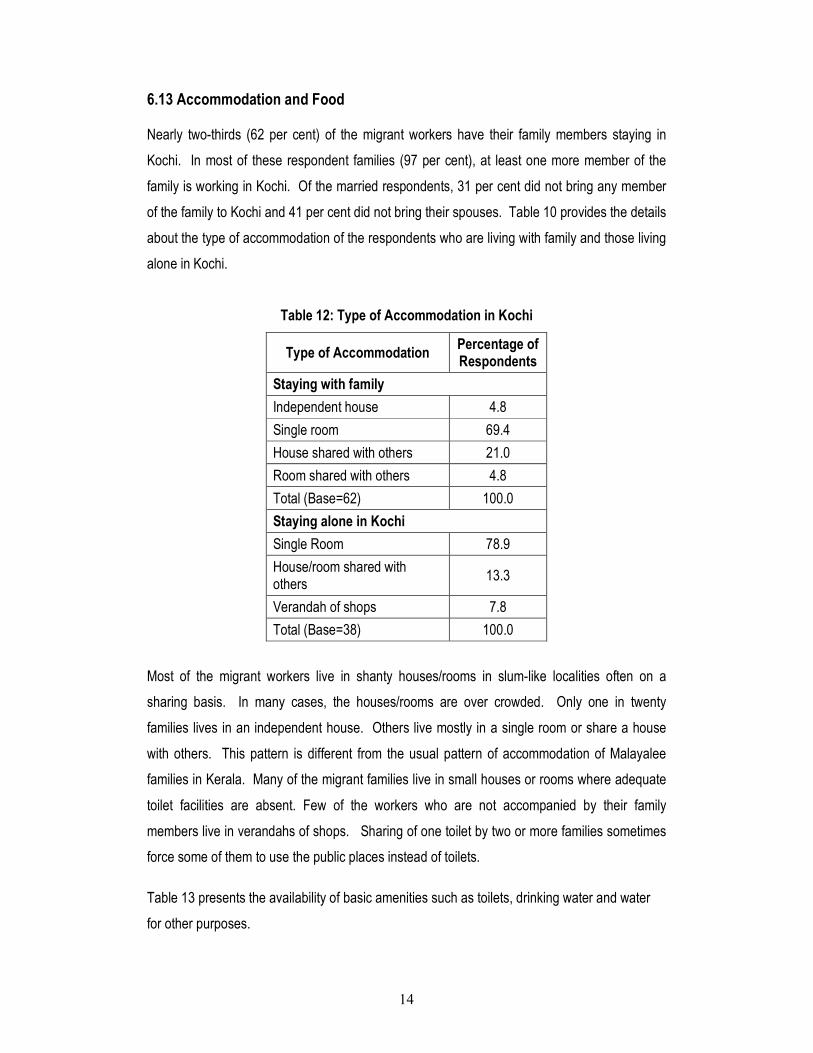
6.13 Accommodation and Food
Nearly two-thirds (62 per cent) of the migrant workers have their family members staying in
Kochi. In most of these respondent families (97 per cent), at least one more member of the
family is working in Kochi. Of the married respondents, 31 per cent did not bring any member
of the family to Kochi and 41 per cent did not bring their spouses. Table 10 provides the details
about the type of accommodation of the respondents who are living with family and those living
alone in Kochi.
Table 12: Type of Accommodation in Kochi
Type of Accommodation Percentage of Respondents
Staying with family
Independent house 4.8
Single room 69.4
House shared with others 21.0
Room shared with others 4.8
Total (Base=62) 100.0
Staying alone in Kochi
Single Room 78.9
House/room shared with others
13.3
Verandah of shops 7.8
Total (Base=38) 100.0
Most of the migrant workers live in shanty houses/rooms in slum-like localities often on a
sharing basis. In many cases, the houses/rooms are over crowded. Only one in twenty
families lives in an independent house. Others live mostly in a single room or share a house
with others. This pattern is different from the usual pattern of accommodation of Malayalee
families in Kerala. Many of the migrant families live in small houses or rooms where adequate
toilet facilities are absent. Few of the workers who are not accompanied by their family
members live in verandahs of shops. Sharing of one toilet by two or more families sometimes
force some of them to use the public places instead of toilets.
Table 13 presents the availability of basic amenities such as toilets, drinking water and water
for other purposes.

15
Table 13: Availability of Amenities in the Living Place
Amenities Percent
Toilet facility
Separate 7.0
Common 87.0
No toilet 6.0
Total 100.0
Source of drinking water
Public tap 91.0
Piped water 1.0
Well 6.0
Shop 2.0
Total 100.0
Source of water for other purposes
Public tap 73.0
Piped water 7.0
Well 17.0
Pond 1.0
Public Comfort Station/Shop 1.0
Total
While six per cent of the migrants did not have toilet facility in their places of living, 87 per cent
share the toilets with others. The situation has implications not only on the health of the
individual migrants but also on public health of the region. It was found that most of the migrant
workers use public taps for sourcing drinking water and water for other purposes. One
respondent told us that he is using public comfort station where he pays Rs.10 daily for bathing
and washing.
About one-fourth of the respondents do not have electric connection in their living space.
Seventy eight per cent of the respondents (excluding the persons residing in the verandah and
roadside) cook their food in their dwelling place. Three-fourths (76.9 per cent) of those who
cook food at home use kerosene as cooking fuel and the remaining use firewood. Though the
source of firewood has not been ascertained in the survey, instances of cutting firewood from
the mangroves near the habitation of the migrants have been reported by local people in some

16
places. This can have serious implications on the urban environment of Kochi. None of the
migrants use LPG. Large majority (85 per cent) of those who cook food at home do not have a
separate kitchen. They usually cook the food in the same room where they live. In many
cases, these rooms did not have proper ventilation.
About two-thirds of the migrants pay a monthly rent in the range of Rs. 500 to Rs.1000. Only
three percent are paying more than Rs. 1000 as monthly rent. Seven per cent of the
respondents do not pay any rent as they render some services to the owner of the house
where they are allowed to live.
Table 14: Rent per Month for Accommodation
Rent Percentage of Respondents
No rent 7.0
Below Rs.500 25.0
Rs.500 to Rs.1000 65.0
Above Rs.1000 3.0
Total 100.0
We have seen earlier that only three-fourths of the migrant workers cook food at home. We
asked the respondents whether they usually have their breakfast, lunch and dinner from hotels.
The results are presented in Table 15.
Table 15: Percentage of Respondnets Taking Food From Hotel*
Particulars Male Female Total
Breakfast 62.0 24.0 43.0
Lunch 64.0 8.0 36.0
Dinner 46.0 2.0 24.0
Note: Others take food from home
Nearly two-thirds of the male workers eat breakfast and lunch from hotels. However, majority
have their dinner at home. While one-fourth of the female workers have their breakfast from
hotels, most of them have their lunch brought from home. Almost all female workers have their
dinner at home.

17
6.14 Management of Domestic Waste
One major problem identified by the study is that the domestic waste from the migrants’
residences is dumped in public places (Table 16).
Table 16: System of Disposal of Domestic Waste
Particulars Percentage of Respondents
Dumping in the corporation dumping place 34.0
Throw in drain 34.0
Dumping near the dwelling place 14.4
Dump in open place/road 7.3
Throw into Canals/river 7.2
Burying 2.1
Burning 1.0
Total 100.0
Note: excluding those who do not have dwelling place
As may be noted from Table 16, only one-third of the migrant workers dispose the domestic
waste in the proper designated places. Some of them are throwing the waste in river/canals.
The practices of waste disposal followed by the migrant workers have serious implications on
the urban environment and public health.
6.15 Health Related Aspects
It is well known that household environment plays a crucial role in determining the health of its
occupant. Overcrowded living conditions of the migrant labourers result in increased
transmission of infectious diseases. As noted earlier, in many cases, there are problems in the
provision of sanitation facilities. In some cases, the sources of drinking water as well as water
for other purposes are also not very good. Non-availability of adequate quantities of water and
inadequate usage of water also pose health risks. Cooking food in the living rooms without
proper ventilation particularly while using firewood and kerosene is hazardous to health. These
unhygienic living conditions make the migrant workers vulnerable to diseases. The
unfavourable working conditions can also lead to serious occupational and other health

18
problems7. Many of the workers have habits which can lead to poor health in the long run.
These are presented in Table 17.
Table 17: Unhealthy Habits
Habits Male Female Total
Drink alcohol 60.0 2.0 31.0
Smoking 70.0 2.0 36.0
Use Pan parag 16.0 8.0 12.0
Chewing tobacco 14.0 48.0 31.0
Drinking alcohol and smoking are largely restricted to male workers. Majority of the male
workers drink alcohol and smoke. Use of Pan Parag is not widespread. But about half of the
female workers are in the habit of chewing Pan. The Pan chewing habit is more among women
than among men.
Eighty seven per cent of the respondents reported having had some diseases while staying in
Kochi. Incidence of fever and headache was very high. One-in-ten respondents were having
cough. Some of these problems are occupation related.
Table 18: Illnesses while Working in Kochi
Illness Percent
Fever 81.0
Headache 71.0
Cough 11.0
Cold 5.0
Pain in leg/hand 4.0
Stomach pain 2.0
Body pain 2.0
Back pain 2.0
Chest pain 1.0
No disease yet 13.0
* multiple response
7 For a detailed discussion on the relationship between migration and health, see Chandrima B. Chatterjee,
Identities in Motion; Migration and Health In India, Centre for Enquiry into Health and Allied Themes (CEHAT),
Mumbai, 2006

19
Table 19 presents the details of the place where the migrant workers usually go for treatment of
diseases.
Table 19: Place of Treatment of Illness
Places of treatment Total
Private hospital/clinic in Kochi 36.8
Medical shop 29.8
Government hospital in Kochi 20.7
Go to hospital in the village 8.1
Did not go for treatment 2.3
Total 100.0
One-third go to a private hospital/clinic. It is important to note that a significant proportion (30
per cent) approach a medical shop for treatment. Only one-fifth of the workers approach a
government hospital. Eight per cent of those who had some disease while working in Kochi
reported that they had gone to their village for treatment because of their inability to
communicate effectively with the doctor in Malayalam. Few did not undergo any treatment.
The temporary nature of their stay in Kerala might be one of the reasons for not preferring
government hospitals for treatment. Treatment is made available from the government
hospitals free of cost only if they belong to BPL families. With no ration card, these migrant
labourers are not eligible for free/subsidised treatment in government hospitals. Some of them
told us that they have tried to get ration cards in Kerala and paid money to some agents for it.
But they have lost hope of getting it after a long wait. Timings of the government hospitals are
also not convenient to the daily labourers like the migrants.
It is found that while migrant labourers avail themselves of curative care, though very often not
at the desired level, they fall largely outside the coverage of preventive care due to the
temporary nature of their employment and stay. It is found that the public health personnel
seldom visit the settlements where the migrant labourers live. Just two per cent of the
respondents reported that they were visited by the health worker in the month previous to the
survey.
20
The respondents who were having children aged below 5 years residing with them in Kochi
were asked whether the vaccination appropriate for the age was given to their children. Only
three respondents were having children in this age category living in Kochi and all these
respondents gave the relevant vaccination and polio drop for their children during the last
immunisation programme. But it was reported that they didn’t have information on where polio
drops are given and therefore took their children to their village and gave the polio drop there.
It appears that the public health system remains to be largely ignorant about the serious
implications of not addressing the health issues of the migrant population. Unless preventive
measures are taken, they can also act as carriers of communicable diseases like Chikungunya
and dengue fever from and to their native places. Due to the current attention on the link
between migration and spread of HIV/AIDS, NGOs working in HIV/AIDS control programme are
active to some extent among the migrants. According to studies conducted elsewhere,
migrants are more likely to be in high-risk situations with respect to this disease as they live
away from their spouses and are more likely to engage in unprotected sex.
Our study found that substantial proportion (27 per cent) of workers had work related injuries
while in Kochi. In the case of two-thirds of the injured workers, the employers met the medical
expenses in full. In the remaining cases, the expenses were not even partially met.
6.16 Educational Status of Children
Most of the children of the migrant workers stay back in their villages in Tamil Nadu. Just four
children in the age group of 6-14 in the families of the migrant workers in the sample have
accompanied their parents to Kochi. Of these, only two are going to school. But most of the
children staying back in the home village belonging to this age group are going to school. Of
the children in the pre-school going age (above 3 years but less than six years), only three out
of the five children staying in Kochi are going to pre-school. Seventy eight per cent of the
children of the migrant workers in this age group staying in their home village go to a pre-
school. Urgent measures are to be taken to address the educational needs of the children of
migrant labour, including the need for Tamil medium in schools. One suggestion is to expand

21
the coverage of Alternative Schooling Programme8 under the Sarva Shiksha Abhiyan to
children of migrant labourers working in different parts of Kerala.
6.17 Possession of Durables
Regarding the possession of consumer durables, 23 per cent of the respondents have radio in
the village whereas only 5 per cent own a radio in Kochi. About one-in-ten respondents have
television in their home in the village. Six per cent of the respondents have mobile phone in
Kochi. One-third of the migrants had a bicycle in their home village. Very few workers own
telephone, mixer grinder, refrigerator or two-wheeler.
Table 20: Respondents by Possession of Consumer Durables (%)
Durable In the place of
origin In Kochi
Radio 23.0 5.0
Television 11.0 9.0
Telephone 3.0 2.0
Mobile phone 1.0 6.0
Mixer grinder 5.0 1.0
Refrigerator 2.0 1.0
Cycle 32.0 12.0
Two-wheeler 4.0 1.0
6.18 Habits
We enquired about the entertainment activities and media habits of the workers. The results
are presented in Table 21.
Table 21: Respondents by Different Habits (%)
Habits Male Female Total
Read newspaper 56.0 16.0 36.0
Listen radio 68.0 70.0 69.0
Watch TV 72.0 74.0 73.0
Go for cinema 62.0 30.0 46.0
8 Alternative Schools are multi-grade schools meant for dropouts, and unenrolled children. It is usually started to address the educational needs of children in the inaccessible locations and children of migrant families.

22
Only about one-third of the migrant workers read newspaper. The habit of reading news
papers is much more among the male workers than among the female workers. But, many of
the migrant workers are illiterate as noted earlier. Of the total literate respondents, 60 percent
read newspaper (not shown in the Table). More than two-thirds of the workers, of both genders,
listen to radio though only five per cent of them have a radio in Kochi. Nearly three-fourths of
the respondents watch TV, though only nine per cent of them have TV in Kochi. Most of these
workers listen to radio or view TV in the nearby shop or neighbour’s house. Except a few, the
respondents listen/view only Tamil programmes in radio/TV.
6.19 Visit to Home Villages
Fifty five per cent of the respondents visit their home in their village once in a month. Nine
percent visit their homes once in two weeks. But nine per cent visit their village only during
festivals or for ceremonies. Deepavali followed by Pongal are the two common festivals for
which most of the respondents go home. When they go for festivals, 55 per cent of the
respondents stay upto a week in their home while nine per cent stay one to three months there
and then return to Kochi. This frequent trips of the migrants and their long/short absences
from Kochi have adverse implications for timely execution of work. This may be one of the
reasons for the preference shown for non-Tamil workers by employers.
Table 22: Frequency of Visit to the Home in the Village
Frequency Percent
Once in two weeks 9.0
Once in a month 55.0
Once in two months 7.0
Once in 3 months 6.0
Once in six months 13.0
Only for festivals \ ceremonies 9.0
Do not go 1.0
Total 100.0

23
Table 23: Festivals for which the Respondents Go Home*:
Festival Percent
Deepavali 97.0
Pongal 86.0
Festival in temple 14.0
Other festivals 3.0
Christmas, Easter 1.0
*Multiple responses
6.20 Communication with Relatives in the Village
Four in five respondents communicate with their family members once in a week or more often.
Table 24: Frequency and Mode of Communication
Frequency of Communication Percent
Five times in a week 2.0
Thrice in a week 11.0
Twice in a week 11.0
Once in a week 55.0
Once in two weeks 11.0
Once in a month 3.0
No communication 7.0
Total 100.0
6.21 Positive Aspects of Working and Living in Kochi
As noted earlier, better wages in Kochi is the most important factor that attracted people to
Kochi. Opportunity for getting work is the other important work-related attraction for Kochi.
Some of them are happy as they could get the job they preferred. Among the factors related to
the living environment in Kochi, the most cited one was the availability of accommodation
facility in Kochi. About half of the respondents felt so. Good transport facilities and good food
were the other positive aspects of Kochi’s living environment as reported by the migrants.

24
6.22 Problems Faced by Migrant workers
The most important problem cited by the Tamil migrant workers in Kochi is that they had to
quarrel sometimes with the local people in the work site or in the place where they wait for
work. Few of them reported blackmailing or physical torturing by local people. Language
barriers were reported by some of the respondents. A small section also reported that lack of
information about accessing public services is a major problem they face in Kochi.
Table 25: Problems Faced by Migrant workers who reported having problems
Problem Percentage
Quarrel with local people in worksite/waiting place for work
25.0
Blackmailing/torturing by Malayalee labourers 7.0
Language barriers. 7.0
Lack of information about accessing services 3.0
Lack of opportunities for work 2.0
Higher food and lodging expenses 2.0
Frequent Shifting house 1.0
Did not get the wage offered 1.0
Note: Multiple response question Anecdotal evidence and newspaper reports suggest that the problems encountered by the
Tamil migrants are fewer than those encountered by migrants from other regions. Their large
number, networking possibilities and proximity to their native places are some of the
advantages which workers from Tamilnadu have which others from distance states lack.
7. Need for Research on Different Aspects of In-Migration to Kerala
There are a number of studies on the diverse aspects of migration of Keralites to other
countries particularly to countries in the Middle East. But the growing in-migration to the state
has received only very little attention from researchers. It warrants, in our view, high priority in
the research agenda of the state. There is a strong need for more in-depth and policy-oriented
research on internal migration which should focus on issues relating to labour market, poverty
and vulnerability, access to health care and education, urban planning and environment. Issues
related to labour market include the nature of migration, its seasonality and its effect on work
scheduling in Kerala, reasons for preferring migrant workers, recruitment patterns, work style of

25
the migrant workers, their skill sets etc. Access to public services for migrants and their
families and extension of social security schemes to them have to be examined in detail. The
effectiveness of the implementation of various laws and regulations, including Inter-State
Migrant Workmen Act (See Appendix) and Contract Labour Act, in relation to migrants from
other states also needs to be examined9.
There are reports of widespread violation of human rights in the hands of the police. This is
another area which requires exploration. Migrants are sometimes being branded as ‘unreliable
outsiders’ and criminals by some local people. The Police also has contributed to fostering of
this branding. No doubt, there are migrants from other states in the Criminal List published in
the website of the Police Department. To distinguish the migrant workers from the criminals
who have migrated to Kerala from other states, there is a need to have some identification
documents for the workers. One such programme was initiated in Madhya Pradesh by the
Grameen Vikas Trust (GVT). GVT worked closely with the local governments of source villages
and has developed an informal system of identity cards for migrants. With these cards,
migrants have some protection against official harassment.10 Perhaps the applicability of the
scheme in Kerala may be worth studying.
The social ostracism, stereotyping and in some cases outright discrimination as a result of
prejudices based on linguistic and cultural differences require to be studied. As noted earlier,
9 Many instances of exploitation by the middle men have been reported in the newspapers. For instance, The Hindu dated January 7, 2007 reports about the pitiable accommodation provided to the migrant workers by a contractor in Kochi. About 30 workers were provided accommodation in three portions of a small house. The Hindu dated March 10, 2005, reported another instance of violation of the rules pertaining to migrant workers working in Thiruvananthapuram city. The report says that the Labour Department has initiated action against a construction firm involved in the City Roads Development Scheme in Thiruvananthapuram on the charge of violating the provisions of the Inter State Migrant Workmen (Regulation of Employment and Condition of Service) Act, 1979. The action was initiated on the basis of reports that migrant labourers were being denied minimum wages and proper living conditions in the labour camps run by the firm in the city. The department found that the wage registers, muster rolls and particulars of migrant workers were not being maintained properly. The company did not adhere to the welfare clauses in the Act, such as free medical care, proper living conditions and journey and displacement allowances. According to the report, several firms were employing migrant labourers without Government sanction. The law stipulates that labour contractor recruiting more than five migrant workers should get a recruitment licence from the home State of the labourer and an employment licence from the Labour Department of the State where they are to be employed. The unauthorised contractors offer employers cheap labour for less than Rs. 120 a day. The labourers would be paid only less than Rs. 50. The report says that the firms and also contractors ensure that no records of the worker related transactions are maintained to prevent any scrutiny by law enforcers. The exploited migrant workers, fearing loss of jobs, are often reluctant to cooperate with the officials.
10 Priya Deshingkar and Sven Grimm, “Internal Migration and Development: A Global Perspective”, No.19, International Organisation for Migration, Geneva, 2005.

26
migrants originate from different social, cultural and linguistic backgrounds and work in different
sectors at different levels. Their requirements in Kerala are different. Hence, it is important to
capture the diversities and complexities of the in-migration phenomenon through extensive
research. Their problems of integration in Kerala society is yet another issue to be studied. All
these call for a much larger study covering all parts of Kerala and migrants engaged in
occupations like agriculture, industry, services and self-employment. Migrants from states
other than Tamil Nadu also need to be covered in such a study.
8. Conclusion
The present pilot study aims at alerting the policy makers, planners and administrators, at the
state as well as the local level on some of the issues resulting from the rapid growth of migrant
population in Kerala. In view of the rising in-migration, questions related to governance, public
health, sanitation, water supply, housing, urban environment, educational and infrastructural
needs, law and order, etc., warrant greater attention at the level of policy planning and
implementation. The large influx of migrants from different parts of the country with different
linguistic and cultural backgrounds puts pressure on governance as well as civic amenities.
Besides, in the absence of reliable information on the quantum of in-migration of a floating
nature, these migrants are unlikely to be taken into account while making population
projections and consequently in planning. For integrating the issues relating to migration into
local governance, alternative population projections which include migrants of all types have to
be made. The volume and diversity of the migrant population has to be taken into account in
urban planning and implementation of programmes and projects like the Jawaharlal Nehru
Urban Renewal Mission (JNNURM) Programme and Kerala Sustainable Urban Development
Project (KSUDP). Unless the numerous problems of the increasing number of migrant labour
including their integration in Kerala society are not addressed in time, they can lead to violent
social unrest as it happened in countries like France in recent years.

27
APPENDIX
Laws Applicable to Migrant worker Almost all labour laws are applicable to migrant workers also. One specific Act pertaining to
inter-state migrant workers is the Inter-State Migrant Workmen (Regulation and Conditions of
Service) Act 1979. The Act only covers interstate migrants recruited through contractors or
middlemen and those establishments that employ five or more such workers on any given day.
Contractors and establishments are required to be licensed and registered by a notified
registering authority. The Contractor is required to issue a passbook to every worker, giving
details about the worker, including payments and advances.
Other laws include:
� Minimum Wages Act, 1948
� Contract Labour (Regulation and Abolition) Act, 1970
� Equal Remuneration Act, 1976
� Building and Other Construction Workers (Regulation of Employment and Conditions
of Service) Act, 1996
� Workmen’s Compensation Act, 1923
� Payment of Wages Act, 1936
� Child Labour (Prohibition & Regulation) Act, 1986
� Bonded Labour Act, 1976

28
Publications
Impact of Liberalisation on Kerala Economy-
K.K.George
Kerala - The Land of Development Paradoxes-
K.K.George and N.Ajith Kumar
What is Wrong with Kerala’s Education System?-
K.K.George and N.Ajith Kumar
Labour Market and Household Behaviour: A Case of Unorganised
Sales Women-
Martin Patrick
Higher Education and Development in Kerala-
Jandhyala B.G.Tilak
State Level Fiscal Reforms in India: Some Core Issues-
K.K.George
Developments in Higher Education in India- A Critique-
K.K.George and Reji Raman
Financing Secondary Education in Kerala-
K.K.George, George Zachariah and N.Ajith Kumar
Fiscal Management in Kerala: Constraints and Policy Options-
K.K.George and K.K.Krishnakumar
Centre-State Relations, Finance Commissions and Kerala’s Fiscal
Crisis -
K.K.George and K.K.Krishnakumar
Deepening Decentralised Governance in Rural India: Lessons
from the People’s Plan Initiative of Kerala-
M.A. Oommen
Dynamics of Change in Kerala’s Education System: The Socio-
economic and Political Dimensions-
K.K. George and Parvathy Sunaina
On Some Currently-Fashionable Propositions in Public Finance-
Prabhat Patnaik
Twelfth Finance Commission’s Award: What it Foretells for Kerala-
K.K. George, K.K. Krishnakumar and V.K. Praveen

29
Kerala Model Revisited: New Problems, Fresh Challenges-
P.K. Michael Tharakan
![Untitled-1 [] · Pee Vees Public school, Nilambur, Malappuram, Kerala Deshaposhini Public Library, Calicut, Kerala ... Kendriya Vidyalaya - Meenampakkam, Chennai, Tamil Nadu](https://img.pdfslide.net/doc/110x75/5c76b47809d3f2ff328c28b9/untitled-1-pee-vees-public-school-nilambur-malappuram-kerala-deshaposhini.jpg)


![8th A - --:: Kerala Gazette - Published by Authority ::-- · 8th A PRIL 2008] KERALA GAZETTE 342 ... name as Leena R. David consequent on my marriage with David Raj, ... Tamil Nadu,](https://img.pdfslide.net/doc/110x75/5ae968bc7f8b9aee0790c3ce/8th-a-kerala-gazette-published-by-authority-a-pril-2008-kerala-gazette.jpg)