Embed Size (px)
Citation preview
Funded in part by the Government of Canada’s Sectoral Initiatives Program
SEPTEMBER 2017
A DISCUSSION OF HISTORICAL TRENDS AND FUTURE IMPLICATIONS
LABOUR PRODUCTIVITY IN CANADA'S OIL AND GAS INDUSTRY
Executive Summary 1Introduction 4
Methodology 4What is 'Labour Productivity'? 5
Oil and Gas Industry Labour Productivity 6Historical Labour Productivity: 2010-2014 Rapid Growth and 2015-2016 Downturn 7Forecasted Productivity: Two Scenarios for 2017-2021 Moderate Recovery 8
Oil and Gas Subsector Labour Productivity Analysis 9Oil Sands 10Exploration and Production 16Oil and Gas Services 18Pipeline Transmission 20
Conclusion 22Appendix: Factors Impacting Oil and Gas Labour Productivity 23
Capital Investment 25Innovation 27Human Capital 31Competition 33Regulatory and Public Considerations 35Other Factors that Influence Labour Productivity 36
Glossary 38Acknowledgments Inside Back Cover
Front cover photo credit: Cenovus Energy Inc.
Executive SummaryThe oil and gas industry is an important contributor to Canada’s economy. The industry has faced both rapid growth and contraction in the last several years. Labour productivity, the ratio of output per unit of labour input, is one of the key contributors to improving profitability and sustaining industry activity levels.
Understanding labour productivity is critical to forecasting labour demand, developing strategies and policies to meet industry’s workforce needs and maintaining or improving industry competitiveness. Three distinct time periods were examined: 2010-2014 a period of rapid growth and high prices, 2015-2016 a period of contraction and significant commodity price decline, and, 2017-2021 a forecasted period of moderate recovery.
Barrels of oil equivalent per day (BOE/d) per direct employee is used in measuring labour productivity in the oil and gas industry as this measurement controls for commodity price changes. The changes in the BOE/d per employee indicates improvements or declines in labour productivity over a particular time period. For the purposes of this report, 2010, 2014 and 2016 were used as baseline years to calculate labour productivity changes for the three key periods highlighted.
2010a 2014a 2016e 2021f
Modest Recovery
Delayed Recovery
Labour productivity (BOE/d per employee) 34.76 32.64 43.06 43.92 43.99
% Change n/a -6.1% +31.9% +2.0% +2.3%
Oil and gas labour productivity is higher than overall Canadian labour productivity, averaging six times higher annually since 2010 based on Gross Domestic Product (GDP) per hour worked.
Oil and Gas Industry Highlights
2010–2014: Rapid Growth and High Prices
Despite the significant technological and process improvements that occurred between 2010 and 2014, oil and gas labour productivity declined by 6%. A primary restraining factor was the significant amount of capital invested in new projects and the corresponding growth in related employment without immediate increases to production. This is especially true of the oil sands sector. Increased capital investment led to the addition of capital related employees while, during the construction period, production did not increase. The result
was a decline in the labour productivity ratio. This was slightly offset however by production coming online from earlier capital investments. Other key restraining factors during this period were the ability to attract and retain talent and regulatory changes. Beyond innovation in technology and processes, other key driving forces during this period included industry maturation and the growth of the oil sands sector relative to the total oil and gas industry.
2010Canada-Business Sector Industries
Oil andGas Industry
Note: GDP in chained $2007CDN per hourSource: CANSIM Table 383-0033.
2016
$47 $296 $50 $367
Oil and Gas Labour Productivity
Labour Productivity in Canada’s Oil and Gas Industry (September 2017) 1
2015–2016: Contraction and Price Decline
In order to allow for a consistent comparison between years, 2016 estimated production was adjusted to remove the impact of the Fort McMurray wild fires on labour productivity. During the downturn, labour productivity increased by 32% as companies adjusted to the sharp decrease in oil prices. The key driving forces of this labour productivity improvement included the increase in production due to earlier capital investment, the significant downsizing of employees due to reduced spending, industry consolidation and continued implementation of technological and process improvements. Restraining factors during this period were similar to the 2010-2014 time period with the exception of human capital which was a driving force as companies retained their more productive employees, experienced reduced turnover and were able to draw from an available and skilled labour pool.
Executive Summary
2017–2021: Forecasted Moderate Recovery
Labour productivity is expected to be relatively flat in the period, with an approximate 2% gain. It should be noted however, that in the absence of significant and ongoing technology and process improvements, labour productivity could decline during this period of moderate recovery. Other driving factors include continued industry maturation and competition, including completion of mergers and acquisitions, additional oil sands production from past capital investment, more conservative hiring decisions and government support for innovation. Renewed capital spending is a key factor in restraining labour productivity. Other restraining factors include anticipated retirements, challenges in attracting and retaining skilled talent, re-certification, training and skill development, and regulatory changes.
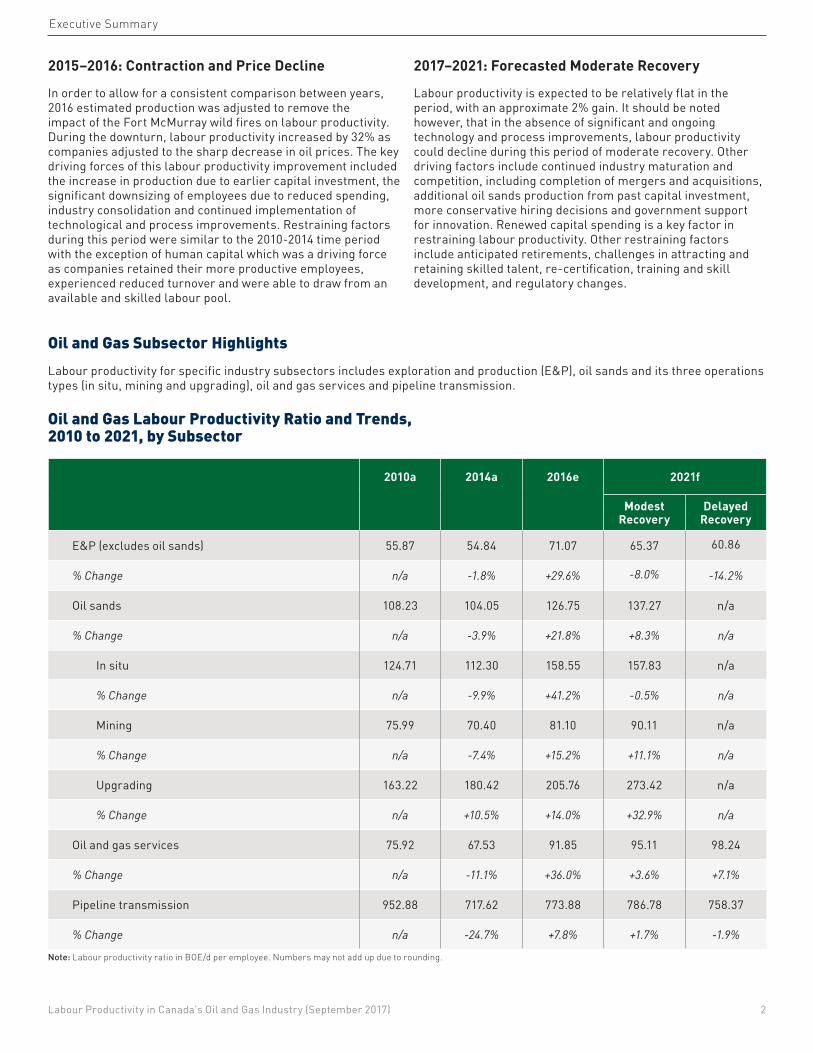
Oil and Gas Subsector HighlightsLabour productivity for specific industry subsectors includes exploration and production (E&P), oil sands and its three operations types (in situ, mining and upgrading), oil and gas services and pipeline transmission.
2010a 2014a 2016e 2021f
Modest Recovery
Delayed Recovery
E&P (excludes oil sands) 55.87 54.84 71.07 65.37 60.86
% Change n/a -1.8% +29.6% -8.0% -14.2%
Oil sands 108.23 104.05 126.75 137.27 n/a
% Change n/a -3.9% +21.8% +8.3% n/a
In situ 124.71 112.30 158.55 157.83 n/a
% Change n/a -9.9% +41.2% -0.5% n/a
Mining 75.99 70.40 81.10 90.11 n/a
% Change n/a -7.4% +15.2% +11.1% n/a
Upgrading 163.22 180.42 205.76 273.42 n/a
% Change n/a +10.5% +14.0% +32.9% n/a
Oil and gas services 75.92 67.53 91.85 95.11 98.24
% Change n/a -11.1% +36.0% +3.6% +7.1%
Pipeline transmission 952.88 717.62 773.88 786.78 758.37
% Change n/a -24.7% +7.8% +1.7% -1.9%
Note: Labour productivity ratio in BOE/d per employee. Numbers may not add up due to rounding.
Oil and Gas Labour Productivity Ratio and Trends, 2010 to 2021, by Subsector
Labour Productivity in Canada’s Oil and Gas Industry (September 2017) 2
All industry subsectors in this report show similar historical trends with labour productivity decreasing during the rapid growth period between 2010 and 2014 and significantly increasing during the 2015-2016 downturn. Oil sands upgrading saw an interesting variation from the rest of the industry subsectors as labour productivity gains were accomplished during the 2010-2014 period and a 33% improvement could occur in the 2017-2021 forecast period. In the 2017-2021 forecast period, E&P is projected to experience a significant decline in labour productivity by -8% and -14% in the Modest and Delayed Recovery scenarios respectively while oil sands labour
ConclusionDuring periods of industry growth, exemplified by capital investments in new projects, labour productivity declines are typical. For Canada's oil and gas industry, labour productivity dropped by 6% in 2010-2014 as capital and project-related employment grew without an immediate increase in production.
In line with expectations, significant labour productivity gains of 32% were made in 2015-2016, which corresponded to a significant drop in oil prices, drastic cuts in capital spending and employment and new production coming online.
Based on forecasts, a moderate increase of approximately 2% in labour productivity is expected over the next five years, along with a modest recovery in capital spending and a balance of factors that will either drive or restrain it.
Overall, a stable or slight decline in labour productivity may be acceptable and considered necessary for both industry and individual company’s long-term health and viability.
The oil and gas industry is one of the most productive industries in Canada. Support of oil and gas industry growth helps to improve overall labour productivity in Canada. There are a number of initiatives that industry and governments may want to consider to drive productivity and mitigate any restraining factors during what is expected to be a slow growth period over the next five years. Industry players may want to consider some of the following: sharing information to promote efficiency, continue investment and implementation of innovation; undertake more rigorous measuring of labour productivity within companies and across the industry;
set targets for improving labour productivity; engage in workforce planning and skill planning; work with educational institutions and industry associations or governments to understand and support a shift in labour and training requirements.
Industry and governments working together, meanwhile, can encourage more investment through removing constraints on transportation of oil and gas, streamlining regulatory processes, supporting the development of value-added processing, supporting the development and promotion of critical technical skills, improving the provision of industry labour market data, and continuing to seek win-win opportunities.
“ Productivity isn’t everything, but in the long run it is almost everything. A country’s ability to improve its standard of living over time depends almost entirely on its ability to raise its output per worker.”Paul R. Krugman (Nobel Prize winner in economics), The Age of Diminished Expectations, 1994
OCCUPATIONAL SHIFTS
To a limited degree labour productivity at an occupational level is discussed in this report. One example is the labour productivity of engineering occupations, which has seen an historical increase. This increase has been due in part to innovations in the industry such as standardized well design and, in part, to the historical difficulty in attracting and retaining talent. In the future, the industry’s change in focus from one of growth to one of business optimization is likely to require highly specialized technical staff to successfully apply technology and process improvements. Industry’s ability to attract and retain top talent amid new and emerging skill requirements may be tested. Workforce challenges are also expected as a result of recent and looming retirements of experienced technical staff.
productivity is forecasted to improve by 8%. The primary reason for this discrepancy in the labour productivity trend is capital spending, which is forecasted to moderately recover for E&P and decline in oil sands. Labour productivity for oil sands mining and upgrading is expected to increase during the forecast period by 11% and 33% respectively while in situ is expected to remain flat. Although forecasted oil and gas services labour productivity improvements are more moderate compared to 2015-2016 trends, these are still greater than industry-wide labour productivity growth rates. Pipeline transmission show minimal labour productivity changes during the forecast period.
Executive Summary
Labour Productivity in Canada’s Oil and Gas Industry (September 2017) 3
IntroductionThe oil and gas industry is an important contributor to Canada’s economy. In 2016, it made up close to 7% of the national Gross Domestic Product (GDP)1 and employs approximately 175,000 direct workers and many more indirect workers throughout Canada. Since 2014, the industry has undergone a significant downward shift in oil prices which has curtailed the economic growth that occurred from 2010 to 2014.
1 Statistics Canada, CANSIM, table 379-0031.2 Oil sands production forecast was sourced from CAPP’s 2016 Crude Oil Forecast, Markets and Transportation report released June 23, 2016 and adjusted to disregard the
production drop resulting from the Fort McMurray wildfires since the temporary shut-ins did not directly result in permanent operations layoffs. This adjustment also allows a consistent comparison between years.
Labour productivity is one of the key elements in improving profitability and sustaining industry activity levels during periods of lower oil and gas prices. Understanding labour productivity is also critical to forecasting labour demand and developing strategies and policies to meet the industry’s workforce needs.
This report provides an overview and discussion of labour productivity trends and measures for Canada’s oil and gas industry, including the following subsectors:
• Exploration and production (E&P) excluding oil sands, • Oil sands specifically in situ, mining and upgrading
operations, • Oil and gas services comprised of drilling and
completions, integrated geophysical or seismic and oilfield services, and
• Pipeline transmission.
This report is limited to an examination of labour productivity of direct industry employment. Indirect or employment captured in other industry classifications such as downstream oil and gas, construction, manufacturing, truck transportation, professional and scientific services are beyond its scope.
Historical trends are presented along with the future implications to labour productivity. The various forces impacting productivity such as innovation, human capital, regulatory and public concerns are highlighted. A more in-depth discussion appears in the Appendix beginning on page 23 including, where possible, shifting occupational and skill requirements.
Three distinct time periods were examined: 2010-2014 a period of rapid growth and high prices, 2015-2016 a period of contraction and significant price decline and 2017-2021 a forecasted period of moderate recovery. For the purposes of this report, 2010, 2014 and 2016 were used as baseline years to calculate labour productivity changes for the three key periods highlighted.
This report also explores how industry and governments can help to improve labour productivity and foster long-term economic growth in the industry and for the country.
MethodologyInformation sourced in this report include Statistics Canada, forecasts from industry associations, energy economists, direct industry surveys, a select review of industry publications and select consultations with industry and labour market experts. The information and industry insights contained in this report are based on available data at the time of research.
Oil and gas production (historical and forecasts) and expenditures (historical) were sourced from CAPP. Total oil and gas production, presented as barrels of oil equivalent per day (BOE/d) covers both oil sands and non-oil sands output.2 Industry expenditure forecasts were provided by ARC Energy Research Institute and were based on CAPP’s June 2016 production forecast.
PetroLMI’s Labour Market Outlook 2017 to 2021 for Canada's Oil and Gas Industry, released in March 2017, is the source of employment projections. Two scenarios for oil and gas pricing, production, spending and resulting employment numbers were presented in the outlook report and consequently used in this report:
• A Modest Recovery scenario assumes more favourable pricing and market conditions starting in 2017 resulting in 17,100 net new jobs in the forecast period to 2021.
• In a Delayed Recovery scenario, growth is delayed to 2018 as oil price averages well below US$50 in 2017, causing further declines in E&P capital spending and a third year of job losses in 2017 but is offset by 15,400 new jobs created from 2018 to 2021, resulting in 6,700 net new jobs during the forecast period.
Labour Productivity in Canada’s Oil and Gas Industry (September 2017) 4
3 Includes bitumen and synthetic crude production. Synthetic crude includes diluent, synthetic crude equivalent and BOE/d equivalent for North West Redwater Partnership (NWR) Sturgeon Refinery which upgrades as well as refines bitumen production.
4 The number of oil and gas service workers required per dollars of oil and gas expenditure could be a more appropriate measure to the subsector, as services employment tends to be driven by E&P and oil sands expenditures. This measure is presented in the Oil and Gas Subsector Labour Productivity section.5 Pipeline throughput may be considered to be a more relevant subsector measure. However, this metric was not available at the time of research.6 http://www.bankofcanada.ca/wp-content/uploads/2010/05/dp10-5.pdf
Introduction
Certain forces or factors are critical for determining labour productivity changes including capital investment, innovation, human capital, competition, regulatory impact and public concern. An analysis of these forces was conducted to assess their relative impact on oil and gas labour productivity. This report identifies and rates the forces or factors that are either driving movement forward or blocking movement. A driving force represents a positive contribution to productivity and a restraining force represents a negative contribution to productivity.
What is ‘Labour Productivity’?Labour productivity is defined as the ratio of output per unit of labour input. Output is typically measured in terms of the value or volume of the goods and service. Labour input is typically measured using hours worked or number of employees.
Labour productivity for a country or province is typically measured as the ratio between GDP (i.e., value of output) per hour worked. One of the large disadvantages of using GDP for the oil and gas industry is the impact of commodity pricing on the measure. For example, assuming employment levels stay the same, a 50% oil price reduction results in a significant drop in labour productivity as the value of the goods decrease despite production levels increasing or remaining the same. Consequently, in this report, the volume of output per unit of labour, or, more specifically, barrels of oil equivalent per day (BOE/d) per direct employee is used as the main measure of labour productivity both for the overall oil and gas industry and its subsectors.
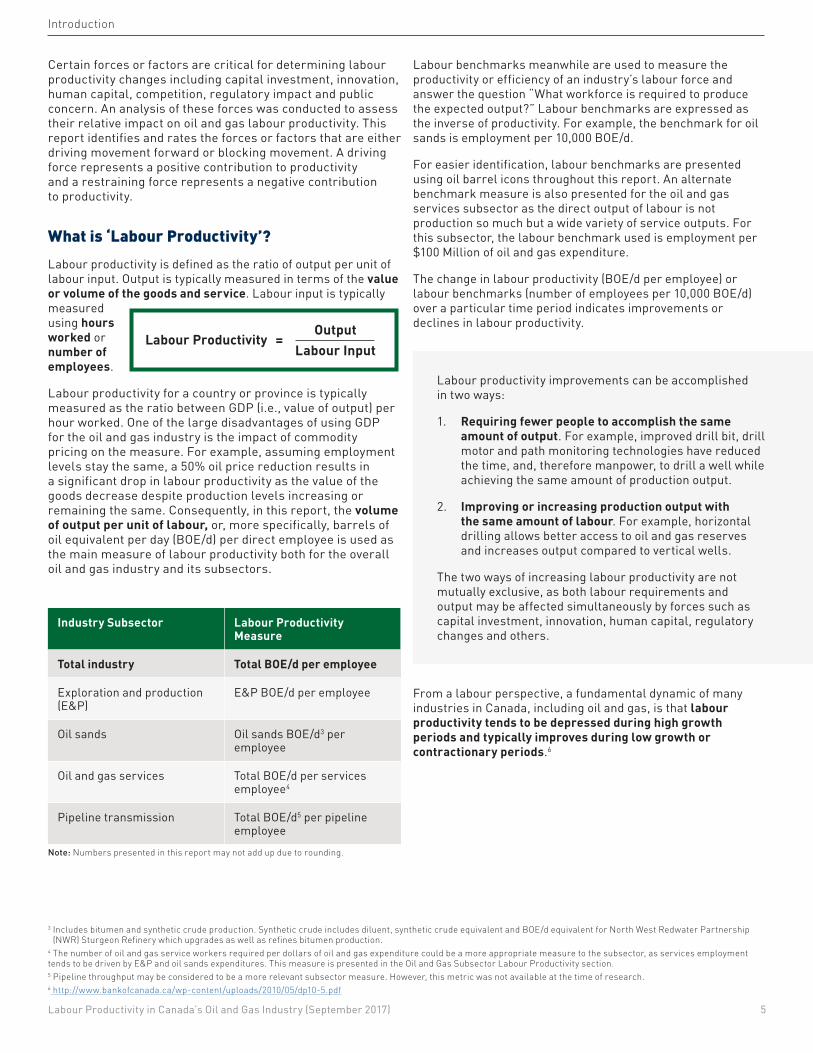
Industry Subsector Labour Productivity Measure
Total industry Total BOE/d per employee
Exploration and production (E&P)
E&P BOE/d per employee
Oil sands Oil sands BOE/d3 per employee
Oil and gas services Total BOE/d per services employee4
Pipeline transmission Total BOE/d5 per pipeline employee
Note: Numbers presented in this report may not add up due to rounding.
Labour Productivity = Output
Labour Input
Labour benchmarks meanwhile are used to measure the productivity or efficiency of an industry’s labour force and answer the question “What workforce is required to produce the expected output?” Labour benchmarks are expressed as the inverse of productivity. For example, the benchmark for oil sands is employment per 10,000 BOE/d.
For easier identification, labour benchmarks are presented using oil barrel icons throughout this report. An alternate benchmark measure is also presented for the oil and gas services subsector as the direct output of labour is not production so much but a wide variety of service outputs. For this subsector, the labour benchmark used is employment per $100 Million of oil and gas expenditure.
The change in labour productivity (BOE/d per employee) or labour benchmarks (number of employees per 10,000 BOE/d) over a particular time period indicates improvements or declines in labour productivity.
From a labour perspective, a fundamental dynamic of many industries in Canada, including oil and gas, is that labour productivity tends to be depressed during high growth periods and typically improves during low growth or contractionary periods.6
Labour productivity improvements can be accomplished in two ways:
1. Requiring fewer people to accomplish the same amount of output. For example, improved drill bit, drill motor and path monitoring technologies have reduced the time, and, therefore manpower, to drill a well while achieving the same amount of production output.
2. Improving or increasing production output with the same amount of labour. For example, horizontal drilling allows better access to oil and gas reserves and increases output compared to vertical wells.
The two ways of increasing labour productivity are not mutually exclusive, as both labour requirements and output may be affected simultaneously by forces such as capital investment, innovation, human capital, regulatory changes and others.
Labour Productivity in Canada’s Oil and Gas Industry (September 2017) 5
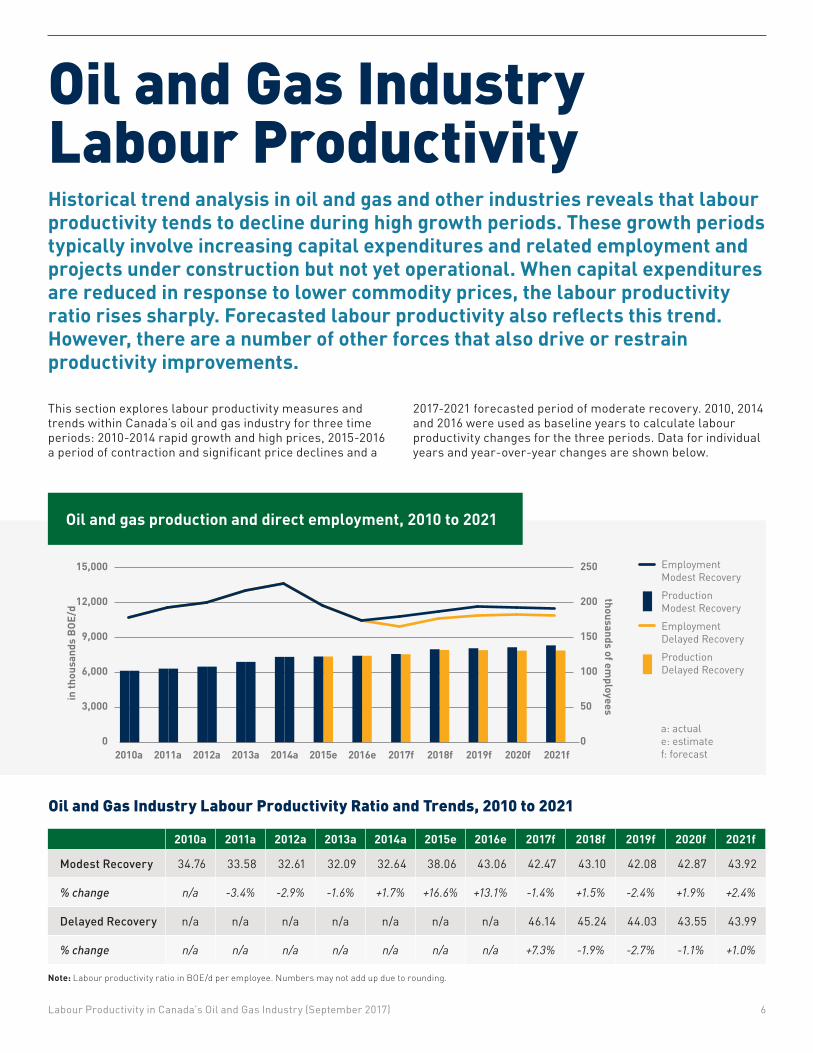
Oil and Gas Industry Labour Productivity Historical trend analysis in oil and gas and other industries reveals that labour productivity tends to decline during high growth periods. These growth periods typically involve increasing capital expenditures and related employment and projects under construction but not yet operational. When capital expenditures are reduced in response to lower commodity prices, the labour productivity ratio rises sharply. Forecasted labour productivity also reflects this trend. However, there are a number of other forces that also drive or restrain productivity improvements.
Oil and gas production and direct employment, 2010 to 2021
12,000
15,000
9,000
6,000
3,000
EmploymentModest RecoveryProduction Modest RecoveryEmploymentDelayed RecoveryProduction Delayed Recovery
0
200
250
150
100
50
02010a 2011a 2012a 2013a 2014a 2015e 2016e 2017f 2018f 2019f 2020f 2021f
in th
ousa
nds
BOE/
d
thousands of employees
a: actuale: estimatef: forecast
"PROD-Mod" "PROD-Del"6194 61946386 63866554 65546959 69597391 73917424 74247490 74907643 76208054 79878137 79768228 79318389 7945
"empy-Mod" "Empl-DEL"178 178192 192200.1 200.1216.9 216.9226.5 226.5195 195173.9 173.9180 165.2186.9 176.6193.4 181.1191.9 182.1191 180.6
Note: Labour productivity ratio in BOE/d per employee. Numbers may not add up due to rounding.
2010a 2011a 2012a 2013a 2014a 2015e 2016e 2017f 2018f 2019f 2020f 2021f
Modest Recovery 34.76 33.58 32.61 32.09 32.64 38.06 43.06 42.47 43.10 42.08 42.87 43.92
% change n/a -3.4% -2.9% -1.6% +1.7% +16.6% +13.1% -1.4% +1.5% -2.4% +1.9% +2.4%
Delayed Recovery n/a n/a n/a n/a n/a n/a n/a 46.14 45.24 44.03 43.55 43.99
% change n/a n/a n/a n/a n/a n/a n/a +7.3% -1.9% -2.7% -1.1% +1.0%
This section explores labour productivity measures and trends within Canada’s oil and gas industry for three time periods: 2010-2014 rapid growth and high prices, 2015-2016 a period of contraction and significant price declines and a
2017-2021 forecasted period of moderate recovery. 2010, 2014 and 2016 were used as baseline years to calculate labour productivity changes for the three periods. Data for individual years and year-over-year changes are shown below.
Oil and Gas Industry Labour Productivity Ratio and Trends, 2010 to 2021
Labour Productivity in Canada’s Oil and Gas Industry (September 2017) 6
Oil and Gas Industry Labour Productivity
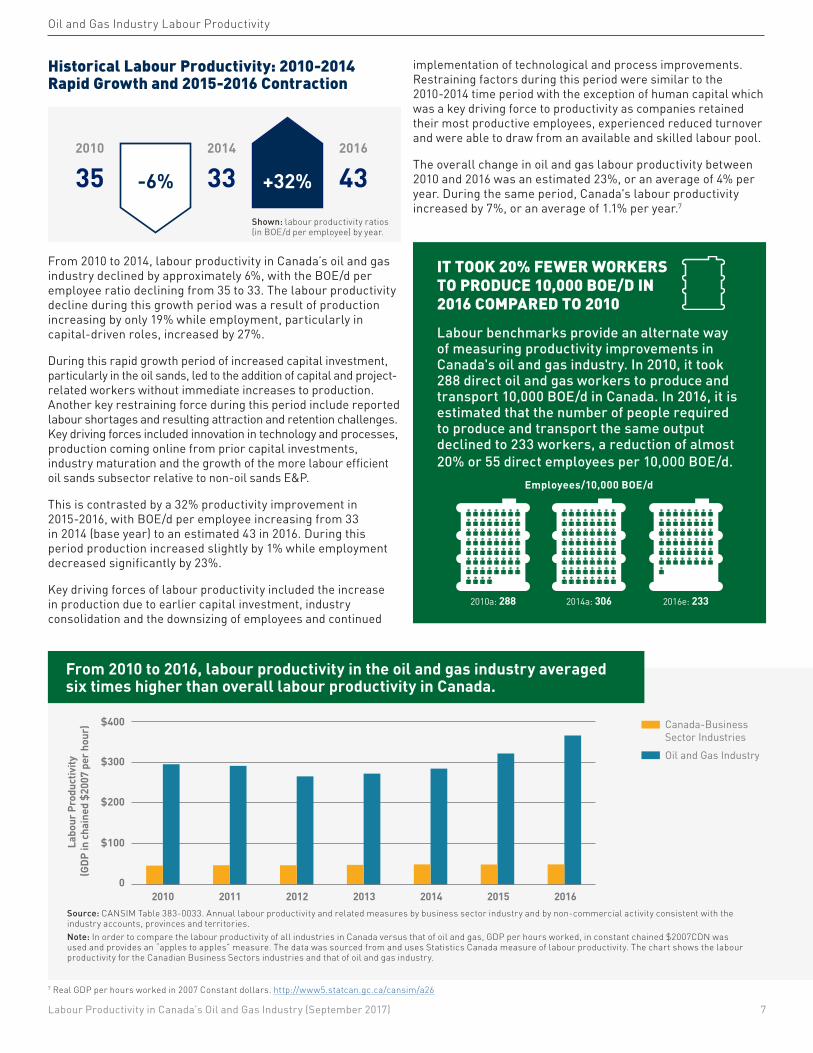
From 2010 to 2014, labour productivity in Canada’s oil and gas industry declined by approximately 6%, with the BOE/d per employee ratio declining from 35 to 33. The labour productivity decline during this growth period was a result of production increasing by only 19% while employment, particularly in capital-driven roles, increased by 27%.
During this rapid growth period of increased capital investment, particularly in the oil sands, led to the addition of capital and project-related workers without immediate increases to production. Another key restraining force during this period include reported labour shortages and resulting attraction and retention challenges. Key driving forces included innovation in technology and processes, production coming online from prior capital investments, industry maturation and the growth of the more labour efficient oil sands subsector relative to non-oil sands E&P.
This is contrasted by a 32% productivity improvement in 2015-2016, with BOE/d per employee increasing from 33 in 2014 (base year) to an estimated 43 in 2016. During this period production increased slightly by 1% while employment decreased significantly by 23%.
Key driving forces of labour productivity included the increase in production due to earlier capital investment, industry consolidation and the downsizing of employees and continued
Historical Labour Productivity: 2010-2014 Rapid Growth and 2015-2016 Contraction
7 Real GDP per hours worked in 2007 Constant dollars. http://www5.statcan.gc.ca/cansim/a26
2010 2011 2012 2013 2014 2015 2016
$400
$300
$200
$100
0
Canada-BusinessSector IndustriesOil and Gas Industry
Labo
ur P
rodu
ctiv
ity
(GDP
in ch
aine
d $2
007
per h
our)
From 2010 to 2016, labour productivity in the oil and gas industry averaged six times higher than overall labour productivity in Canada.
Source: CANSIM Table 383-0033. Annual labour productivity and related measures by business sector industry and by non-commercial activity consistent with the industry accounts, provinces and territories.Note: In order to compare the labour productivity of all industries in Canada versus that of oil and gas, GDP per hours worked, in constant chained $2007CDN was used and provides an “apples to apples” measure. The data was sourced from and uses Statistics Canada measure of labour productivity. The chart shows the labour productivity for the Canadian Business Sectors industries and that of oil and gas industry.
IT TOOK 20% FEWER WORKERS TO PRODUCE 10,000 BOE/D IN 2016 COMPARED TO 2010Labour benchmarks provide an alternate way of measuring productivity improvements in Canada's oil and gas industry. In 2010, it took 288 direct oil and gas workers to produce and transport 10,000 BOE/d in Canada. In 2016, it is estimated that the number of people required to produce and transport the same output declined to 233 workers, a reduction of almost 20% or 55 direct employees per 10,000 BOE/d.
2010a: 288
Employees/10,000 BOE/d
2014a: 306 2016e: 233
-6%
2010
352014
332016
43+32%
implementation of technological and process improvements. Restraining factors during this period were similar to the 2010-2014 time period with the exception of human capital which was a key driving force to productivity as companies retained their most productive employees, experienced reduced turnover and were able to draw from an available and skilled labour pool.
The overall change in oil and gas labour productivity between 2010 and 2016 was an estimated 23%, or an average of 4% per year. During the same period, Canada's labour productivity increased by 7%, or an average of 1.1% per year.7
Labour Productivity in Canada’s Oil and Gas Industry (September 2017) 7
Shown: labour productivity ratios (in BOE/d per employee) by year.
Oil and Gas Industry Labour Productivity
8 http://www.capp.ca/publications-and-statistics/crude-oil-forecast
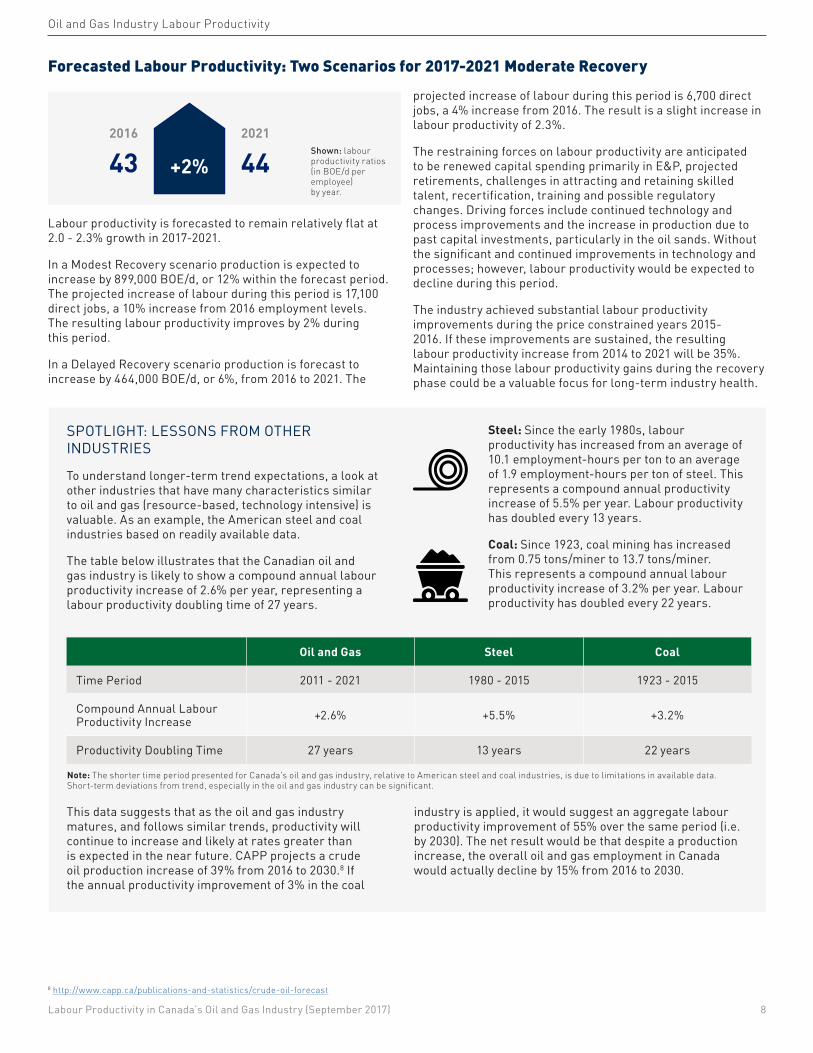
Labour productivity is forecasted to remain relatively flat at 2.0 - 2.3% growth in 2017-2021.
In a Modest Recovery scenario production is expected to increase by 899,000 BOE/d, or 12% within the forecast period. The projected increase of labour during this period is 17,100 direct jobs, a 10% increase from 2016 employment levels. The resulting labour productivity improves by 2% during this period.
In a Delayed Recovery scenario production is forecast to increase by 464,000 BOE/d, or 6%, from 2016 to 2021. The
projected increase of labour during this period is 6,700 direct jobs, a 4% increase from 2016. The result is a slight increase in labour productivity of 2.3%.
The restraining forces on labour productivity are anticipated to be renewed capital spending primarily in E&P, projected retirements, challenges in attracting and retaining skilled talent, recertification, training and possible regulatory changes. Driving forces include continued technology and process improvements and the increase in production due to past capital investments, particularly in the oil sands. Without the significant and continued improvements in technology and processes; however, labour productivity would be expected to decline during this period.
The industry achieved substantial labour productivity improvements during the price constrained years 2015-2016. If these improvements are sustained, the resulting labour productivity increase from 2014 to 2021 will be 35%. Maintaining those labour productivity gains during the recovery phase could be a valuable focus for long-term industry health.
Forecasted Labour Productivity: Two Scenarios for 2017-2021 Moderate Recovery
SPOTLIGHT: LESSONS FROM OTHER INDUSTRIES
To understand longer-term trend expectations, a look at other industries that have many characteristics similar to oil and gas (resource-based, technology intensive) is valuable. As an example, the American steel and coal industries based on readily available data.
The table below illustrates that the Canadian oil and gas industry is likely to show a compound annual labour productivity increase of 2.6% per year, representing a labour productivity doubling time of 27 years.
Steel: Since the early 1980s, labour productivity has increased from an average of 10.1 employment-hours per ton to an average of 1.9 employment-hours per ton of steel. This represents a compound annual productivity increase of 5.5% per year. Labour productivity has doubled every 13 years.
Coal: Since 1923, coal mining has increased from 0.75 tons/miner to 13.7 tons/miner. This represents a compound annual labour productivity increase of 3.2% per year. Labour productivity has doubled every 22 years.
This data suggests that as the oil and gas industry matures, and follows similar trends, productivity will continue to increase and likely at rates greater than is expected in the near future. CAPP projects a crude oil production increase of 39% from 2016 to 2030.8 If the annual productivity improvement of 3% in the coal
industry is applied, it would suggest an aggregate labour productivity improvement of 55% over the same period (i.e. by 2030). The net result would be that despite a production increase, the overall oil and gas employment in Canada would actually decline by 15% from 2016 to 2030.
Oil and Gas Steel Coal
Time Period 2011 - 2021 1980 - 2015 1923 - 2015
Compound Annual Labour Productivity Increase +2.6% +5.5% +3.2%
Productivity Doubling Time 27 years 13 years 22 years
2016
432021
44+2%
Note: The shorter time period presented for Canada's oil and gas industry, relative to American steel and coal industries, is due to limitations in available data. Short-term deviations from trend, especially in the oil and gas industry can be significant.
Labour Productivity in Canada’s Oil and Gas Industry (September 2017) 8
Shown: labour productivity ratios (in BOE/d per employee) by year.
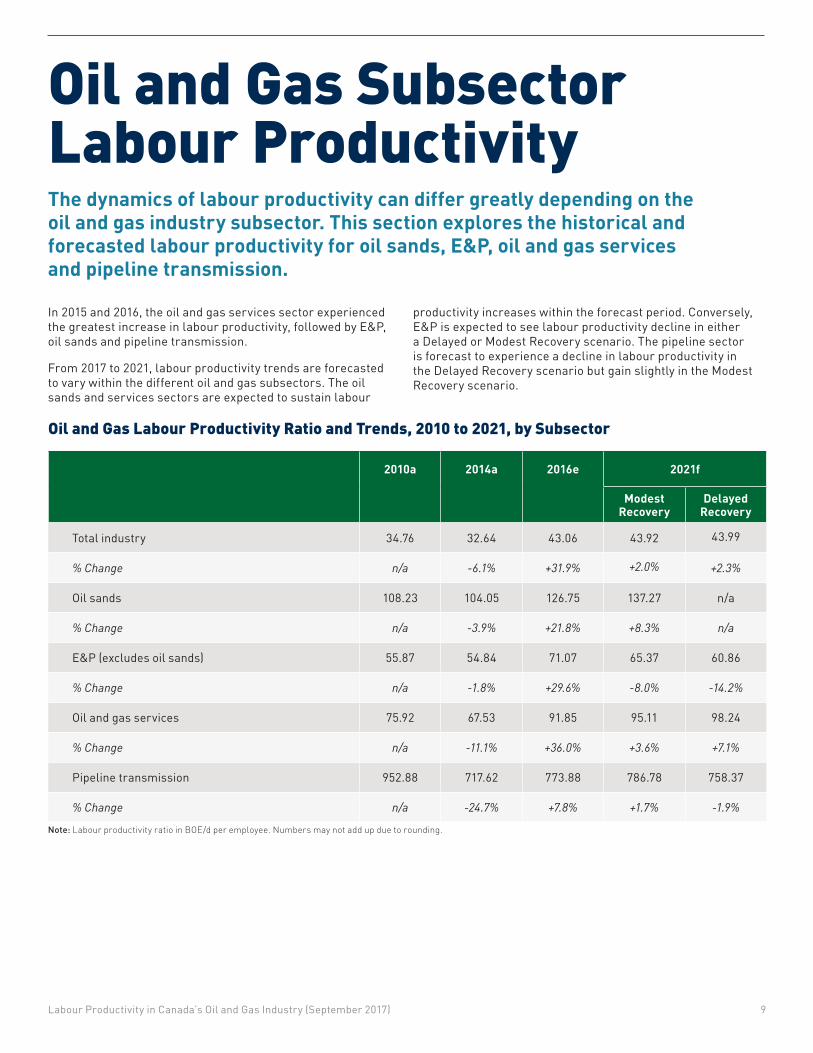
Oil and Gas Subsector Labour ProductivityThe dynamics of labour productivity can differ greatly depending on the oil and gas industry subsector. This section explores the historical and forecasted labour productivity for oil sands, E&P, oil and gas services and pipeline transmission.
In 2015 and 2016, the oil and gas services sector experienced the greatest increase in labour productivity, followed by E&P, oil sands and pipeline transmission.
From 2017 to 2021, labour productivity trends are forecasted to vary within the different oil and gas subsectors. The oil sands and services sectors are expected to sustain labour
productivity increases within the forecast period. Conversely, E&P is expected to see labour productivity decline in either a Delayed or Modest Recovery scenario. The pipeline sector is forecast to experience a decline in labour productivity in the Delayed Recovery scenario but gain slightly in the Modest Recovery scenario.
2010a 2014a 2016e 2021f
Modest Recovery
Delayed Recovery
Total industry 34.76 32.64 43.06 43.92 43.99
% Change n/a -6.1% +31.9% +2.0% +2.3%
Oil sands 108.23 104.05 126.75 137.27 n/a
% Change n/a -3.9% +21.8% +8.3% n/a
E&P (excludes oil sands) 55.87 54.84 71.07 65.37 60.86
% Change n/a -1.8% +29.6% -8.0% -14.2%
Oil and gas services 75.92 67.53 91.85 95.11 98.24
% Change n/a -11.1% +36.0% +3.6% +7.1%
Pipeline transmission 952.88 717.62 773.88 786.78 758.37
% Change n/a -24.7% +7.8% +1.7% -1.9%
Note: Labour productivity ratio in BOE/d per employee. Numbers may not add up due to rounding.
Oil and Gas Labour Productivity Ratio and Trends, 2010 to 2021, by Subsector
Labour Productivity in Canada’s Oil and Gas Industry (September 2017) 9
Subsector Labour Productivity Analysis
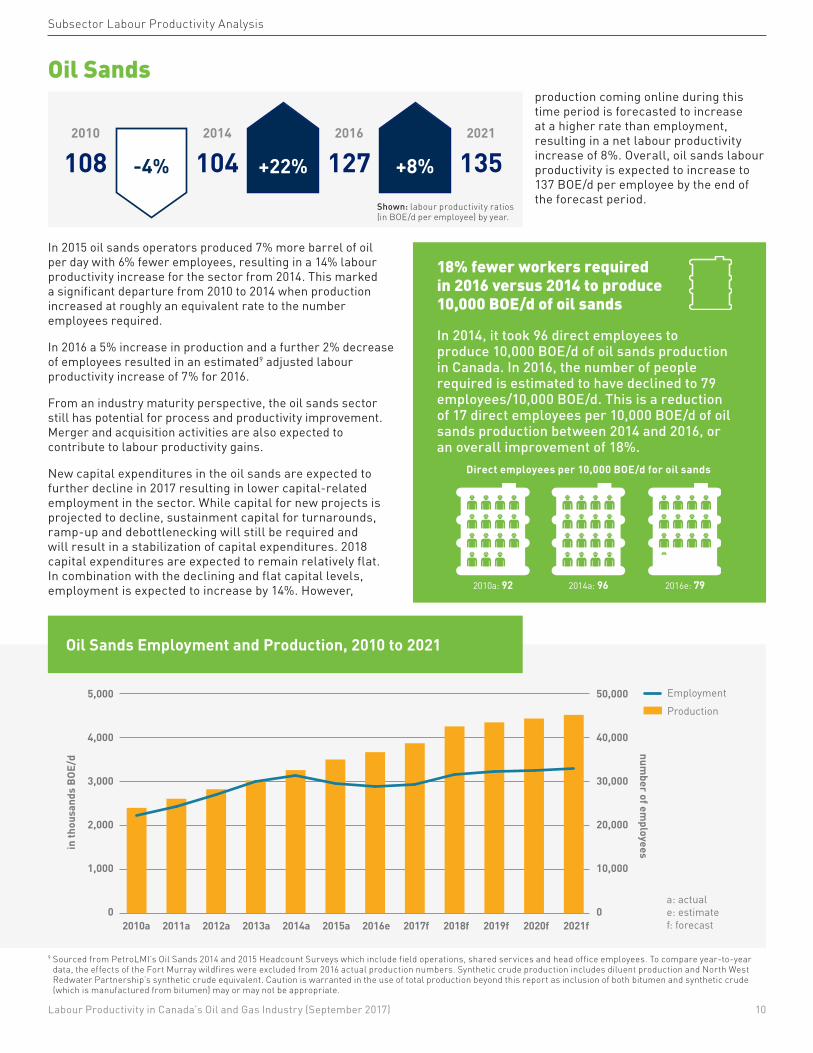
In 2015 oil sands operators produced 7% more barrel of oil per day with 6% fewer employees, resulting in a 14% labour productivity increase for the sector from 2014. This marked a significant departure from 2010 to 2014 when production increased at roughly an equivalent rate to the number employees required.
In 2016 a 5% increase in production and a further 2% decrease of employees resulted in an estimated9 adjusted labour productivity increase of 7% for 2016.
From an industry maturity perspective, the oil sands sector still has potential for process and productivity improvement. Merger and acquisition activities are also expected to contribute to labour productivity gains.
New capital expenditures in the oil sands are expected to further decline in 2017 resulting in lower capital-related employment in the sector. While capital for new projects is projected to decline, sustainment capital for turnarounds, ramp-up and debottlenecking will still be required and will result in a stabilization of capital expenditures. 2018 capital expenditures are expected to remain relatively flat. In combination with the declining and flat capital levels, employment is expected to increase by 14%. However,
production coming online during this time period is forecasted to increase at a higher rate than employment, resulting in a net labour productivity increase of 8%. Overall, oil sands labour productivity is expected to increase to 137 BOE/d per employee by the end of the forecast period.
Oil Sands
Oil Sands Employment and Production, 2010 to 2021
2010a 2011a 2012a 2013a 2014a 2015a 2016e 2017f 2018f 2019f 2020f 2021f
5,000
4,000
3,000
2,000
1,000
0
50,000
40,000
30,000
20,000
10,000
0
EmploymentProduction
in th
ousa
nds
BOE/
d
number of em
ployees
a: actuale: estimatef: forecast
18% fewer workers required in 2016 versus 2014 to produce 10,000 BOE/d of oil sands
In 2014, it took 96 direct employees to produce 10,000 BOE/d of oil sands production in Canada. In 2016, the number of people required is estimated to have declined to 79 employees/10,000 BOE/d. This is a reduction of 17 direct employees per 10,000 BOE/d of oil sands production between 2014 and 2016, or an overall improvement of 18%.
2010a: 92
Direct employees per 10,000 BOE/d for oil sands
2014a: 96 2016e: 79
-4%
2010
1082014
1042016
1272021
135+22% +8%
9 Sourced from PetroLMI’s Oil Sands 2014 and 2015 Headcount Surveys which include field operations, shared services and head office employees. To compare year-to-year data, the effects of the Fort Murray wildfires were excluded from 2016 actual production numbers. Synthetic crude production includes diluent production and North West Redwater Partnership’s synthetic crude equivalent. Caution is warranted in the use of total production beyond this report as inclusion of both bitumen and synthetic crude (which is manufactured from bitumen) may or may not be appropriate.
Labour Productivity in Canada’s Oil and Gas Industry (September 2017) 10
Shown: labour productivity ratios (in BOE/d per employee) by year.
Subsector Labour Productivity Analysis
Labour Productivity within Oil Sands In situ, Mining and Upgrading OperationsLabour productivity, as shown in the table below, trends differently between the three oil sands operations.
2010a 2014a 2016e 2021f
Total oil sands 108.23 104.05 126.75 137.27
% Change n/a -3.9% +21.8% +8.3%
In situ 124.71 112.30 158.55 157.83
% Change n/a -9.9% +41.2% -0.5%
Mining 75.99 70.40 81.10 90.11
% Change n/a -7.4% +15.2% +11.1%
Upgrading 163.22 180.42 205.76 273.42
% Change n/a +10.5% +14.0% +32.9%
Note: Labour productivity for the oil sands operations type are as follows: In situ = In situ BOE/d per in situ employee; Mining = Mining BOE/d per mining employee; and Upgrading = Upgrading and utilities Synthetic Crude Equivalent BOE/d per upgrading employee.
Source: PetroLMI Oil Sands Headcount Survey, 2016 and Canadian Association of Petroleum Producers, 2016Note: Caution is warranted in the use of benchmarking by companies, as the use of contractors as well as being in a building versus operating phases may dramatically affect the number of employees required within an organization.
Labour benchmarks by oil sands operations type
Labour benchmarks by oil sands operations type are examined for operators with outputs of at least 5,000 BOE/d. Capital expenditure is provided for context as the amount spent on construction and exploration activity also affects the number of employees a company requires. This benchmarking is useful for existing and new operators for planning future operations labour requirements and for comparison of existing operations to the industry.
Labour Benchmarks for Oil Sands Operators with Greater than 5,000 BOE/d
Employee per 10,000 BOE/d 2014a 2016e
In situ 95 72
Mining 158 144
Upgrading 51 42
Capital spend (in 2015 $CDN Millions) per 10,000 BOE/d
2014a 2016e
In situ $ 156 $ 56
Mining $ 125 $ 90
Upgrading $ 31 $ 37
2010a 2011a 2012a 2013a 2014a 2015e 2016e 2017f 2018f 2019f 2020f 2021fLabour productivity (BOE/d per employee)
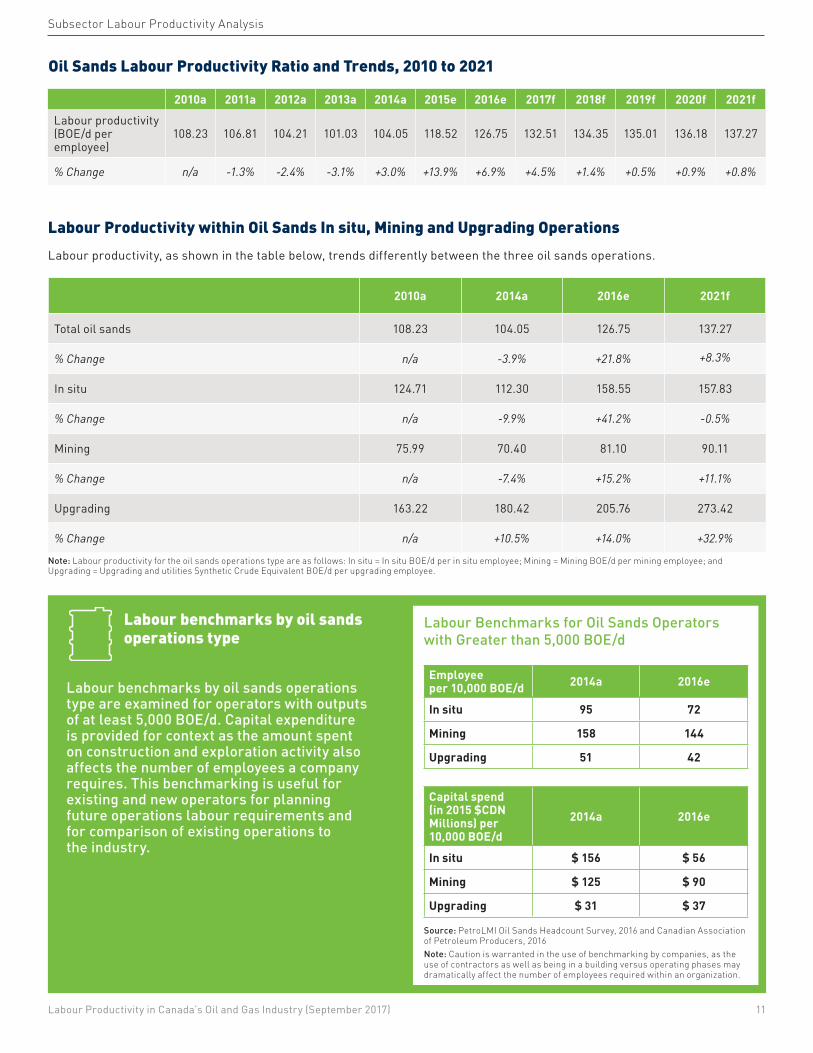
108.23 106.81 104.21 101.03 104.05 118.52 126.75 132.51 134.35 135.01 136.18 137.27
% Change n/a -1.3% -2.4% -3.1% +3.0% +13.9% +6.9% +4.5% +1.4% +0.5% +0.9% +0.8%
Oil Sands Labour Productivity Ratio and Trends, 2010 to 2021
Labour Productivity in Canada’s Oil and Gas Industry (September 2017) 11
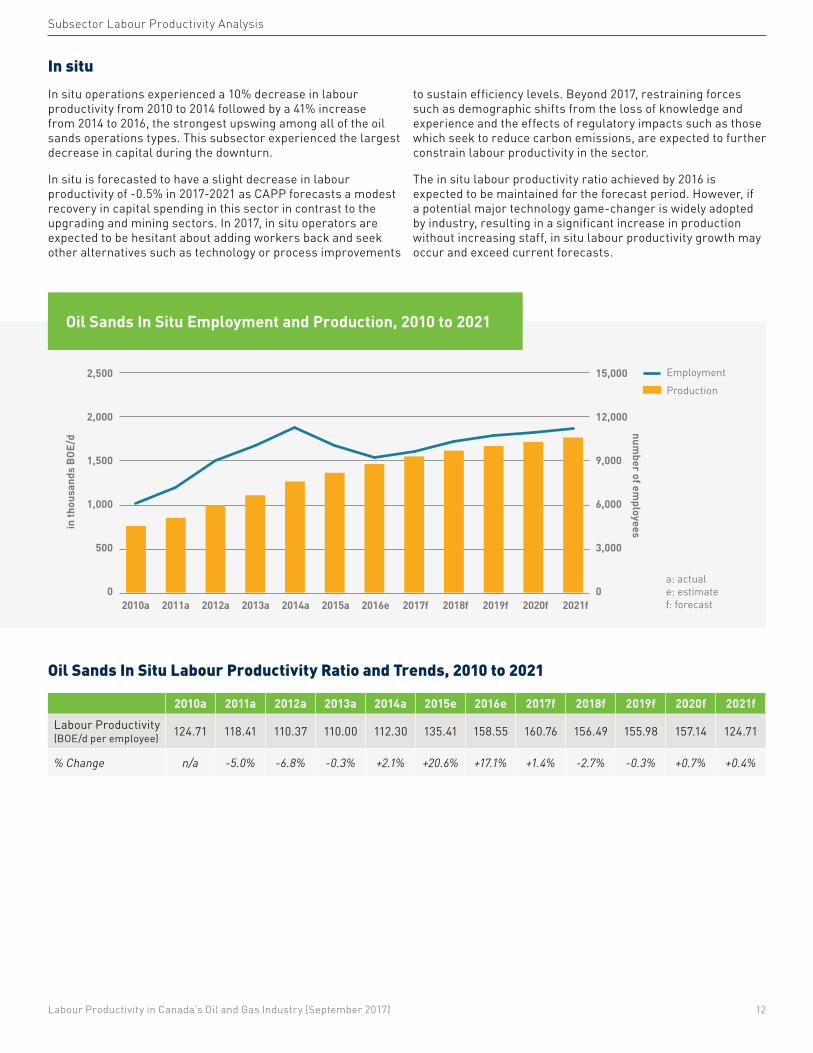
In situIn situ operations experienced a 10% decrease in labour productivity from 2010 to 2014 followed by a 41% increase from 2014 to 2016, the strongest upswing among all of the oil sands operations types. This subsector experienced the largest decrease in capital during the downturn.
In situ is forecasted to have a slight decrease in labour productivity of -0.5% in 2017-2021 as CAPP forecasts a modest recovery in capital spending in this sector in contrast to the upgrading and mining sectors. In 2017, in situ operators are expected to be hesitant about adding workers back and seek other alternatives such as technology or process improvements
to sustain efficiency levels. Beyond 2017, restraining forces such as demographic shifts from the loss of knowledge and experience and the effects of regulatory impacts such as those which seek to reduce carbon emissions, are expected to further constrain labour productivity in the sector.
The in situ labour productivity ratio achieved by 2016 is expected to be maintained for the forecast period. However, if a potential major technology game-changer is widely adopted by industry, resulting in a significant increase in production without increasing staff, in situ labour productivity growth may occur and exceed current forecasts.
Subsector Labour Productivity Analysis
Oil Sands In Situ Employment and Production, 2010 to 2021
2010a 2011a 2012a 2013a 2014a 2015a 2016e 2017f 2018f 2019f 2020f 2021f
2,500
2,000
1,500
1,000
500
0
15,000
12,000
9,000
6,000
3,000
0
EmploymentProduction
in th
ousa
nds
BOE/
d
number of em
ployees
a: actuale: estimatef: forecast
2010a 2011a 2012a 2013a 2014a 2015e 2016e 2017f 2018f 2019f 2020f 2021fLabour Productivity (BOE/d per employee) 124.71 118.41 110.37 110.00 112.30 135.41 158.55 160.76 156.49 155.98 157.14 124.71
% Change n/a -5.0% -6.8% -0.3% +2.1% +20.6% +17.1% +1.4% -2.7% -0.3% +0.7% +0.4%
Oil Sands In Situ Labour Productivity Ratio and Trends, 2010 to 2021
Labour Productivity in Canada’s Oil and Gas Industry (September 2017) 12
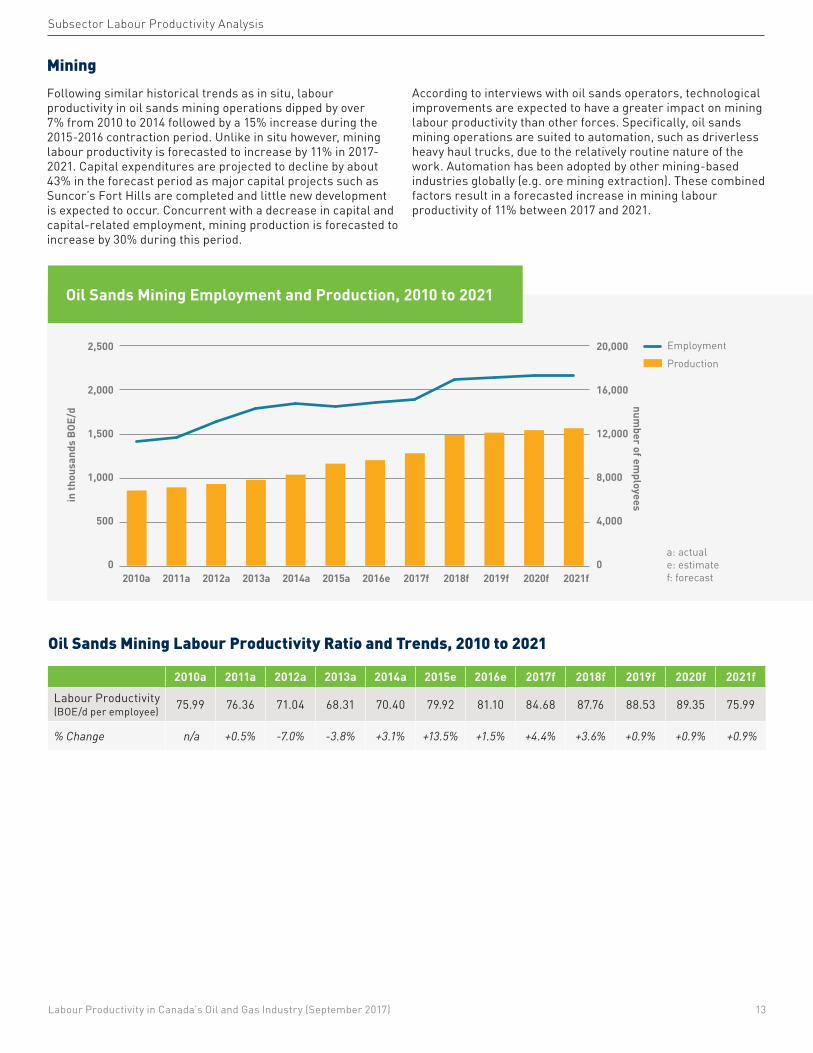
MiningFollowing similar historical trends as in situ, labour productivity in oil sands mining operations dipped by over 7% from 2010 to 2014 followed by a 15% increase during the 2015-2016 contraction period. Unlike in situ however, mining labour productivity is forecasted to increase by 11% in 2017-2021. Capital expenditures are projected to decline by about 43% in the forecast period as major capital projects such as Suncor’s Fort Hills are completed and little new development is expected to occur. Concurrent with a decrease in capital and capital-related employment, mining production is forecasted to increase by 30% during this period.
According to interviews with oil sands operators, technological improvements are expected to have a greater impact on mining labour productivity than other forces. Specifically, oil sands mining operations are suited to automation, such as driverless heavy haul trucks, due to the relatively routine nature of the work. Automation has been adopted by other mining-based industries globally (e.g. ore mining extraction). These combined factors result in a forecasted increase in mining labour productivity of 11% between 2017 and 2021.
Subsector Labour Productivity Analysis
2010a 2011a 2012a 2013a 2014a 2015a 2016e 2017f 2018f 2019f 2020f 2021f
2,500
2,000
1,500
1,000
500
0
20,000
16,000
12,000
8,000
4,000
0
EmploymentProduction
in th
ousa
nds
BOE/
d
number of em
ployees
a: actuale: estimatef: forecast
Oil Sands Mining Employment and Production, 2010 to 2021
2010a 2011a 2012a 2013a 2014a 2015e 2016e 2017f 2018f 2019f 2020f 2021fLabour Productivity (BOE/d per employee) 75.99 76.36 71.04 68.31 70.40 79.92 81.10 84.68 87.76 88.53 89.35 75.99
% Change n/a +0.5% -7.0% -3.8% +3.1% +13.5% +1.5% +4.4% +3.6% +0.9% +0.9% +0.9%
Oil Sands Mining Labour Productivity Ratio and Trends, 2010 to 2021
Labour Productivity in Canada’s Oil and Gas Industry (September 2017) 13

Subsector Labour Productivity Analysis
Upgrading Labour productivity within oil sands upgrading operations reflects a unique trend. It is the only subsector that showed productivity gains from 2010 to 2014 and sustained if not further improved growth levels in 2015-2016 and through to 2021.
It also experienced the highest improvement in forecasted labour productivity, increasing by an estimated 33% within the five-year forecast. This is due in part to a 64% decrease in forecasted capital spending during 2017-2018, which relates primarily to completed maintenance work in 2015-2016. Decreased capital also relates to the completion of the North West Redwater Partnership – Sturgeon facility (NWR) in
2017-2018, a major upgrading/refinery facility currently under construction. At the same time capital spending is declining, upgrading production is forecasted to increase by 19% due to debottlenecking, reliability improvements, an increase in oil sands bitumen to be upgraded and the completion of the NWR facility. The combination of shrinking capital-related employees and new production from past investment lead to the significant forecasted labour productivity improvements.
2010a 2011a 2012a 2013a 2014a 2015a 2016e 2017f 2018f 2019f 2020f 2021f
1,800
1,500
900
1,200
600
300
6,000
4,000
5,000
3,000
2,000
1,000
0
EmploymentProduction
0
in th
ousa
nds
BOE/
d
number of em
ployees
a: actuale: estimatef: forecast
Oil Sands Upgrading Employment and Production, 2010 to 2021
2010a 2011a 2012a 2013a 2014a 2015e 2016e 2017f 2018f 2019f 2020f 2021fLabour Productivity (BOE/d per employee) 163.22 156.36 180.49 169.36 180.42 198.14 205.76 234.75 263.28 266.33 269.89 75.99
% Change n/a -4.2% +15.4% -6.2% +6.5% +9.8% +3.8% +14.1% +12.2% +1.2% +1.3% +1.3%
Oil Sands Upgrading Labour Productivity Ratio and Trends, 2010 to 2021
Labour Productivity in Canada’s Oil and Gas Industry (September 2017) 14
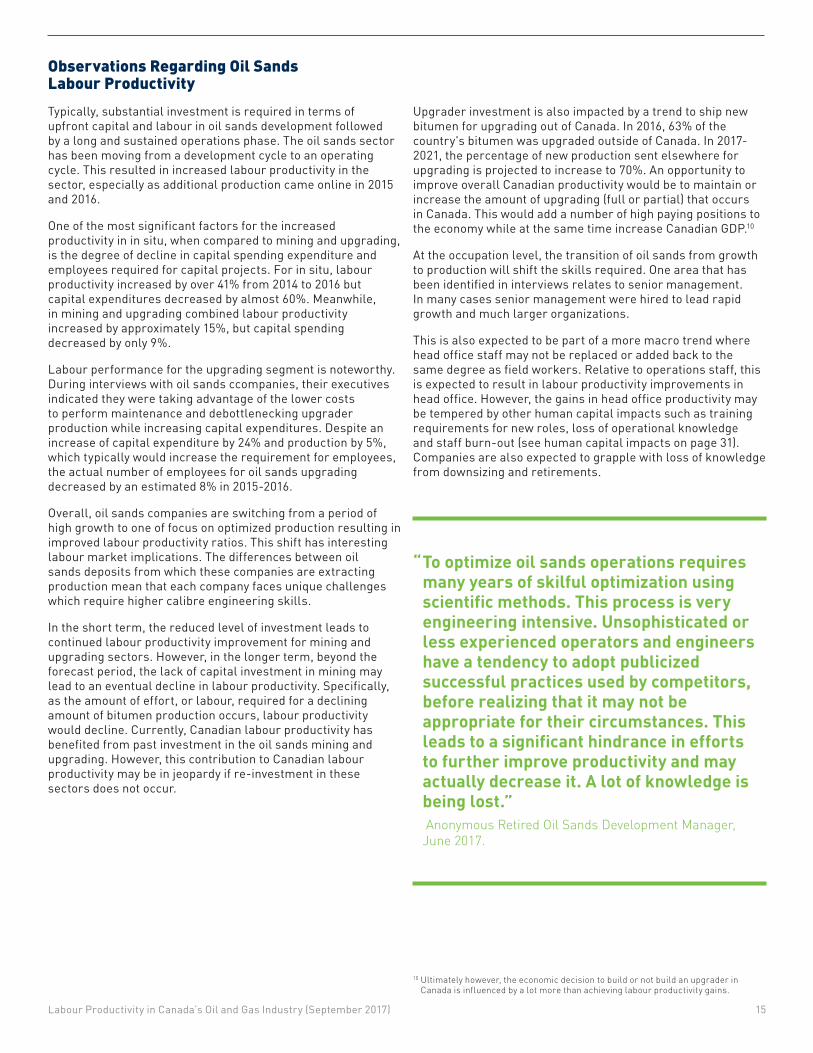
Observations Regarding Oil Sands Labour Productivity Typically, substantial investment is required in terms of upfront capital and labour in oil sands development followed by a long and sustained operations phase. The oil sands sector has been moving from a development cycle to an operating cycle. This resulted in increased labour productivity in the sector, especially as additional production came online in 2015 and 2016.
One of the most significant factors for the increased productivity in in situ, when compared to mining and upgrading, is the degree of decline in capital spending expenditure and employees required for capital projects. For in situ, labour productivity increased by over 41% from 2014 to 2016 but capital expenditures decreased by almost 60%. Meanwhile, in mining and upgrading combined labour productivity increased by approximately 15%, but capital spending decreased by only 9%.
Labour performance for the upgrading segment is noteworthy. During interviews with oil sands ccompanies, their executives indicated they were taking advantage of the lower costs to perform maintenance and debottlenecking upgrader production while increasing capital expenditures. Despite an increase of capital expenditure by 24% and production by 5%, which typically would increase the requirement for employees, the actual number of employees for oil sands upgrading decreased by an estimated 8% in 2015-2016.
Overall, oil sands companies are switching from a period of high growth to one of focus on optimized production resulting in improved labour productivity ratios. This shift has interesting labour market implications. The differences between oil sands deposits from which these companies are extracting production mean that each company faces unique challenges which require higher calibre engineering skills.
In the short term, the reduced level of investment leads to continued labour productivity improvement for mining and upgrading sectors. However, in the longer term, beyond the forecast period, the lack of capital investment in mining may lead to an eventual decline in labour productivity. Specifically, as the amount of effort, or labour, required for a declining amount of bitumen production occurs, labour productivity would decline. Currently, Canadian labour productivity has benefited from past investment in the oil sands mining and upgrading. However, this contribution to Canadian labour productivity may be in jeopardy if re-investment in these sectors does not occur.
Upgrader investment is also impacted by a trend to ship new bitumen for upgrading out of Canada. In 2016, 63% of the country's bitumen was upgraded outside of Canada. In 2017-2021, the percentage of new production sent elsewhere for upgrading is projected to increase to 70%. An opportunity to improve overall Canadian productivity would be to maintain or increase the amount of upgrading (full or partial) that occurs in Canada. This would add a number of high paying positions to the economy while at the same time increase Canadian GDP.10
At the occupation level, the transition of oil sands from growth to production will shift the skills required. One area that has been identified in interviews relates to senior management. In many cases senior management were hired to lead rapid growth and much larger organizations.
This is also expected to be part of a more macro trend where head office staff may not be replaced or added back to the same degree as field workers. Relative to operations staff, this is expected to result in labour productivity improvements in head office. However, the gains in head office productivity may be tempered by other human capital impacts such as training requirements for new roles, loss of operational knowledge and staff burn-out (see human capital impacts on page 31). Companies are also expected to grapple with loss of knowledge from downsizing and retirements.
“ To optimize oil sands operations requires many years of skilful optimization using scientific methods. This process is very engineering intensive. Unsophisticated or less experienced operators and engineers have a tendency to adopt publicized successful practices used by competitors, before realizing that it may not be appropriate for their circumstances. This leads to a significant hindrance in efforts to further improve productivity and may actually decrease it. A lot of knowledge is being lost.” Anonymous Retired Oil Sands Development Manager, June 2017.
10 Ultimately however, the economic decision to build or not build an upgrader in Canada is influenced by a lot more than achieving labour productivity gains.
Labour Productivity in Canada’s Oil and Gas Industry (September 2017) 15
Subsector Labour Productivity Analysis
Exploration and Production
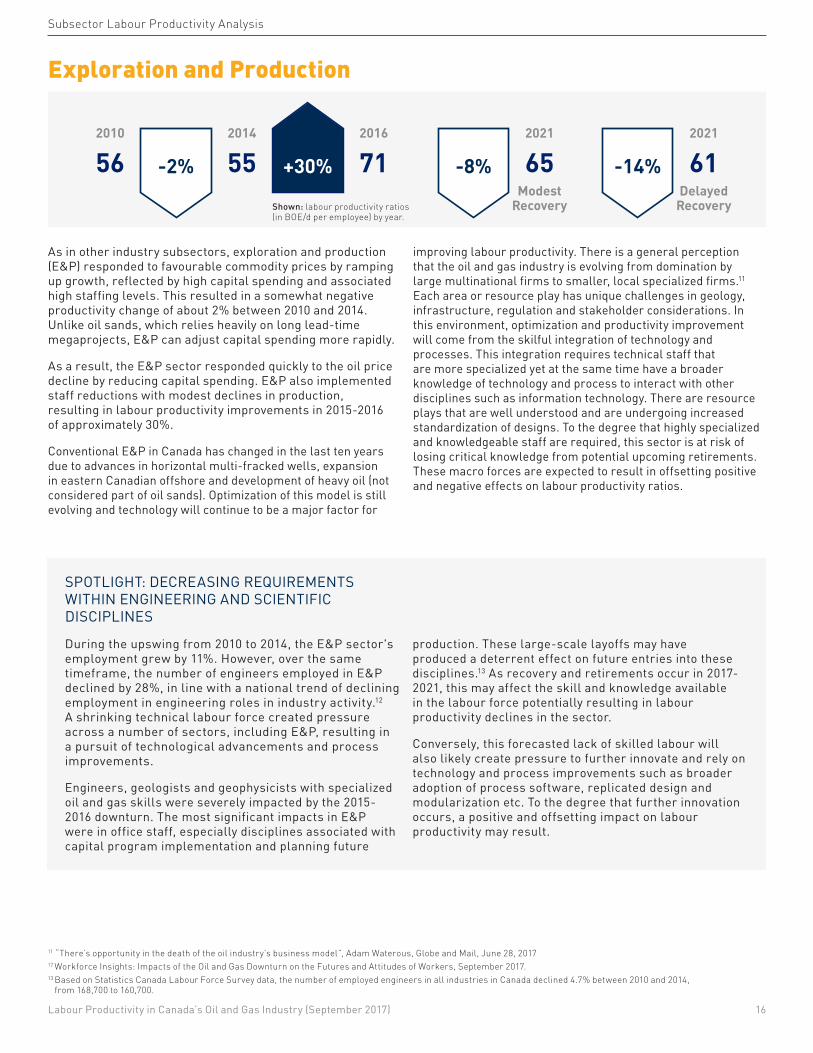
As in other industry subsectors, exploration and production (E&P) responded to favourable commodity prices by ramping up growth, reflected by high capital spending and associated high staffing levels. This resulted in a somewhat negative productivity change of about 2% between 2010 and 2014. Unlike oil sands, which relies heavily on long lead-time megaprojects, E&P can adjust capital spending more rapidly.
As a result, the E&P sector responded quickly to the oil price decline by reducing capital spending. E&P also implemented staff reductions with modest declines in production, resulting in labour productivity improvements in 2015-2016 of approximately 30%.
Conventional E&P in Canada has changed in the last ten years due to advances in horizontal multi-fracked wells, expansion in eastern Canadian offshore and development of heavy oil (not considered part of oil sands). Optimization of this model is still evolving and technology will continue to be a major factor for
improving labour productivity. There is a general perception that the oil and gas industry is evolving from domination by large multinational firms to smaller, local specialized firms.11 Each area or resource play has unique challenges in geology, infrastructure, regulation and stakeholder considerations. In this environment, optimization and productivity improvement will come from the skilful integration of technology and processes. This integration requires technical staff that are more specialized yet at the same time have a broader knowledge of technology and process to interact with other disciplines such as information technology. There are resource plays that are well understood and are undergoing increased standardization of designs. To the degree that highly specialized and knowledgeable staff are required, this sector is at risk of losing critical knowledge from potential upcoming retirements. These macro forces are expected to result in offsetting positive and negative effects on labour productivity ratios.
SPOTLIGHT: DECREASING REQUIREMENTS WITHIN ENGINEERING AND SCIENTIFIC DISCIPLINES
During the upswing from 2010 to 2014, the E&P sector's employment grew by 11%. However, over the same timeframe, the number of engineers employed in E&P declined by 28%, in line with a national trend of declining employment in engineering roles in industry activity.12 A shrinking technical labour force created pressure across a number of sectors, including E&P, resulting in a pursuit of technological advancements and process improvements.
Engineers, geologists and geophysicists with specialized oil and gas skills were severely impacted by the 2015-2016 downturn. The most significant impacts in E&P were in office staff, especially disciplines associated with capital program implementation and planning future
production. These large-scale layoffs may have produced a deterrent effect on future entries into these disciplines.13 As recovery and retirements occur in 2017-2021, this may affect the skill and knowledge available in the labour force potentially resulting in labour productivity declines in the sector.
Conversely, this forecasted lack of skilled labour will also likely create pressure to further innovate and rely on technology and process improvements such as broader adoption of process software, replicated design and modularization etc. To the degree that further innovation occurs, a positive and offsetting impact on labour productivity may result.
11 “There’s opportunity in the death of the oil industry’s business model”, Adam Waterous, Globe and Mail, June 28, 201712 Workforce Insights: Impacts of the Oil and Gas Downturn on the Futures and Attitudes of Workers, September 2017. 13 Based on Statistics Canada Labour Force Survey data, the number of employed engineers in all industries in Canada declined 4.7% between 2010 and 2014,
from 168,700 to 160,700.
-2%
2010
562014
552016
71 -8%
2021
65Modest
Recovery
-14%
2021
61Delayed
Recovery
+30%
Labour Productivity in Canada’s Oil and Gas Industry (September 2017) 16
Shown: labour productivity ratios (in BOE/d per employee) by year.
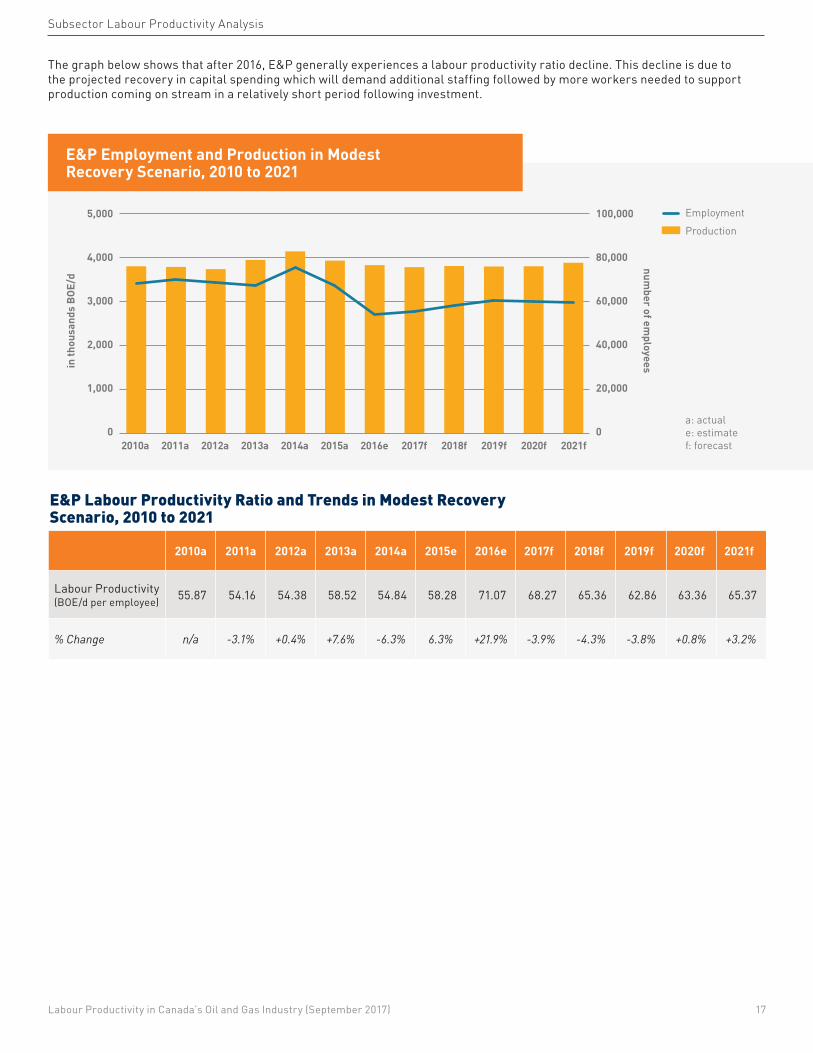
The graph below shows that after 2016, E&P generally experiences a labour productivity ratio decline. This decline is due to the projected recovery in capital spending which will demand additional staffing followed by more workers needed to support production coming on stream in a relatively short period following investment.
E&P Employment and Production in Modest Recovery Scenario, 2010 to 2021
2010a 2011a 2012a 2013a 2014a 2015a 2016e 2017f 2018f 2019f 2020f 2021f
5,000
4,000
3,000
2,000
1,000
0
100,000
80,000
60,000
40,000
20,000
0
EmploymentProduction
a: actuale: estimatef: forecast
in th
ousa
nds
BOE/
d
number of em
ployees
2010a 2011a 2012a 2013a 2014a 2015e 2016e 2017f 2018f 2019f 2020f 2021f
Labour Productivity (BOE/d per employee) 55.87 54.16 54.38 58.52 54.84 58.28 71.07 68.27 65.36 62.86 63.36 65.37
% Change n/a -3.1% +0.4% +7.6% -6.3% 6.3% +21.9% -3.9% -4.3% -3.8% +0.8% +3.2%
E&P Labour Productivity Ratio and Trends in Modest Recovery Scenario, 2010 to 2021
Subsector Labour Productivity Analysis
Labour Productivity in Canada’s Oil and Gas Industry (September 2017) 17
2010a 2011a 2012a 2013a 2014a 2015e 2016e 2017f 2018f 2019f 2020f 2021f
Labour productivity (BOE/d per employee)
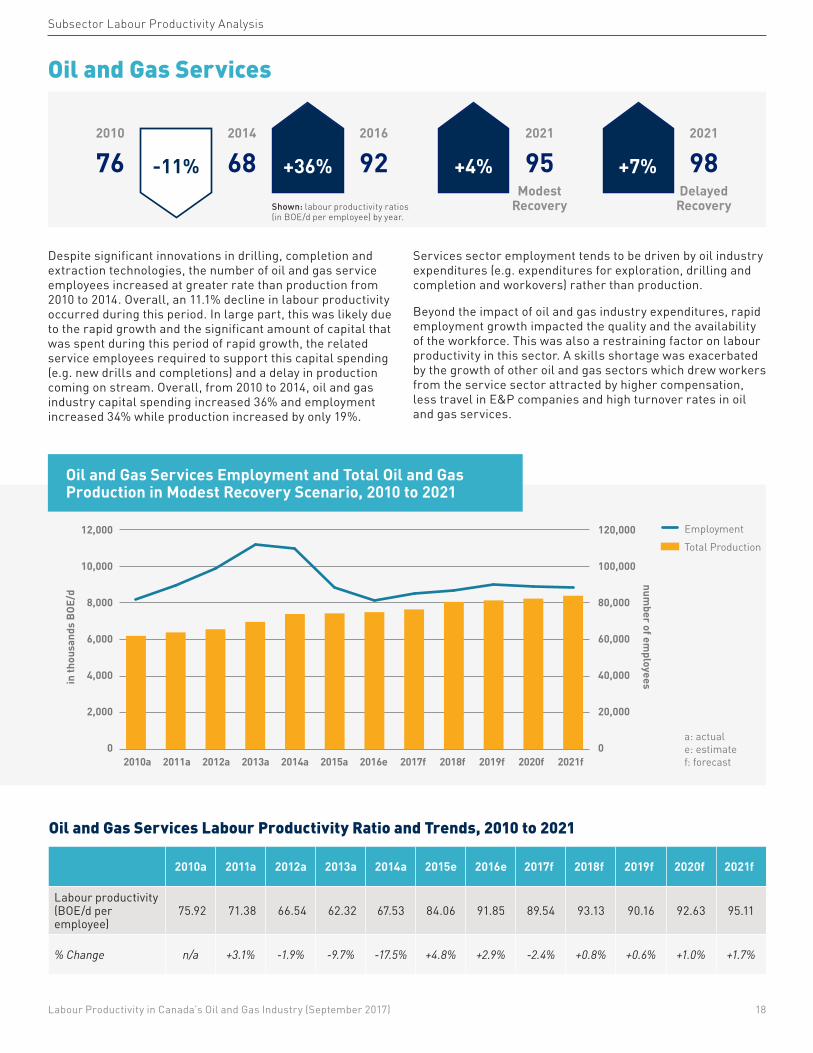
75.92 71.38 66.54 62.32 67.53 84.06 91.85 89.54 93.13 90.16 92.63 95.11
% Change n/a +3.1% -1.9% -9.7% -17.5% +4.8% +2.9% -2.4% +0.8% +0.6% +1.0% +1.7%
Oil and Gas Services Labour Productivity Ratio and Trends, 2010 to 2021
Subsector Labour Productivity Analysis
Oil and Gas Services
Despite significant innovations in drilling, completion and extraction technologies, the number of oil and gas service employees increased at greater rate than production from 2010 to 2014. Overall, an 11.1% decline in labour productivity occurred during this period. In large part, this was likely due to the rapid growth and the significant amount of capital that was spent during this period of rapid growth, the related service employees required to support this capital spending (e.g. new drills and completions) and a delay in production coming on stream. Overall, from 2010 to 2014, oil and gas industry capital spending increased 36% and employment increased 34% while production increased by only 19%.
Services sector employment tends to be driven by oil industry expenditures (e.g. expenditures for exploration, drilling and completion and workovers) rather than production.
Beyond the impact of oil and gas industry expenditures, rapid employment growth impacted the quality and the availability of the workforce. This was also a restraining factor on labour productivity in this sector. A skills shortage was exacerbated by the growth of other oil and gas sectors which drew workers from the service sector attracted by higher compensation, less travel in E&P companies and high turnover rates in oil and gas services.
Oil and Gas Services Employment and Total Oil and Gas Production in Modest Recovery Scenario, 2010 to 2021
2010a 2011a 2012a 2013a 2014a 2015a 2016e 2017f 2018f 2019f 2020f 2021f
12,000
10,000
8,000
6,000
4,000
2,000
0
120,000
100,000
80,000
60,000
40,000
20,000
0
EmploymentTotal Production
a: actuale: estimatef: forecast
in th
ousa
nds
BOE/
d
number of em
ployees -11%
2010
762014
682016
922021
95Modest
Recovery
2021
98Delayed
Recovery
+36% +4% +7%
Labour Productivity in Canada’s Oil and Gas Industry (September 2017) 18
Shown: labour productivity ratios (in BOE/d per employee) by year.
The oil and gas services labour productivity ratio started to improve in 2014, despite increases in oil industry expenditures and production. This suggests that technology and process improvements were strong driving forces for the sector’s labour productivity in 2014. The subsector also appears to have had a quicker reaction to the business environment, as the impact of lower oil prices was passed on to service companies in the fourth quarter of 2014 driving these companies to operate more efficiently.
Labour productivity in the sector increased by 36% in the 2015–2016 period as a result of continued increase in oil and gas production and the large reduction of direct employees.
The labour productivity improvements achieved by implementing new technologies and processes beginning in 2014 are generally expected to be sustained in both the Modest and Delayed Recovery scenarios from 2017 to 2021.
In the five year forecast, as oil and gas prices recover to a more modest level, some pricing recovery in the service sector is expected. As such, service labour productivity is expected to improve as new workers will not have to be proportionally added, as the case in E&P and oil sands. Another driving force to service labour productivity in 2017-2021 will be increased oil and gas production largely due to past capital expenditures.
Service companies are expected to face acute labour shortages. Industry interviews reveal that employees laid off during the downturn may have permanently left the industry due to the industry’s cyclical nature and relative declines in compensation. As new employees are hired, the loss of experience and additional training requirements are expected to adversely affect productivity. Even in the case of experienced workers returning, there is a certain amount of recertification and training for new
technology that will be required and will contribute to a decline in labour productivity.
Further exacerbating this lack of experience and training requirements, the service sector is forecasted to lose 10,000 employees due to retirements.14 Already, the service industry is experiencing difficulty in attracting and recruiting sufficient talent. In a survey of oil and gas companies in early February 2017, almost all service company respondents reported difficulties filling job vacancies.15
This workforce challenge is expected to be offset by continued productivity gains from innovation. Further improvements are anticipated in drilling, completion and extraction, automation, remote systems, increased digitalization of the industry and other processes. In part, the continued competitive environment along with the difficulty of attracting talent could accelerate the pursuit and adoption of technology and process improvements.
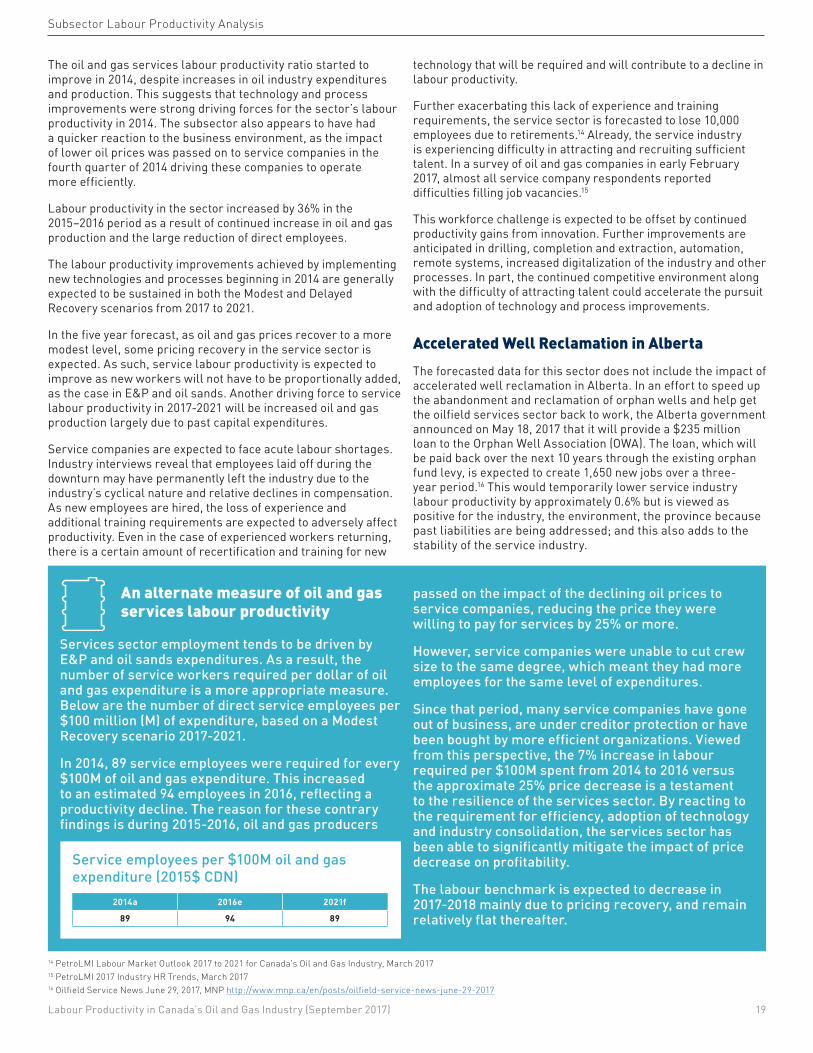
Accelerated Well Reclamation in Alberta The forecasted data for this sector does not include the impact of accelerated well reclamation in Alberta. In an effort to speed up the abandonment and reclamation of orphan wells and help get the oilfield services sector back to work, the Alberta government announced on May 18, 2017 that it will provide a $235 million loan to the Orphan Well Association (OWA). The loan, which will be paid back over the next 10 years through the existing orphan fund levy, is expected to create 1,650 new jobs over a three-year period.16 This would temporarily lower service industry labour productivity by approximately 0.6% but is viewed as positive for the industry, the environment, the province because past liabilities are being addressed; and this also adds to the stability of the service industry.
Subsector Labour Productivity Analysis
14 PetroLMI Labour Market Outlook 2017 to 2021 for Canada's Oil and Gas Industry, March 201715 PetroLMI 2017 Industry HR Trends, March 201716 Oilfield Service News June 29, 2017, MNP http://www.mnp.ca/en/posts/oilfield-service-news-june-29-2017
An alternate measure of oil and gas services labour productivity
Service employees per $100M oil and gas expenditure (2015$ CDN)
2014a 2016e 2021f
89 94 89
Services sector employment tends to be driven by E&P and oil sands expenditures. As a result, the number of service workers required per dollar of oil and gas expenditure is a more appropriate measure. Below are the number of direct service employees per $100 million (M) of expenditure, based on a Modest Recovery scenario 2017-2021.
In 2014, 89 service employees were required for every $100M of oil and gas expenditure. This increased to an estimated 94 employees in 2016, reflecting a productivity decline. The reason for these contrary findings is during 2015-2016, oil and gas producers
passed on the impact of the declining oil prices to service companies, reducing the price they were willing to pay for services by 25% or more.
However, service companies were unable to cut crew size to the same degree, which meant they had more employees for the same level of expenditures.
Since that period, many service companies have gone out of business, are under creditor protection or have been bought by more efficient organizations. Viewed from this perspective, the 7% increase in labour required per $100M spent from 2014 to 2016 versus the approximate 25% price decrease is a testament to the resilience of the services sector. By reacting to the requirement for efficiency, adoption of technology and industry consolidation, the services sector has been able to significantly mitigate the impact of price decrease on profitability.
The labour benchmark is expected to decrease in 2017-2018 mainly due to pricing recovery, and remain relatively flat thereafter.
Labour Productivity in Canada’s Oil and Gas Industry (September 2017) 19
Subsector Labour Productivity Analysis
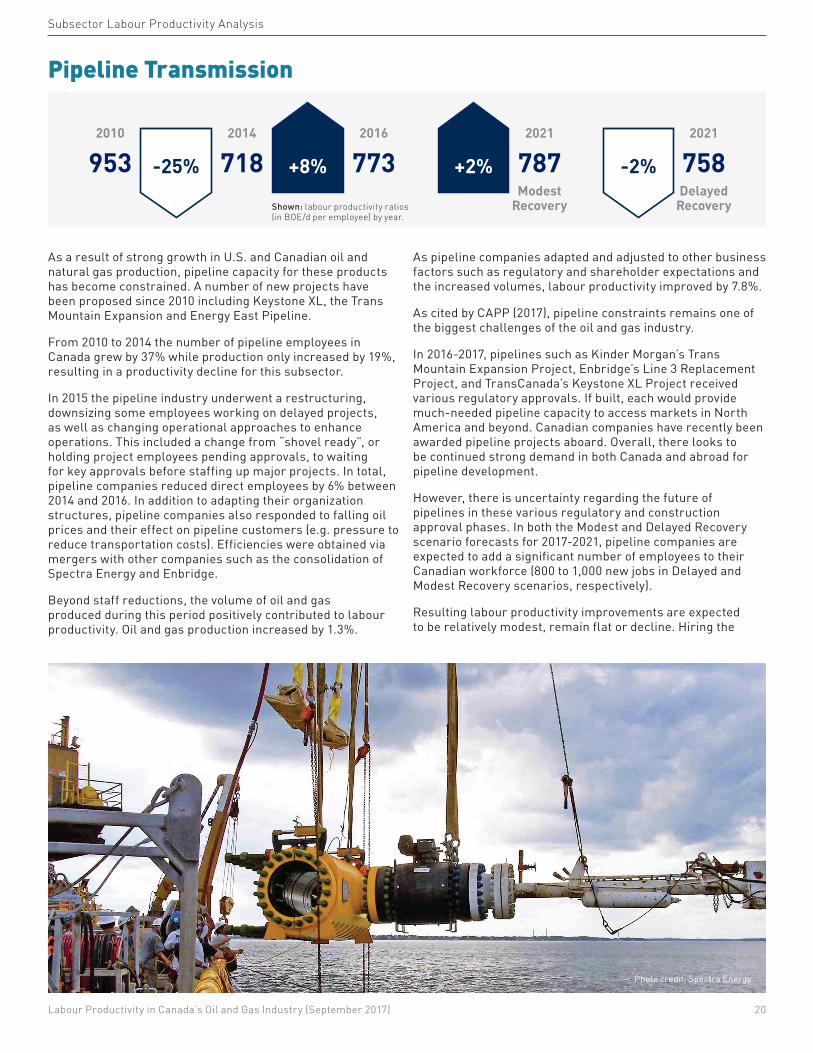
Pipeline Transmission
As a result of strong growth in U.S. and Canadian oil and natural gas production, pipeline capacity for these products has become constrained. A number of new projects have been proposed since 2010 including Keystone XL, the Trans Mountain Expansion and Energy East Pipeline.
From 2010 to 2014 the number of pipeline employees in Canada grew by 37% while production only increased by 19%, resulting in a productivity decline for this subsector.
In 2015 the pipeline industry underwent a restructuring, downsizing some employees working on delayed projects, as well as changing operational approaches to enhance operations. This included a change from “shovel ready”, or holding project employees pending approvals, to waiting for key approvals before staffing up major projects. In total, pipeline companies reduced direct employees by 6% between 2014 and 2016. In addition to adapting their organization structures, pipeline companies also responded to falling oil prices and their effect on pipeline customers (e.g. pressure to reduce transportation costs). Efficiencies were obtained via mergers with other companies such as the consolidation of Spectra Energy and Enbridge.
Beyond staff reductions, the volume of oil and gas produced during this period positively contributed to labour productivity. Oil and gas production increased by 1.3%.
As pipeline companies adapted and adjusted to other business factors such as regulatory and shareholder expectations and the increased volumes, labour productivity improved by 7.8%.
As cited by CAPP (2017), pipeline constraints remains one of the biggest challenges of the oil and gas industry.
In 2016-2017, pipelines such as Kinder Morgan’s Trans Mountain Expansion Project, Enbridge’s Line 3 Replacement Project, and TransCanada’s Keystone XL Project received various regulatory approvals. If built, each would provide much-needed pipeline capacity to access markets in North America and beyond. Canadian companies have recently been awarded pipeline projects aboard. Overall, there looks to be continued strong demand in both Canada and abroad for pipeline development.
However, there is uncertainty regarding the future of pipelines in these various regulatory and construction approval phases. In both the Modest and Delayed Recovery scenario forecasts for 2017-2021, pipeline companies are expected to add a significant number of employees to their Canadian workforce (800 to 1,000 new jobs in Delayed and Modest Recovery scenarios, respectively).
Resulting labour productivity improvements are expected to be relatively modest, remain flat or decline. Hiring the
-25% -2%
2010
9532014
7182016
7732021
787Modest
Recovery
2021
758Delayed
Recovery
+8% +2%
Photo credit: Spectra Energy
Labour Productivity in Canada’s Oil and Gas Industry (September 2017) 20
Shown: labour productivity ratios (in BOE/d per employee) by year.
employees required to plan and coordinate the building of new pipeline projects will constrain productivity growth and lead to flat labour productivity.
If capacity expands beyond what is required for handling additional oil and gas production volumes, the growth in Canadian pipeline employees could surpass what is currently forecasted. Although this pipeline growth period would be positive for the oil and gas industry, this increased in employment would create a decline in labour productivity for this subsector (as measured relative to overall industry production output).
For 2017-2021 it is expected that forces either driving or restraining overall oil and gas industry labour productivity will be applicable to the pipeline sector. Forecasted labour
productivity is relatively flat and, if a period of pipeline growth occurs, may decline depending on whether employees are added as permanent versus contractor basis.
For individual pipeline companies, and the pipeline sector, labour productivity for capital projects could be benchmarked internally. Benchmarking may also be done for pipeline maintenance and operations. Internal benchmarking of labour productivity allows for more effective labour productivity monitoring and projects/operations control. Ultimately, effective monitoring and control not only contributes to overall labour productivity, it reduces the overhead cost of projects and operations and increases shareholder return.
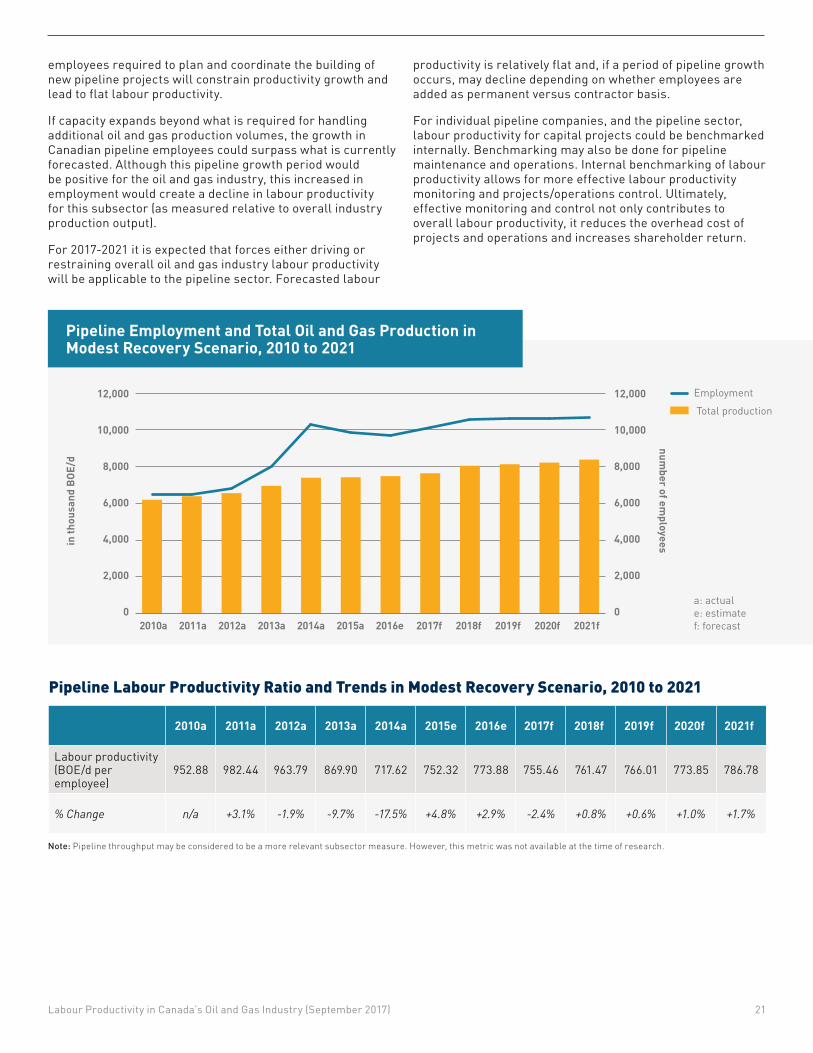
2010a 2011a 2012a 2013a 2014a 2015e 2016e 2017f 2018f 2019f 2020f 2021f
Labour productivity (BOE/d per employee)
952.88 982.44 963.79 869.90 717.62 752.32 773.88 755.46 761.47 766.01 773.85 786.78
% Change n/a +3.1% -1.9% -9.7% -17.5% +4.8% +2.9% -2.4% +0.8% +0.6% +1.0% +1.7%
Pipeline Labour Productivity Ratio and Trends in Modest Recovery Scenario, 2010 to 2021
Pipeline Employment and Total Oil and Gas Production in Modest Recovery Scenario, 2010 to 2021
2010a 2011a 2012a 2013a 2014a 2015a 2016e 2017f 2018f 2019f 2020f 2021f
12,000
10,000
8,000
6,000
4,000
2,000
0
12,000
10,000
8,000
6,000
4,000
2,000
0
Employment Total production
a: actuale: estimatef: forecast
in th
ousa
nd B
OE/d
number of em
ployees
Note: Pipeline throughput may be considered to be a more relevant subsector measure. However, this metric was not available at the time of research.
Labour Productivity in Canada’s Oil and Gas Industry (September 2017) 21
ConclusionIntuitively, the rapid development and adoption of new technologies and process improvements in the last decade would create an expectation that labour productivity has significantly increased in Canada’s oil and gas industry. Yet this is not the case, as labour productivity declined 6% during the 2010-2014 high growth period when capital and project-related employment in the industry spiked without an immediate increase in production.
In line with expectations, significant labour productivity gains of 32% were made in 2015-2016, which corresponded with a significant drop in oil prices, drastic cuts in capital spending and new production coming online.
Based on forecasts, a modest increase of approximately 2% in labour productivity is expected over the next five years, along with a modest recovery in capital spending and a balance of factors that will either drive or restrain it. It’s important to note that even sustaining the labour productivity ratio of 43 BOE/d per employee achieved by 2016 would be viewed as a significant achievement.
However, there are a number of factors that may drive or restrain productivity improvements. Certainly, further increases in oil sands production from past capital investments will lead to productivity gains. There is also the notion that large-scale adoption of existing and newer technologies will improve operations and potentially replace workers at an increasing pace. There is concern however that running organizations so lean, as was the case in 2015-2016, may not be sustainable. This is especially true in the oil and gas service sector where some firms are working hard to survive. Adding to that, there is the impending loss of knowledge related to retirements or industry restructuring that will significantly decrease labour productivity. Both the oil sands and the E&P sectors will require highly-specialized technical and scientific labour to drive innovation either themselves or they will seek these skills from service companies. The need for technological expertise will pose unique challenges in itself as the industry will need to elevate the productivity of highly-skilled workers, something that is very different from improving low-skilled labour productivity where the answer tends to be mechanization. Another worry is the perception of instability in the industry and that this may cause top performers to seek opportunities elsewhere, negatively impacting labour productivity. The shrinking engineering and scientific disciplines in the Canadian labour market overall are of particular concern as these disciplines are critical to the oil and gas industry.
Labour productivity in any industry, and economy, is vital for competition and growth. Between 2010 and 2016, oil and gas in Canada averaged six times higher than the overall Canadian labour productivity. Support of oil and gas industry growth, therefore, helps to improve overall labour productivity.
There are a number of initiatives that industry and governments may want to consider to drive productivity and mitigate any restraining factors during what is expected to be a slow growth period over the next five years. Industry players may want to consider some of the following: sharing information to promote efficiency, continue investment and implementation of innovation; undertake more rigorous measuring of labour productivity within companies and across the industry; set targets for improving labour productivity; engage in workforce planning and skill planning; work with educational institutions and industry associations or governments to understand and support a shift in labour and training requirements.
Industry and governments working together, meanwhile, can encourage more investment through removing constraints on transportation of oil and gas, streamlining regulatory processes, supporting the development of value-added processing, supporting the development and promotion of critical technical skills, improving the provision of industry labour market data, and continuing to seek win-win opportunities.
Labour Productivity in Canada’s Oil and Gas Industry (September 2017) 22
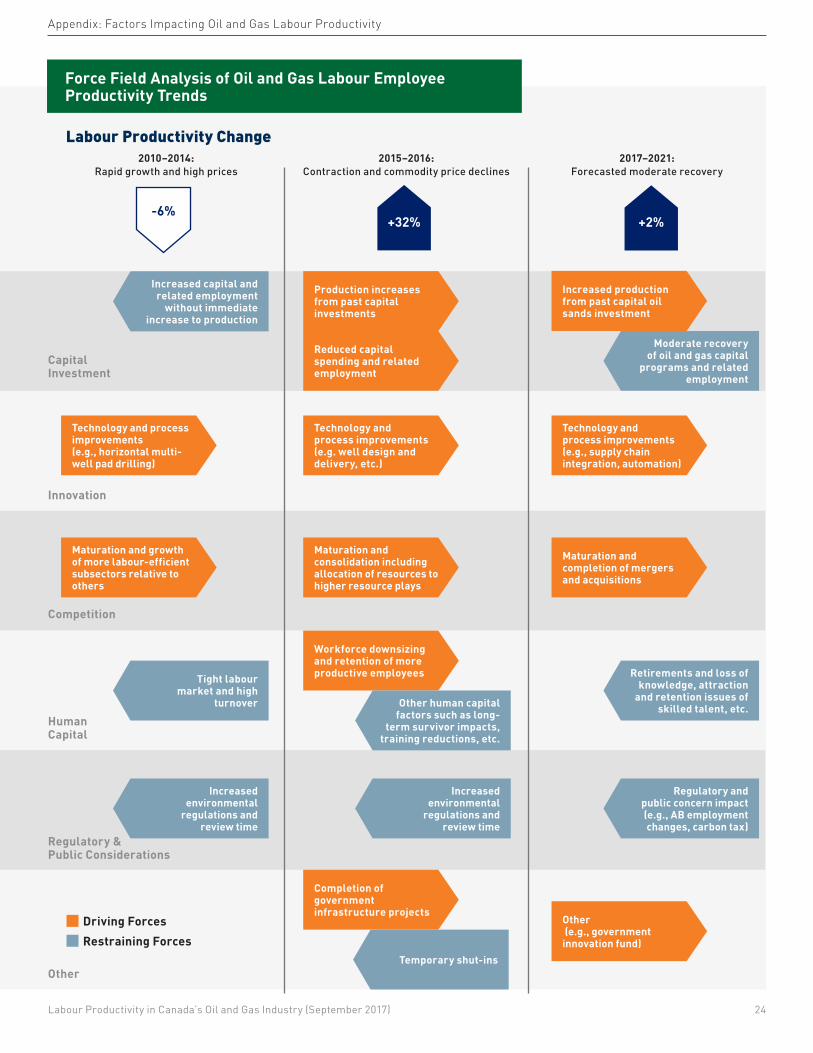
Appendix: Factors Impacting Oil and Gas Labour Productivity
Certain factors are critical for determining labour productivity changes including capital investment, innovation, human capital, competition and others.
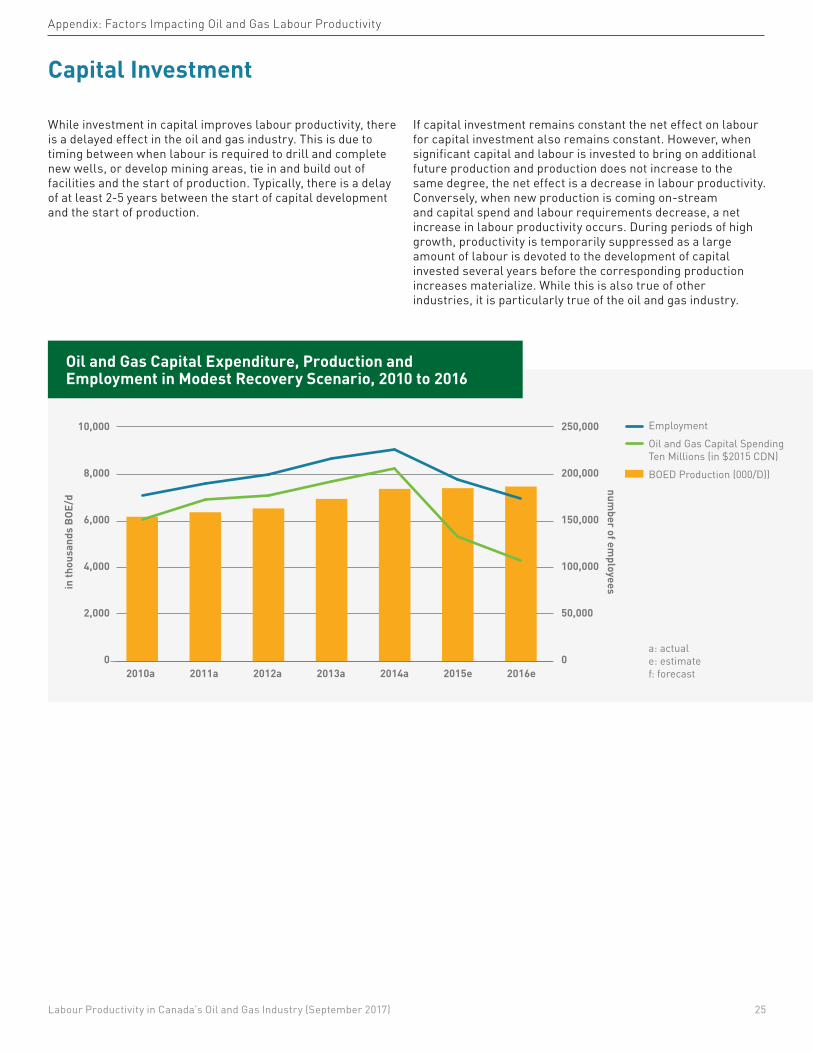
• Capital investment includes assets that are used in the production of goods or service such as machinery, equipment and buildings. In general, the more capital workers have at their disposal, the better they are able to do their jobs, producing more and better-quality output.
• Innovation is the successful exploitation of new ideas. New ideas can take the form of new technologies, new products or new corporate structures and ways of working (i.e. process improvement). Speeding up the diffusion of innovations can boost productivity.
• Human capital is the size and quality of the workforce based on different types of labour available in an economy. Human capital complements physical capital. It is needed to take advantage of investment in new technologies and organizational structures.
• Business competition improves productivity by creating incentives to innovate and the allocation of resources to the most efficient firms (or areas within a firm). It allows companies to organize work more effectively through adoption of best practices of more efficient firms (i.e.technological practices and organizational structures).17
In addition to the major factors listed above, some additional key factors specific to the Oil and Gas industry were identified through industry interviews. This includes: Regulatory Impact and Public Concern and Others.
A force field analysis was conducted to qualitatively assess the impact these factors may have on oil and gas labour productivity. It identifies and rates the forces that are either driving movement forward (driving forces) or blocking movement (restraining forces).
The following sections explore these factors in more detail.
17 Enterprise, defined as the seizing of new business opportunities by both start-ups and existing firms, is sometimes included in the list of drivers and is discussed in this report under innovation and competition. New enterprises compete with existing firms by creating new ideas and technologies which increases competition.
Labour Productivity in Canada’s Oil and Gas Industry (September 2017) 23
Capital Investment
Innovation
Competition
Regulatory & Public Considerations
Other
Human Capital
Appendix: Factors Impacting Oil and Gas Labour Productivity
Force Field Analysis of Oil and Gas Labour Employee Productivity Trends
Labour Productivity Change2010–2014:
Rapid growth and high prices
+32%
2015–2016: Contraction and commodity price declines
-6%
2017–2021: Forecasted moderate recovery
+2%
Increased production from past capital oil sands investment
Production increases from past capital investments
Reduced capital spending and related employment
Technology and process improvements (e.g. well design and delivery, etc.)
Technology and process improvements (e.g., supply chain integration, automation)
Workforce downsizing and retention of more productive employees
Maturation and consolidation including allocation of resources to higher resource plays
Maturation and completion of mergers and acquisitions
Other (e.g., government innovation fund)
Completion of government infrastructure projects
Technology and process improvements (e.g., horizontal multi-well pad drilling)
Maturation and growth of more labour-efficient subsectors relative to others
Restraining ForcesDriving Forces
Increased capital and related employment
without immediate increase to production
Other human capital factors such as long-
term survivor impacts, training reductions, etc.
Retirements and loss of knowledge, attraction
and retention issues of skilled talent, etc.
Moderate recovery of oil and gas capital
programs and related employment
Increased environmental
regulations and review time
Regulatory and public concern impact (e.g., AB employment changes, carbon tax)
Temporary shut-ins
Tight labour market and high
turnover
Increased environmental
regulations and review time
Labour Productivity in Canada’s Oil and Gas Industry (September 2017) 24
Appendix: Factors Impacting Oil and Gas Labour Productivity
While investment in capital improves labour productivity, there is a delayed effect in the oil and gas industry. This is due to timing between when labour is required to drill and complete new wells, or develop mining areas, tie in and build out of facilities and the start of production. Typically, there is a delay of at least 2-5 years between the start of capital development and the start of production.
If capital investment remains constant the net effect on labour for capital investment also remains constant. However, when significant capital and labour is invested to bring on additional future production and production does not increase to the same degree, the net effect is a decrease in labour productivity. Conversely, when new production is coming on-stream and capital spend and labour requirements decrease, a net increase in labour productivity occurs. During periods of high growth, productivity is temporarily suppressed as a large amount of labour is devoted to the development of capital invested several years before the corresponding production increases materialize. While this is also true of other industries, it is particularly true of the oil and gas industry.
a: actuale: estimatef: forecast2010a 2011a 2012a 2013a 2014a 2015e 2016e
10,000
8,000
6,000
4,000
2,000
0
250,000
200,000
150,000
100,000
50,000
0
EmploymentOil and Gas Capital Spending Ten Millions (in $2015 CDN)BOED Production (000/D))
in th
ousa
nds
BOE/
d
number of em
ployees
Oil and Gas Capital Expenditure, Production and Employment in Modest Recovery Scenario, 2010 to 2016
Capital Investment
Labour Productivity in Canada’s Oil and Gas Industry (September 2017) 25
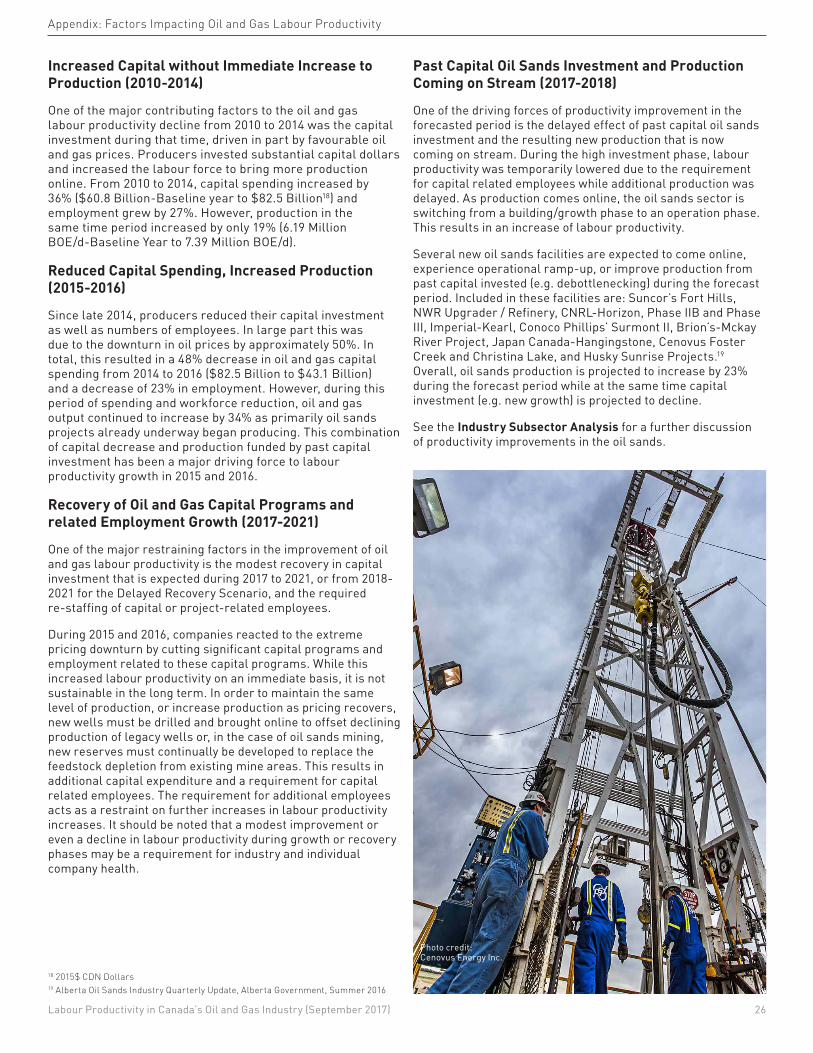
Appendix: Factors Impacting Oil and Gas Labour Productivity
Increased Capital without Immediate Increase to Production (2010-2014)
One of the major contributing factors to the oil and gas labour productivity decline from 2010 to 2014 was the capital investment during that time, driven in part by favourable oil and gas prices. Producers invested substantial capital dollars and increased the labour force to bring more production online. From 2010 to 2014, capital spending increased by 36% ($60.8 Billion-Baseline year to $82.5 Billion18) and employment grew by 27%. However, production in the same time period increased by only 19% (6.19 Million BOE/d-Baseline Year to 7.39 Million BOE/d).
Reduced Capital Spending, Increased Production (2015-2016)
Since late 2014, producers reduced their capital investment as well as numbers of employees. In large part this was due to the downturn in oil prices by approximately 50%. In total, this resulted in a 48% decrease in oil and gas capital spending from 2014 to 2016 ($82.5 Billion to $43.1 Billion) and a decrease of 23% in employment. However, during this period of spending and workforce reduction, oil and gas output continued to increase by 34% as primarily oil sands projects already underway began producing. This combination of capital decrease and production funded by past capital investment has been a major driving force to labour productivity growth in 2015 and 2016.
Recovery of Oil and Gas Capital Programs and related Employment Growth (2017-2021)
One of the major restraining factors in the improvement of oil and gas labour productivity is the modest recovery in capital investment that is expected during 2017 to 2021, or from 2018-2021 for the Delayed Recovery Scenario, and the required re-staffing of capital or project-related employees.
During 2015 and 2016, companies reacted to the extreme pricing downturn by cutting significant capital programs and employment related to these capital programs. While this increased labour productivity on an immediate basis, it is not sustainable in the long term. In order to maintain the same level of production, or increase production as pricing recovers, new wells must be drilled and brought online to offset declining production of legacy wells or, in the case of oil sands mining, new reserves must continually be developed to replace the feedstock depletion from existing mine areas. This results in additional capital expenditure and a requirement for capital related employees. The requirement for additional employees acts as a restraint on further increases in labour productivity increases. It should be noted that a modest improvement or even a decline in labour productivity during growth or recovery phases may be a requirement for industry and individual company health.
Past Capital Oil Sands Investment and Production Coming on Stream (2017-2018)
One of the driving forces of productivity improvement in the forecasted period is the delayed effect of past capital oil sands investment and the resulting new production that is now coming on stream. During the high investment phase, labour productivity was temporarily lowered due to the requirement for capital related employees while additional production was delayed. As production comes online, the oil sands sector is switching from a building/growth phase to an operation phase. This results in an increase of labour productivity.
Several new oil sands facilities are expected to come online, experience operational ramp-up, or improve production from past capital invested (e.g. debottlenecking) during the forecast period. Included in these facilities are: Suncor’s Fort Hills, NWR Upgrader / Refinery, CNRL-Horizon, Phase IIB and Phase III, Imperial-Kearl, Conoco Phillips’ Surmont II, Brion’s-Mckay River Project, Japan Canada-Hangingstone, Cenovus Foster Creek and Christina Lake, and Husky Sunrise Projects.19 Overall, oil sands production is projected to increase by 23% during the forecast period while at the same time capital investment (e.g. new growth) is projected to decline.
See the Industry Subsector Analysis for a further discussion of productivity improvements in the oil sands.
18 2015$ CDN Dollars19 Alberta Oil Sands Industry Quarterly Update, Alberta Government, Summer 2016
Photo credit: Cenovus Energy Inc.
Labour Productivity in Canada’s Oil and Gas Industry (September 2017) 26
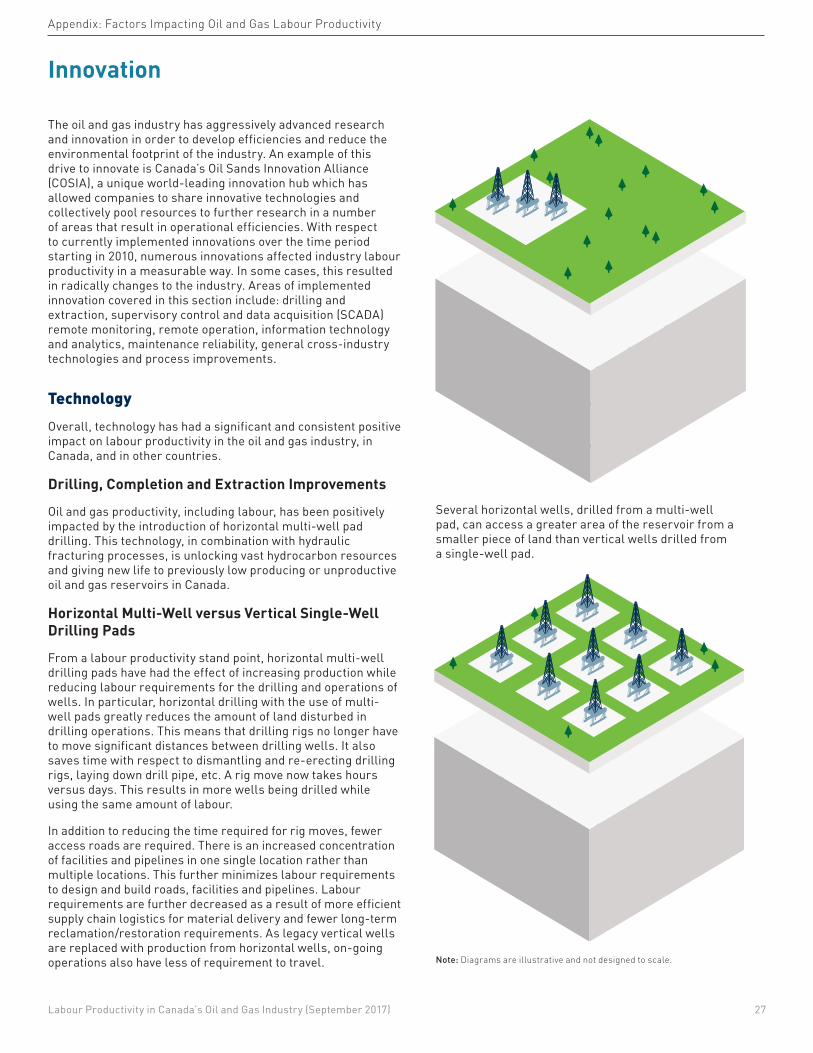
The oil and gas industry has aggressively advanced research and innovation in order to develop efficiencies and reduce the environmental footprint of the industry. An example of this drive to innovate is Canada’s Oil Sands Innovation Alliance (COSIA), a unique world-leading innovation hub which has allowed companies to share innovative technologies and collectively pool resources to further research in a number of areas that result in operational efficiencies. With respect to currently implemented innovations over the time period starting in 2010, numerous innovations affected industry labour productivity in a measurable way. In some cases, this resulted in radically changes to the industry. Areas of implemented innovation covered in this section include: drilling and extraction, supervisory control and data acquisition (SCADA) remote monitoring, remote operation, information technology and analytics, maintenance reliability, general cross-industry technologies and process improvements.
TechnologyOverall, technology has had a significant and consistent positive impact on labour productivity in the oil and gas industry, in Canada, and in other countries.
Drilling, Completion and Extraction Improvements
Oil and gas productivity, including labour, has been positively impacted by the introduction of horizontal multi-well pad drilling. This technology, in combination with hydraulic fracturing processes, is unlocking vast hydrocarbon resources and giving new life to previously low producing or unproductive oil and gas reservoirs in Canada.
Horizontal Multi-Well versus Vertical Single-Well Drilling Pads
From a labour productivity stand point, horizontal multi-well drilling pads have had the effect of increasing production while reducing labour requirements for the drilling and operations of wells. In particular, horizontal drilling with the use of multi-well pads greatly reduces the amount of land disturbed in drilling operations. This means that drilling rigs no longer have to move significant distances between drilling wells. It also saves time with respect to dismantling and re-erecting drilling rigs, laying down drill pipe, etc. A rig move now takes hours versus days. This results in more wells being drilled while using the same amount of labour.
In addition to reducing the time required for rig moves, fewer access roads are required. There is an increased concentration of facilities and pipelines in one single location rather than multiple locations. This further minimizes labour requirements to design and build roads, facilities and pipelines. Labour requirements are further decreased as a result of more efficient supply chain logistics for material delivery and fewer long-term reclamation/restoration requirements. As legacy vertical wells are replaced with production from horizontal wells, on-going operations also have less of requirement to travel.
Appendix: Factors Impacting Oil and Gas Labour Productivity
Several horizontal wells, drilled from a multi-well pad, can access a greater area of the reservoir from a smaller piece of land than vertical wells drilled from a single-well pad.
Note: Diagrams are illustrative and not designed to scale.
Innovation
Labour Productivity in Canada’s Oil and Gas Industry (September 2017) 27
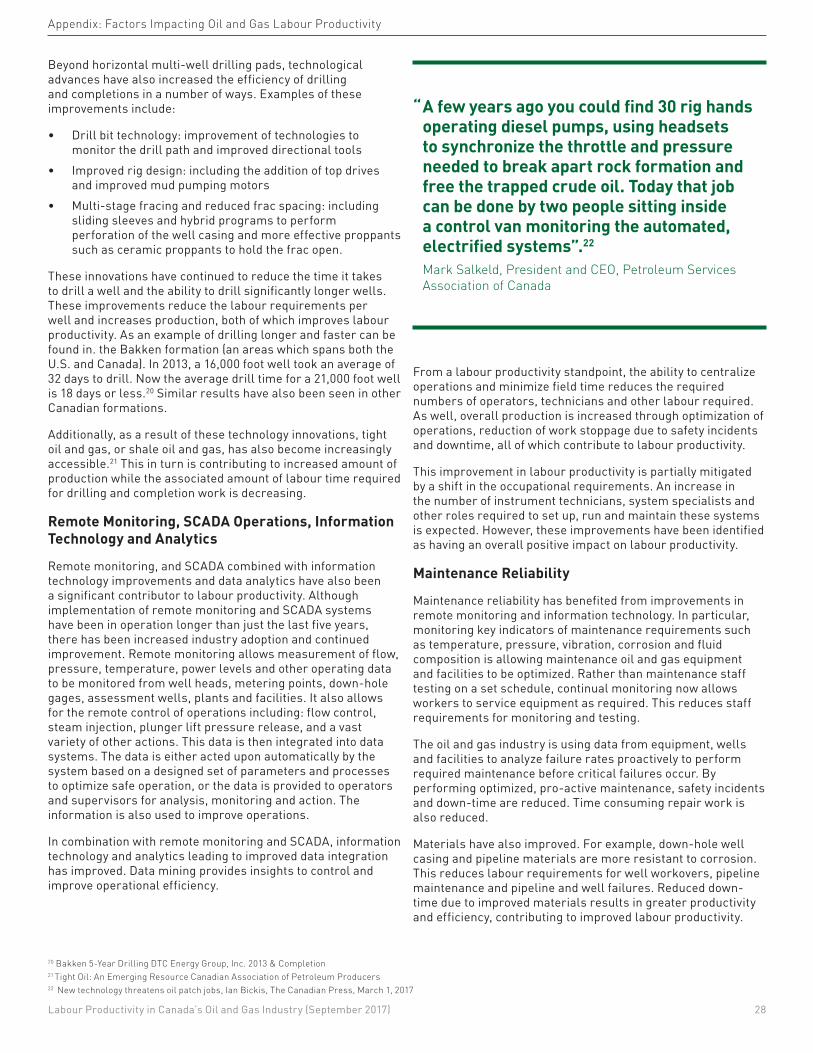
Appendix: Factors Impacting Oil and Gas Labour Productivity
Beyond horizontal multi-well drilling pads, technological advances have also increased the efficiency of drilling and completions in a number of ways. Examples of these improvements include:
• Drill bit technology: improvement of technologies to monitor the drill path and improved directional tools
• Improved rig design: including the addition of top drives and improved mud pumping motors
• Multi-stage fracing and reduced frac spacing: including sliding sleeves and hybrid programs to perform perforation of the well casing and more effective proppants such as ceramic proppants to hold the frac open.
These innovations have continued to reduce the time it takes to drill a well and the ability to drill significantly longer wells. These improvements reduce the labour requirements per well and increases production, both of which improves labour productivity. As an example of drilling longer and faster can be found in. the Bakken formation (an areas which spans both the U.S. and Canada). In 2013, a 16,000 foot well took an average of 32 days to drill. Now the average drill time for a 21,000 foot well is 18 days or less.20 Similar results have also been seen in other Canadian formations.
Additionally, as a result of these technology innovations, tight oil and gas, or shale oil and gas, has also become increasingly accessible.21 This in turn is contributing to increased amount of production while the associated amount of labour time required for drilling and completion work is decreasing.
Remote Monitoring, SCADA Operations, Information Technology and Analytics
Remote monitoring, and SCADA combined with information technology improvements and data analytics have also been a significant contributor to labour productivity. Although implementation of remote monitoring and SCADA systems have been in operation longer than just the last five years, there has been increased industry adoption and continued improvement. Remote monitoring allows measurement of flow, pressure, temperature, power levels and other operating data to be monitored from well heads, metering points, down-hole gages, assessment wells, plants and facilities. It also allows for the remote control of operations including: flow control, steam injection, plunger lift pressure release, and a vast variety of other actions. This data is then integrated into data systems. The data is either acted upon automatically by the system based on a designed set of parameters and processes to optimize safe operation, or the data is provided to operators and supervisors for analysis, monitoring and action. The information is also used to improve operations.
In combination with remote monitoring and SCADA, information technology and analytics leading to improved data integration has improved. Data mining provides insights to control and improve operational efficiency.
From a labour productivity standpoint, the ability to centralize operations and minimize field time reduces the required numbers of operators, technicians and other labour required. As well, overall production is increased through optimization of operations, reduction of work stoppage due to safety incidents and downtime, all of which contribute to labour productivity.
This improvement in labour productivity is partially mitigated by a shift in the occupational requirements. An increase in the number of instrument technicians, system specialists and other roles required to set up, run and maintain these systems is expected. However, these improvements have been identified as having an overall positive impact on labour productivity.
Maintenance Reliability
Maintenance reliability has benefited from improvements in remote monitoring and information technology. In particular, monitoring key indicators of maintenance requirements such as temperature, pressure, vibration, corrosion and fluid composition is allowing maintenance oil and gas equipment and facilities to be optimized. Rather than maintenance staff testing on a set schedule, continual monitoring now allows workers to service equipment as required. This reduces staff requirements for monitoring and testing.
The oil and gas industry is using data from equipment, wells and facilities to analyze failure rates proactively to perform required maintenance before critical failures occur. By performing optimized, pro-active maintenance, safety incidents and down-time are reduced. Time consuming repair work is also reduced.
Materials have also improved. For example, down-hole well casing and pipeline materials are more resistant to corrosion. This reduces labour requirements for well workovers, pipeline maintenance and pipeline and well failures. Reduced down-time due to improved materials results in greater productivity and efficiency, contributing to improved labour productivity.
“ A few years ago you could find 30 rig hands operating diesel pumps, using headsets to synchronize the throttle and pressure needed to break apart rock formation and free the trapped crude oil. Today that job can be done by two people sitting inside a control van monitoring the automated, electrified systems”.22
Mark Salkeld, President and CEO, Petroleum Services Association of Canada
20 Bakken 5-Year Drilling DTC Energy Group, Inc. 2013 & Completion21 Tight Oil: An Emerging Resource Canadian Association of Petroleum Producers22 New technology threatens oil patch jobs, Ian Bickis, The Canadian Press, March 1, 2017
Labour Productivity in Canada’s Oil and Gas Industry (September 2017) 28
Replicated Designs and Modularization
The oil and gas industry has focused on reducing the time and cost of engineering and facility construction through the use of replicated designs and modularization. As an example, Suncor says it has slashed the engineering time for a new steam-based oil sands well pad to 800 hours in 2015 for its new design, compared with about 9,100 hours in 2010.23
The industry has expanded its modular capabilities to include the design and installation of facilities for upstream oil and gas processing, including offshore, E&P, oil sands in situ and mining and pipeline facilities. The approach can reduce labour, time and result in smaller footprints, as well as increasing logistics benefits in some cases.24
General Technological Improvement
The ability to share and use information has allowed for improved technology dissemination in the industry, the ability to operate remotely. Tools have been developed to analyze and mine data for operational insights.
General technological improvements include advancements in: computer processing power, application software, internet connectivity including Cloud applications, internet band width, global positioning systems (GPS) and satellite imaging, wireless connectivity, tablets and cell phones.
Process ImprovementThe way work is organized and tasks are accomplished is often addressed in combination with technological improvement to achieve operational efficiencies. Within the oil and gas industry there are numerous examples of process improvement initiatives. Examples of these include:
• Simultaneous operations • Operations excellence programs • Six sigma, lean and continuous improvement initiatives • Well design and delivery processes • Management of change process (expansion beyond
operation) • Maintenance process improvement • Reliability process Improvement and • Supply chain management process improvement.
One example consists of process innovation in pad drilling and completion. Previously a well (or set of wells) would be drilled, completed and then the pipeline and facilities would be built to tie-in the well and begin production. This process was improved with the introduction of operations being conducted simultaneously. While the wells are being drilled, other wells on the pad are being completed and pipelines and facilities are being built. Sometimes, pipeline and facilities are even
being built before drilling. This reduces the time between spud (initial drilling) of wells and time to production, allowing labour in other areas to work more continuously without down-time. Overall, the reduced time for in initial start-up combined with a reduction in down-time increases production and reduces labour requirements, thus increasing labour productivity.
Another example is the standardization of new well processes such as Well Launcher,25 which decreases the time of geologists and engineers to design and deliver wells by 25% to 50% partly due to a reduction in errors and rework. A decrease in time results in a decreased need in the number of these professionals or an increase in number of wells drilled. In either case this positively impacts labour productivity.
In addition, process improvement can have the effect of improving labour productivity by reducing defects in material and construction, improving reliability, cycle-time, production and safety.
Technology and Process Improvements in 2017 and Beyond Many of the technological and process improvements considered have been in place for a number of years, including horizontal multi-well drill pads, multi-stage fracing, improved rig designs, improved tools for well path technology and 3D reservoir imaging. While the impact of these innovations has already been realized, there is expected to be continued incremental improvement in these technologies as well as others mentioned above and broader industry adoption that will drive further labour productivity improvements.
There are also some new “game changers” technologies that are currently on the horizon that may have a greater impact on the industry. Some examples include:
• The use of solvents for oil sand in situ production. A solvent injected into in situ wells dilutes bitumen, decreasing the viscosity of the bitumen, which can augment or replace the amount of steam required. This not only reduces operating costs but greatly reduces carbon emission intensity.26 Several pilots or smaller scale operations are currently underway. Other non-steam technologies such as electromagnetic heating, thermal heating and air injection combustion heating are also being explored by the industry.27
• Automation of oil and gas industry positions. The potential for automation of routine machines is a general technology trend. As automation technology and implementation processes become more available and is adopted, it will impact the oil and gas industry. Suncor, for example, is currently piloting the use of driverless mining trucks. A recent study “Automation Across the Nation,”28 based on McKinsey and Statistics Canada data, suggests that 52% of work activities have the potential for automation within mining, quarrying and oil and gas extraction.
23 New technology threatens oil patch jobs, Ian Bickis, The Canadian Press, March 1, 201724 See: http://www.worleyparsons.com/CSG/Hydrocarbons/SpecialtyCapabilities/Pages/Modularization.aspx25 Well launcher is a software program than captures the process stages in well design and drilling execution. 26 Alberta oil sands likely to become more profitable because of technology CIBC, January 17, 2017 Economy The Canadian Press27 An in-depth look at how in situ oil sands development has evolved. The past, present and future of in situ bitumen recovery, Alberta Oil, Sebastian Gault, Feb 12, 201428 Automation Across the Nation: Understanding the potential impacts of technological trends across Canada. Brookfield Institute. June 2017
Appendix: Factors Impacting Oil and Gas Labour Productivity
Labour Productivity in Canada’s Oil and Gas Industry (September 2017) 29
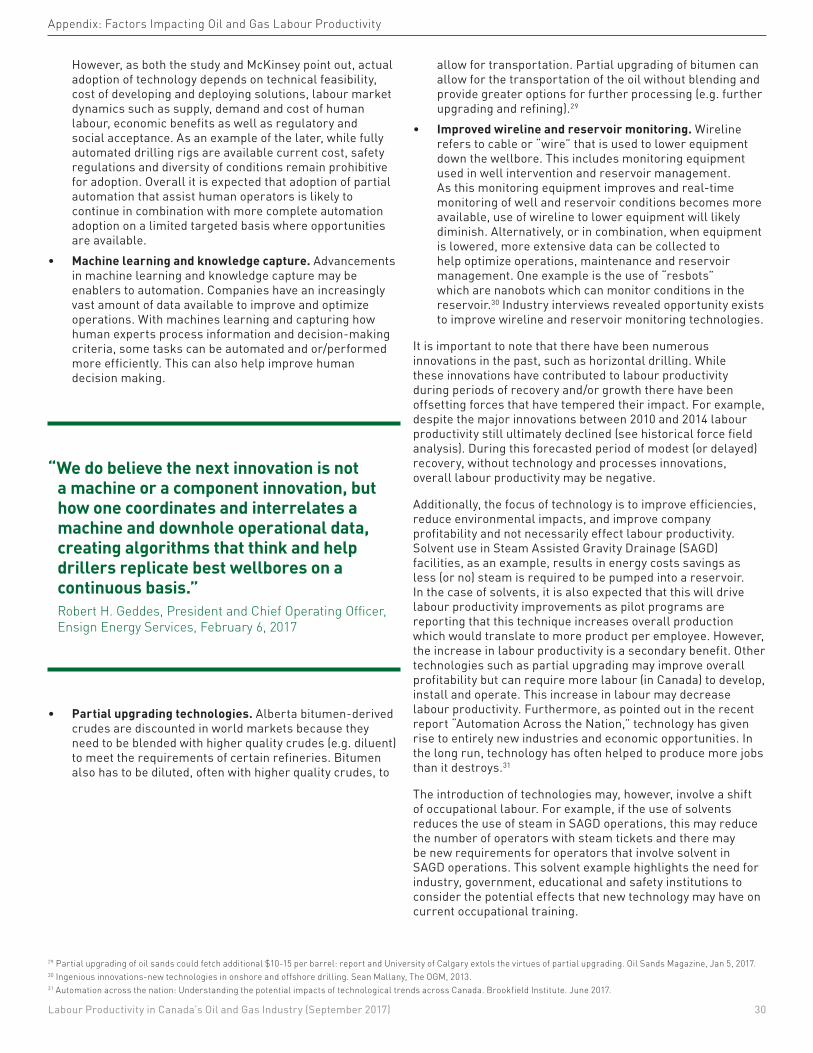
However, as both the study and McKinsey point out, actual adoption of technology depends on technical feasibility, cost of developing and deploying solutions, labour market dynamics such as supply, demand and cost of human labour, economic benefits as well as regulatory and social acceptance. As an example of the later, while fully automated drilling rigs are available current cost, safety regulations and diversity of conditions remain prohibitive for adoption. Overall it is expected that adoption of partial automation that assist human operators is likely to continue in combination with more complete automation adoption on a limited targeted basis where opportunities are available.
• Machine learning and knowledge capture. Advancements in machine learning and knowledge capture may be enablers to automation. Companies have an increasingly vast amount of data available to improve and optimize operations. With machines learning and capturing how human experts process information and decision-making criteria, some tasks can be automated and or/performed more efficiently. This can also help improve human decision making.
“We do believe the next innovation is not a machine or a component innovation, but how one coordinates and interrelates a machine and downhole operational data, creating algorithms that think and help drillers replicate best wellbores on a continuous basis.” Robert H. Geddes, President and Chief Operating Officer, Ensign Energy Services, February 6, 2017
• Partial upgrading technologies. Alberta bitumen-derived crudes are discounted in world markets because they need to be blended with higher quality crudes (e.g. diluent) to meet the requirements of certain refineries. Bitumen also has to be diluted, often with higher quality crudes, to
allow for transportation. Partial upgrading of bitumen can allow for the transportation of the oil without blending and provide greater options for further processing (e.g. further upgrading and refining).29
• Improved wireline and reservoir monitoring. Wireline refers to cable or “wire” that is used to lower equipment down the wellbore. This includes monitoring equipment used in well intervention and reservoir management. As this monitoring equipment improves and real-time monitoring of well and reservoir conditions becomes more available, use of wireline to lower equipment will likely diminish. Alternatively, or in combination, when equipment is lowered, more extensive data can be collected to help optimize operations, maintenance and reservoir management. One example is the use of “resbots” which are nanobots which can monitor conditions in the reservoir.30 Industry interviews revealed opportunity exists to improve wireline and reservoir monitoring technologies.
It is important to note that there have been numerous innovations in the past, such as horizontal drilling. While these innovations have contributed to labour productivity during periods of recovery and/or growth there have been offsetting forces that have tempered their impact. For example, despite the major innovations between 2010 and 2014 labour productivity still ultimately declined (see historical force field analysis). During this forecasted period of modest (or delayed) recovery, without technology and processes innovations, overall labour productivity may be negative.
Additionally, the focus of technology is to improve efficiencies, reduce environmental impacts, and improve company profitability and not necessarily effect labour productivity. Solvent use in Steam Assisted Gravity Drainage (SAGD) facilities, as an example, results in energy costs savings as less (or no) steam is required to be pumped into a reservoir. In the case of solvents, it is also expected that this will drive labour productivity improvements as pilot programs are reporting that this technique increases overall production which would translate to more product per employee. However, the increase in labour productivity is a secondary benefit. Other technologies such as partial upgrading may improve overall profitability but can require more labour (in Canada) to develop, install and operate. This increase in labour may decrease labour productivity. Furthermore, as pointed out in the recent report “Automation Across the Nation,” technology has given rise to entirely new industries and economic opportunities. In the long run, technology has often helped to produce more jobs than it destroys.31
The introduction of technologies may, however, involve a shift of occupational labour. For example, if the use of solvents reduces the use of steam in SAGD operations, this may reduce the number of operators with steam tickets and there may be new requirements for operators that involve solvent in SAGD operations. This solvent example highlights the need for industry, government, educational and safety institutions to consider the potential effects that new technology may have on current occupational training.
29 Partial upgrading of oil sands could fetch additional $10-15 per barrel: report and University of Calgary extols the virtues of partial upgrading. Oil Sands Magazine, Jan 5, 2017.30 Ingenious innovations-new technologies in onshore and offshore drilling. Sean Mallany, The OGM, 2013.31 Automation across the nation: Understanding the potential impacts of technological trends across Canada. Brookfield Institute. June 2017.
Appendix: Factors Impacting Oil and Gas Labour Productivity
Labour Productivity in Canada’s Oil and Gas Industry (September 2017) 30
The impact of people, or “human capital”, is an important factor to explore with respect to labour productivity. Workforce reductions can act to increase productivity, but it can also be a restraining force due to a loss of knowledge and skills.
Shrinking Technical Labour Pool (2010-2014)The technical labour pool in oil and gas is a key skill group. During 2010-2014 companies experienced difficulty recruiting technical workers and often required long lead times to fill positions. In some cases positions were not filled.
In many cases the tight market for technical labour drove companies to find technological solutions that required less technical manpower and that adoption of innovative technological improvements is viewed to have contributed positively to overall productivity during this period.
Downsizing has limited impact on production (2015-2016)In 2015-2016, when oil prices dropped to well below $US50 per barrel, many oil and gas companies reduced their capital expenditures and their workforces. During the two-year period oil and gas employment contracted by 25%. While some of this downsizing was directly related to the decrease in capital expenditure, there was also a desire to speed the return to profitability by reducing all costs, including labour expenses. In many cases led to an increased work load for many remaining employees, the elimination or postponement of discretionary work not tied directly to operations, a reduction in operation staff, a reduction in training efforts or a reduction in management layers.
Some companies chose to reduce employees through a systematic evaluation by operational group, while others chose a more widespread approach. While in the shorter term, the impact on labour productivity was minimal because the output of production continued to increase, there is concern that longer term future productivity maybe negatively impacted. Some of the concern arises as a result of the reduction in skilled and experienced workers, including those in supervisory or managerial roles, the potential for a decrease in innovation and exploration because of an increased focus on day-to-day operations, burn-out out and stress on remaining employees, and a reduction in the ability to re-attract top talent to the oil and gas industry.
There is a delay between market forces and adjustments to the labour force. In particular, when commodity prices began their decline staff resizing did not immediately occur because the duration of the price shift was unknown and there is a significant cost to the termination and rehiring of employees, from termination packages, to the loss of skill and reputation and the impacts on remaining staff. Staff resizing to maintain profitability or realign the organizational structures from a growth focus to an operational focus did occur after the prices remained low for a prolonged period. The delayed staffing reductions restrained labour productivity improvements. The significant downsizings did allow some companies to retain their more productive employees and going forward there is an expectation that new or less experience workers will be hired to fill the gaps.
Availability of a skilled labour pool and reduced turnover (2015-2016) During the period 2010-2014, labour productivity was negatively impacted by the addition of 48,000 workers, a 27% increase in direct employment. Among this rapid influx of new workers were those who were less skilled and less productive.
As the workforce contracted in 2015-2016, it resulted in a surplus of skilled labour, most notably in engineering and geology, accounting, information and technology, human resources and other support areas. This allowed companies recruiting for replacement hiring to access workers with greater experience and skill levels. But with little hiring during this period occurring, the positive impact on labour productivity was marginal.
Voluntary turnover also has a negative effect on labour productivity as manpower time must be spent within an organization to source and train the new replacements. Additionally, there is typically a period of lower productivity as the newly hired individual gains organizational experience. During the period of 2010-2014 average voluntary turnover for the oil and gas industry was 6.2%, reaching a high of 7.0% in 2014. With the reduction in oil and gas positions that occurred during 2015-2016 employees, were more likely to stay with their organization. Subsequently, there was a drop in voluntary turnover to 5.3% in 2015 and a further drop to in 2016 to 5.2%.32
Going forward the oil and gas industry will face a tight labour market recreating an influx of less experienced, less skilled workers, something that is already a concern in the services sector. 33
32 Compensation Outlook 2017, Conference Board of Canada. 33 Workforce Insights: Impacts of the Oil and Gas Downturn on the Future and Attitudes of Workers, PetroLMI
Appendix: Factors Impacting Oil and Gas Labour Productivity
Labour Productivity in Canada’s Oil and Gas Industry (September 2017) 31

Other factors (2017-2021)While human capital factors overall are expected to act as a restraining force to labour productivity in the oil and gas industry going forward, significant changes in the demographics of the workforce also are expected to play a part.
• Impact of retirements and knowledge loss. 22,000 to 23,000 direct oil and gas workers are expected to retire between 2017 and 2021 if historical retirement rates and workforce demographics remain steady. This is approximately 13% of the workforce. The majority of the retirements are expected where key knowledge or skills reside. Approximately 33% of these positions are operators (including drillers) and 25% are supervisors and managers. As well there will be a number of other key skill sets (such as engineers and trades) that are expected to retire and contribute to the industry’s knowledge loss, adversely affecting productivity.
• Industry cyclicality and perception. The large number of layoffs, a perceived lack of growth, lack of employment stability and perceived environmental concerns may undermine the industry’s ability to attract and retain the best and brightest. These factors also affect the return of experienced employees. As individuals are hired to support recovery and growth, this reduced ability to attract talent is expected to adversely impact labour productivity.
“With the unemployment rates where they are now [and] with the downsizing that went on in our business, we anticipated that there would be a number of people champing at the bit to get back to work. [But] we’re finding that there’s not as big an appetite for a lot of those people to come back to the oil patch ... which is unfortunate.” Rob Cox, Vice President of Canadian Operations, Trican Well Service
“We have to be prepared for the possibility that oil prices are going to remain lower and more volatile for an extended period of time … US$30 a barrel oil is barely in the rear-view mirror. Companies will be relatively careful, certainly about taking on permanent staff. As activity ramps up, you are going to see more people employed in drilling and completing wells and work out in the field, but in the head office area, it’s going to be slow to see numbers increase.” Robert Peabody, President and CEO, Husky Energy Inc. February 2, 2017
• Training reductions. As oil and gas prices declined, training was reduced to manage costs. With new or returning staff, safety and operational certification and new technology implementation training will be expected, resulting in increasing training requirements. Further, to the extent that oil and gas companies cannot attract back well-trained employees, the training investment they had made has been lost.
• Long-term survivor impacts. With the significant downsizing that occurred during 2015-2016, many remaining employees experienced an increased work load and increased pressure to do more with less, in some cases effectively doing the work of two to three people. Employee burnout out, prolonged stress and the potential increase of depression related short and long-term disability claims are expected to be restraining factors on future labour productivity. Also, to the degree that industry moves from a “survival” mode to a sustained mode of operation, organizations may add workers to offset the negative impacts that have occurred.
• Lingering Delay in Rehiring. With prices remaining low, companies may be reluctant to hire back individuals in the face of volatile oil and gas prices, difficulty in finding experienced and skilled workers and the opportunity, in some circumstance, to introduce technological solutions to reduce labour requirements.
From an occupation perspective, employers are expected to prioritize hiring to support additional oil production, while head office functions are expected to lag. The hiring of these operations occupations may also be tempered as companies consider the adoption of technology and processes instead of people. Overall, the result is a modestly positive influence on labour productivity.
Appendix: Factors Impacting Oil and Gas Labour Productivity
Labour Productivity in Canada’s Oil and Gas Industry (September 2017) 32
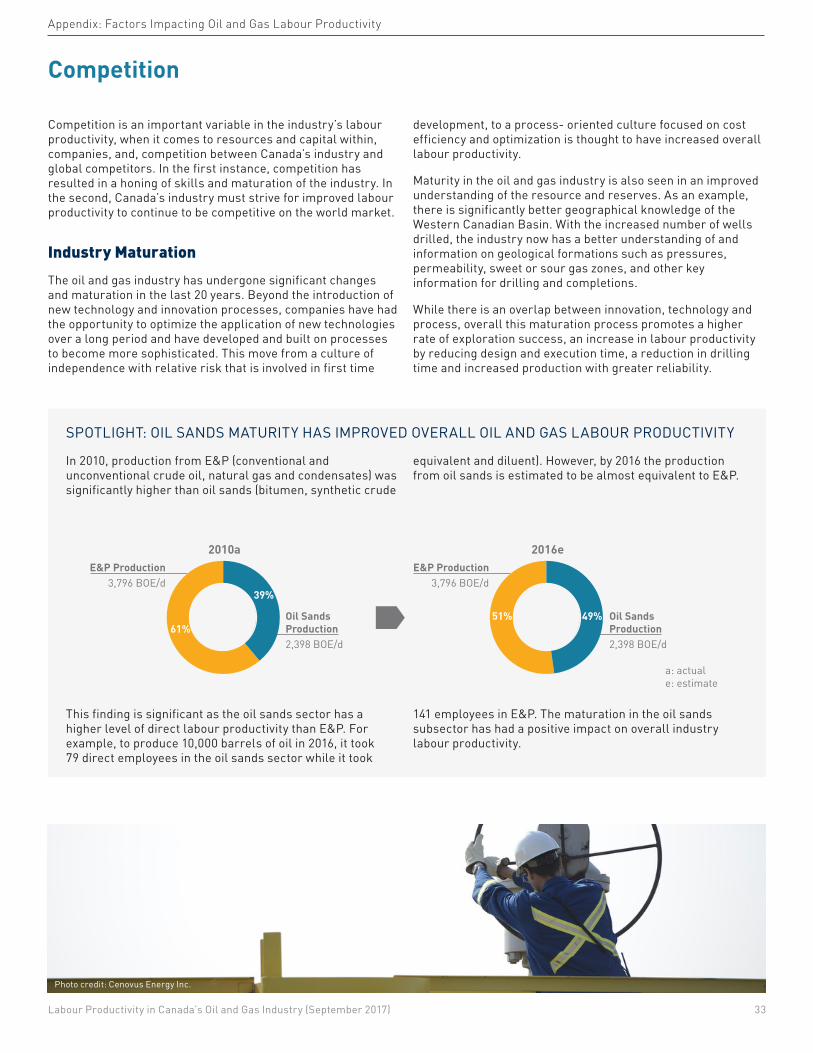
Competition is an important variable in the industry’s labour productivity, when it comes to resources and capital within, companies, and, competition between Canada’s industry and global competitors. In the first instance, competition has resulted in a honing of skills and maturation of the industry. In the second, Canada’s industry must strive for improved labour productivity to continue to be competitive on the world market.
Industry Maturation The oil and gas industry has undergone significant changes and maturation in the last 20 years. Beyond the introduction of new technology and innovation processes, companies have had the opportunity to optimize the application of new technologies over a long period and have developed and built on processes to become more sophisticated. This move from a culture of independence with relative risk that is involved in first time
development, to a process- oriented culture focused on cost efficiency and optimization is thought to have increased overall labour productivity.
Maturity in the oil and gas industry is also seen in an improved understanding of the resource and reserves. As an example, there is significantly better geographical knowledge of the Western Canadian Basin. With the increased number of wells drilled, the industry now has a better understanding of and information on geological formations such as pressures, permeability, sweet or sour gas zones, and other key information for drilling and completions.
While there is an overlap between innovation, technology and process, overall this maturation process promotes a higher rate of exploration success, an increase in labour productivity by reducing design and execution time, a reduction in drilling time and increased production with greater reliability.
Competition
Appendix: Factors Impacting Oil and Gas Labour Productivity
SPOTLIGHT: OIL SANDS MATURITY HAS IMPROVED OVERALL OIL AND GAS LABOUR PRODUCTIVITY
This finding is significant as the oil sands sector has a higher level of direct labour productivity than E&P. For example, to produce 10,000 barrels of oil in 2016, it took 79 direct employees in the oil sands sector while it took
141 employees in E&P. The maturation in the oil sands subsector has had a positive impact on overall industry labour productivity.
In 2010, production from E&P (conventional and unconventional crude oil, natural gas and condensates) was significantly higher than oil sands (bitumen, synthetic crude
equivalent and diluent). However, by 2016 the production from oil sands is estimated to be almost equivalent to E&P.
2010aE&P Production
3,796 BOE/d
61%
39%
Oil SandsProduction2,398 BOE/d
2016eE&P Production
3,796 BOE/d
Oil SandsProduction2,398 BOE/d
a: actuale: estimate
51% 49%
Photo credit: Cenovus Energy Inc.
Labour Productivity in Canada’s Oil and Gas Industry (September 2017) 33
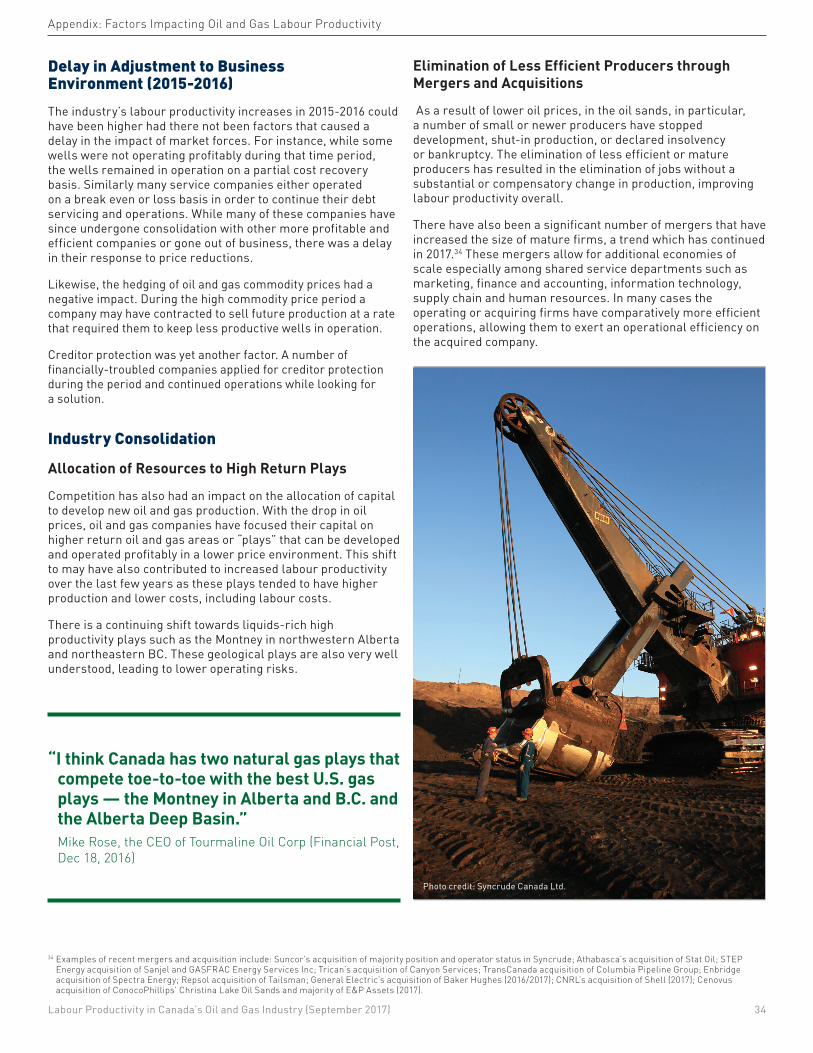
Delay in Adjustment to Business Environment (2015-2016) The industry’s labour productivity increases in 2015-2016 could have been higher had there not been factors that caused a delay in the impact of market forces. For instance, while some wells were not operating profitably during that time period, the wells remained in operation on a partial cost recovery basis. Similarly many service companies either operated on a break even or loss basis in order to continue their debt servicing and operations. While many of these companies have since undergone consolidation with other more profitable and efficient companies or gone out of business, there was a delay in their response to price reductions.
Likewise, the hedging of oil and gas commodity prices had a negative impact. During the high commodity price period a company may have contracted to sell future production at a rate that required them to keep less productive wells in operation.
Creditor protection was yet another factor. A number of financially-troubled companies applied for creditor protection during the period and continued operations while looking for a solution.
Industry Consolidation
Allocation of Resources to High Return Plays
Competition has also had an impact on the allocation of capital to develop new oil and gas production. With the drop in oil prices, oil and gas companies have focused their capital on higher return oil and gas areas or “plays” that can be developed and operated profitably in a lower price environment. This shift to may have also contributed to increased labour productivity over the last few years as these plays tended to have higher production and lower costs, including labour costs.
There is a continuing shift towards liquids-rich high productivity plays such as the Montney in northwestern Alberta and northeastern BC. These geological plays are also very well understood, leading to lower operating risks.
“I think Canada has two natural gas plays that compete toe-to-toe with the best U.S. gas plays — the Montney in Alberta and B.C. and the Alberta Deep Basin.” Mike Rose, the CEO of Tourmaline Oil Corp (Financial Post, Dec 18, 2016)
Elimination of Less Efficient Producers through Mergers and Acquisitions
As a result of lower oil prices, in the oil sands, in particular, a number of small or newer producers have stopped development, shut-in production, or declared insolvency or bankruptcy. The elimination of less efficient or mature producers has resulted in the elimination of jobs without a substantial or compensatory change in production, improving labour productivity overall.
There have also been a significant number of mergers that have increased the size of mature firms, a trend which has continued in 2017.34 These mergers allow for additional economies of scale especially among shared service departments such as marketing, finance and accounting, information technology, supply chain and human resources. In many cases the operating or acquiring firms have comparatively more efficient operations, allowing them to exert an operational efficiency on the acquired company.
34 Examples of recent mergers and acquisition include: Suncor’s acquisition of majority position and operator status in Syncrude; Athabasca’s acquisition of Stat Oil; STEP Energy acquisition of Sanjel and GASFRAC Energy Services Inc; Trican’s acquisition of Canyon Services; TransCanada acquisition of Columbia Pipeline Group; Enbridge acquisition of Spectra Energy; Repsol acquisition of Tailsman; General Electric’s acquisition of Baker Hughes (2016/2017); CNRL’s acquisition of Shell (2017); Cenovus acquisition of ConocoPhillips’ Christina Lake Oil Sands and majority of E&P Assets (2017).
Appendix: Factors Impacting Oil and Gas Labour Productivity
Photo credit: Syncrude Canada Ltd.
Labour Productivity in Canada’s Oil and Gas Industry (September 2017) 34
Regulatory and Public Considerations
For both industry and governments, balancing public and industry considerations regarding developing oil and gas resources can be a challenge. In some cases, regulatory impacts may add increased labour burdens in terms of monitoring/reporting, exploration and operational requirements. In other cases, addressing environmental concerns has driven innovation to reduce environmental footprints and increase industry’s operational efficiencies. As one example, increased regulations and concerns over environmental development in part led to E&P operators significantly decreasing their environmental footprint through the adoption of multi-well pad drilling which in turn proved to benefit labour productivity by reducing time to drill, facility construction and centralization of operations.
One potential restraining force on the oil and gas industry relates to federal and provincial governments’ strategies to reduce carbon emissions.
On a net basis, the regulatory environment and increased public concern is viewed to have had a negative historical impact on labour productivity due to the increase in l resources required to manage increased public consultations regulatory requirements such as reporting and specific operating practices, in addition to delays in approvals for projects.
Regulatory and public considerations are expected to continue to be both a restraining and driving force of labour productivity.
Carbon Tax Implementation. The implementation of carbon levies is likely to see an increase in requirements for monitoring and reporting carbon emissions. Additionally, companies may replace existing carbon-emitting technologies or consider retrofitting existing facilities with less carbon intensive technologies. This may include any number of technologies currently under consideration. The increase labour required for monitoring, developing and implementing of new, less carbon intensive technology may be a restraining factor on labour productivity.
To the extent that some low carbon emission technology contributes to improvements in overall production or requires less staff for operation, it is expected that it will also act as driver for labour productivity. For example, as discussed in the innovation section of this report, the increase use of solvents in in situ operations is expected to result in lower carbon emissions, and will have a positive environmental impact and improve labour productivity through an increase in production.
Environmental Approvals. Significant changes to environmental assessment regulations are currently under consideration by the federal government. This includes the creation of a new environmental agency to replace the National Energy Board, raising concerns the time frame for regulatory approvals may be lengthened and complicated.
Other Regulatory Changes
Other factors identified as having the potential to restrain labour productivity include:
• Changes to Alberta Employment Regulations. Changes to Alberta employment regulations will make it easier for unions to certify.35 Currently, the majority of the oil and gas industry is non-certified. Other potential changes to regulations regarding compressed work weeks and the banking of overtime hours at regular rates could impact labour productivity on an employee per production basis as these work approaches are used by oil and gas companies during construction projects, turnarounds and routinely for rotational employment schedules.
• Marijuana legalization. The oil and gas industry has expressed concerns about the impact of the legalization of marijuana on the workplace, including the adverse impact on work place safety.36 An increase in safety incidents, work stoppages, worker impairment, monitoring and enforcement requirements, employee absences and recruitment challenges are all factors that have the potential to decrease labour productivity.
35 Alberta Government Labour Relations Code Changes, https://www.alberta.ca/labour-relations-changes.aspx#toc-136 Oil patch worries that marijuana legalization may raise operating costs, Macleans, Canadian Press, May 1, 2017
Appendix: Factors Impacting Oil and Gas Labour Productivity
Labour Productivity in Canada’s Oil and Gas Industry (September 2017) 35
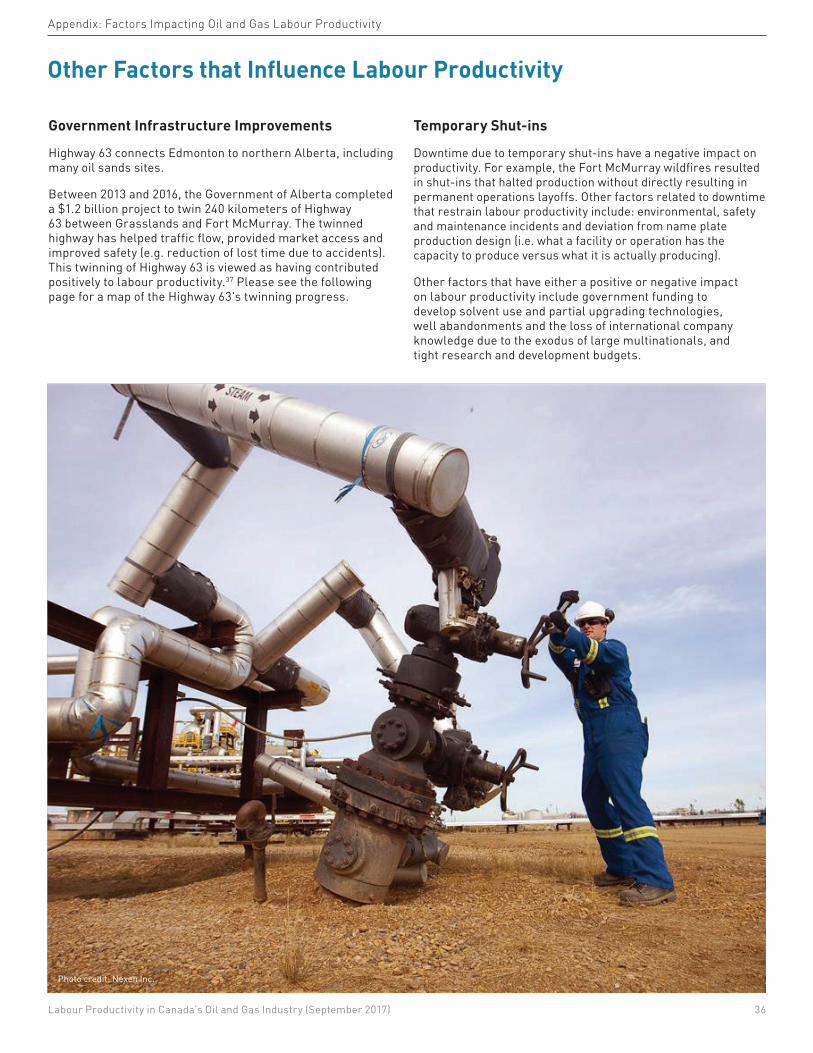
Government Infrastructure Improvements
Highway 63 connects Edmonton to northern Alberta, including many oil sands sites.
Between 2013 and 2016, the Government of Alberta completed a $1.2 billion project to twin 240 kilometers of Highway 63 between Grasslands and Fort McMurray. The twinned highway has helped traffic flow, provided market access and improved safety (e.g. reduction of lost time due to accidents). This twinning of Highway 63 is viewed as having contributed positively to labour productivity.37 Please see the following page for a map of the Highway 63's twinning progress.
Temporary Shut-ins
Downtime due to temporary shut-ins have a negative impact on productivity. For example, the Fort McMurray wildfires resulted in shut-ins that halted production without directly resulting in permanent operations layoffs. Other factors related to downtime that restrain labour productivity include: environmental, safety and maintenance incidents and deviation from name plate production design (i.e. what a facility or operation has the capacity to produce versus what it is actually producing).
Other factors that have either a positive or negative impact on labour productivity include government funding to develop solvent use and partial upgrading technologies, well abandonments and the loss of international company knowledge due to the exodus of large multinationals, and tight research and development budgets.
Other Factors that Influence Labour Productivity
Appendix: Factors Impacting Oil and Gas Labour Productivity
Labour Productivity in Canada’s Oil and Gas Industry (September 2017) 36
Photo credit: Nexen Inc.
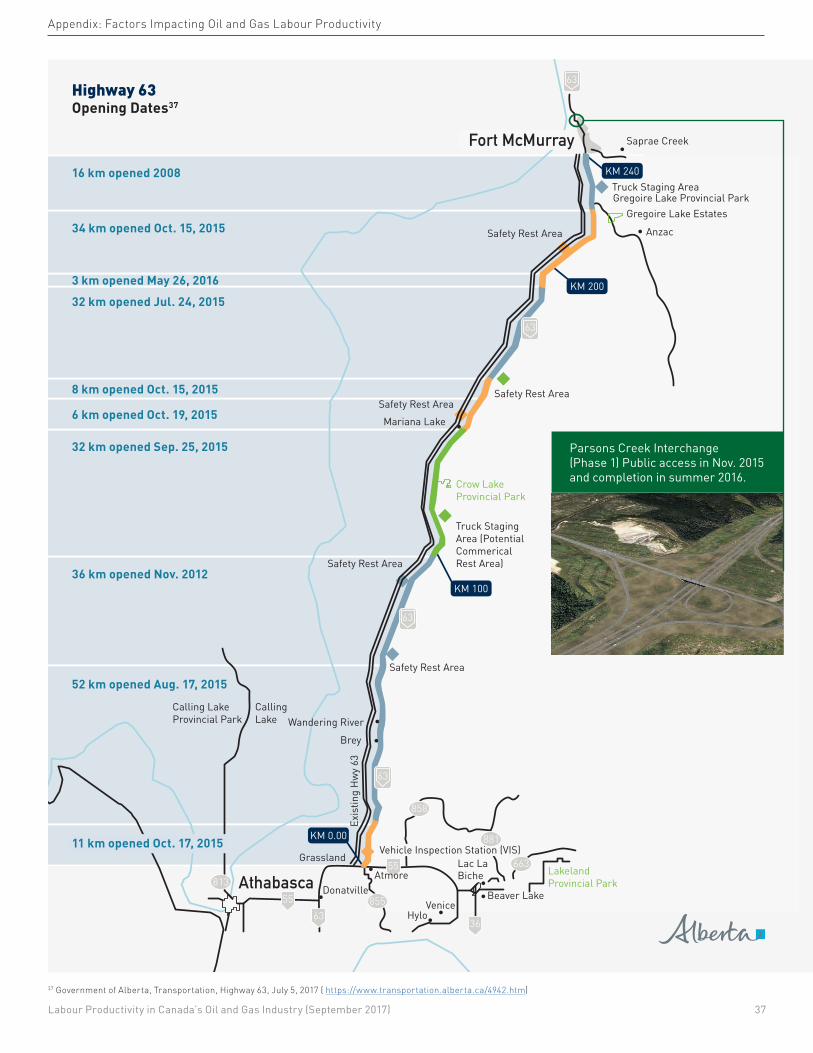
37 Government of Alberta, Transportation, Highway 63, July 5, 2017 ( https://www.transportation.alberta.ca/4942.htm)
Peac
e
663
858
855
63
69
813
KM 0.00
Hylo
DonatvilleVenice
Grassland
Exis
ting
Hw
y 63
AthabascaBeaver Lake
Lakeland Provincial Park
Lac La Biche
Wandering RiverCallingLake
Calling LakeProvincial Park
Brey
Safety Rest Area
Safety Rest Area
Mariana LakeSafety Rest Area
Safety Rest Area
Truck Staging AreaGregoire Lake Provincial Park
Gregoire Lake Estates
Saprae Creek
Safety Rest Area
Truck Staging Area (Potential Commerical Rest Area)
Crow Lake Provincial Park
Anzac
55
Fort McMurray
Edmonton
63
63
63
63
63
55
36
Atmore
Vehicle Inspection Station (VIS)881
KM 100
KM 200
KM 240
Highway 63 Opening Dates37
16 km opened 2008
34 km opened Oct. 15, 2015
3 km opened May 26, 201632 km opened Jul. 24, 2015
8 km opened Oct. 15, 2015
6 km opened Oct. 19, 2015
32 km opened Sep. 25, 2015
36 km opened Nov. 2012
52 km opened Aug. 17, 2015
11 km opened Oct. 17, 2015
Parsons Creek Interchange (Phase 1) Public access in Nov. 2015 and completion in summer 2016.
Appendix: Factors Impacting Oil and Gas Labour Productivity
Labour Productivity in Canada’s Oil and Gas Industry (September 2017) 37
Glossary
Automation: The use of various control systems for operating equipment such as machinery, processes and vehicles with minimal or reduced human intervention—portions or all of activities may be automated.
Autonomous vehicles: A self-operating machine, or a machine or control mechanism designed to automatically follow a predetermined sequence of operations, or respond to predetermined instructions such as driver-less haul trucks.
Bitumen: Heavy, viscous form of crude oil, often found in oil sands deposits.
Carbon tax: Fee imposed on the burning of carbon-based fuels (coal, oil, gas).
Conventional: Process of recovering petroleum from a well using standard drilling production methods.
Debottlenecking: Process of identifying specific areas and/or equipment in oil and gas facilities that limit the flow of product and optimizing them so that the overall capacity of production increases.
Downstream: Commonly used to refer to the refining of crude oil, and the selling and distribution of natural gas and products derived from crude oil.
Employment: The number of workers required to support the activity levels in a given year (direct employment only).
Exploration and Production (E&P): Focus on finding, augmenting, producing and merchandising different types of oil and gas.
Force field analysis: A method or framework used to analyze factors, or forces, which influence a situation either negatively or positively.
Fracking: Technology used to recover shale or tight natural gas that is trapped in deep underground rock.
In situ: Technique using steam to recover oil from sand in oil sands extraction.
Labour benchmarks: Labour benchmarks are expressed as the inverse of labour productivity. They measure the number of employees required for a specific output. For example, the benchmark for oil sands is employment per 10,000 BOE/d.
Labour demand: The number of workers required to fill job vacancies.
Labour market: Collective term describing the dynamics and interaction of workers and employers, including employment, unemployment, participation rates and wages.
Labour force: Labour pool available in an industry and/or sector.
Labour productivity: A measurement defined as the ratio of output per unit of labour input. Output is typically measured in terms of the value or volume of the goods and service. Labour input is typically measured using hours worked or number of employees.
Labour shortage: Labour supply is less than labour demand.
Labour supply: Availability of suitable workers in a particular labour market.
Offshore: Exploration for oil and/or natural gas located offshore, often in oceans or other large bodies of water. The offshore
industry in Canada is mainly found in Newfoundland and Labrador and Nova Scotia.
Oil and gas services: Contracted exploration, extraction and production services to the oil sands and non-oil sands E&P sectors and includes the following: drilling and completion, geophysical (also known as seismic) and oilfield services.
Oil sands: The petroleum subsector involved in the extraction and upgrading of bitumen. Extraction includes mining and in situ extraction which is typically Steam Assisted Gravity Drainage (SAGD) and upgrading facilities.
Operations phase: The extraction, production and upgrading of bitumen, which consists of three operation types: mining, in situ and upgrading.
Pipeline transmission: Petroleum subsector responsible for mainline transmission for transporting daily crude oil and natural gas production.
Retention: Activities based around keeping workers within a company, organization or industry.
Shale: fine-grained sedimentary rock from which liquid hydocarbons can be extracted.
Shut-ins: A period when a well has available but unused capacity.
Unemployment rate: Percentage of the economically active population that are not working but want to work and are actively looking for employment.
Upgrading: Process by which heavy oil and bitumen are converted into lighter crude by increasing the ratio of hydrogen to carbon, normally using either coking or hydroprocessing.
Upstream: Searching for, recovering and producing crude oil and natural gas.
Well Launcher: A software program than captures the process stages in well design and drilling execution.
Workforce: Labour pool available in an industry and/or sector.
List of AbbreviationsBOE/d: Barrels of oil per day
CAPEX (Capital Expenditures): Funds used by a company to acquire or upgrade physical assets such as property, industrial buildings or equipment. Often used to undertake new projects or investments.
CAPP: Canadian Association of Petroleum Producers
COSIA: Canada’s Oil Sands Innovation Alliance
LMI: Labour Market Information
PetroLMI: Petroleum Labour Market Information, a division of Enform
SCADA: a technology which allows for remote supervisory control and data acquisition
SAGD (Steam-assisted gravity drainage): In situ method of producing heavy oil that involves two horizontal wellbores, one above the other. Steam is injected into the upper wellbore and softened bitumen is recovered from the lower wellbore
Labour Productivity in Canada’s Oil and Gas Industry (September 2017) 38
Acknowledgments
The Petroleum Labour Market Information (PetroLMI) gratefully acknowledges the Government of Canada’s department of Employment and Social Development Canada for the funding to undertake and complete this study.
PetroLMI is also grateful for the time and expertise provided by the Canadian Association of Petroleum Producers, Petroleum Services Association of Canada, ATB Financial, and other industry representatives and labour market experts.
Last but not least, PetroLMI acknowledges the contributions of Dynawise Inc., Astrid Gagnier Communications and Projektor Brand Image Ltd. for assisting in the study and/or production of this report.
Disclaimer
All rights reserved.
The reader of this report has permission to use “limited labour market information (or LMI) content” for general reference or educational purposes in the reader’s analysis or research reports. “Limited LMI Content” is defined as not exceeding 400 words or a maximum of two data tables or graphs per document. Where Limited LMI Content is used, the reader must cite the source of the Limited LMI Content as follows: Source (or “adapted from”): PetroLMI, name or product, catalogue, volume and issue numbers, reference period and page(s).
The reader of this report cannot: • Market, distribute, export, translate,
transmit, merge, modify, transfer, adapt, loan, rent, lease, assign, share, sub-license or make available to another person or entity, this report in any way, in whole or in part
• Use this report and its contents to develop or derive any other information product or information service for commercial distribution or sale
• Use this report and its contents in any manner deemed competitive with any other product or service sold by PetroLMI
The information and projections contained herein have been prepared with information sources PetroLMI has deemed to be reliable.
PetroLMI makes no representations or warranties that this report is error free and therefore shall not be liable for any financial or other losses or damages of any nature whatsoever arising from or otherwise relating to any use of this document.
The opinions and interpretations in this publication are those of PetroLMI and do not necessarily reflect those of the Government of Canada.
For more information, contact:Petroleum Labour Market Information (PetroLMI)Phone: 403-516-8100Email: [email protected]
Copyright © PetroLMI 2017
Published September 2017

The Petroleum Labour Market Information (PetroLMI) is a leading resource for labour market information and trends in the Canadian petroleum industry.
PetroLMI specializes in providing petroleum labour market data, analysis and insights, as well as occupation profiles and other resources for workforce and career planning.
With the support of industry, PetroLMI has developed the Careers in Oil + Gas website to provide its resources and key industry information to those in workforce planning or who are planning and pursuing careers in the oil and gas industry.
Follow us:Funded in part by the Government of Canada’s Sectoral Initiatives Program