Embed Size (px)
Citation preview
WP05 Labour’s record on cash transfers, poverty, inequality and the lifecycle 1997-2010
Labour’s Record on Neighbourhood Renewal in England: Policy, Spending and Outcomes 1997-2010
Ruth Lupton, Alex Fenton and Amanda Fitzgerald
Preface
This is one of a series of working papers which form the first stage of a programme of research, Social
Policy in a Cold Climate, designed to examine the effects of the major economic and political changes in
the UK since 2007, particularly their impact on the distribution of wealth, poverty, income inequality and
spatial difference. The full programme of analysis will include policies and spending decisions from the
last period of the Labour government (2007-2010), including the beginning of the financial crisis, as well
as those made by the Coalition government since May 2010. The programme is funded by the Joseph
Rowntree Foundation and the Nuffield Foundation, with London-specific analysis funded by the Trust for
London. The views expressed are those of the authors and not necessarily those of the funders.
The research is taking place from October 2011 to May 2015. More detail and other papers in the series
will be found at: http://sticerd.lse.ac.uk/case/_new/research/Social_Policy_in_a_Cold_Climate.asp
In our first set of papers, including this, we look back at the policies of the Labour government from 1997
to 2010, charting their approach and assessing their impact on the distribution of outcomes and on
poverty and inequality particularly. This provides a baseline for analysing and understanding the
changes that are now taking place under the Coalition government. All these papers approach this by
following a chain from ultimate policy aims, through specific policy objectives, to public spending and
other policies, to outcomes. This provides a device for the systematic analysis and comparison of
activity and impact in different social policy areas. A short supplementary paper defining the terms used
in the framework and exploring its uses and limitations is available at
http://sticerd.lse.ac.uk/dps/case/spcc/RN001.pdf
Working Paper 6 July 2013
2
WP05 Labour’s record on Neighbourhood Renewal in England
We gratefully acknowledge the support of our colleagues on the SPCC research team and members of
our advisory group in helping us to shape this paper by commenting on earlier drafts. Beyond SPCC,
Bert Provan, Carol Hayden, John Houghton and various colleagues within the Department of
Communities and Local Government helped us to find data and reports, and advised on matters of fact
and interpretation. Abigail McKnight provided editorial guidance. Cheryl Conner helped with the
preparation and presentation of the paper. We appreciate all their help.
The research uses data from the Census, major government surveys and other sources of administrative
data, such as welfare benefit claims. Data have been provided by the UK Data Archive, NOMIS, the
Census Distribution Unit, the Office of National Statistics, and by individual government departments, in
particular CLG. We acknowledge the funders, creators, depositors and distributors, who bear no
responsibility for the analysis and interpretation of these sources contained in this study. Crown
copyright material is reproduced with the permission of the Controller of HMSO and the Queen's Printer
for Scotland.
Ruth Lupton is Professor of Education at the University of Manchester, and was previously Principal
Research Fellow and Deputy Director at the Centre for Analysis of Social Exclusion (CASE), London
School of Economics and Political Science
Alex Fenton is formerly a Research Fellow at CASE
Amanda Fitzgerald is a Research Officer at CASE
3
WP05 Labour’s record on Neighbourhood Renewal in England
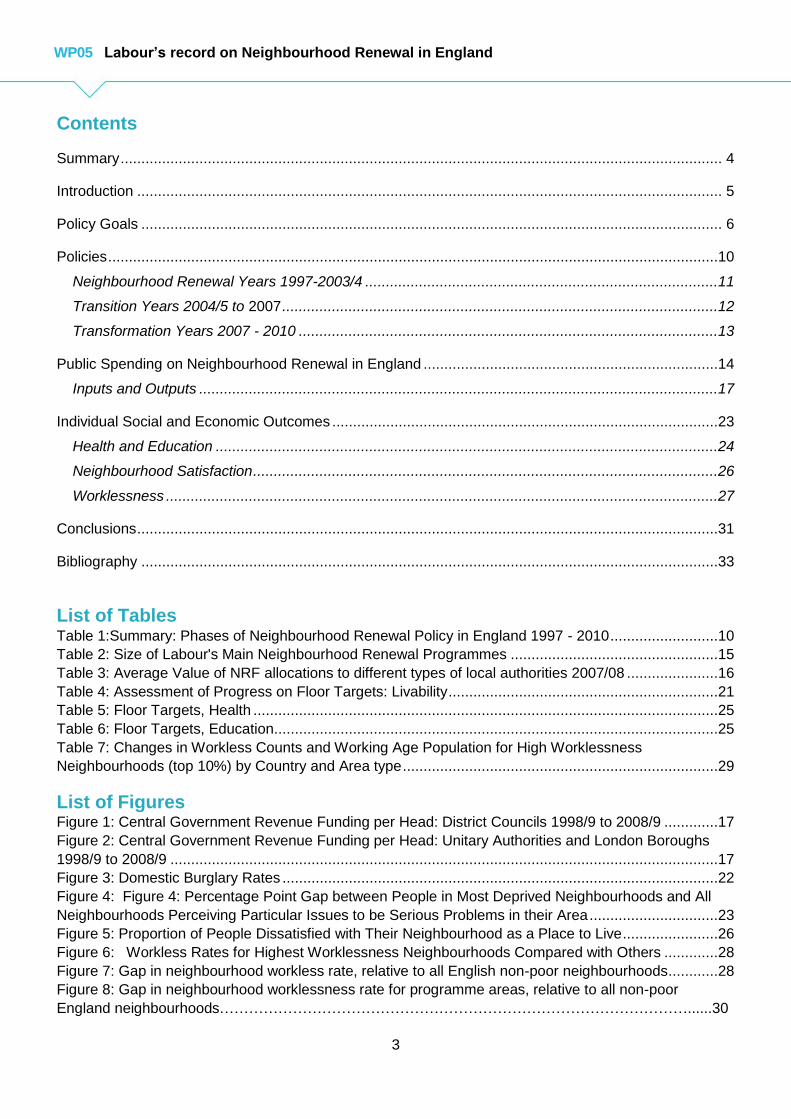
Contents
Summary ................................................................................................................................................. 4
Introduction ............................................................................................................................................. 5
Policy Goals ............................................................................................................................................ 6
Policies ...................................................................................................................................................10
Neighbourhood Renewal Years 1997-2003/4 .....................................................................................11
Transition Years 2004/5 to 2007 .........................................................................................................12
Transformation Years 2007 - 2010 .....................................................................................................13
Public Spending on Neighbourhood Renewal in England .......................................................................14
Inputs and Outputs .............................................................................................................................17
Individual Social and Economic Outcomes .............................................................................................23
Health and Education .........................................................................................................................24
Neighbourhood Satisfaction ................................................................................................................26
Worklessness .....................................................................................................................................27
Conclusions ............................................................................................................................................31
Bibliography ...........................................................................................................................................33
List of Tables Table 1:Summary: Phases of Neighbourhood Renewal Policy in England 1997 - 2010 ..........................10
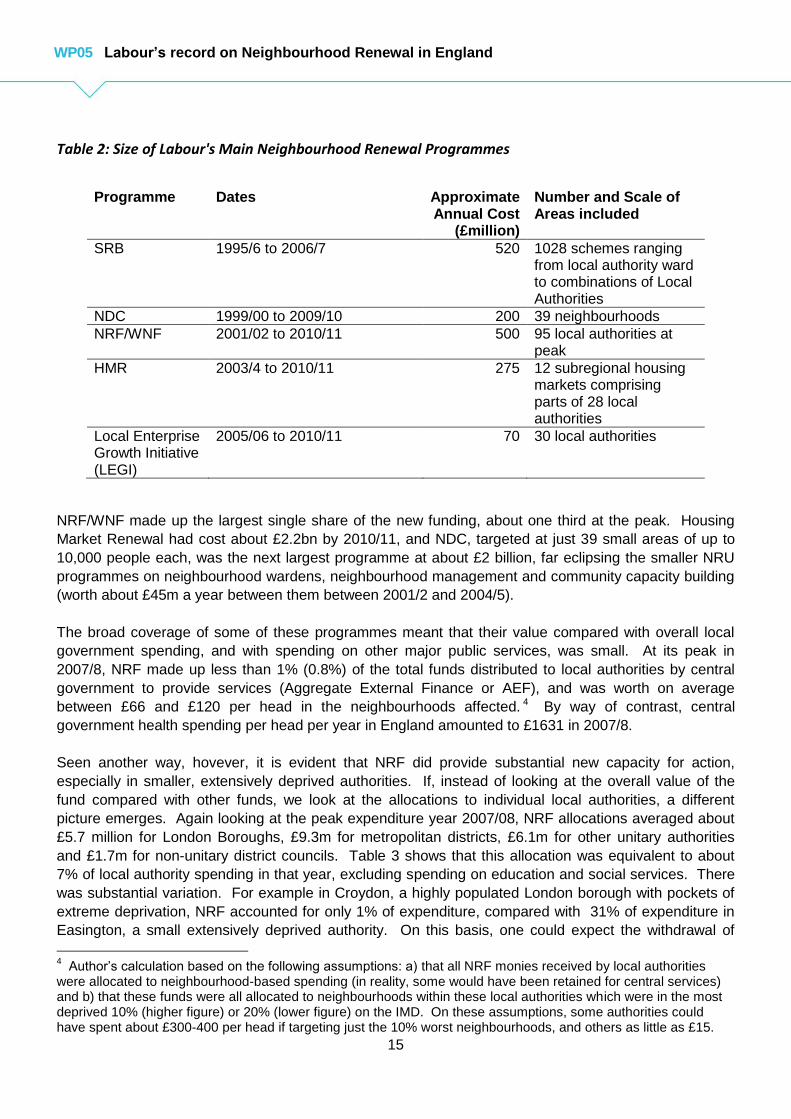
Table 2: Size of Labour's Main Neighbourhood Renewal Programmes ..................................................15
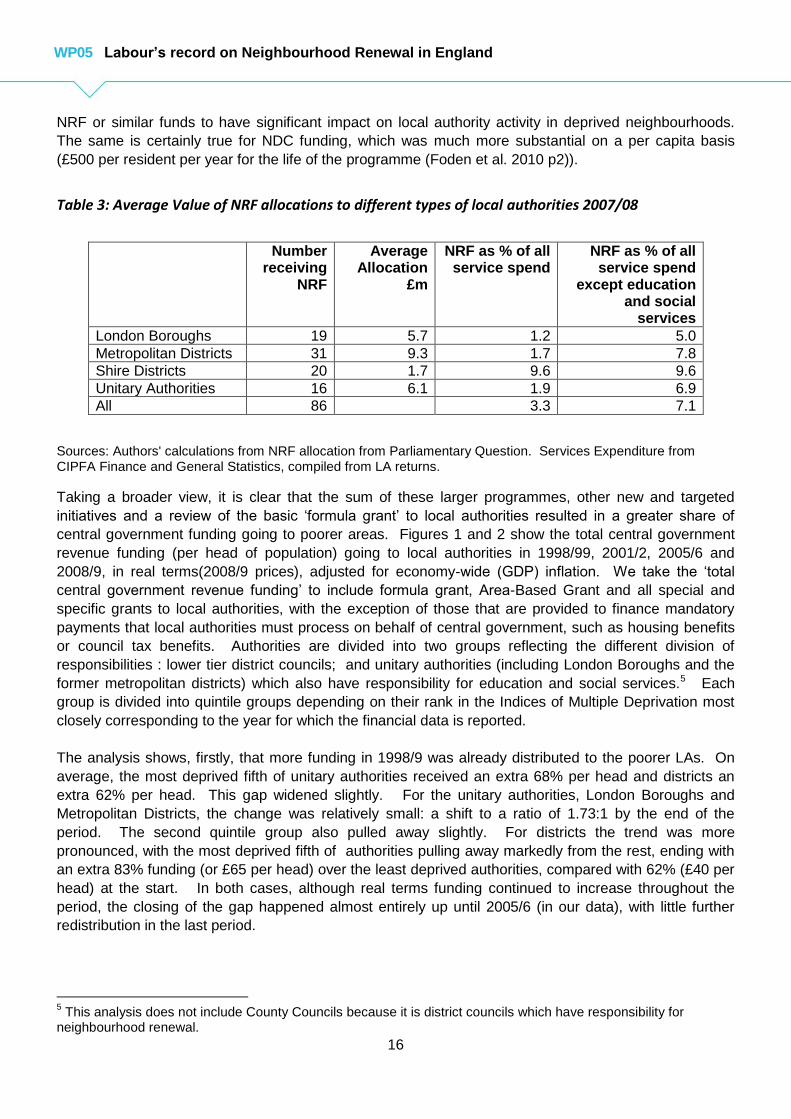
Table 3: Average Value of NRF allocations to different types of local authorities 2007/08 ......................16
Table 4: Assessment of Progress on Floor Targets: Livability .................................................................21
Table 5: Floor Targets, Health ................................................................................................................25
Table 6: Floor Targets, Education...........................................................................................................25
Table 7: Changes in Workless Counts and Working Age Population for High Worklessness
Neighbourhoods (top 10%) by Country and Area type ............................................................................29
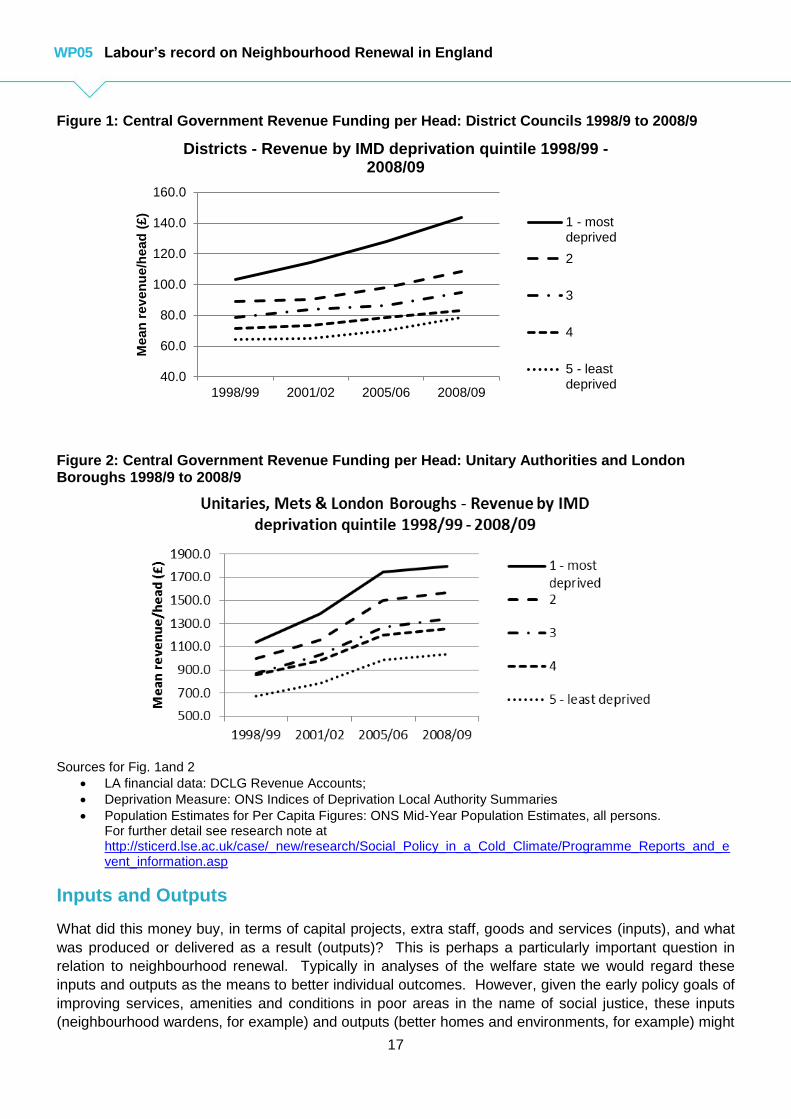
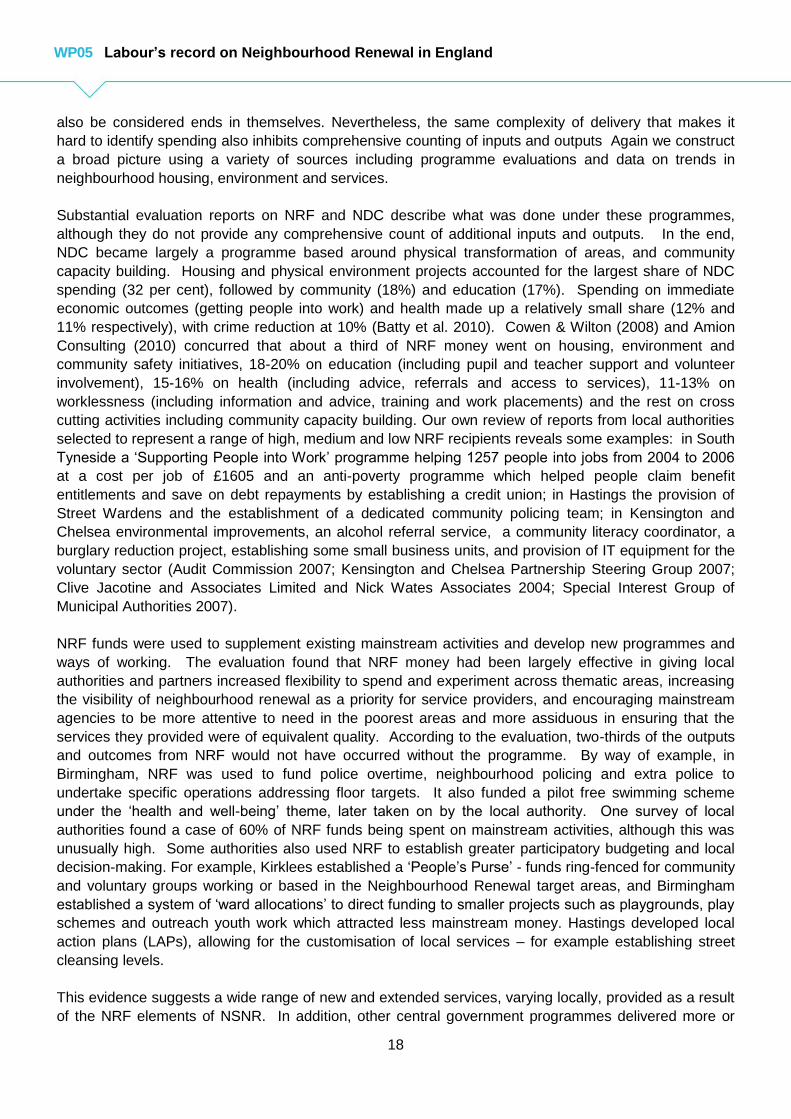
List of Figures Figure 1: Central Government Revenue Funding per Head: District Councils 1998/9 to 2008/9 .............17
Figure 2: Central Government Revenue Funding per Head: Unitary Authorities and London Boroughs
1998/9 to 2008/9 ....................................................................................................................................17
Figure 3: Domestic Burglary Rates .........................................................................................................22
Figure 4: Figure 4: Percentage Point Gap between People in Most Deprived Neighbourhoods and All
Neighbourhoods Perceiving Particular Issues to be Serious Problems in their Area ...............................23
Figure 5: Proportion of People Dissatisfied with Their Neighbourhood as a Place to Live .......................26
Figure 6: Workless Rates for Highest Worklessness Neighbourhoods Compared with Others .............28
Figure 7: Gap in neighbourhood workless rate, relative to all English non-poor neighbourhoods ............28
Figure 8: Gap in neighbourhood worklessness rate for programme areas, relative to all non-poor
England neighbourhoods……………………………………………………………………………………......30

4
WP05 Labour’s record on Neighbourhood Renewal in England
Summary
When he came to power in 1997, Tony Blair reacted to widening disparities between poorer and richer
neighbourhoods by declaring that no one in future decades should be seriously disadvantaged by where
they lived. What policies did Labour pursue and how close did it come to realising Blair’s vision?
Labour introduced a new approach – a National Strategy for Neighbourhood Renewal. Minimum
standards were set that no neighbourhood should fall below (described as “the social equivalent of
the Minimum Wage”).
New funds were made available. The largest was the Neighbourhood Renewal Fund (NRF),
costing about £500m per year. Poor neighbourhoods also received extra inputs through Sure Start,
Decent Homes, Housing Market Renewal, New Deal for Communities (NDC), Excellence in Cities
and many others.
Physical environments and services got better. 90 per cent of social housing was brought to a
‘decent’ standard. Rates of crime, litter and vandalism fell and differences between deprived and
other areas (“gaps”) narrowed. New childcare and health centres, schools and community buildings
were built in the most deprived areas; neighbourhood policing and community warden schemes were
introduced.
Gaps also improved in many individual outcomes between poorer and richer areas including
death rates from cancer and heart disease, school attainment, and worklessness. But some gaps did
not close, including life expectancy and neighbourhood satisfaction, and all gaps remained large.
Labour’s investments represented value for money. The NDC evaluation estimated savings at
between three and five times the amounts invested. Evaluation of the NRF concluded that savings
from reductions in worklessness were five times the estimated £312m spent on this issue.
Labour’s neighbourhood renewal policies achieved a great deal. They reversed a trend of increasing
disparities between areas, both in opportunities and outcomes. But Blair’s vision was not realised: which
is, perhaps, not surprising in the context of sustained income inequalities. In 2015 we will produce an
equivalent report on the Coalition’s record.
A full summary of this paper is available at:
http://sticerd.lse.ac.uk/case/_new/research/Social_Policy_in_a_Cold_Climate/Programme_Reports_and_event_information.asp
5
WP05 Labour’s record on Neighbourhood Renewal in England
Introduction
Since 2010 there have been dramatic changes to the approach of central government in England to the
‘regeneration’ or ‘renewal’ of deprived neighbourhoods. In moves that reflect not only deficit reduction
policies, but the government’s desire to reduce the size of the central state and give greater power and
responsibility to local communities, all of the major funding streams supporting regeneration in 2010
have since been discontinued, along with many of the institutions and mechanisms established by
Labour: area agreements between central and local government, regional spatial strategies,
Government Offices for the regions and Regional Development Agencies. Instead, the new government
has focused much more on stimulating growth to enable regeneration, with central government in a
“strategic and supportive role” (Department for Communities and Local Government 2011, no page
number). Mechanisms include the Regional Growth Fund, New Homes Bonus, reforms of the planning
system and investments in infrastructure projects such as the high speed rail network, Crossrail and the
Olympic legacy. The goal is that “local economies prosper, parts of the country previously over-reliant
on public funding see a resurgence in private sector enterprise and employment, and that everyone gets
to share in the resulting growth” (ibid, no page number). At the same time, local regeneration activity is
seen as “driving economic growth and helping local leaders to strengthen their communities and support
people back into work” (ibid, no page number). To enable this, the government is removing ringfencing
of local government budgets, enabling local pooling of budgets, and encouraging the co-production of
services by community and voluntary organisations as part of the ‘Big Society’. The approach of the
English government contrasts with the situation in Scotland, Wales and Northern Ireland, where central
government commitments to neighbourhood renewal programmes have been reaffirmed.
The impact of these policy changes, in combination with the effects of recession and muted recovery, is
one of the key topics investigated by the Social Policy in a Cold Climate research programme. In
addition to tracking policy and spending changes, we are analysing neighbourhood-level changes in
poverty and deprivation before and after the Coalition took office, using a variety of area typologies and
metrics. In this paper we put this in context by looking back at the period 1997-2010. To enable a
detailed comparison with what is happening now, we set out the previous government’s policy approach,
and assess its results. How did Labour approach deprived neighbourhoods, and what did it achieve?
What legacy did it leave for the Coalition to inherit? A full comparison of all four constituent countries of
the UK is beyond the scope of a single paper. This paper therefore focuses on England, which has
experienced the most substantial policy shifts over the period in question as well as being the UK’s
largest country. A companion paper (Lupton, forthcoming) provides a full comparative analysis of policy
developments in England, Scotland, Northern Ireland and Wales.

6
WP05 Labour’s record on Neighbourhood Renewal in England
Policy Goals
As Glennerster and Hills (1998) note, some areas of social policy, such as health, are characterised by
long-term consistency in their overall goals while in others, such as education, the fundamental purposes
of policy intervention, not just the content of the policies themselves, are often politically contested at any
one time and also seem to undergo periodic shifts of political consensus. Neighbourhood renewal
certainly comes into the latter category. Labour’s election in 1997 brought about a steep-change in
policy from that of the previous Conservative administration, and substantial changes were also evident
over the Labour period. We suggest that three distinct periods can be identified: the ‘neighbourhood
renewal years’ (1997-2003/4), the ‘transition years’ (2004/5 to 2007) and the ‘transformation years’ (from
2007/8 onwards).
The early years of the Blair government saw neighbourhood renewal given high political priority, backed
by extensive new activity and funding. The impact of de-industrialisation, suburbanisation, social and
technological change and the shrinking value (relative to wages) of welfare benefits on the poorest
communities had become increasingly evident during the late 1980s and 1990s (Davies 1998; A. Power
& Mumford 1999; Lupton 2003). This resulted, under the Conservatives, in the initiation first of City
Challenge (in 1991/2) and then of the larger Single Regeneration Budget Challenge Fund (SRB) in 1994,
both programmes run by the then Department of the Environment. SRB was in itself a more
comprehensive approach than previously adopted. It rolled up a number of other grants and
programmes such as the remnants of the Urban Programme and Estate Action into a single fund
allocated to local partnerships by competitive bidding, either for themed or holistic area regeneration. It
was a relatively large programme, with over 1000 schemes funded in six annual rounds starting in
1995/6, but it was flexible and local. Because of the competitive nature of the fund, the distribution of
funding depended on capacity for project design and bidding as well as deprivation. The scale, duration
and content of schemes were determined by the local partnerships and government took a hands-off
approach to management (Rhodes et al. 2007).
Shaw & Robinson (2009) argue that City Challenge and SRB marked a significant shift away from the
property-led regeneration of the late 1980s to community-centred and partnership-based approaches
and in this sense ‘provided the foundations’ (p125) for Labour’s approach. However, with Labour’s
election in 1997, the problems of deprived areas were positioned as a matter of much higher political
priority, with responsibility moved to the centre of government, and with a much more wide-ranging
approach. Memorably, Blair highlighted the issue in his very first speech as Prime Minister at the
troubled Aylesbury Estate in Southwark. Disparities between neighbourhoods were placed at the centre
of the new social exclusion agenda, so much so that the first task of the new Social Exclusion Unit (SEU)
that Blair launched at the Aylesbury Estate was to report on the problems of deprived neighbourhoods.
From this followed the establishment of eighteen Policy Action Teams (PATS)–energetic collaborations
between civil servants, academics, community leaders and local professionals to identify the problems
and work out how they could be solved. The involvement of Whitehall outsiders was a feature of
Labour’s early policy making (Eisenstadt 2011), bringing a greater connection to problems on the ground
and an energy and commitment for change. The SEU and the PATS were seemingly able to craft a new
consensus around what needed to be done, and persuade government to back it with increased
spending and new ways of working. Their work led to a National Strategy for Neighbourhood Renewal
(NSNR), launched with the aim that within 10 to 20 years no-one should be seriously disadvantaged by
where they live (SEU 2001). Houghton (2010) has observed that this was one of the few explicit pledges
made by the New Labour government in relation to inequality.
7
WP05 Labour’s record on Neighbourhood Renewal in England
Whether this goal – that neighbourhood disparities should be reduced so much as to eliminate any
significant problems (for individuals) arising from them – was ever intended to be narrowly interpreted
and enacted is debatable. As the NSNR Action Plan (SEU 2001) acknowledged, some places will
always be poorer than others (p24) and could therefore be expected to confer more disadvantages. The
actual impact of these neighbourhood differentials on individual outcomes (i.e. the existence of
‘neighbourhood effects’ that can make individual disadvantages worse), is disputed. Certainly no target
could be set in relation to reducing ‘neighbourhood effects’, given the patchy nature of the research
evidence on neighbourhood effects (van Ham et al. 2012). Arguably then, the statement that “no-one
should be seriously disadvantaged by where they live” should be read in a broader way, as a signal of
commitment to making a drastic improvement to the worst neighbourhoods rather than as a specific and
measurable goal. Indeed the vision as set out in the Action Plan makes this commitment clear.
Although some places would continue to be poor, cycles of decline could be stopped and prevented
from recurring, services should not be worse than in other areas, “all neighbourhoods in the country
should be free of fear”, and “we should not have neighbourhoods where so many people’s number one
priority is to move out” ( SEU 2001 p24).
Despite the visionary zeal with which this was expressed, we would describe this as “an ameliorative
logic”. A clear rationale was set out for central government interventions at the neighbourhood scale to
protect the residents of deprived areas from the worst consequences of economic and social inequality
in order to provide greater geographical equity in the distribution of services, opportunities, and
economic and social goods (such as health, safety of people and property, and neighbourhood
conditions and amenities). These neighbourhood level interventions went alongside policies of regional
economic development although not, as various critics have pointed out, broader economic and fiscal
policies to address growing inequalities in the economy and society as a whole (S. Power et al. 2005).
In the light of later developments, the motivation for this approach merits scrutiny. Policy documents
from this time indicate that architects of neighbourhood renewal policy saw its prime rationale as social
justice or fairness, with economic efficiency arguments also featuring, but in second place. A big part of
the problem was seen as the failure of central and local government: failure to tackle local economic
problems; to promote safe and stable communities; to provide good core public services such as
schools; to involve communities; to show leadership and work jointly; and to collect and use information
(SEU 2001 p18). Poor services and conditions, it was argued, made it worse to be on a low income, and
“people on low incomes should not have to suffer conditions and services that are failing and so different
from what the rest of the population receives” (ibid p 8). There is evidence here of a sense of injustice
and a demand for the rights of the least advantaged to be recognised. In this sense we do not wholly
agree with critics who have positioned Labour’s neighbourhood renewal policies as arising from a social
integrationist or moral underclass discourse that blamed people in low income neighbourhoods for their
own situation and put responsibility onto them to reintegrate themselves into society through upskilling
and participating in regeneration activities (Watt 2000).
In support of the overall vision, two long-term goals were set. The first was absolute: to have less
worklessness, less crime, better health, better skills, and better housing and physical environments in all
the poorest neighbourhoods. The second was relative: to narrow the gap on these measures between
the most deprived neighbourhoods and the rest of the country. These were supported by a set of ‘floor
targets’ (see Tables 4, 5 and 6 and later discussion for detail) described as “the social equivalent of the
Minimum Wage” (NRU website 1 ) ensuring that “no longer will the poorest areas and groups go
unnoticed.” In practice the targets included both floor and convergence goals.
1 http://webarchive.nationalarchives.gov.uk/20060530091128/http://neighbourhood.gov.uk/page.asp?id=585
Accessed 9th March 2012
8
WP05 Labour’s record on Neighbourhood Renewal in England
Significantly, housing and environment were added to the list of goals following extensive consultation, in
recognition of “the poor state of housing and the physical environment in many deprived areas, and the
part it plays in social exclusion” (SEU 2001 p25) (Power, A. 2007). The final list therefore gave rise to
different kinds of interventions: those that were primarily focused on places in order to facilitate
improvement in individual outcomes (e.g. environmental and housing improvements); those that were
focused on improving individual outcomes directly (e.g. employment advice and training); those that
targeted individuals in order to improve places (e.g. dealing with anti-social behaviour); and those that
were focused on people and places simultaneously and the interactions between them (e.g. multi-
faceted area regeneration programmes) (Griggs et al. 2008). The incorporation of all these goals
reflected the government’s recognition that individual circumstances are in part constituted by place, and
also that individual circumstances, choices and behaviours are constitutive of place characteristics.
People and place are linked in the concept of social exclusion. As we shall see, a significant proportion
of the spending ended up going towards housing, environment and amenities, although the majority of
the targets focused on individual outcomes not on these place improvements per se, with the result that
official measurements of success do not capture the holistic nature of the intentions and activities.
The new neighbourhood renewal approach essentially continued throughout John Prescott’s terms of
office in charge of communities and local government (until 2006) and during Ruth Kelly’s brief term in
2006/07. Following a review of progress by the Strategy Unit in the Cabinet Office in 2004 (Cabinet
Office 2004), the Prime Minister still identified poor housing and environments and key public services
performing poorly “so that deprived areas do not receive adequate support relative to their needs” (p8)
as key issues that needed to be tackled, and reaffirmed the original vision and goals of the NSNR.
However, towards the latter part of the period, the analysis of the problem began to shift, and with it the
emphasis put on different policy goals. For this reason, we describe the period from 2004-7 as ‘the
transition years’.
Two main shifts were evident. One was that more emphasis began to be given to the importance of
economic outcomes, with ‘worklessness’ emerging as a central term in policy documents. As early as
2004, the Cabinet Office review positioned ‘low levels of economic activity’ (p12) as one of the three
main drivers of area-based deprivation – a distinct discursive shift from the “mass joblessness as the
result of several recessions and the decline of manufacturing industry” to which the SEU (2001 p 17) had
alluded. Its report recommended that Regional Development Agencies should give greater priority to
“reducing worklessness and promoting enterprise in deprived areas” (p18). Second, and linked,
borrowing from the US ‘concentrated poverty’ literature, there was also more focus on ‘concentrated
deprivation’ and on the need to introduce greater social mix in order to make deprived communities
sustainable in the long term. Lupton & Tunstall (2008) have noted the increasing emphasis given to the
spatial ordering of problems, not as a manifestation of structural deficiencies, but in terms which
emphasised the spatial behaviour of people, such as ‘concentration’ and ‘clustering’, and the emergence
of arguments that, where the poor cluster, communities necessarily fail, despite the best efforts of
ameliorative interventions by the state. As David Miliband put it “We know that communities with a high
concentration of single tenure, low income residents have not worked in the past and will not work in the
future” (quoted in Weaver 2006). The idea that communities needed to be mixed and balanced in order
to be sustainable also emerged from the Sustainable Communities Plan (SCP) which introduced a
broader vision to create sustainable communities – places where people want to live – that promote
opportunity and a better quality of life for all.” (ODPM 2004), in which the earlier focus on the most
deprived neighbourhoods became subsumed. Overall, while the policy goal might have remained
notionally the same, the rationale for reducing neighbourhood disparities seemed to be shifting from
equity to efficiency. Rather less emphasis was being given to the long term ameliorative role of the
9
WP05 Labour’s record on Neighbourhood Renewal in England
state and rather more to the need to create functioning labour and housing markets that would enable
self-sustaining neighbourhoods, and, therefore, neighbourhoods that would not require repeated state
intervention. Discursively at least, the characteristics and behaviours of residents (‘worklessness’,
‘barriers’, ‘concentration’) were gaining more prominence, as structural arguments receded. At the same
time, the broader discourse of social exclusion was also changing. The rising economic tide and the
apparent success of early policies gave rise to an increasing focus on the very worst off groups, a
development that was also mirrored in neighbourhood renewal in discussions around sharpening
interventions to focus on areas in danger of reaching tipping points or not being picked up by housing
and labour market recovery (Meen et al. 2005).
The advent of Gordon Brown as Prime Minister in in 2007 heralded a much more fundamental shift in
policy goals, from social justice and amelioration to economic competitiveness and transformation.
While Brown was still at the Treasury, he instigated a review of sub-national economic development and
regeneration (HM Treasury. 2007) led by John Healey. The review concluded that substantial progress
had been made in reducing spatial disparities, but that the gaps were still too large, particularly in
relation to worklessness. Interventions were not always coordinated, nor at the right spatial scale, clear
in their objectives and sufficiently well targeted.
Most importantly, the review redefined regeneration and its purpose, in economic terms. Regeneration
was defined as the “process of reversing physical, economic and social decline in an area where market
forces will not do this without intervention” (p14), and its purpose was first and foremost to improve
economic efficiency. The document stated clearly that in an efficient market, there would inevitably be
inequalities between neighbourhoods. However, these would normally be corrected by market
mechanisms (such as investors moving to cheaper areas). State intervention should be considered in
order to correct market failures through provision of better public goods, information or coordination to
enhance investment and enable all areas to achieve their economic potential. Although an equity
rationale was also mentioned, this too was framed in economic terms. Returning all areas to market
functionality would benefit people with “barriers to full mobility” (between areas) and who were therefore
“most likely to suffer disproportionately from large spatial differences in economic performance”. Absent
from the review was any trace of the social justice rationale that had motivated the NSNR, its emphasis
on public services or its belief in greater community ownership of decision-making. Neighbourhood
interventions were needed, the review concluded, but should be aimed at sustainable economic
transformation not improving conditions per se. They should have “a stronger emphasis on tackling
worklessness and a stronger link to wider economic interventions” (p21). Following Brown’s move to No
10, Healey moved to CLG, where he put the recommendations of the review into place in a new
Regeneration Framework (CLG 2009). This set out three goals for regeneration (p5): improving
economic performance, improving rates of work and enterprise and creating sustainable places where
people want to live and work and businesses want to invest. It stressed supply side problems (such as
poor skills, lack of social networks and welfare dependency) as the cause of concentrations of
worklessness. In contrast to the earlier policy documents which had advocated a greater alignment of
spending and services to need, the Regeneration Framework set out a specific ambition to reduce the
cost to the taxpayer of “subsidising rather than transforming lives”. This completed the shift in policy
goals that we summarise in Table 1.

10
WP05 Labour’s record on Neighbourhood Renewal in England
Table 1:Summary: Phases of Neighbourhood Renewal Policy in England 1997 - 2010
Neighbourhood Renewal Years (1997-2003/4)
Transition Years (2004/5 to 2007)
Transformation Years
(2007/8 to 2010)
Dominant Analysis of problem
Economic restructuring Public service failure
Public service failure Market failure
Market failure
Dominant Logics for intervention
Amelioration Equity
Amelioration Transformation Equity Efficiency
Transformation Efficiency
Scale of intervention Neighbourhood Neighbourhood Local Authority Functional economic areas (e.g. cities, subregions)
Functional economic areas (e.g. cities, subregions) Local Authority Neighbourhood
In this series of papers, we are concentrating principally on what happened, not on why it happened.
However, it is worth noting that these developments in policy are connected to a series of interwoven
debates about the purpose of neighbourhood renewal type policies that have occupied academics and
policy-makers at least since the late 1960s. Labour’s engagement with academic evidence brought
these debates to the forefront of policy-making again in the late 1990s and 2000s.
In brief, the issues here are as follows:
Whether places do in fact exert any influence on individual outcomes (so called ‘area effects).
See Tunstall & Lupton (2010) and Cheshire (2012) for recent reviews of this evidence.
Whether there is any point in intervening to improve places, or undertaking place-based
interventions that support people, if area effects are small. A paper by Smith (1999) sets out
various alternative rationales for such interventions such as equity and pragmatism in delivery,
but these are less susceptible to economic evaluation (outcomes delivered for inputs made).
Whether, if the aim is to improve individual outcomes, programmes targeted at specific places
are effective or efficient, given that many of the poor live outside poor areas and that those who
benefit from place-based interventions are likely to move out (Tunstall & Lupton 2003)
Whether neighbourhood level interventions can have any impact on spatial inequalities in the
light of wider economic forces. If not, whether the role of the state should be a) to intervene at a
macro level through economic and fiscal policies to redress wider inequalities b) to promote the
efficient operation of housing and labour markets and enable people to move to places of greater
opportunity or c) to ameliorate the conditions of people living in areas of market failure.
Policies
The actual policies enacted reflect the shifts in policy goals although not with a perfect correlation.
Policies also reflect political and financial constraints, and new policies are overlaid on old resulting in a
much muddier picture of actual activity than changes in ideology alone would suggest.
11
WP05 Labour’s record on Neighbourhood Renewal in England
Neighbourhood Renewal Years 1997-2003/4
Policy in ‘the neighbourhood renewal years’ can itself be divided into two periods. Initial activity, while
the PATs were at work and the National Strategy was being formulated, consisted of new programmes
targeted at specific areas: the New Deal for Communities (NDC), Sure Start, Employment Zones, Health
and Education Action Zones. NDC was Labour’s ‘flagship’ area regeneration programme – concentrated
activity in just 39 small areas, averaging just under 10,000 residents each - and including substantial
investments in place and service infrastructure (schools and colleges, community buildings, health
centres and transport), as well as programmes directed at existing residents individually. Although
housing was not originally part of the programme, many local partnerships quickly prioritised this issue.
NDC was distinctive from previous area based funding schemes in its length (10 years), the scale of
central funding (£50m per area), the establishment of community-led partnerships to design and deliver
the programmes, and the existence of a ‘Year Zero’ for partnerships to consult and plan before spending
any money. Critically, the money was also allocated by central government to selected areas, rather
than decided on the basis of a bidding competition. However, Labour did also continue with SRB
funding, with new annual rounds through to 2000/01. Following the end of SRB, some funds previously
earmarked for further rounds were channelled into a ‘single pot’ of regeneration funding run by the
Regional Development Agencies.
The second phase was marked by the introduction of the NSNR in 2001. This aimed to impact across six
main domains: employment, education, health, housing, livability and crime, and to rely not on short term
programmes and grants, but on directing the existing activities and spending of the welfare state (the
‘mainstream’) towards deprived neighbourhoods. Overall there were three main forms of intervention:
central government interventions, local neighbourhood renewal strategies (supported by new central
government funds) and the specific activities and programmes of the new Neighbourhood Renewal Unit.
A crucial underpinning to all of these was investment in development of small area administrative data, a
web-based Neighbourhood Statistics service, and the creation of the new Indices of Multiple Deprivation
(IMD), which aimed to capture individual and place-based elements of disadvantage, enabling the
systematic identification of ‘worst areas’ and the tracking of disparities at the small area level for the first
time.
Potentially the most influential for differences in individual social outcomes were interventions of the first
kind: those by central government departments such as those to improve health outcomes in the poorest
areas, target crime reduction activity or improve education and early years provision. We do not
describe or examine these in detail here since they are the subject of the other papers in this series.
Examples include Excellence in Cities and Building Schools for the Future (education), the Spearhead
Areas (health), Sure Start programme (early years) and the Street Robbery Initiative (crime). Other
initiatives to target individual disadvantage such as the New Deals for the unemployed, changes to
benefits and tax credits, the Supporting People programme and action on rough sleeping would also
impact the poorest neighbourhoods more. The NRU was established to have a cross-government role
working with departments to identify, design and implement area-targeted programmes. In accordance
with Labour’s wider approach of setting outcome targets, ‘floor targets’ were established to hold
government departments to account on these commitments, Neighbourhood Renewal teams were
established in the Government Offices for the Regions to coordinate implementation.
At the local level, new Local Strategic Partnerships in 91 local authorities with very deprived
neighbourhoods were tasked with developing local renewal strategies and implementing these with
support from a new Neighbourhood Renewal Fund (NRF). NRF covered districts containing 90 per cent
of the neighbourhoods in the poorest tenth of the IMD, compared with the NDC which covered just 3 per
12
WP05 Labour’s record on Neighbourhood Renewal in England
cent, showing the intention to transform government’s approach to poorer neighbourhoods in general,
rather than to target only the very worst with short-term initiatives. Each local authority determined its
own strategy, the priorities given to each of NSNR domains, and the extent to which it targeted specific
neighbourhoods or spread money more evenly.
A third kind of intervention was a set of specific programmes run by the new NRU and focusing mainly
on neighbourhood conditions and capacity building, including Neighbourhood Management Pathfinders,
Neighbourhood Wardens, and Community Empowerment Networks. Earlier work in CASE has reported
on these (Power, A. 2007).
In sum, NSNR was much more than a set of additional spending programmes. It was more
fundamentally about changing the way that central and local government approached neighbourhood
disparities. The new floor targets reflected the redistributive intentions of the NSNR’s architects.
According to the NRU they were “an advance in how Government tackles disadvantage” ensuring “a
certain level of standards for all, because for the first time Government departments, local authorities
and other service providers are being judged on their performance in the areas where they are doing
worst, rather than on the national average”. Through the NSNR, a new machinery was established in
central government, the regions and localities for organising and delivering neighbourhood-level
interventions and monitoring their outcomes. There was an expectation that funding for services would
need to be ‘bent’ towards poorer areas for sustained periods, if not indefinitely, partly in order to
customise services to the needs of specific populations (for example, building capacity, providing
specialised services for certain migrant or refugee groups). This was partly in order to meet additional
demands and needs for ongoing public services (for example, more funding for schools in poorer
neighbourhoods), and partly to equalise conditions and opportunities, reflecting the inability of people in
poorer areas to pay for valued goods from private providers (for example, food co-operatives, tool banks,
youth facilities and play areas, IT equipment and training). Thus rather than relying on specific short-
term initiatives, the ‘mainstream’ responses of local authorities and central government departments
would, over time, become more targeted and fitted to poorer areas. This was a crucial change. And
although various critics have argued that it amounted to little in practice (Perrons & Skyers 2003; Fuller
& Geddes 2008; Imrie & Raco 2003), there was also, in all Labour’s early programmes, a strong
emphasis on ‘bottom-up’ regeneration, with community members being empowered to take key
decisions (Marinetto 2003).
That these reforms represented a very substantial change in approach is not in doubt. It is less evident
that there was a well established theory of change, understood across government, about how exactly
the new mechanisms would achieve the desired outcomes. More likely this was a vision, with a
developing programme, rather than a mature policy machine at the outset.
Transition Years 2004/5 to 2007
These policies continued during the transition years of the mid 2000s. The 2004 spending review
reaffirmed the initial commitments to floor targets, and indeed sharpened them with the introduction of
the IMD enabling a clearer focus on the most deprived small areas rather than electoral wards or local
authorities. This period also saw many of the specific grants and programmes, initiated in 2001 and run
by central government, being rolled into new performance management and funding arrangements with
local government - the Local Area Agreements, by which local authorities could have more discretion
over the use of funds, provided that they met specific targets agreed with Westminster. From 2007-08,
NRF operated through LAAs, supported by a centrally-funded data hub for identification and monitoring.
Programme funding for neighbourhood management, wardens and community networks were absorbed
13
WP05 Labour’s record on Neighbourhood Renewal in England
into a new Safer Stronger Communities Fund (SSCF). NRU itself was moved into a broader group
within the department called ‘Tackling Disadvantage’ (which also included the Social Exclusion Unit and
Housing and Homeless Support), and its spending ceased to be separately identified in departmental
reports.
On the one hand, these developments signalled a ‘new localism’ in which responsibilities for identifying
and addressing the problems of the most deprived neighbourhoods moved more firmly to the local level.
However the new emphasis on transforming economic outcomes and on sustainable housing markets
also led to the adoption of new, more strategic, programmes at wider spatial scales, notably the Housing
Market Renewal programme, which established nine sub-regional partnerships (with another three
added later) to tackle low demand and housing abandonment, rebalancing housing markets over a
period of 10-15 years. The HMR projects were principally focused on demolition and housing
refurbishment, although they also included programmes akin to those in the NDCs – local employment
and training initiatives and environmental improvements for example (Audit Commission 2009).
However in sharp contrast to the NDCs, decision making was very much top-down rather than
community-led (Cole & Nevin 2004) – a consequence of the shift to planning at a larger spatial scale.
There were other developments too, following the Sustainable Communities Plan. One was a new focus
on liveability and sustainability, very much in keeping with the NSNR’s environmental emphasis. In 2006,
the ‘Cleaner, Safer, Greener’ strategy was announced to improve the quality of public open spaces.
Another reflected the increasing focus on achieving long term transformation of areas by
deconcentrating poverty. A new Mixed Communities demonstration scheme was initiated (although with
no new money) to show how deprived communities could be transformed by private sector investment
into new mixed-tenure housing. Typically such projects involved rebuilding social housing estates at
higher densities, with the extra homes being built for sale and profits on these sales generating subsidy
for new or refurbished social housing and community facilities (a rather different approach to the poverty
‘dispersal’ approach often taken in the US, where estates were rebuilt at lower density, with new private
housing replacing social housing). The increasing focus on worklessness was reflected in a new Local
Enterprise Growth Initiative (LEGI) to boost enterprise and investment. Urban Regeneration Companies
(URCs) were established to handle key large scale economic and physical regeneration projects.
Transformation Years 2007 - 2010
The years from 2007 saw a further shift in responsibility to local authorities with the establishment of the
unringfenced Area Based Grant which incorporated both SSCF, Working Neighbourhoods Fund (WNF)
(the successor fund to the NRF) and a large number of other area-based grants from the departments of
health, education, transport and others. The NRU was disbanded, as were the floor targets per se –
although some of these remained as key indicators under a new system of Departmental Strategic
Objectives. One reading of these changes is that they reflect the success of the NRU in having
routinised neighbourhood management, multi-agency working and the bending of mainstream funds and
services towards deprived neighbourhoods. They can also be seen as a further move towards localism
– local authorities could now prioritise the issues they deemed most important locally. However they are
also consistent with the subordination of neighbourhood renewal type interventions, with a focus on
conditions and services, to economic regeneration interventions, and with it, the move to bigger spatial
scales for decision-making. The new regeneration framework emphasised the importance of aligning
housing and neighbourhood renewal spend with a strategic approach to economic regeneration.
Regional Development Agencies and the newly formed Homes and Communities Agency (HCA)2 were
2 The creation of the HCA was in itself a move to integrate economic, physical and housing regeneration and to
enable a larger scale approach. The new agency brought together the investment functions of the Housing Corporation, English Partnerships and parts of CLG in a new housing and regeneration agency.
14
WP05 Labour’s record on Neighbourhood Renewal in England
to have a ‘single conversation’ with local authorities and other partners to identify regional priority areas
for investment, and move towards a programme approach to funding in these areas, rather than funding
projects under different housing and regeneration schemes, in different areas. The agenda for the HMR
programme also shifted away from ‘renewal’ towards supporting economic growth (Audit Commission
2009; Ferrari 2007). City-region planning was promoted, and authorities encouraged to develop Multi-
Area Agreements (MAAs) with central government. The neighbourhood was no longer government’s
starting point for considering neighbourhood problems and spatial inequalities or their solutions.
The NRF was replaced by a new Working Neighbourhoods Fund (WNF) more closely targeted towards
65 local authorities selected on indicators of the proportion of people out of work and claiming benefits.
Unlike NRF, WNF was unringfenced and could be used how local authorities saw fit to meet the
worklessness targets agreed in their LAAs. As with NRF, the inherent local autonomy makes it
impossible to identify the totality of activity under the programme. No doubt some authorities would have
continued existing NRF-funded programmes, but given them a more employment-related emphasis as
opposed to starting a wholly new set of activities. An early review suggested some dilution of the focus
on area deprivation. Most but not all LAs were still targeting particular neighbourhoods under WNF, but
in most cases this was not exclusive – funds could be spent to get people into work wherever they lived.
The most common use of the funds was for supply-side initiatives – helping people become more
employable and get a job (University of Cambridge 2010).
Public Spending on Neighbourhood Renewal in England
That the expansion was accompanied by a significant increase in spending over that of the previous
government is not in doubt. However, the design of NSNR, with its three-pronged approach (central
government mainstreaming, NRF and local government mainstreaming, and NRU initiatives) makes the
sum of spending on neighbourhood renewal impossible to establish. Data on spending on identifiable
NRU initiatives and the NRF programmes can be culled from evaluation reports, departmental annual
reports and local authority revenue budget data, although these different sources are inconsistent over
time and with each other. Moreover, these initiatives and programmes are only part of the story, and
not all of the other work of central government departments in redistributing effort towards poorer
neighbourhoods is identifiable. Some of it will have spent on identifiable targeted initiatives, such as the
Deprived Areas Fund in DWP and Excellence in Cities in education; more will have spent through a
range of much smaller grants to local authorities, many of them later rolled up in Area-Based Grant; and
much more through the various funding formulae by which central government allocates funding to local
authorities on the basis of need. Changes in the amounts spent on area-based programmes may reflect
changes in the balance between targeted and mainstream funding rather than real changes in the
amounts different areas are receiving. We therefore approach the question of ‘how much was spent?’ in
two ways - by giving indicative data of the size of different programmes over time, and by assessing the
extent to which central government allocations to local government, overall, became more redistributive
to areas of deprivation. Note that neither of these analyses count spending on the government
machinery that was established : the Neighbourhood Renewal Unit, regional infrastructure, information
and statistics.
Table 2 shows the indicative sizes of Labour’s main programmes3, and the SRB which it inherited from
the Conservatives. SRB was in itself a significant programme. By adding NDC and NRF alone, Labour
more than doubled annual expenditure from 2001/02. Expenditure on these main programmes peaked
around 2007.
3 The smaller NRU programmes including Neighbourhood Wardens and Neighbourhood Management are not
included here because of their small size.
15
WP05 Labour’s record on Neighbourhood Renewal in England
Table 2: Size of Labour's Main Neighbourhood Renewal Programmes
Programme Dates Approximate Annual Cost
(£million)
Number and Scale of Areas included
SRB 1995/6 to 2006/7 520 1028 schemes ranging from local authority ward to combinations of Local Authorities
NDC 1999/00 to 2009/10 200 39 neighbourhoods
NRF/WNF 2001/02 to 2010/11 500 95 local authorities at peak
HMR 2003/4 to 2010/11 275 12 subregional housing markets comprising parts of 28 local authorities
Local Enterprise Growth Initiative (LEGI)
2005/06 to 2010/11 70 30 local authorities
NRF/WNF made up the largest single share of the new funding, about one third at the peak. Housing
Market Renewal had cost about £2.2bn by 2010/11, and NDC, targeted at just 39 small areas of up to
10,000 people each, was the next largest programme at about £2 billion, far eclipsing the smaller NRU
programmes on neighbourhood wardens, neighbourhood management and community capacity building
(worth about £45m a year between them between 2001/2 and 2004/5).
The broad coverage of some of these programmes meant that their value compared with overall local
government spending, and with spending on other major public services, was small. At its peak in
2007/8, NRF made up less than 1% (0.8%) of the total funds distributed to local authorities by central
government to provide services (Aggregate External Finance or AEF), and was worth on average
between £66 and £120 per head in the neighbourhoods affected. 4 By way of contrast, central
government health spending per head per year in England amounted to £1631 in 2007/8.
Seen another way, hovever, it is evident that NRF did provide substantial new capacity for action,
especially in smaller, extensively deprived authorities. If, instead of looking at the overall value of the
fund compared with other funds, we look at the allocations to individual local authorities, a different
picture emerges. Again looking at the peak expenditure year 2007/08, NRF allocations averaged about
£5.7 million for London Boroughs, £9.3m for metropolitan districts, £6.1m for other unitary authorities
and £1.7m for non-unitary district councils. Table 3 shows that this allocation was equivalent to about
7% of local authority spending in that year, excluding spending on education and social services. There
was substantial variation. For example in Croydon, a highly populated London borough with pockets of
extreme deprivation, NRF accounted for only 1% of expenditure, compared with 31% of expenditure in
Easington, a small extensively deprived authority. On this basis, one could expect the withdrawal of
4 Author’s calculation based on the following assumptions: a) that all NRF monies received by local authorities
were allocated to neighbourhood-based spending (in reality, some would have been retained for central services) and b) that these funds were all allocated to neighbourhoods within these local authorities which were in the most deprived 10% (higher figure) or 20% (lower figure) on the IMD. On these assumptions, some authorities could have spent about £300-400 per head if targeting just the 10% worst neighbourhoods, and others as little as £15.
16
WP05 Labour’s record on Neighbourhood Renewal in England
NRF or similar funds to have significant impact on local authority activity in deprived neighbourhoods.
The same is certainly true for NDC funding, which was much more substantial on a per capita basis
(£500 per resident per year for the life of the programme (Foden et al. 2010 p2)).
Table 3: Average Value of NRF allocations to different types of local authorities 2007/08
Number
receiving NRF
Average Allocation
£m
NRF as % of all service spend
NRF as % of all service spend
except education and social
services
London Boroughs 19 5.7 1.2 5.0
Metropolitan Districts 31 9.3 1.7 7.8
Shire Districts 20 1.7 9.6 9.6
Unitary Authorities 16 6.1 1.9 6.9
All 86 3.3 7.1
Sources: Authors' calculations from NRF allocation from Parliamentary Question. Services Expenditure from CIPFA Finance and General Statistics, compiled from LA returns.
Taking a broader view, it is clear that the sum of these larger programmes, other new and targeted
initiatives and a review of the basic ‘formula grant’ to local authorities resulted in a greater share of
central government funding going to poorer areas. Figures 1 and 2 show the total central government
revenue funding (per head of population) going to local authorities in 1998/99, 2001/2, 2005/6 and
2008/9, in real terms(2008/9 prices), adjusted for economy-wide (GDP) inflation. We take the ‘total
central government revenue funding’ to include formula grant, Area-Based Grant and all special and
specific grants to local authorities, with the exception of those that are provided to finance mandatory
payments that local authorities must process on behalf of central government, such as housing benefits
or council tax benefits. Authorities are divided into two groups reflecting the different division of
responsibilities : lower tier district councils; and unitary authorities (including London Boroughs and the
former metropolitan districts) which also have responsibility for education and social services.5 Each
group is divided into quintile groups depending on their rank in the Indices of Multiple Deprivation most
closely corresponding to the year for which the financial data is reported.
The analysis shows, firstly, that more funding in 1998/9 was already distributed to the poorer LAs. On
average, the most deprived fifth of unitary authorities received an extra 68% per head and districts an
extra 62% per head. This gap widened slightly. For the unitary authorities, London Boroughs and
Metropolitan Districts, the change was relatively small: a shift to a ratio of 1.73:1 by the end of the
period. The second quintile group also pulled away slightly. For districts the trend was more
pronounced, with the most deprived fifth of authorities pulling away markedly from the rest, ending with
an extra 83% funding (or £65 per head) over the least deprived authorities, compared with 62% (£40 per
head) at the start. In both cases, although real terms funding continued to increase throughout the
period, the closing of the gap happened almost entirely up until 2005/6 (in our data), with little further
redistribution in the last period.
5 This analysis does not include County Councils because it is district councils which have responsibility for
neighbourhood renewal.
17
WP05 Labour’s record on Neighbourhood Renewal in England
Figure 1: Central Government Revenue Funding per Head: District Councils 1998/9 to 2008/9
Figure 2: Central Government Revenue Funding per Head: Unitary Authorities and London Boroughs 1998/9 to 2008/9
Sources for Fig. 1and 2
LA financial data: DCLG Revenue Accounts;
Deprivation Measure: ONS Indices of Deprivation Local Authority Summaries
Population Estimates for Per Capita Figures: ONS Mid-Year Population Estimates, all persons. For further detail see research note at http://sticerd.lse.ac.uk/case/_new/research/Social_Policy_in_a_Cold_Climate/Programme_Reports_and_event_information.asp
Inputs and Outputs
What did this money buy, in terms of capital projects, extra staff, goods and services (inputs), and what
was produced or delivered as a result (outputs)? This is perhaps a particularly important question in
relation to neighbourhood renewal. Typically in analyses of the welfare state we would regard these
inputs and outputs as the means to better individual outcomes. However, given the early policy goals of
improving services, amenities and conditions in poor areas in the name of social justice, these inputs
(neighbourhood wardens, for example) and outputs (better homes and environments, for example) might
40.0
60.0
80.0
100.0
120.0
140.0
160.0
1998/99 2001/02 2005/06 2008/09
Mean
rev
en
ue/h
ead
(£)
Districts - Revenue by IMD deprivation quintile 1998/99 - 2008/09
1 - mostdeprived
2
3
4
5 - leastdeprived
18
WP05 Labour’s record on Neighbourhood Renewal in England
also be considered ends in themselves. Nevertheless, the same complexity of delivery that makes it
hard to identify spending also inhibits comprehensive counting of inputs and outputs Again we construct
a broad picture using a variety of sources including programme evaluations and data on trends in
neighbourhood housing, environment and services.
Substantial evaluation reports on NRF and NDC describe what was done under these programmes,
although they do not provide any comprehensive count of additional inputs and outputs. In the end,
NDC became largely a programme based around physical transformation of areas, and community
capacity building. Housing and physical environment projects accounted for the largest share of NDC
spending (32 per cent), followed by community (18%) and education (17%). Spending on immediate
economic outcomes (getting people into work) and health made up a relatively small share (12% and
11% respectively), with crime reduction at 10% (Batty et al. 2010). Cowen & Wilton (2008) and Amion
Consulting (2010) concurred that about a third of NRF money went on housing, environment and
community safety initiatives, 18-20% on education (including pupil and teacher support and volunteer
involvement), 15-16% on health (including advice, referrals and access to services), 11-13% on
worklessness (including information and advice, training and work placements) and the rest on cross
cutting activities including community capacity building. Our own review of reports from local authorities
selected to represent a range of high, medium and low NRF recipients reveals some examples: in South
Tyneside a ‘Supporting People into Work’ programme helping 1257 people into jobs from 2004 to 2006
at a cost per job of £1605 and an anti-poverty programme which helped people claim benefit
entitlements and save on debt repayments by establishing a credit union; in Hastings the provision of
Street Wardens and the establishment of a dedicated community policing team; in Kensington and
Chelsea environmental improvements, an alcohol referral service, a community literacy coordinator, a
burglary reduction project, establishing some small business units, and provision of IT equipment for the
voluntary sector (Audit Commission 2007; Kensington and Chelsea Partnership Steering Group 2007;
Clive Jacotine and Associates Limited and Nick Wates Associates 2004; Special Interest Group of
Municipal Authorities 2007).
NRF funds were used to supplement existing mainstream activities and develop new programmes and
ways of working. The evaluation found that NRF money had been largely effective in giving local
authorities and partners increased flexibility to spend and experiment across thematic areas, increasing
the visibility of neighbourhood renewal as a priority for service providers, and encouraging mainstream
agencies to be more attentive to need in the poorest areas and more assiduous in ensuring that the
services they provided were of equivalent quality. According to the evaluation, two-thirds of the outputs
and outcomes from NRF would not have occurred without the programme. By way of example, in
Birmingham, NRF was used to fund police overtime, neighbourhood policing and extra police to
undertake specific operations addressing floor targets. It also funded a pilot free swimming scheme
under the ‘health and well-being’ theme, later taken on by the local authority. One survey of local
authorities found a case of 60% of NRF funds being spent on mainstream activities, although this was
unusually high. Some authorities also used NRF to establish greater participatory budgeting and local
decision-making. For example, Kirklees established a ‘People’s Purse’ - funds ring-fenced for community
and voluntary groups working or based in the Neighbourhood Renewal target areas, and Birmingham
established a system of ‘ward allocations’ to direct funding to smaller projects such as playgrounds, play
schemes and outreach youth work which attracted less mainstream money. Hastings developed local
action plans (LAPs), allowing for the customisation of local services – for example establishing street
cleansing levels.
This evidence suggests a wide range of new and extended services, varying locally, provided as a result
of the NRF elements of NSNR. In addition, other central government programmes delivered more or

19
WP05 Labour’s record on Neighbourhood Renewal in England
improved services and infrastructure. A key initiative was the Decent Homes (DH) programme, through
which the government pledged to bring all social housing to a decent standard by 2010, with more than
half the improvements being made in the most deprived 117 local authorities. DH got off to a slower
start than hoped but over 90% of social housing had been brought up to standard by 2010. There has
been no final report on the proportion in deprived local authorities, but given the correlation between
social housing and poverty, there is no doubt that this programme made a difference to conditions in
many of the poorest neighbourhoods.6 Housing Market Renewal Pathfinders and mixed community
initiatives also refurbished thousands of homes and built new homes, none of which were directly
reported on as part of the floor target regime.
In combination, Decent Homes, HMR and other public/private housing regeneration schemes
contributed to a reduction in vacant homes – one of the key problems affecting liveability and
contributing to a spiral of decline. There is no published analysis of the reduction in vacancies at
neighbourhood level. The Audit Commission’s report on the HMR programme (Audit Commission 2009)
shows only a modest decrease in vacant homes nationally (falling from 3.4% of the stock in 2002 to 3%
in 2008), although with bigger reductions in the northern regions which had higher vacancy rates to start
with. It also shows a big reduction in reported ‘low demand’ for housing, with this problem typically
more than halving in the same period. Our own estimates, at a finer spatial scale, suggest that there
were about just under 6000 output areas in England with a high rate of vacant properties in 20017. Very
few of these were in the South of England, outside London, with the exception of some unpopular private
housing in coastal towns. Very unpopular housing neighbourhoods in London were almost all Inner
London estates. There was a lot of unpopular social housing in the large cities of the North and West.
Overall, vacancy rates had fallen in these areas by 2007/8, and the trend was sharper in very unpopular
estates than in mixed housing, consistent with the effect of demolition programmes.8 Not all of this can
be attributed to policy. Greater demand for social housing in a context of falling stock turnover, and
reversal of population and economic decline in some less advantaged cities would also have played a
part. The result nevertheless, would have been an improvement in living conditions and neighbourhood
viability in many deprived areas.
Other major programmes included the expansion of childcare services and facilities and, towards the
end of the latter part of the period, investment in new school buildings. Between 1999 and 2003, 524
local Sure Start programmes were set up in areas with very high concentrations of children in poverty,
providing (typically) good quality play, learning and childcare, family support, outreach and home visiting
and health care and advice. 107 areas, two thirds of them in the 20% most deprived, had new Early
Excellence Centres, and 45,000 new day care places were provided in 1400 Neighbourhood Nursery
settings in the most deprived 20% of neighbourhoods between 2001 and 2004. In 2004, these initiatives
were brought together in the roll out of Sure Start Children’s Centres, over 3500 in all by the end of
Labour’s term in office. Deprived local authorities were also the main beneficiaries of the Building
Schools for the Future programme, announced in 2004 and intended to be a 15 wave programme
resulting in the entire secondary school building stock being refurbished by 2020. The programme was
targeted by deprivation.
6 The DH programme was initially monitored using two sources: landlord returns and survey data from the English
House Condition Survey (later EHS). EHCS was chosen as the preferred source. The two data sources do not tally, and neither gives an up to date analysis by local authority or neighbourhood deprivation. Assuming 50% (the target) of improvements in deprived authorities, estimates of the reduction in non-decent homes in such authorities would be between quarter and half a million by 2009. 7 Output areas (OAs) have between 40 and 125 households.
8 These data are from landlord returns, and coverage is incomplete, so we can only estimate trends in different
kinds of areas, not actual numbers of vacant homes.
20
WP05 Labour’s record on Neighbourhood Renewal in England
At the same time, other increases in public spending almost certainly brought extra staff into poorer
neighbourhoods, additionally to those funded through NRF. For example, the total (FTE) of police
constables, special constables and police community support officers (PCSOs) rose by 22% between
1997 and 2010, including a 13% increase in the number of constables and the introduction of the PCSO
scheme which had created nearly 17000 additional posts by 2010.9
Given that different programmes affected different but overlapping sets of neighbourhoods at different
times, it is impossible to quantify the overall expansion in services. There is also little evidence on the
efficiency of spend or value for money, except in relation to the NDC programme, where the evaluation
also assessed the programme’s value for money using two different methods, finding that savings could
be estimated at between three and five times programme spend. However, the net effect has been
widely reported in surveys, evaluations and case studies. The NSNR evaluation reports that many
residents considered that the streets were cleaner, that the quality of parks and open spaces had
improved and that environmental conditions were better (Amion Consulting 2010). The NDC evaluation
reported statistically significant evidence of greater improvement than in comparable areas on indicators
of place – such as perceptions of the environment, being a victim of crime, and satisfaction with the
area. 18% of people surveyed said that the area had got much or slightly better in the last two years
(2006-8), compared with 11% in comparator areas, which would have also been receiving additional
investments in this period (Batty et al. 2010). The Sure Start evaluation reported reductions in burglary,
vehicle crime and exclusions from school, and increases in creche and day care provision (Eisenstadt
2011). Other qualitative studies of low income neighbourhoods have also reported residents’ saying that
regeneration programmes had resulted in positive improvements, although they also point to the
diversity of views between and within neighbourhoods, and the different views that could be held by the
same people. Rapid change, perceptions of community decline, and processes of regeneration
themselves could make people feel less confident and satisfied, while they simultaneously welcomed
new services and environmental improvements (Bashir & Flint 2010; A. Power et al. 2011)
Such measurements as there are also indicate improvements in neighbourhood quality. Despite the
early policy emphasis on neighbourhood conditions, floor targets in this area were weakly specified. The
government’s initial targets set in 2000 covered crime, but only at the level of the local authority (Crime
and Disorder Reduction Partnerships and Street Crime Initiative areas). Reporting of these data by the
Home Office was inconsistent (Civitas 2005) and the specific targets to close gaps were dropped in CSR
2007. Neighbourhood conditions themselves had no targets until the 2004 Spending Review, when a
very specific set were introduced in relation to litter, abandoned cares, environmental quality and
‘liveability’ as reported in surveys. These were only reported upon until 2007, when they were replaced
by a general indicator (but no specific target) on ‘satisfaction with the local area’. Between 2004 and
2007 there were absolute improvements in the liveability indicators and the gaps between deprived
areas and others closed (Table 4). On one issue (abandoned cars) there was a huge improvement,
although this cannot be readily ascribed to policy intervention. A contemporaneous rise in the value of
scrap metal provided an incentive for people to trade rather than abandon their unwanted cars, bikes
and vans.
For a longer run overview, and at the neighbourhood level, we look at data on domestic burglary, an
NSNR priority, and reported neighbourhood problems using survey data as well as police recorded crime
data.
9 Police Service Strength England and Wales 31 March 2011, 31st March 2008, Table 3.

21
WP05 Labour’s record on Neighbourhood Renewal in England
Tab
le 4
: A
sse
ss
me
nt
of
Pro
gre
ss
on
Flo
or
Targ
ets
: L
ivea
bilit
y

22
WP05 Labour’s record on Neighbourhood Renewal in England
Figure 3 compares the rate of burglary per 1,000 households in deprived areas to that for all areas. We
look both at recorded burglary (crimes that are notified to the police) and at reported victimhood from the
British Crime Survey (BCS) (which will include crimes that are not notified to the police). Recorded crime
data are at district level, and we identify the districts selected to receive NRF funding, compared with all
districts. Not all neighbourhoods in all these districts will have received any specific neighbourhood
renewal interventions on crime reduction. The BCS data is coded to the IMD 2004, using quintile
groups. We therefore define ‘most deprived neighbourhoods’ as those in the 20% most deprived
neighbourhoods according to IMD 2004. 82% of these were in NRF districts. 3% were in NDC areas.
The black line shows the number of domestic burglaries per ten thousand households in deprived areas,
as recorded by the British Crime Survey. This fell by almost half, from 80 in 2001 to 46 in 2009.
However, rates of acquisitive crime, including burglary, also fell sharply across Britain as a whole in the
2000s. A better measure of the disadvantage imposed by living in poor neighbourhoods is the 'relative
risk' of victimhood: the increase in the probability that a household in a poor neighbourhood will be
subject to burglary, relative to a household living elsewhere. Both the recorded crime statistics and the
BCS findings confirm that in the poorest neighbourhoods, the relative risk of burglary fell. Most of the
closing of the gap occurred in the early 2000s, but was largely maintained later in the decade
Figure 3: Domestic Burglary Rates
Source: BCS from Table 7.01; Recorded crime, calculations from ONS Recorded crime; DCLG household projections
Other neighbourhood problems also appeared to decrease. Figure 4 draws on data from the Survey of
English Housing/English Housing Survey to show the excess in those reporting specific problems in the
neighbourhood - crime, litter and vandalism - as ‘serious’ problems in the most deprived
neighbourhoods, compared with all neighbourhoods. The SEH/EHS data is coded to the 2007 IMD – so
the analysis here looks at the gap between neighbourhoods in the most deprived 10% on that Index,
which was based mainly on data collected in 2005. 88% were also in the worst 10% on the 2004 Index
(based mainly on 2001 data), but some were no 88% of them were contained in NRF districts, and only
1.3
1.35
1.4
1.45
1.5
1.55
1.6
1.65
1.7
1.75
1.8
1.85
0
10
20
30
40
50
60
70
80
90
2001 2002 2003 2004 2005 2006 2007 2008 2009
Rela
tiv
e r
isk i
n d
ep
riv
ed
are
as
Bu
rgla
ry r
ate
/ 1
0,0
00 h
ou
seh
old
s
Relative burglary riskin NRF districts(recorded crime)
Relative burglary riskin 20% most deprivedn'hoods (British CrimeSurvey)
Burglary rate, 20%most deprivedn'hoods (BCS)
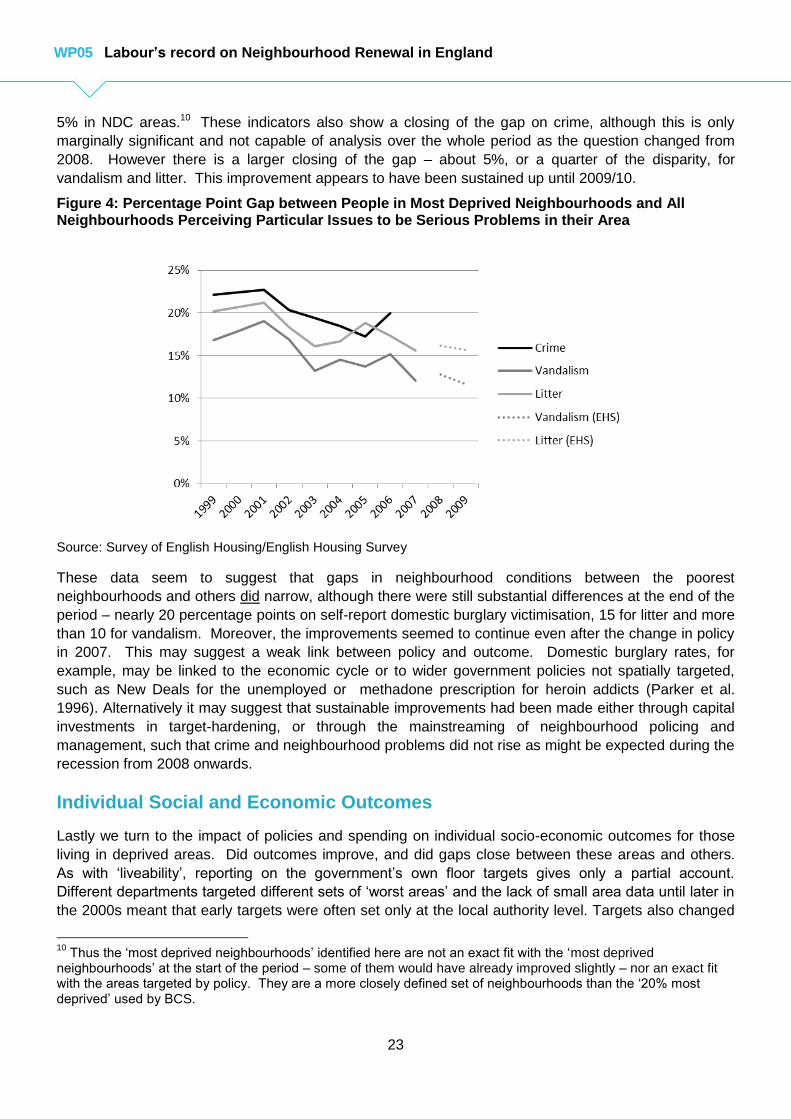
23
WP05 Labour’s record on Neighbourhood Renewal in England
5% in NDC areas.10 These indicators also show a closing of the gap on crime, although this is only
marginally significant and not capable of analysis over the whole period as the question changed from
2008. However there is a larger closing of the gap – about 5%, or a quarter of the disparity, for
vandalism and litter. This improvement appears to have been sustained up until 2009/10.
Figure 4: Percentage Point Gap between People in Most Deprived Neighbourhoods and All Neighbourhoods Perceiving Particular Issues to be Serious Problems in their Area
Source: Survey of English Housing/English Housing Survey
These data seem to suggest that gaps in neighbourhood conditions between the poorest
neighbourhoods and others did narrow, although there were still substantial differences at the end of the
period – nearly 20 percentage points on self-report domestic burglary victimisation, 15 for litter and more
than 10 for vandalism. Moreover, the improvements seemed to continue even after the change in policy
in 2007. This may suggest a weak link between policy and outcome. Domestic burglary rates, for
example, may be linked to the economic cycle or to wider government policies not spatially targeted,
such as New Deals for the unemployed or methadone prescription for heroin addicts (Parker et al.
1996). Alternatively it may suggest that sustainable improvements had been made either through capital
investments in target-hardening, or through the mainstreaming of neighbourhood policing and
management, such that crime and neighbourhood problems did not rise as might be expected during the
recession from 2008 onwards.
Individual Social and Economic Outcomes
Lastly we turn to the impact of policies and spending on individual socio-economic outcomes for those
living in deprived areas. Did outcomes improve, and did gaps close between these areas and others.
As with ‘liveability’, reporting on the government’s own floor targets gives only a partial account.
Different departments targeted different sets of ‘worst areas’ and the lack of small area data until later in
the 2000s meant that early targets were often set only at the local authority level. Targets also changed
10
Thus the ‘most deprived neighbourhoods’ identified here are not an exact fit with the ‘most deprived neighbourhoods’ at the start of the period – some of them would have already improved slightly – nor an exact fit with the areas targeted by policy. They are a more closely defined set of neighbourhoods than the ‘20% most deprived’ used by BCS.
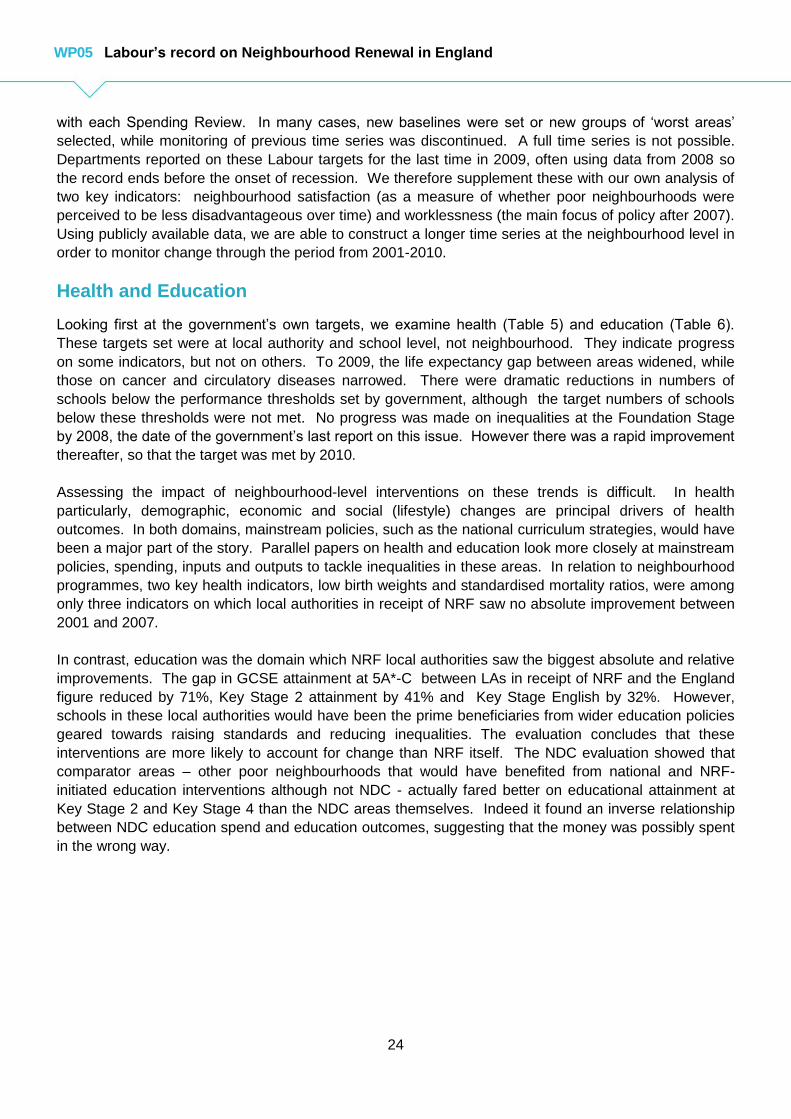
24
WP05 Labour’s record on Neighbourhood Renewal in England
with each Spending Review. In many cases, new baselines were set or new groups of ‘worst areas’
selected, while monitoring of previous time series was discontinued. A full time series is not possible.
Departments reported on these Labour targets for the last time in 2009, often using data from 2008 so
the record ends before the onset of recession. We therefore supplement these with our own analysis of
two key indicators: neighbourhood satisfaction (as a measure of whether poor neighbourhoods were
perceived to be less disadvantageous over time) and worklessness (the main focus of policy after 2007).
Using publicly available data, we are able to construct a longer time series at the neighbourhood level in
order to monitor change through the period from 2001-2010.
Health and Education
Looking first at the government’s own targets, we examine health (Table 5) and education (Table 6).
These targets set were at local authority and school level, not neighbourhood. They indicate progress
on some indicators, but not on others. To 2009, the life expectancy gap between areas widened, while
those on cancer and circulatory diseases narrowed. There were dramatic reductions in numbers of
schools below the performance thresholds set by government, although the target numbers of schools
below these thresholds were not met. No progress was made on inequalities at the Foundation Stage
by 2008, the date of the government’s last report on this issue. However there was a rapid improvement
thereafter, so that the target was met by 2010.
Assessing the impact of neighbourhood-level interventions on these trends is difficult. In health
particularly, demographic, economic and social (lifestyle) changes are principal drivers of health
outcomes. In both domains, mainstream policies, such as the national curriculum strategies, would have
been a major part of the story. Parallel papers on health and education look more closely at mainstream
policies, spending, inputs and outputs to tackle inequalities in these areas. In relation to neighbourhood
programmes, two key health indicators, low birth weights and standardised mortality ratios, were among
only three indicators on which local authorities in receipt of NRF saw no absolute improvement between
2001 and 2007.
In contrast, education was the domain which NRF local authorities saw the biggest absolute and relative
improvements. The gap in GCSE attainment at 5A*-C between LAs in receipt of NRF and the England
figure reduced by 71%, Key Stage 2 attainment by 41% and Key Stage English by 32%. However,
schools in these local authorities would have been the prime beneficiaries from wider education policies
geared towards raising standards and reducing inequalities. The evaluation concludes that these
interventions are more likely to account for change than NRF itself. The NDC evaluation showed that
comparator areas – other poor neighbourhoods that would have benefited from national and NRF-
initiated education interventions although not NDC - actually fared better on educational attainment at
Key Stage 2 and Key Stage 4 than the NDC areas themselves. Indeed it found an inverse relationship
between NDC education spend and education outcomes, suggesting that the money was possibly spent
in the wrong way.

25
WP05 Labour’s record on Neighbourhood Renewal in England
Table 5: Floor Targets, Health
Table 6: Floor Targets, Education
Target for 2010 Comparison Baseline year Baseline position 2010 Assessment
Gap: Males 2.57 %
(1.92 years)
Gap: Males 2.61 % (2.05
years) Increase of 7%
Gap: Females
1.77% (1.41 years)
Gap: Females 2% (1.65
years) Increase of 13%
Reduce the gap in deaths
from circulatory diseases
by 40%
Worst fifth of areas and
the England average1995-1997
Gap: 36.37 deaths
per 100,000
Gap: 20.11 deaths per
100,000, decrease of 45%Target met early
Reduce the gap in life
expectancy by 10%
Worst fifth of areas and
the England average 1995-1997 Gap widened
Reduce the gap in
premature cancer deaths
by 6%
Worst fifth of areas and
the England average1995-1997
Gap: 20.7 deaths
per 100,000
Gap: 18.33 deaths per
100,000, decrease of 12%Target met early
Target Comparison Baseline year Baseline position Progress Assessment
Reduce inequalities in levels
of development at the
Foundation Stage
30% most disadvantaged
areas 2005 Gap 16% 2010: 12% Target met
2006/07:
2,849 schools below
target in English
1,484 below target in
English (-48%)
3,570 schools below
target in Maths
2,026 below target in Maths
(-40%)
In all schools at least 50% of
pupils to achieve Level 5 or 2002/3
589 schools below
target
Target was to be reached
by 2008. By 2007 (last age
Target not met by
2007
71 schools below
2004 target2006/07:
186 schools below
2006 target
17 schools below 2006
target
343 schools below
2008 target
64 schools below 2008
target
Reduce by 40% the
proportion of schools in which
fewer than 65% of pupils
achieve level 4 or above at
Key Stage 2
2002/3 Target met
In all schools, at least 20% of
pupils to achieve 5 GCSEs at
A*-C, rising to 25% by 2006
and 30% in 2008
2003/04
Target not met by
2007. No further
report. Publicly
available data shows
that by 2010, 1
school was below
target
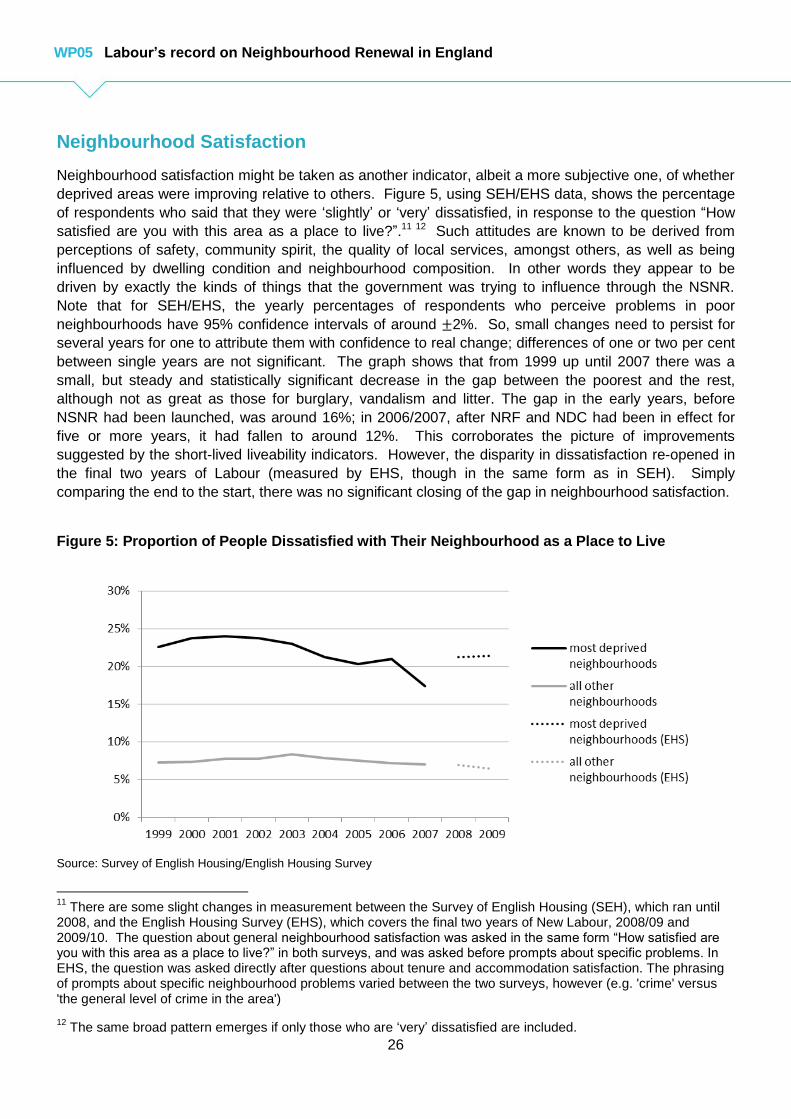
26
WP05 Labour’s record on Neighbourhood Renewal in England
Neighbourhood Satisfaction
Neighbourhood satisfaction might be taken as another indicator, albeit a more subjective one, of whether
deprived areas were improving relative to others. Figure 5, using SEH/EHS data, shows the percentage
of respondents who said that they were ‘slightly’ or ‘very’ dissatisfied, in response to the question “How
satisfied are you with this area as a place to live?”.11 12 Such attitudes are known to be derived from
perceptions of safety, community spirit, the quality of local services, amongst others, as well as being
influenced by dwelling condition and neighbourhood composition. In other words they appear to be
driven by exactly the kinds of things that the government was trying to influence through the NSNR.
Note that for SEH/EHS, the yearly percentages of respondents who perceive problems in poor
neighbourhoods have 95% confidence intervals of around ±2%. So, small changes need to persist for
several years for one to attribute them with confidence to real change; differences of one or two per cent
between single years are not significant. The graph shows that from 1999 up until 2007 there was a
small, but steady and statistically significant decrease in the gap between the poorest and the rest,
although not as great as those for burglary, vandalism and litter. The gap in the early years, before
NSNR had been launched, was around 16%; in 2006/2007, after NRF and NDC had been in effect for
five or more years, it had fallen to around 12%. This corroborates the picture of improvements
suggested by the short-lived liveability indicators. However, the disparity in dissatisfaction re-opened in
the final two years of Labour (measured by EHS, though in the same form as in SEH). Simply
comparing the end to the start, there was no significant closing of the gap in neighbourhood satisfaction.
Figure 5: Proportion of People Dissatisfied with Their Neighbourhood as a Place to Live
Source: Survey of English Housing/English Housing Survey
11
There are some slight changes in measurement between the Survey of English Housing (SEH), which ran until 2008, and the English Housing Survey (EHS), which covers the final two years of New Labour, 2008/09 and 2009/10. The question about general neighbourhood satisfaction was asked in the same form “How satisfied are you with this area as a place to live?” in both surveys, and was asked before prompts about specific problems. In EHS, the question was asked directly after questions about tenure and accommodation satisfaction. The phrasing of prompts about specific neighbourhood problems varied between the two surveys, however (e.g. 'crime' versus 'the general level of crime in the area')
12 The same broad pattern emerges if only those who are ‘very’ dissatisfied are included.
27
WP05 Labour’s record on Neighbourhood Renewal in England
This increase in the size of the gap in the latter part of the period is somewhat surprising, given that
neighbourhood satisfaction tends to be closely linked to crime and neighbourhood conditions (Parkes et
al. 2002; Baum et al. 2010; Permentier et al. 2011), which showed continued improvement. It does not
appear to be driven by changes in the individual economic circumstances of the people living in the
poorest neighbourhoods. Low-income households and renters consistently rate their neighbourhood
less well than others. However, even when we control for changes in poverty and tenure in poor
neighbourhoods over time, the same pattern appears. It may be linked to the change in policy after
2007 - the withdrawal of NRF and the reduced visibility of neighbourhood policies and programmes.
When we look not just at the poorest neighbourhoods but at all neighbourhoods within local authoroity
districts that received any NRF (i.e poorer local authorities), we see the same steady closing of the gap
up until 2007, then from then a slight widening between poorer and better-off authorities. Importantly,
however, looking at this wider set of neighbourhoods, the gap at the end of the Labour period was
significantly smaller than at the start. So gaps between poorer local authorities and others did narrow
over the period as a whole, while gaps between poorest (more local) neighbourhoods and others
narrowed but then widened again.
The two sets of data together suggest that the urban authorities receiving NRF possibly improved during
the whole period as a result of stronger economic performance and wider urban policy interventions –
the ‘urban renaissance’ that was also a feature of early Labour policy – but that the poorest
neighbourhoods within them only improved relative to other neighbourhoods during the period up to
2007 when neighbourhood renewal policy created a focus on conditions and the quality of services.
Certainly the NDC evaluation seems to show that concentrated spending and activity does lead to
increases in satisfaction. In the NDC areas, there was an increase of 13% in those saying they were
very or fairly satisfied with the area compared with 8% in comparator areas. On the other hand, other
factors altogether may drive neighbourhood satisfaction - increasing inequality or economic insecurity or
housing inaffordability, perhaps. Rising expectations can also depress satisfaction (James 2007).
Whatever the reason, it would appear that overall, despite early progress, the gap in satisfaction
between people in the most deprived neighbourhoods and others was not significantly smaller when
Labour left office than when it entered it.
Worklessness
To assess changes in worklessness, we need to employ benefits data. Here we follow the method of
English Indices of Multiple Deprivation in using the total of Job Seekers Allowance and Incapacity
Benefit/Serious Disablement Allowance claimants (and, latterly, also Employment Support Allowance),
divided by the working-age population, as a proxy for ‘work deprivation’13.
Figure 6 shows that for all high-worklessness neighbourhoods in England, shown by the solid line, there
was a steady downward trend in the gap in the work deprivation rate from 2000 to 2009. This partly
reflects the absorption of marginal labour in poor neighbourhoods during a period of economic
expansion. We see that the gap between all poor neighbourhoods and the rest widened again following
13
It should be noted that the use of IB claims as an unemployment indicator is contentious, and is more so at the end of the decade than at the beginning. In the 1990s, large numbers of older male workers, especially in areas of industrial decline, were diverted from unemployment to sickness benefits. Subsequent estimates of ‘real’ local rates of unemployment have made use of IB data (Beatty & Fothergill 2005). However, by the end of the 2000s, much of the cohort diverted onto IB in 1990s had either reached retirement or died, and there is evidence that IB now serves the ‘correct’ client group (Gaffney 2011). Hence, to use IB without adjustment within measures of unemployment is both an empirical mistake and contributes to misrepresentations of how the scheme is used. However there is no simple way to adjust for this, so we follow the IMD’s practice.

28
WP05 Labour’s record on Neighbourhood Renewal in England
the recession; the same marginal and casualised labour in poor neighbourhoods was more likely to be
laid off. However, the gap was still 2.7 percentage points smaller when Labour left office in May 2010
than it was at the start of our series.
This trend meant that the government met its floor target. Set for the first time for small areas in 2004,
this was to reduce the gap in employment for the 903 wards with the worst labour market position in
Spring 2005 by just one per cent by 2008. This was exceeded (a 1.8% percentage point reduction) by
the end of 2007.
Figure 6: Workless Rates for Highest Worklessness Neighbourhoods Compared with Others
Sources: DWP Working-age client group for small areas (DWP/NOMIS). Mid-year population estimates for LSOAs, England and Wales (ONS)
Figure 7 examines these trends more closely, looking at gaps between high worklessness
neighbourhoods in different contexts in England (London, other large English cities and other areas).
Workless rates fell much faster in high-workless neighbourhoods in London and other major cities than
they did in other types of place (smaller cities, towns and coastal and rural areas).
Table 7 draws this picture out further by showing changes in the two components of workless rates: the
number of workless people, and the total number of working-age adults that comprises the bottom half of
the fraction. In London and other large cities in England, there was a slight rise in the count of workless
people, but a very rapid increase in the total working-age population. This reflects the intensity of
housing development and demographic change in deprived inner-city areas. In other deprived areas,
the count of workless people rose more, but the working age population rose less, explaining the smaller
reduction in workless rate.

29
WP05 Labour’s record on Neighbourhood Renewal in England
Figure 7: Gap in neighbourhood workless rate, relative to all English non-poor neighbourhoods
Values are calculated quarterly as a four-quarter moving average. Sources: DWP Working-age client group for small areas (DWP/NOMIS). Mid-year population estimates for LSOAs, (ONS);
Table 7: Changes in Workless Counts and Working Age Population for High Worklessness Neighbourhoods (top 10%) by Country and Area type
Change in workless count, Q2 2000 - Q2 2010
Change in working-age population Q2 2000 - Q2 2010
England, Large Cities +1.7 +14.1
England, London +1.3 +16.7
England, Other Deprived Areas +4.0 +10.9
These data point to the importance of patterns of regional economic divergence, migration, housing
allocation mechanisms, and urban development in explaining neighbourhood worklessness trends.
They provide an important context for looking at policy effects and the limits of policy interventions, and
we will be exploring more of these underlying factors as part of our ongoing work. As Figure 8 shows,
differences between neighbourhoods with different policy interventions do show slightly different trends.
The graph shows gaps between high worklessness neighbourhoods in NDC and NRF programme areas
and other neighbourhoods in England, with NDC comparators and all high worklessness areas shown
for comparison.14
In the NDC areas – by no means all of which were in the highest-worklessness 10% - the excess
worklessness was almost exactly the same as in the comparator (non-intervention) areas at both the
start and the end. This does not tell us whether or not employment interventions in the NDC areas were
effective; since people move, age and die, we are not looking at the same population at each time point.
Possibly NDC interventions enabled people to get into work and move away. It does, however, mean
14
We do not show the WNF districts separately; these were a subset of NRF areas and were pursuing labour-supply interventions during a period of weakening labour demand, as the post-2008 trends for all neighbourhoods shows.

30
WP05 Labour’s record on Neighbourhood Renewal in England
that NDC did not succeed in reducing disparities in workless rates – probably to be expected given the
nature of the programme and its spending profile.
Note: Values are calculated quarterly as a four-quarter moving average. Sources: DWP Working-age client group for small areas (DWP/NOMIS). Mid-year population estimates for LSOAs, England and Wales (ONS)
In contrast, the workless rate in high worklessness neighbourhoods in NRF districts fell faster than for
all high-workless neighbourhoods. This is certainly partly to do with regional divergence and the varying
fates of areas with different geography and economic bases rather than with programme interventions.
Those inside NRF areas were much more likely to be multicultural inner urban districts than deprived
areas outside NRF districts, and thus more likely to have been influenced by urban economic growth and
gentrification processes as well as by their NRF spend. Those with which they were compared
contained a much larger proportion of small-town, rural and coastal poor neighbourhoods. Indeed
econometric modelling conducted as part of the NRF evaluation showed the importance of local
characteristics. Neighbourhoods with few low skilled jobs within 5km, high proportions of low skilled
workers and high proportions of social housing saw lower falls in worklessness than other areas.
Nevertheless the evaluators found a modest effect of NRF spend, controlling for other factors,
suggesting that about 70,000 of the fall in work deprivation in NRF areas would not have occurred
without the Fund. Areas with greater NRF spend were more likely to improve than areas with lower
spend. Based on this, they concluded that reductions in worklessness alone constituted value for
money, with estimated savings of £1.6bn compared with the estimated £312m spent through NRF
directly on worklessness.
Figure 8: Gap in neighbourhood worklessness rate for programme areas, relative to all non-poor England neighbourhoods
31
WP05 Labour’s record on Neighbourhood Renewal in England
Conclusions
In 1997, Labour inherited a situation of widening spatial inequality in social and economic outcomes,
physical environment and standards of public service provision, and severe problems in some ex-
industrial neighbourhoods with almost valueless properties, abandonment, vacant housing,
environmental decline, and high crime and anti-social behaviour. The principal response of the previous
Conservative government during the 1990s had been the Single Regeneration Budget Challenge Fund,
a funding programme to support thematic or neighbourhood-based regeneration programmes designed
by local partnerships.
Labour responded to the problems with a significant increase in spending and activity, increasing during
the 2000s and peaking in 2007/8. It gave political priority to neighbourhood renewal and established
new machinery in central and local government for the long term redistribution of resources and services
towards the poorest areas.
Initial goals were extremely ambitious, and broad, incorporating aims to change the environment,
amenities and services offered, the capacity of residents to influence change, the effect of
neighbourhoods on socio-economic outcomes, and to change these outcomes themselves. At the heart
of the NSNR was an intention to reform the way that government approached poor neighbourhoods and
the distribution of resources and services between places, principally on equity grounds. However, the
full breadth of these goals was not well reflected in the targets and measures adopted. Most of the
statistical targets that were enunciated related to reducing inequalities in individual outcomes, thus
obscuring from the official record the central importance to the policy endeavour of place improvements
per se, efforts to build community capacity and influence, and institutional change. Equally the targets
did not, and perhaps were not able to, discriminate between what could reasonably be expected from
area-based interventions and the effects of aspatial social policies and urban economic change.
Perhaps because of the difficulty in measuring and justifying neighbourhood renewal spend and perhaps
for other reasons including the increasing influence of the Treasury and of spatial economics, policy
goals shifted over time. By 2007, neighbourhood renewal was seen as having primarily an economic
rationale, tackling worklessness and promoting neighbourhood economic sustainability, rather than a
fairness rationale, using state spending to equalise the distribution of public goods and opportunities in
the face of deindustrialisation and social change. Spending was reduced and more narrowly focused on
tackling worklessness. There was a shift of interventions to a larger spatial scale in order to transform
places and individual outcomes.
This change, however, came relatively late. By 2007 evidence was indicating that that NRF and
mainstream central government spending was generating large and noticeable improvements in
neighbourhood environments and services: for example new childcare centres, health centres, and
community buildings, better neighbourhood management and policing and reduced crime, a higher
standard of housing, new school buildings and extended services in schools, Gaps in neighbourhood
satisfaction were closing slightly, overall, and residents of programme areas reported that their areas
were getting better. In relation to the original ameliorative logic (set out at the start of this report), this
should be seen as an end in itself.
Gaps in social and economic outcomes were also closing in domains that could be most directly
influenced by policy, such as school outcomes and deaths from cardio-vascular disease, although less
so, or not at all, in other domains such as life expectancy. Worklessness gaps also closed. However, it

32
WP05 Labour’s record on Neighbourhood Renewal in England
is hard to conclude that particular change this was primarily due to neighbourhood renewal policy. More
likely changes were due to absorption of marginal labour as the economy expanded in the late 1990s
and early 2000s, combined with the relatively good economic performance of Northern cities and the
repopulation and gentrification of inner urban areas, particularly but not exclusively in London. Active
labour market programmes played a contributory role (McKnight 2007). NRF appears to have a modest
effect on worklessness reduction.
On the whole, the extent to which the gaps closed was in line with what was expected when targets were
set. That neighbourhood disparities in individual outcomes remained large at the end of the period is
probably what could be expected given the scale of the funding involved and the influence of wider
economic, social and demographic factors on individual social and economic outcomes. The
programmes represented a significant addition to what had gone before but did not fundamentally alter
the distribution of funding for public services, nor did they initially set out to erase spatial inequalities
altogether.
The poorest areas now face a period of acute economic pressure as the impact of the financial crash
and recession hit home. What happens in these neighbourhoods between 2010 and 2014, under the
Coalition’s new policy regime, will be the focus of our ongoing work in the SPCC research programme.
33
WP05 Labour’s record on Neighbourhood Renewal in England
Bibliography
Amion Consulting, (2010) Evaluation of the National Strategy for Neighbourhood Renewal. Final Report:
Summary. London:CLG
Audit Commission, (2009) Housing Market Renewal: Programme Review, London: Audit Commission.
Audit Commission, (2007) Regeneration and Neighbourhood Renewal: South Tyneside Council, Service
Inspection Report, Audit Commission. Available at:
http://www.southtyneside.info/CHttpHandler.ashx?id=2401&p=0 [Accessed July 31, 2012].
Bashir, N. & Flint, J., (2010) Residents’ Perceptions of Neighbourhood Change and its Impacts,
Sheffield: Centre for Regional Economic and Social Research Sheffield Hallam University.
Available at: http://research.shu.ac.uk/cresr/living-through-
change/documents/RP2_NeighbourhoodChange.pdf [Accessed August 10, 2012].
Batty, E. et al., (2010) The New Deal for Communities Experience: A Final Assessment, Communities
and Local Government.
Baum, S., Arthurson, K. & Rickson, K., (2010) Happy People in Mixed-up Places: The Association
between the Degree and Type of Local Socioeconomic Mix and Expressions of Neighbourhood
Satisfaction. Urban Studies, 47(3), pp.467 –485.
Beatty, C. & Fothergill, S., (2005) The diversion from ‘unemployment’ to ‘sickness’ across British regions
and districts. Regional Studies, 39(7), pp.837–854.
Cabinet Office, (2004) Improving the prospects of people living in areas of multiple deprivation in
England, London: Cabinet Office.
Cheshire, P., (2012) Are Mixed Communities Policies Evidence Based? A review of the research on
Neighbourhood Effects. In M. van Ham et al., eds. Neighbourhood Effects Research: New
Perspectives. Dordrecht, Heidelberg, London, New York: Springer, pp. 250–267.
Civitas, (2005) Home Office Policy Targets: How Useful Are They?, Available at:
http://www.civitas.org.uk/pdf/PSATargetsNov05.pdf [Accessed August 10, 2012].
CLG, (2009) Transforming places; changing lives A framework for regeneration.#
Clive Jacotine and Associates Limited and Nick Wates Associates, (2004) Neighbourhood Renewal
Impact Assessment Hastings, East Sussex: Main Report, Hastings Borough Council. Available
at:
http://www.nickwates.co.uk/reports/r&ppdfs/NRIA%20Main%20report%206%20Sept%2004.pdf
[Accessed July 31, 2012].
Cole, I. & Nevin, B., (2004) The road to renewal: The early development of the Housing Market Renewal
programme in England, York: Joseph Rowntree Foundation.
Cowen, G. & Wilton, M., (2008) Impacts and Outcomes of the Neighbourhood Renewal Fund,
Communities and Local Government. Available at:
http://www.communities.gov.uk/publications/communities/nrfimpactsoutcomes [Accessed April
18, 2012].
Davies, N., (1998) Dark Heart: The Shocking Truth About Hidden Britain, London: Vintage.
DCLG, (2010) Evaluation of the National Strategy for Neighbourhood Renewal - Final report. Available
at: http://www.communities.gov.uk/publications/communities/evaluationnationalstrategy
[Accessed March 5, 2012].
Department for Communities and Local Government, (2011) Regeneration to Enable Growth: What the
government is doing in support of community-led regeneration, London: Department for
Communities and Local Government.
Eisenstadt, Naomi. 2011. Providing A Sure Start : How Government Discovered Early Childhood. Bristol:
The Policy Press.
Ferrari, E., (2007) Housing Market Renewal in an era of new housing supply. People, Place and Policy
Online, 1(3), pp.124–135.
34
WP05 Labour’s record on Neighbourhood Renewal in England
Foden, M., Wells, P. & Wilson, I., (2010) Assessing neighbourhood level regeneration and public
expenditure: Findings from the Bradford New Deal for Communities Area, London: CLG.
Available at:
http://extra.shu.ac.uk/ndc/downloads/reports/Assessing%20Neighbourhood%20level%20regener
ation%20and%20public%20expeniture.pdf.
Fuller, C. & Geddes, M., (2008) Urban governance under neoliberalism: New Labour and the
restructuring of state-space. Antipode, 40(2), pp.252–282.
Gaffney, D., (2011) ‘Dependency’ and disability: how to misread the evidence on social security.
Soundings, (49). Available at:
http://www.newleftproject.org/index.php/site/article_comments/dependency_and_disability_how_t
o_misread_the_evidence_on_social_security.
Glennerster, H. & Hills, J. eds., (1998) The State of Welfare: The Economics of Social Spending 2nd ed.,
Oxford: Oxford University Press.
Griggs, J. et al., (2008) Person- or place-based policies to tackle disadvantage? : Not knowing what
works, York: Joseph Rowntree Foundation.
van Ham, M. et al. eds., (2012) Neighbourhood Effects Research, New Perspectives, Dordrecht,
Heidelber, London, New York: Springer.
HM Treasury (2007). Review of Subnational Economic Development and Regeneration. London: HM
Treasury Houghton, J., (2010) A job half done and half abandoned: New Labour’s National
Strategy for Neighbourhood Renewal 1999-2009. International Journal of Neighbourhood
Renewal, 2(2).
House of Commons Children’s, Schools and Families Committee, (2010) Sure Start Children’s Centres:
Fifth Report of Session 2009/10, London: The Stationery Office.
House of Commons Communities and Local Government Committee,(2011) Regeneration: Sixth Report
of Session 2010-12, London: The Stationery Office.
Imrie, R. & Raco, M., (2003) Community and the changing nature of urban policy. In Urban
Renaissance? New Labour, community and urban policy. Bristol: The Policy Press.
James, O., (2007) Evaluating the Expectations Disconfirmation and Expectations Anchoring Approaches
to Citizen Satisfaction with Local Public Services. Journal of Public Administration Research and
Theory. Available at: http://jpart.oxfordjournals.org/content/early/2006/12/31/jopart.mum034
[Accessed June 17, 2012].
Kensington and Chelsea Partnership Steering Group, (2007) Kensington and Chelsea Neighbuorhood
Renewal Fund: Evaluation Report 2004/05-2005/06,
Lupton, R., (2003) Poverty Street: The Dynamics of Neighbourhood Decline and Renewal, Bristol: The
Policy Press.
Lupton, R. & Tunstall, R., (2008) Neighbourhood regeneration through mixed communities: a ‘social
justice dilemma’? Journal of Education Policy, 23(2), pp.105–117.
Lupton, R. (forthcoming) Neighbourhood Renewal in the UK 1997 to 2012.
McKnight, A. (2007) More Equal Working Lives? An Assessment of New Labour Policies in J.Hills,
T.Sefton and K. Stewart (eds) Towards a More Equal Society? Poverty, inequality and policy
since 1997. Bristol: The Policy Press
Marinetto, M., (2003) Who wants to be an Active Citizen? The politics and practice of community
involvement. Sociology, 37(2), pp.103–120.
Meen, G., Gibb, K., Goody, J., McGrath, T. and Mackinnon, J. (2005) Economic Segregation in Britain:
Causes, Consequences and Policy. York: Joseph Rowntree Foundation.
ODPM, (2004). Annual Report 2004. London, ODPM
Parker, H.J., and Kirby, P. (1996) Methadone maintenance and crime reduction on Merseyside, Home
Office, Police Research Group.
35
WP05 Labour’s record on Neighbourhood Renewal in England
Parkes, A., Kearns, A. & Atkinson, R.,(2002) What Makes People Dissatisfied with their
Neighbourhoods? Urban Studies, 39(13), pp.2413–2438.
Permentier, M., Bolt, G. & van Ham, M., (2011) Determinants of Neighbourhood Satisfaction and
Perception of Neighbourhood Reputation. Urban Studies, 48(5), pp.977–996.
Perrons, D. & Skyers, S., (2003) Empowerment through participation? Conceptual explorations and a
case study. International Journal of Urban and Regional Research, 27(2), pp.265–285.
Power, A. & Mumford, K., (1999) The Slow Death of Great Cities? Urban abandonment or urban
renaissance, York: Joseph Rowntree Foundation.
Power, A., Willmott, H. & Davidson, R., (2011) Family Futures: Children and Poverty in Urban
Neighbourhoods, Bristol: The Policy Press.
Power, S., Rees, G. & Taylor, C., (2005) New Labour and Educational Disadvantage: the limits of area-
based initiatives. London Review of Education, 3(2), pp.101–16.
Power, A (2007). City Survivors: Bringing Up Children in Disadvantaged Neighbourhoods. Bristol: Policy
Press
Rhodes, J., Tyler, P. & Brennan, A., (2007) The Single Regeneration Budget: Final Evaluation,
Cambridge: University of Cambridge Department of Land Economy.
SEU, (2001) A New Commitment to Neighbourhood Renewal: National Strategy Action Plan.
Shaw, K. & Robinson, F., (2009) UK urban regeneration policies in the early twenty-first century. Town
Planning Review, 81(3), pp.123–149.
Smith, G., (1999) Area-based Initiatives: The rationale and options for area targeting, London: Centre for
Analysis of Social Exclusion, LSE.
Special Interest Group of Municipal Authorities, (2007) Rethinking Neighbourhood Renewal: The impact
of dedicated neighbourhood renewal funding to people and places in deprived areas,
Tunstall, R. & Lupton, R., (2003) Is Targeting Deprived Areas an Effective Means to Reach Poor
People? An assessment of one rationale for area-based funding programmes, London: Centre for
Analysis of Social Exclusion, LSE.
Tunstall, R. & Lupton, R., (2010) Mixed Communities: Evidence Review. Available at:
http://www.communities.gov.uk/publications/housing/mixedcommunitiesevidence [Accessed
August 7, 2012].
University of Cambridge, (2010) The Working Neighbourhoods Fund (WNF) Scoping Study, London:
CLG.
Watt, P., (2000). Discourses of Social Exclusion: An Analysis of Bringing Britain Together: A National
Strategy for Neighbourhood Renewal. Housing, Theory and Society, 17(1), pp.1–14.
Weaver, M., (2006). Ministers push for dilution solution. The Guardian. October 26, 2006
MAJOR DATA SOURCES: Department for Communities and Local Government, English Housing Survey, 2008-2009: Household Data [computer file]. Colchester, Essex: UK Data Archive [distributor], November 2010. SN: 6613. Department for Communities and Local Government, English Housing Survey, 2009-2010: Household Data [computer file]. Colchester, Essex: UK Data Archive [distributor], July 2011. SN: 6805. National Centre for Social Research and Department for Communities and Local Government, Survey of English Housing, 1993/94-2007/08 [computer file]. 2nd Edition. Colchester, Essex: UK Data Archive [distributor], June 2010. SN: 6376, http://dx.doi.org/10.5255/UKDA-SN-6376-1.