Embed Size (px)
Citation preview
Wisconsin vegetableinsect pest management research
summer field trials
2010
Russell GrovesAssistant Professor, Entomology
Scott ChapmanAssociate Researcher, Entomology
Sarah SchrammAssociate Research Specialist, Entomology
University of Wisconsin, MadisonDepartment of Entomology
1620 Linden DriveMadison, WI 53706
[email protected](608) 262-3229
www.entomology.wisc.edu/vegento

Principle InvestigatorsRussell GrovesScott Chapman
Additional Foliar PVY Management Principle InvestigatorsAlex Crockford, Langlade County Agricultural Extension AgentRick Hafner and Kevin Bula, Senior Field Inspectors, Wisconsin Seed Potato Certification Program, Antigo, WIRobert Coltman, Director. Wisconsin Seed Certification Program, Antigo, WI
AcknowledgementsThe following organizations and representatives partially supported the research summarized in this report:
Bayer CropScience Steve SpanglerDuPont Crop Protection Mick HolmGowan Company Nick VanderVort, Nathan CrossSyngenta Crop Protection Jeffrey KrummValent USA Gary KirfmannDow AgroSciences Scott Ditmarsen, Jim TurnerNichino America James AdamsAgraQuest Dennis Long
The following University of Wisconsin faculty and staff have contributed time and expertise to these projects:
Paul Bethke, Jed Colquhoun, and Alvin J. Bussan – Department of HorticultureAmy Charkowski and Amanda Gevens – Department of Plant PathologyMatthew Ruark, Birl Lowry and Sam Kung – Department of Soil Science
The following students assisted with implementing and evaluating the projects this summer:Anders Huseth, Ken Frost, Emily Mueller, Natalie Hernandez, David Lowenstein, Ryan Curtin, Abby Kalsheur, Elloise, Brittany, Jesse Leung, Matthew
The following people provided land and resources for this research:
Steve and Andy Dierks, Coloma Farms, Coloma, WIPaul Phillippi, Shiprock Farms, Coloma, WIRichard and Roderick Gumz, Gumz Muck Farms, Endeavor, WIRon Krueger, Felix Zeloski Farms, Eagle River, WIJohn, Jim, and Joe Mattek, J.W. Mattek & Sons, Deerbrook, WI
Special thanks to the staff at the Arlington, Hancock, and Antigo Agricultural Research Stations who helped maintain the projects and assisted in evaluation of research results.
Thank you.
2

Table of Contents
CabbageEvaluation of foliar insecticides for the control of lepidopteran insect pests in cabbage… 1-2
Foliar. Imported cabbageworm, cabbage looper, diamondback moth
OnionEvaluation of foliar insecticides for the control of onion thrips in dry-bulb onion……….. 3-4
Foliar. Onion thrips
PepperFoliar insecticide treatments for the control of European corn borer, in Wisconsin processing pepper production……………………………………………………………... 5-6
Foliar. European corn borer
PotatoesDrip irrigation insecticide treatments to control Colorado potato beetle in Wisconsin potatoes…………………………………………………………………………………... 7-8
Drip Irrigation. Colorado potato beetle, potato leafhopper, aphids
Registered and experimental foliar insecticides to control Colorado potato beetle and potato leafhopper in potato………………………………………………………………... 9-10
Foliar. Colorado potato beetle, potato leafhopper, aphids
Foliar insecticide treatments for the control of potato leafhopper in Wisconsin potato production………………………………………………………………………………… 11-12
Foliar. Potato leafhopper
Foliar insecticide treatments to limit the spread of Potato virus Y in Wisconsin seed potato production………………………………………………………………………….. 13-14
Foliar. PVY
Muck potato research……………………………………………………………………... 15-16Systemic. Colorado potato beetle, potato leafhopper, aphids
Evaluation of systemic insecticides for the control of the Colorado potato beetle, potato leafhopper, and aphids in potato…………………………………………………………... 17-18
Systemic. Colorado potato beetle, potato leafhopper, aphids
Large plot demonstration experiments of Colorado potato beetle in Wisconsin potatoes... 19-22Full season treatment. Colorado potato beetle, potato leafhopper, aphids
SnapbeanFoliar insecticide treatments for the control of European corn borer in Wisconsin snap bean production…………………………………………………………………………… 23-24
Foliar. Eurpoean corn borer
Systemic insecticide treatments for the control of European corn borer in Wisconsin snap bean production……………………………………………………………………… 25-26
Systemic. European corn borer
TomatoFoliar insecticide treatments for the control of tomato fruitworm in Wisconsin fresh market tomato production………………………………………………………………… 27-29
Foliar. Tomato fruitworm
4
Evaluation of foliar insecticides for the control of Lepidopteran insect pests in cabbage
Purpose: The objective of this experiment was to assess the efficacy of foliar insecticides applied at-threshold to control lepidopteran insect pests in cabbage.
Materials and MethodsThis experiment was conducted at the Arlington Agricultural Experiment Station in Arlington, WI in 2010. Cabbage, Brassica oleracea cv. ‘Hinova’, transplants were planted 5 Jun. Plants were spaced 18 inches apart within rows. Rows were 36 inches apart. The two-row plots were 6 ft wide by 20 ft long, for a total of 0.003 acres, and were separated by 2 guard rows between plots. Plots were arranged into four replications with 5 ft alleys between replications. All plots were maintained according to standard commercial practices.
Four replicates of 11 experimental foliar treatments and 1 untreated control were arranged in a randomized complete block design. All foliar treatments were applied 12 July. Treatments were applied with a CO2 backpack sprayer with a 6 foot boom operating at 30 psi delivering 20.1 gpa through four flat-fan nozzles (Tee Jet XR8003VS) spaced 18” apart while traveling at 4 ft / sec.
Immature life stages of imported cabbage worm (ICW), Artogeia rapae, cabbage looper (CL), Trichoplusia ni, and diamondback moth (DB), Plutella xylostella, were assessed by counting the number of larvae per plant on 10 randomly selected plants in each plot. Larval counts occurred four times throughout the summer, on Jul 16 (4 DAT), 20 (8 DAT), 27 (15 DAT), and Aug 4 (35 DAT). Count data were log10 transformed prior to analysis. Means were separated using ANOVA with a Least Squared Difference (LSD) option (P=0.05).
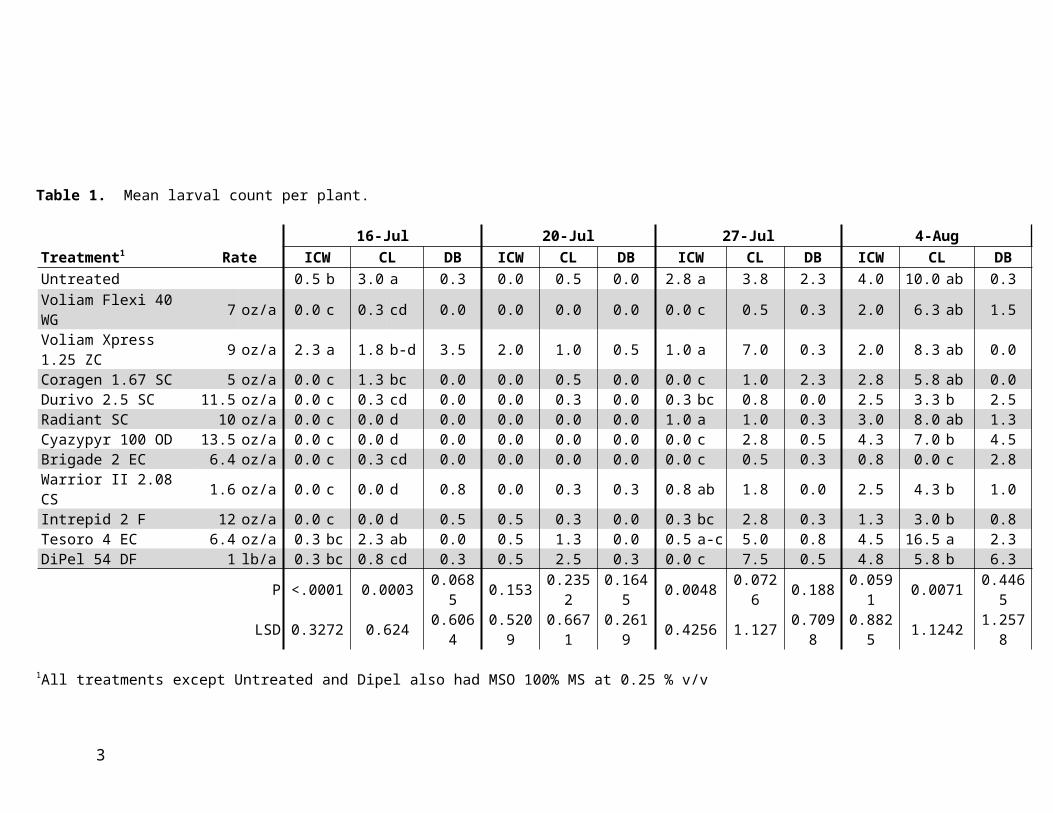
Results and DiscussionResults are reported in Table 1. ICW and DB pressure was moderately low in this experiment with few observed differences in efficacy compared to the untreated check. Results showed significant treatment main effect differences in the populations of CL on cabbage heads. Nearly all treatments provided sufficient control of CL and ICW through 7 DAT and 14 DAT. No signs of phytotoxicity were observed.
1
Table 1. Mean larval count per plant.
16-Jul 20-Jul 27-Jul 4-AugTreatment1 Rate ICW CL DB ICW CL DB ICW CL DB ICW CL DBUntreated 0.5 b 3.0 a 0.3 0.0 0.5 0.0 2.8 a 3.8 2.3 4.0 10.0 ab 0.3Voliam Flexi 40 WG 7 oz/a 0.0 c 0.3 cd 0.0 0.0 0.0 0.0 0.0 c 0.5 0.3 2.0 6.3 ab 1.5Voliam Xpress 1.25 ZC 9 oz/a 2.3 a 1.8 b-d 3.5 2.0 1.0 0.5 1.0 a 7.0 0.3 2.0 8.3 ab 0.0Coragen 1.67 SC 5 oz/a 0.0 c 1.3 bc 0.0 0.0 0.5 0.0 0.0 c 1.0 2.3 2.8 5.8 ab 0.0Durivo 2.5 SC 11.5 oz/a 0.0 c 0.3 cd 0.0 0.0 0.3 0.0 0.3 bc 0.8 0.0 2.5 3.3 b 2.5Radiant SC 10 oz/a 0.0 c 0.0 d 0.0 0.0 0.0 0.0 1.0 a 1.0 0.3 3.0 8.0 ab 1.3Cyazypyr 100 OD 13.5 oz/a 0.0 c 0.0 d 0.0 0.0 0.0 0.0 0.0 c 2.8 0.5 4.3 7.0 b 4.5Brigade 2 EC 6.4 oz/a 0.0 c 0.3 cd 0.0 0.0 0.0 0.0 0.0 c 0.5 0.3 0.8 0.0 c 2.8Warrior II 2.08 CS 1.6 oz/a 0.0 c 0.0 d 0.8 0.0 0.3 0.3 0.8 ab 1.8 0.0 2.5 4.3 b 1.0Intrepid 2 F 12 oz/a 0.0 c 0.0 d 0.5 0.5 0.3 0.0 0.3 bc 2.8 0.3 1.3 3.0 b 0.8Tesoro 4 EC 6.4 oz/a 0.3 bc 2.3 ab 0.0 0.5 1.3 0.0 0.5 a-c 5.0 0.8 4.5 16.5 a 2.3DiPel 54 DF 1 lb/a 0.3 bc 0.8 cd 0.3 0.5 2.5 0.3 0.0 c 7.5 0.5 4.8 5.8 b 6.3
P <.0001 0.0003 0.0685 0.153 0.2352 0.1645 0.0048 0.0726 0.188 0.0591 0.0071 0.4465LSD 0.3272 0.624 0.6064 0.5209 0.6671 0.2619 0.4256 1.127 0.7098 0.8825 1.1242 1.2578
1All treatments except Untreated and Dipel also had MSO 100% MS at 0.25 % v/v
2
Evaluation of foliar insecticides for the control of onion thrips in dry-bulb onion
Purpose: The objective of this experiment was to assess the efficacy of foliar insecticides applied at-threshold to control immature stages of onion thrips (OT), Thrips tabaci, in dry-bulb onion.
Materials and MethodsThis experiment was conducted in a cooperating producer’s field located 5.1 miles (8.1 km) west of Coloma, Wisconsin on a muck soil in 2010. Onion, Allium cepa ‘Corona’, was direct seeded on 20 May. Plants were spaced 2.2 inches apart within rows. Rows were 9.8 inches apart. The six-row plots were 56 inches wide by 25 ft long on raised formed beds, for a total of 0.003 acres, and were separated by planted guard beds of the same dimensions between plots. All plots were maintained by the grower according to standard commercial practices.
Four replicates of 17 experimental treatments and 1 untreated control were arranged in a randomized complete block design. Applications were initiated when mean immature thrips populations had exceeded established thresholds of 3 immature thrips / leaf. All foliar treatments were applied on 22 and 29 Jun. Treatments were applied with a CO2 backpack sprayer with a 6 foot boom operating at 30 psi delivering 24.9 gpa through four flat-fan nozzles (XR8003VS) spaced 18” apart while traveling at 3.5 ft / sec.
Immature lifestages of onion thrips (OT) were assessed by counting the number of larvae per plant on 10 randomly selected plants in the central 2 rows of each plot. Larval counts occurred four times throughout the summer, on June 25 (3 DAT) and 28 (6 DAT) after the first application and again on July 12 (13 DAT) and 27 (29 DAT) after the second application. Count data were log10 transformed prior to analysis. Means were separated using ANOVA with a Fisher’s Protected Least Squared Difference (LSD) option (P=0.05). Data are presented in Table 1.
Results and DiscussionPopulations of OT were considered average to above-average as thresholds were initially exceeded in the experimental field by mid to late June. Increased levels of knockdown were achieved with higher rates of Radiant, Movento, Agri-Mek, and tolfenpyrad compared to the untreated check. Few registered or experimental compounds demonstrated longer term, residual levels of control lasting greater than 21 days post-treatment. No overt signs or symptoms of phytotoxicity were observed.
3
Table 1. Mean count of immature OT per plant.
Treatment Rate 25-Jun 28-Jun 12-Jul 27-JulUntreated 4.6 a-e 5.3 ab 26.3 ab 12.2 c1Warrior II 2.08 SC 1.92 fl oz/a 6.7 a-c 7.1 ab 29.4 a 21.4 bc2HGW 86 10 OD 13.5 fl oz/a 4.6 a-c 4.2 b-e 18.5 b 27.8 ab2HGW 86 10 OD 20.5 fl oz/a 3.2 c-f 3.7 b-e 14.5 c 15.0 bc1Lannate 2.4 L 48 fl oz/a 3.3 a-f 4.8 b-e 23.7 ab 7.2 d1Radiant 1 SC 6 fl oz/a 3.0 d-f 6.9 ab 11.1 cd 14.6 c1Radiant 1 SC 8 fl oz/a 2.3 ef 2.0 c-e 8.0 e 25.7 a1Movento 240 SC 4 fl oz/a 5.9 a 5.0 b-e 2.3 g 11.4 c1Movento 240 SC 5 fl oz/a 3.7 a-d 3.7 b-d 3.7 f 14.9 c3Agri-Mek 0.15 EC 10 fl oz/a 2.6 f 3.4 b-e 9.9 de 15.3 c3Agri-Mek 0.15 EC 12 fl oz/a 3.2 d-f 8.0 a 14.2 c 15.3 c1Tolfenpyrad 150 SC 17 fl oz/a 3.0 ef 2.1 de 11.6 cd 26.0 ab1Tolfenpyrad 150 SC 21 fl oz/a 2.6 d-f 4.2 ab 15.2 c 29.1 a1Radiant 1 SC (1st appl) 8 fl oz/a
3.0 d-f 1.7 e 10.5 cd 44.6 a1Tolfenpyrad 150 SC (2nd appl) 17 fl oz/a1Carzol 92 SP (1st appl) 0.5 lb ai/a
3.4 b-f 4.6 ab 14.4 c 27.2 a1Tolfenpyrad 150 SC (2nd appl) 17 fl oz/a3Agri-Mek 0.7 SC 2 fl oz/a 3.6 a-f 3.8 b-e 11.1 cd 16.4 c3Agri-Mek 0.7 SC 2.58 fl oz/a 5.4 ab 3.7 a-c 16.8 c 19.9 a2Agri-Mek 0.7 SC 2.58 fl oz/a 2.1 ef 2.4 c-e 9.5 de 15.5 c
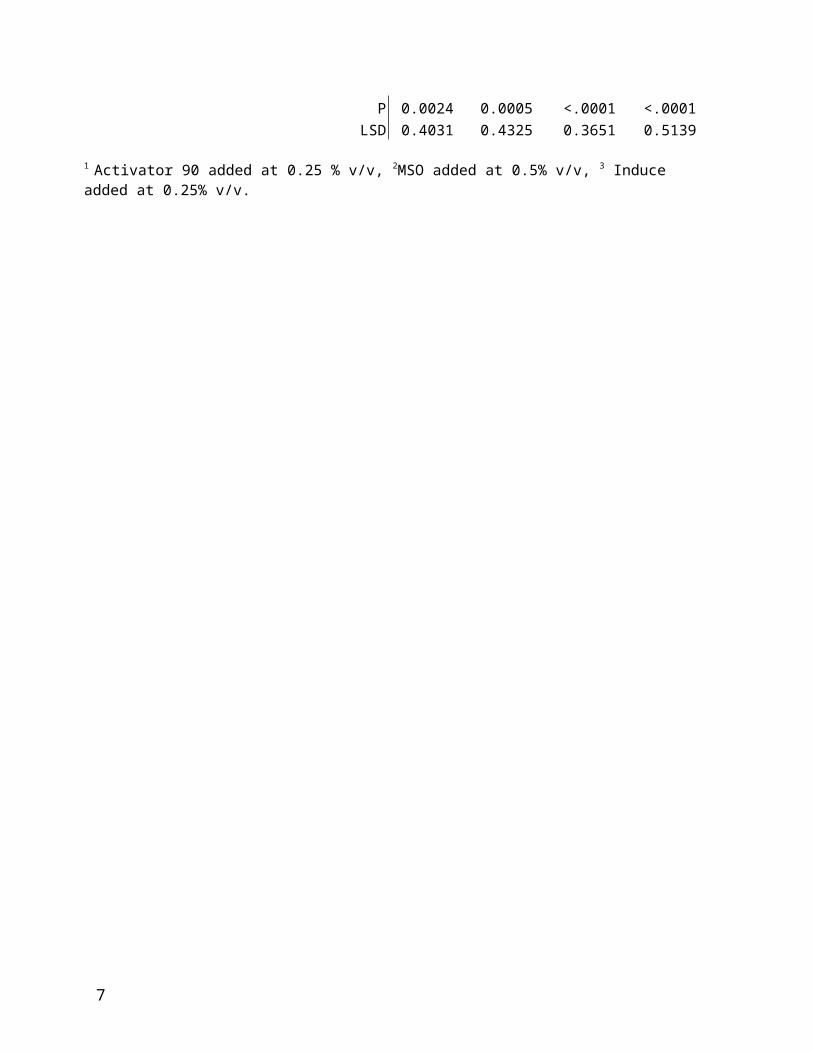
P 0.0024 0.0005 <.0001 <.0001LSD 0.4031 0.4325 0.3651 0.5139
1 Activator 90 added at 0.25 % v/v, 2MSO added at 0.5% v/v, 3 Induce added at 0.25% v/v.
4
Foliar insecticide treatments for the control of European corn borer, in Wisconsin processing pepper production
Purpose: Evaluate various foliar-applied, registered insecticides targeting populations of ECB larvae in processing pepper, with the goal of developing efficacy data in support of future registration of novel insecticides.
Materials and MethodsThis experiment was conducted at Arlington Agricultural Experiment Station in Arlington, WI in 2010. Pepper, Capsicum annuum cv. ‘Wonderful’, transplants were planted 25 May. Plants were spaced 24 inches apart within rows. Rows were 6 ft apart. Plots were single rows, 6 ft wide by 30 ft long, for a total of 0.004 acres. Replicates were separated by a 12 ft border of bare ground. The trial was established over black plastic and sprinkler irrigated over the growing season. Experimental plots were managed according to commercial herbicide and fungicide recommendations for weed control and control of the pepper blight resulting from Phytophthora capsici.
Each plot was infested with European corn borer (ECB), Ostrinia nubilalis, egg masses on 29 Jul. In each plot, five successive plants were infested, each with five egg masses for a total of 25 egg masses applied in each plot. Egg masses were attached to plants mid-canopy and onto stems with green fruit. Each egg mass contained approximately 20-30 eggs / mass.
Four replicates of 5 experimental foliar treatments and 1 untreated control were arranged in a randomized complete block design. The foliar treatments were applied 10 Aug when plant growth stage was at flowering and mature fruit set. Treatments were applied by a CO2 pressurized backpack sprayer with a 6’ boom operating at 42 psi delivering 29.4 gpa through 4 flat-fan nozzles (Tee Jet 8002VS-XR) spaced 18” apart @ 3.5 ft / sec. Subsequent sprays followed on weekly intervals following initial application.
Populations of ECB and associated damage estimates were surveyed 18 August following the third application of insecticide by counting (1) total number of fruit, (2) the weight in pounds of fruit (3) number of damaged fruit, and (4) the number of viable larvae observed in fruit. See Table 1 for a summary of key field activity dates. Count data were log10 transformed prior to analysis. Proportion data were arcsin transformed prior to analysis. Means were separated using ANOVA with a Least Squared Difference (LSD) option (P=0.05).
5
Table 1. Summary of key field activity dates.
Action Planting Infestation Insecticide app. EvaluationDate 25 May 29 Jul 10 Aug 18 Aug
Days fromlast action 64 12 8
Results and DiscussionNatural populations of ECB at the experimental site are annually variable and require that experimental plots be artificially infested with test insects. Established infestation levels in the experimental plots and particularly the untreated control were considered to be above average for what is typically observed during annual trials (Table 2).
Table 2. Mean yield and damage estimates per plant in pepper.
Treatment RateTotal No.
Fruit Weight (lb)No. Damage
FruitProportion
Damaged FruitTotal
LarvaeUntreated - 2.4 0.7 1.1 0.5 1.5Rimon 0.83 EC 12 fl oz/a 2.2 0.5 0.7 0.3 1.4Rimon 0.83 EC 12 fl oz/a 2.8 0.9 1.0 0.4 1.4Warrior 1 CS 3.84 fl oz/aRimon 0.83 EC 9 fl oz/a 1.5 0.5 0.8 0.4 0.8Warrior 1 CS 2.56 fl oz/a 1.5 0.3 0.4 0.3 0.5Rimon 0.83 EC 9 fl oz/aRimon 0.83 EC 12 fl oz/a 1.7 0.6 0.6 0.3 0.8Provado 1.6 F 3.8 fl oz/a
P 0.2204 0.1207 0.3157 0.5661 0.6278LSD 1.6755 1.3344 1.5683 0.3474 2.2305
6
Drip irrigation insecticide treatments to control Colorado potato beetle in Wisconsin potatoes
Purpose: The purpose of this experiment was to evaluate drip irrigation-applied insecticides targeting second generation Colorado potato beetle (CPB), Leptinotarsa decemlineata, adults and larvae in potato. The goal of the research is to develop efficacy data in support of product recommendations.
Materials and MethodsThis experiment was conducted at Hancock Agricultural Experiment Station (HAES) in Hancock, WI in 2010. Potato, Solanum tuberosum cv. ‘Russet Norkotah’, seed pieces were planted on 3 May. Seed pieces were spaced 12 inches apart within rows. Rows were 3 ft apart. The two-row plots were 6 ft wide by 30 ft long, for a total of 0.004 acres. Two guard rows separated plots. The trial was established under silver reflective plastic and drip-irrigated according to ET demands of the crop. The drip irrigation tape was 0.38 thin-walled Netafim with integral pressure-compensating, anti-siphon in-line drippers operating at 10 psi. The plots were managed according to commercial pest management (herbicide and fungicide) practices as well as fertility recommendations prescribed by HAES.
Four replicates of 4 experimental treatments and 1 untreated control were arranged in a randomized complete block design. Insecticides were injected 28 June when second generation CPB adult populations had emerged from pupation and egg deposition was approximately 80-95% complete, and 12 July when the majority of larval populations were predominately in the first and second instar larval stage. Treatments were applied by a CO2 pressurized bottle operating at 11 psi delivering 29.4 gpa delivering the contents in a total water volume of 2L.
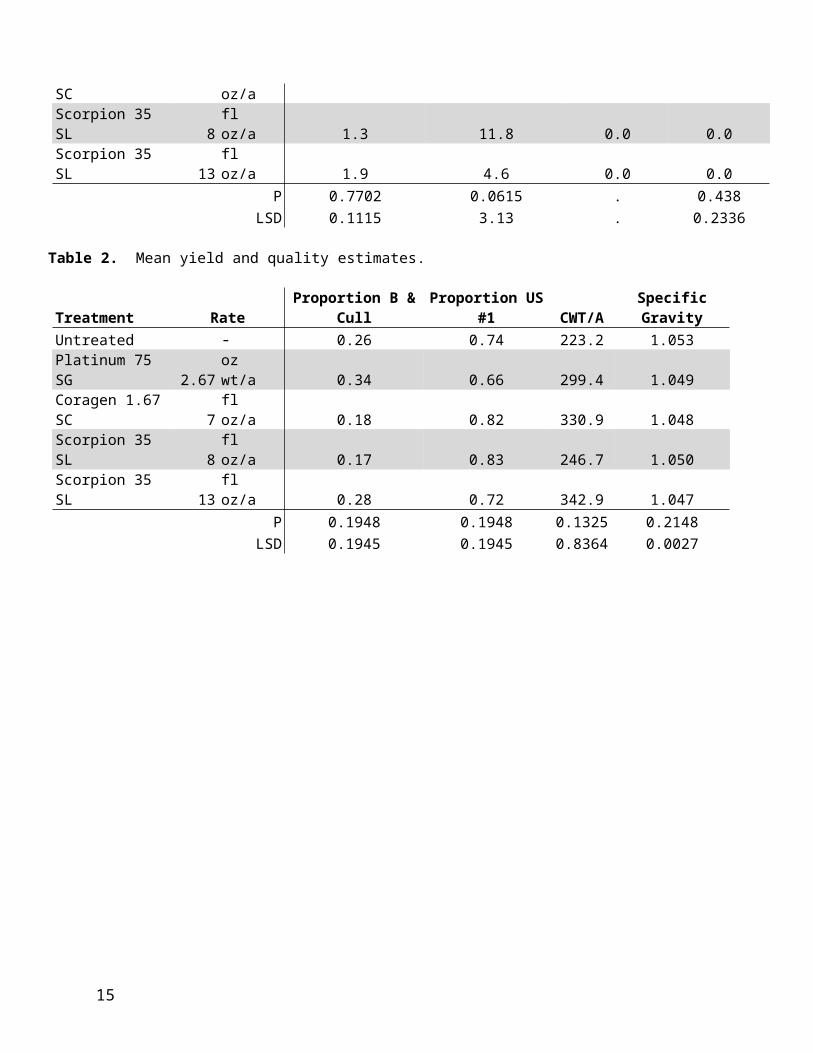
Populations of CPB, potato leafhopper (PLH), Empoasca fabae, and colonizing aphid species were counted at intervals of 3 and 7 days post first application (1 and 8 July) and 21, 28, and 35 days post second application (2, 9, 16 Jul). Additionally, numbers of CPB in the following life stages were also recorded: adult, egg, small larvae, and large larvae. Counts per plant were taken from 10 randomly selected plants from each plot. Percent defoliation was also recorded as a measurement of adult and larval CPB feeding (Table 1). Yield and quality data were recorded after harvest (Table 2). Count data were log10 transformed prior to analysis. Proportion data were arcsine transformed prior to analysis. Means were separated using ANOVA with a Least Squared Difference (LSD) option (P=0.05).
Results and DiscussionInjection treatments were applied on 28 June and 12 July. The second application had to be delayed from 7 to 10 days resulting from significant precipitation. CPB pressure at HAES was considered to be above average resulting from two successive years of moderate winter temperatures.
7

Table 1. Mean estimates of insect populations and damage.
Treatment RateCPB Adults(Jul 1, 8, 15)
CPB Adults(Aug 2, 9, 16)
CPB Egg Masses(Jul 1, 8, 15)
CPB Egg Masses(Aug 2, 9, 16)
Untreated - 0.6 11.3 ab 0.4 0.4Platinum 75 SG 2.67 oz wt/a 0.5 13.7 ab 0.0 0.0Coragen 1.67 SC 7 fl oz/a 0.4 7.3 b 0.1 0.2Scorpion 35 SL 8 fl oz/a 1.3 20.6 a 0.0 0.3Scorpion 35 SL 13 fl oz/a 0.3 9.8 b 0.1 0.1
P 0.0983 0.0397 0.633 0.4202LSD 0.4494 1.0566 0.2157 0.2518
Table 1 continued
Treatment RateCPB Small Larvae
(Jul 1, 8, 15)CPB Small Larvae
(Aug 2, 9, 16)CPB Large Larvae
(Jul 1, 8, 15)CPB Large Larvae
(Aug 2, 9, 16)Untreated - 1.8 b 8.2 b 0.4 b 31.5 aPlatinum 75 SG 2.67 oz wt/a 0.7 b 8.9 b 0.8 b 9.9 bCoragen 1.67 SC 7 fl oz/a 8.3 b 18.0 a 7.2 a 17.0 abScorpion 35 SL 8 fl oz/a 0.0 b 10.2 ab 0.1 b 25.0 aScorpion 35 SL 13 fl oz/a 12.3 a 15.4 a 6.2 a 8.8 b
P 0.0279 0.0464 0.0356 0.0113LSD 0.9261 1.2535 0.7798 1.3118
Table 1 continued
Treatment RatePercent Defoliation
(Jul 1, 8, 15)Percent Defoliation
(Aug 2, 9, 16)PLH
(Aug 2, 9, 16)Aphids
(Aug 2, 9, 16)Untreated - 1.9 24.6 0.0 0.0Platinum 75 SG 2.67 oz wt/a 0.0 5.0 0.0 0.0Coragen 1.67 SC 7 fl oz/a 1.3 9.2 0.0 0.3Scorpion 35 SL 8 fl oz/a 1.3 11.8 0.0 0.0Scorpion 35 SL 13 fl oz/a 1.9 4.6 0.0 0.0
P 0.7702 0.0615 . 0.438LSD 0.1115 3.13 . 0.2336
Table 2. Mean yield and quality estimates.
Treatment Rate Proportion B & Cull Proportion US #1 CWT/A Specific GravityUntreated - 0.26 0.74 223.2 1.053Platinum 75 SG 2.67 oz wt/a 0.34 0.66 299.4 1.049Coragen 1.67 SC 7 fl oz/a 0.18 0.82 330.9 1.048Scorpion 35 SL 8 fl oz/a 0.17 0.83 246.7 1.050Scorpion 35 SL 13 fl oz/a 0.28 0.72 342.9 1.047
P 0.1948 0.1948 0.1325 0.2148LSD 0.1945 0.1945 0.8364 0.0027
8
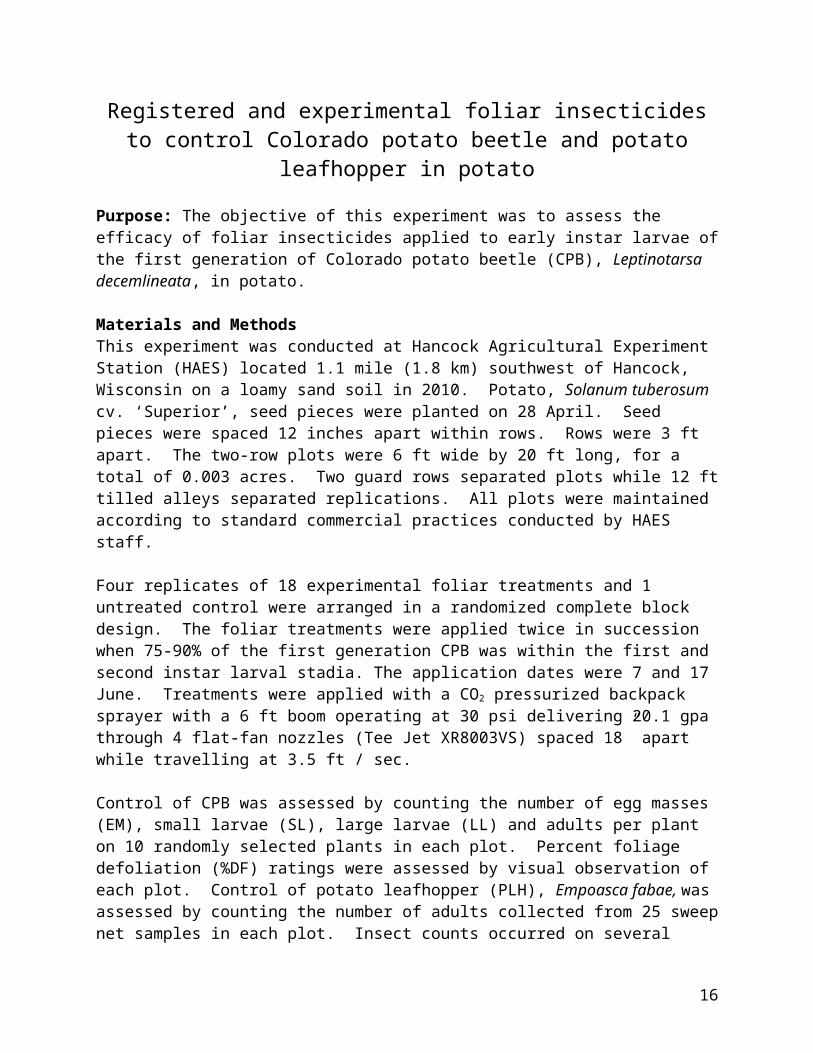
Registered and experimental foliar insecticides to control Colorado potato beetle and potato leafhopper in potato
Purpose: The objective of this experiment was to assess the efficacy of foliar insecticides applied to early instar larvae of the first generation of Colorado potato beetle (CPB), Leptinotarsa decemlineata, in potato.
Materials and MethodsThis experiment was conducted at Hancock Agricultural Experiment Station (HAES) located 1.1 mile (1.8 km) southwest of Hancock, Wisconsin on a loamy sand soil in 2010. Potato, Solanum tuberosum cv. ‘Superior’, seed pieces were planted on 28 April. Seed pieces were spaced 12 inches apart within rows. Rows were 3 ft apart. The two-row plots were 6 ft wide by 20 ft long, for a total of 0.003 acres. Two guard rows separated plots while 12 ft tilled alleys separated replications. All plots were maintained according to standard commercial practices conducted by HAES staff.
Four replicates of 18 experimental foliar treatments and 1 untreated control were arranged in a randomized complete block design. The foliar treatments were applied twice in succession when 75-90% of the first generation CPB was within the first and second instar larval stadia. The application dates were 7 and 17 June. Treatments were applied with a CO2 pressurized backpack sprayer with a 6 ft boom operating at 30 psi delivering 20.1 gpa through 4 flat-fan nozzles (Tee Jet XR8003VS) spaced 18” apart while travelling at 3.5 ft / sec.
Control of CPB was assessed by counting the number of egg masses (EM), small larvae (SL), large larvae (LL) and adults per plant on 10 randomly selected plants in each plot. Percent foliage defoliation (%DF) ratings were assessed by visual observation of each plot. Control of potato leafhopper (PLH), Empoasca fabae, was assessed by counting the number of adults collected from 25 sweep net samples in each plot. Insect counts occurred on several dates throughout the summer and reported means were averaged across those dates (Table 1). Larval counts occurred five times during June and July. The first set of counts occurred on June 10 (3 DAT) and 14 (7 DAT) after the first application. The second set of counts occurred on July 21 (4 DAT), 25 (8 DAT), and 29 (12 DAT), following the second application. Count data were log10 transformed prior to analysis. Proportion data were arcsine transformed prior to analysis. Means were separated using ANOVA with a Fisher’s Protected Least Squared Difference (LSD) option (P=0.05).
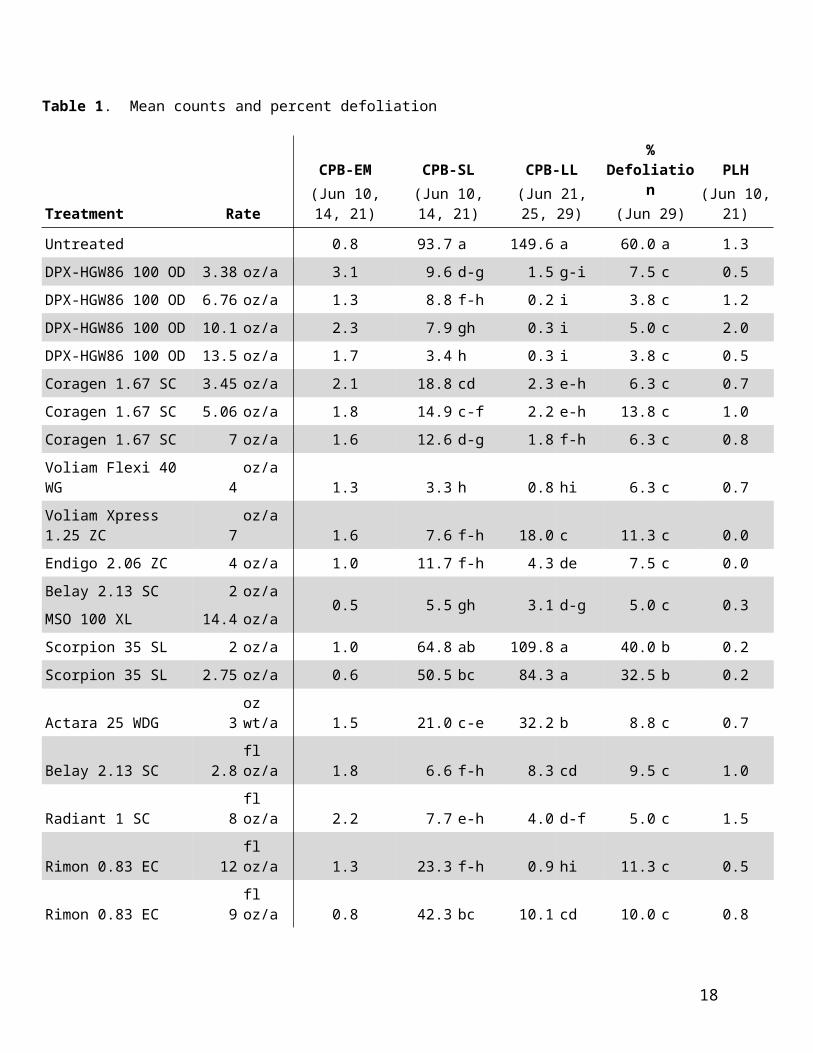
Results and DiscussionPopulations of CPB were considered average to above-average as measured defoliation in the UTC plots was nearing 5% by the time the initial foliar applications were applied. Increased levels of early larval CPB control were achieved with higher rates of DPX HGW86, Belay, Voliam Flexi, and Coragen compared to the untreated check. Lower than average levels of adult PLH were observed in the experimental plots as no significant differences were observed among registered or experimental compounds. No overt signs or symptoms of phytotoxicity were observed.
9
Table 1. Mean counts and percent defoliation
Treatment RateCPB-EM
(Jun 10, 14, 21)CPB-SL
(Jun 10, 14, 21)CPB-LL
(Jun 21, 25, 29)% Defoliation
(Jun 29)PLH
(Jun 10, 21)
Untreated 0.8 93.7 a 149.6 a 60.0 a 1.3
DPX-HGW86 100 OD 3.38 oz/a 3.1 9.6 d-g 1.5 g-i 7.5 c 0.5
DPX-HGW86 100 OD 6.76 oz/a 1.3 8.8 f-h 0.2 i 3.8 c 1.2
DPX-HGW86 100 OD 10.1 oz/a 2.3 7.9 gh 0.3 i 5.0 c 2.0
DPX-HGW86 100 OD 13.5 oz/a 1.7 3.4 h 0.3 i 3.8 c 0.5
Coragen 1.67 SC 3.45 oz/a 2.1 18.8 cd 2.3 e-h 6.3 c 0.7
Coragen 1.67 SC 5.06 oz/a 1.8 14.9 c-f 2.2 e-h 13.8 c 1.0
Coragen 1.67 SC 7 oz/a 1.6 12.6 d-g 1.8 f-h 6.3 c 0.8
Voliam Flexi 40 WG 4 oz/a 1.3 3.3 h 0.8 hi 6.3 c 0.7
Voliam Xpress 1.25 ZC 7 oz/a 1.6 7.6 f-h 18.0 c 11.3 c 0.0
Endigo 2.06 ZC 4 oz/a 1.0 11.7 f-h 4.3 de 7.5 c 0.0
Belay 2.13 SC 2 oz/a0.5 5.5 gh 3.1 d-g 5.0 c 0.3
MSO 100 XL 14.4 oz/a
Scorpion 35 SL 2 oz/a 1.0 64.8 ab 109.8 a 40.0 b 0.2
Scorpion 35 SL 2.75 oz/a 0.6 50.5 bc 84.3 a 32.5 b 0.2
Actara 25 WDG 3 oz wt/a 1.5 21.0 c-e 32.2 b 8.8 c 0.7
Belay 2.13 SC 2.8 fl oz/a 1.8 6.6 f-h 8.3 cd 9.5 c 1.0
Radiant 1 SC 8 fl oz/a 2.2 7.7 e-h 4.0 d-f 5.0 c 1.5
Rimon 0.83 EC 12 fl oz/a 1.3 23.3 f-h 0.9 hi 11.3 c 0.5
Rimon 0.83 EC 9 fl oz/a 0.8 42.3 bc 10.1 cd 10.0 c 0.8
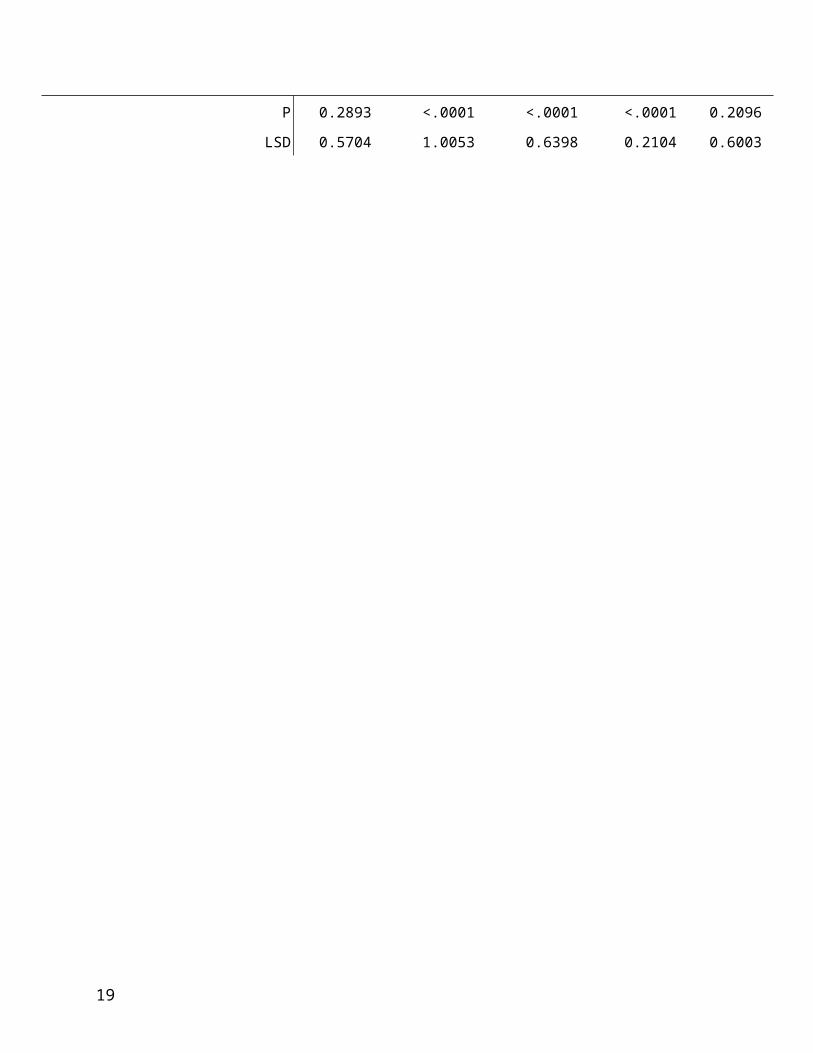
P 0.2893 <.0001 <.0001 <.0001 0.2096
LSD 0.5704 1.0053 0.6398 0.2104 0.6003
10
Foliar insecticide treatments for the control of potato leafhopper in Wisconsin potato production
Purpose: The purpose of this experiment was to evaluate the efficacy of foliar insecticides applied to potato for control of potato leafhopper (PLH), Empoasca fabae.
Materials and MethodsThis experiment was conducted at Arlington Agricultural Experiment Station (AAES) in Arlington, WI in 2010. Potato, Solanum tuberosum cv. ‘Superior’, seed pieces were planted on 21 April. Seed pieces were spaced 12 inches apart within rows. Rows were 3 ft apart. The two-row plots were 6 ft wide by 20 ft long, for a total of 0.003 acres. Two guard rows separated plots. Hilling occurred 17 May. The plots were managed according to commercial pest management (herbicide and fungicide) practices as well as fertility recommendations prescribed by AAES.
Four replicates of 16 experimental foliar treatments and 2 untreated controls were arranged in a randomized complete block design. The foliar treatments were applied 20 Jul. Treatments were applied with a CO2 pressurized backpack sprayer with a 6 ft boom operating at 30 psi delivering 20 gpa through 4 flat-fan nozzles (Tee jet XR8003VS) spaced 18” apart while travelling at 3.5 ft / sec.
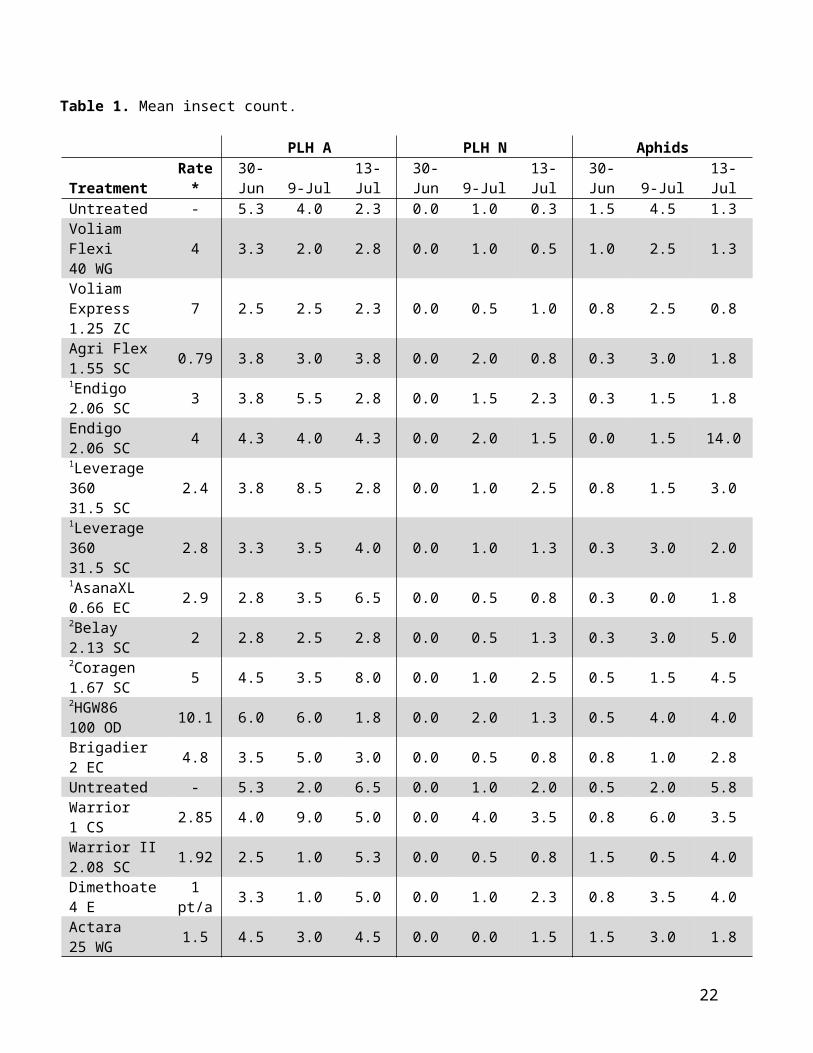
Control of PLH and aphids was assessed by counting the number of PLH nymphs (N) and the number of aphids per plant on 10 randomly selected plants in each plot while PLH adults (A) were assessed by using sweep samples consisting of 20 sweeps per plot (Table 1). Insect counts occurred on three dates throughout the summer: 30 Jun (10 DAT), 9 Jul (19 DAT), and 13 Jul (23 DAT). Count data were log10 transformed prior to analysis. Means were separated using ANOVA with a Fisher’s Protected Least Squared Difference (LSD) option (P=0.05).
Results and DiscussionPotato leafhopper and aphid populations did not significantly increase after establishment during early June (Table 1). Both aphid and leafhopper populations remained low throughout the trial and no significant differences among the treatments and untreated plots were observed.
11
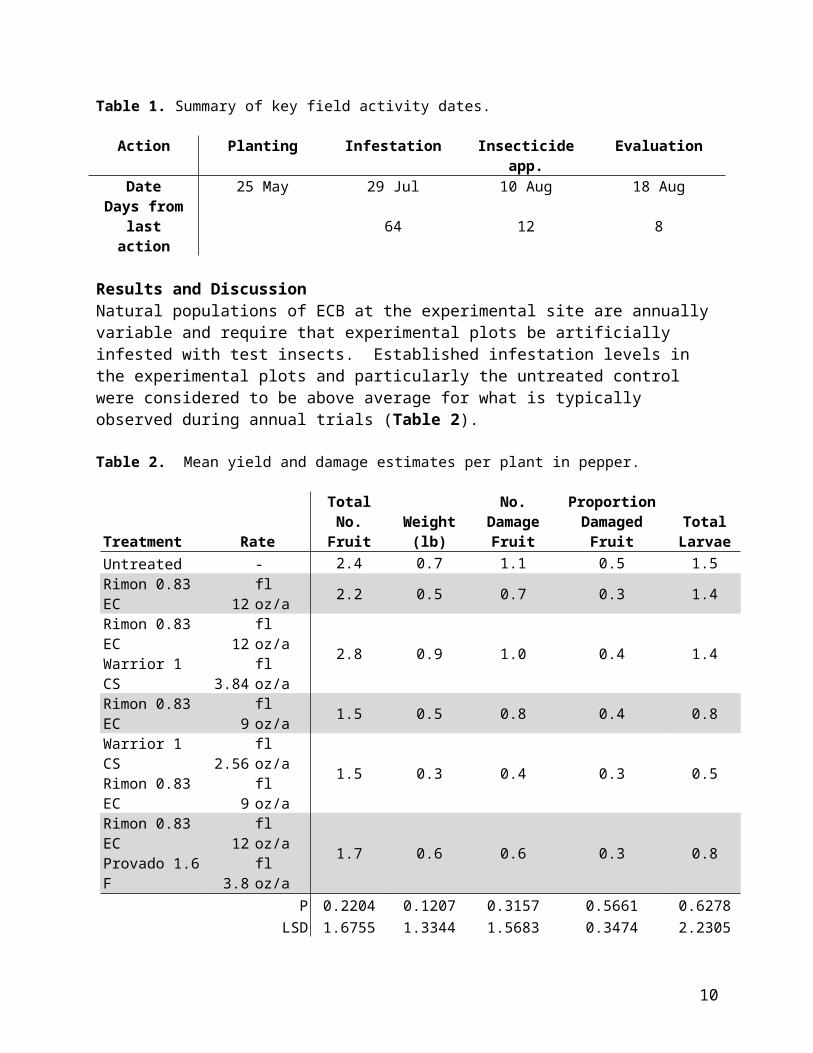
Table 1. Mean insect count.
PLH A PLH N AphidsTreatment Rate* 30-Jun 9-Jul 13-Jul 30-Jun 9-Jul 13-Jul 30-Jun 9-Jul 13-JulUntreated - 5.3 4.0 2.3 0.0 1.0 0.3 1.5 4.5 1.3Voliam Flexi40 WG 4 3.3 2.0 2.8 0.0 1.0 0.5 1.0 2.5 1.3
Voliam Express1.25 ZC 7 2.5 2.5 2.3 0.0 0.5 1.0 0.8 2.5 0.8
Agri Flex1.55 SC 0.79 3.8 3.0 3.8 0.0 2.0 0.8 0.3 3.0 1.81Endigo2.06 SC 3 3.8 5.5 2.8 0.0 1.5 2.3 0.3 1.5 1.8
Endigo2.06 SC 4 4.3 4.0 4.3 0.0 2.0 1.5 0.0 1.5 14.01Leverage 36031.5 SC 2.4 3.8 8.5 2.8 0.0 1.0 2.5 0.8 1.5 3.01Leverage 36031.5 SC 2.8 3.3 3.5 4.0 0.0 1.0 1.3 0.3 3.0 2.01AsanaXL0.66 EC 2.9 2.8 3.5 6.5 0.0 0.5 0.8 0.3 0.0 1.82Belay2.13 SC 2 2.8 2.5 2.8 0.0 0.5 1.3 0.3 3.0 5.02Coragen1.67 SC 5 4.5 3.5 8.0 0.0 1.0 2.5 0.5 1.5 4.52HGW86100 OD 10.1 6.0 6.0 1.8 0.0 2.0 1.3 0.5 4.0 4.0
Brigadier2 EC 4.8 3.5 5.0 3.0 0.0 0.5 0.8 0.8 1.0 2.8
Untreated - 5.3 2.0 6.5 0.0 1.0 2.0 0.5 2.0 5.8Warrior1 CS 2.85 4.0 9.0 5.0 0.0 4.0 3.5 0.8 6.0 3.5
Warrior II2.08 SC 1.92 2.5 1.0 5.3 0.0 0.5 0.8 1.5 0.5 4.0
Dimethoate4 E 1 pt/a 3.3 1.0 5.0 0.0 1.0 2.3 0.8 3.5 4.0
Actara25 WG 1.5 4.5 3.0 4.5 0.0 0.0 1.5 1.5 3.0 1.8
P 0.8571 0.5476 0.4292 . 0.8847 0.3428 0.8615 0.9314 0.4274LSD 0.9172 1.3868 0.9131 . 1.3136 0.835 0.7425 1.8428 1.1076
*Rate in oz/a unless otherwise noted1NIS 100 L added at 0.5 %v/v2MSO 100 L added at 14 oz/a
12

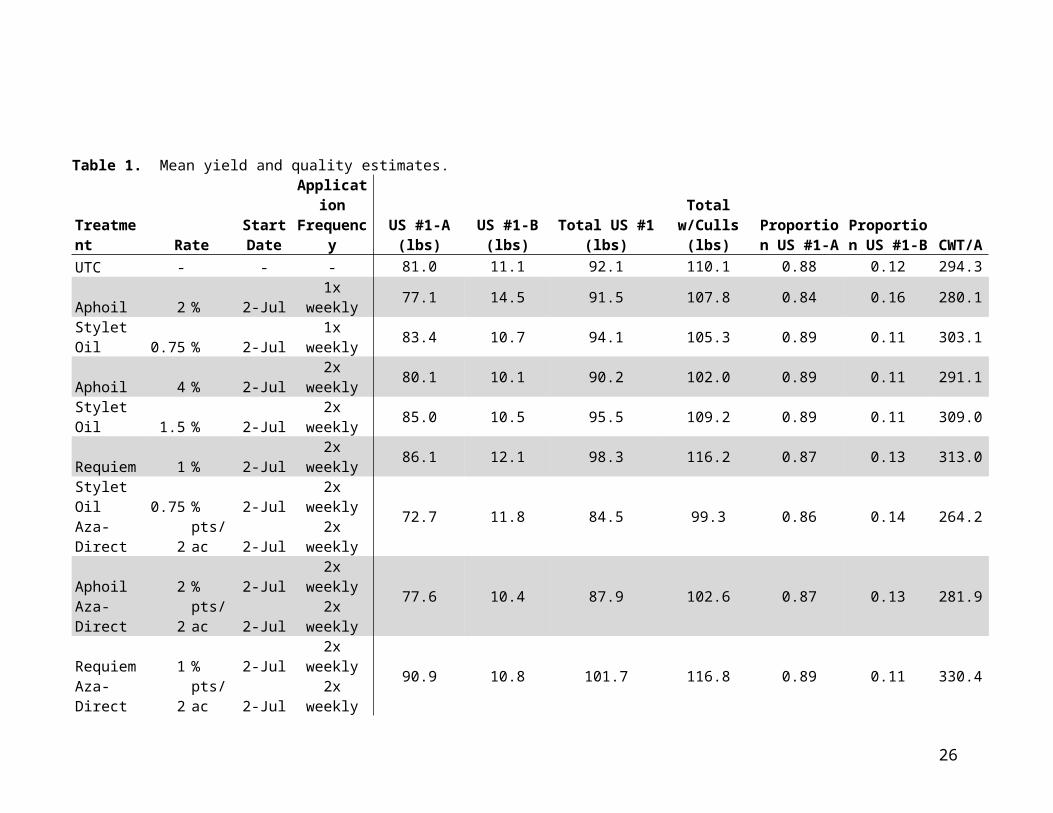
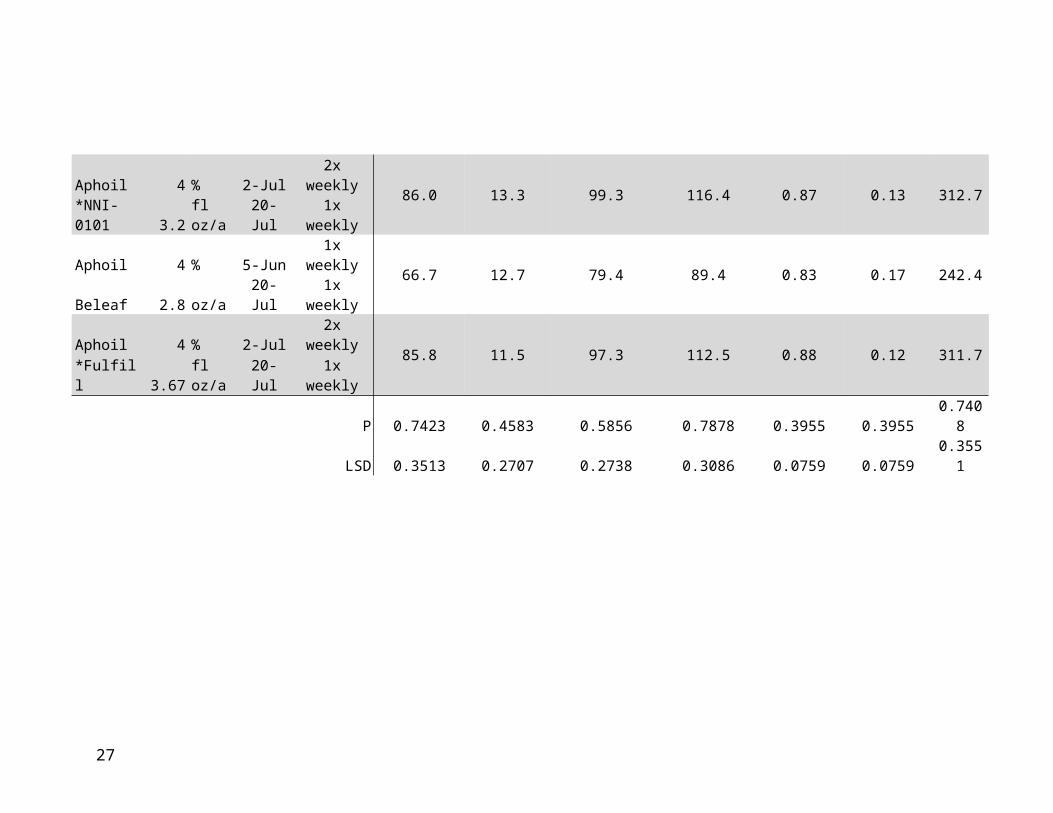
Foliar insecticide treatments to limit the spread of Potato virus Y in Wisconsin seed potato production
Purpose: The purpose of this experiment was to evaluate the efficacy of varying rates of foliar-applied Aza-Direct in limiting the spread of Potato virus Y (PVY) to foundation and certified seed potato. The goal is the refinement of PVY best management practices’ to limit current season spread of the virus in seed potato using different application timing, application intervals, and tank mixes of mineral oils and selected feeding blockers in the PVY susceptible variety, Russet Norkotah.
Materials and MethodsThis experiment was conducted at Langlade County Research Station in Antigo, WI in 2010. Potato, Solanum tuberosum cv. ‘Russet Norkotah’, seed pieces were planted on 28 April. Seed pieces were spaced 12 inches apart within rows. Rows were 3 ft apart. The four-row plots were 12 ft wide by 20 ft long, for a total of 0.006 acres. Two guard rows of the PVY-resistant variety “Villetta Rose’ separated plots. Replicates were separated by 12’ alleys of bare ground. Drive rows for foliar applications were arranged to cover border rows and provide access for foliar applications to 4 row experimental plots. PVY was established in each plot by sap-inoculating the middle plant in the second and third rows of each plot with a PVYO strain collected in Wisconsin 2004-06. Inoculation occurred 15 June, approximately 1 week after plant emergence.
Four replicates of 11 experimental foliar treatments and 1 untreated control were arranged in a randomized complete block design. Foliar applications were initiated on 2 Jul and were reapplied either once weekly or twice weekly depending on the treatment (see Table 1 for application frequency). Treatments were applied with a CO2 pressurized tractor-mounted sprayer with a 12 ft boom operating at 40 psi delivering 21.1 gpa through 13 Disc-Core type cone spray nozzles equipped with D3-DC25 spaced 12” apart while travelling at 3.5 ft / sec.
Total plot yield was taken at harvest and count data were log10 transformed prior to analysis. Proportion data were arcsine transformed prior to analysis. Means were separated using ANOVA with a Fisher’s Protected Least Squared Difference (LSD) option. Data are presented in Table 1. Incidence of PVY will be surveyed at the end of the experimental interval by counting all symptomatic plants in a sub-sample submitted to the University of Wisconsin’s, Post-Harvest Grow-out Test in Homestead, FL.
Results and DiscussionYield data from the trial show no significant differences among any of the treatments and the untreated control plots. This indicates that none of the treatments adversely affected the plots and the grow-out test in Florida will reveal the effects of the various oil treatments on virus transmission.
13
Table 1. Mean yield and quality estimates.
Treatment RateStart Date
ApplicationFrequency
US #1-A(lbs)
US #1-B(lbs)
Total US #1(lbs)
Total w/Culls (lbs)
Proportion US #1-A
Proportion US #1-B CWT/A
UTC - - - 81.0 11.1 92.1 110.1 0.88 0.12 294.3Aphoil 2 % 2-Jul 1x weekly 77.1 14.5 91.5 107.8 0.84 0.16 280.1Stylet Oil 0.75 % 2-Jul 1x weekly 83.4 10.7 94.1 105.3 0.89 0.11 303.1Aphoil 4 % 2-Jul 2x weekly 80.1 10.1 90.2 102.0 0.89 0.11 291.1Stylet Oil 1.5 % 2-Jul 2x weekly 85.0 10.5 95.5 109.2 0.89 0.11 309.0Requiem 1 % 2-Jul 2x weekly 86.1 12.1 98.3 116.2 0.87 0.13 313.0Stylet Oil 0.75 % 2-Jul 2x weekly 72.7 11.8 84.5 99.3 0.86 0.14 264.2Aza-Direct 2 pts/ac 2-Jul 2x weeklyAphoil 2 % 2-Jul 2x weekly 77.6 10.4 87.9 102.6 0.87 0.13 281.9Aza-Direct 2 pts/ac 2-Jul 2x weeklyRequiem 1 % 2-Jul 2x weekly 90.9 10.8 101.7 116.8 0.89 0.11 330.4Aza-Direct 2 pts/ac 2-Jul 2x weeklyAphoil 4 % 2-Jul 2x weekly 86.0 13.3 99.3 116.4 0.87 0.13 312.7*NNI-0101 3.2 fl oz/a 20-Jul 1x weeklyAphoil 4 % 5-Jun 1x weekly 66.7 12.7 79.4 89.4 0.83 0.17 242.4Beleaf 2.8 oz/a 20-Jul 1x weeklyAphoil 4 % 2-Jul 2x weekly 85.8 11.5 97.3 112.5 0.88 0.12 311.7*Fulfill 3.67 fl oz/a 20-Jul 1x weekly
P 0.7423 0.4583 0.5856 0.7878 0.3955 0.3955 0.7408LSD 0.3513 0.2707 0.2738 0.3086 0.0759 0.0759 0.3551
14
Muck Potato Research
Purpose: The purpose of this experiment was to evaluate candidate, new potential insecticide seed, in-furrow, and impregnation treatments with currently registered standards for the control of Colorado potato beetle (CPB), Leptinotarsa decemlineata, potato leafhopper (PLH), Empoasca fabae, and colonizing aphid species.
Materials and MethodsThis experiment was conducted at Gumz Muck Farms in Endeavor, WI in 2010. Potato, Solanum tuberosum cv. ‘Superior’, seed pieces were planted on 28 April. Seed pieces were spaced 12 inches apart within rows. Rows were 3 ft apart. The four-row plots were 12 ft wide by 20 ft long, for a total of 0.006 acres. Two guard rows separated plots. Replicates were separated by 10 ft unplanted alleys. The experiment was conducted in a section of a commercial potato field with a history of known key insect pest species pressure.
Four replicates of 8 experimental treatments and 1 untreated control were arranged in a randomized complete block design. Systemic insecticides were applied at plant (April 28) with a CO2 pressurized backpack sprayer with a 2 nozzle boom (one for each furrow) operating at 30 psi delivering 9.1 gpa through a pair of extended range flat-fan nozzles spaced 36” apart while travelling at 3.5 ft / sec. Seed treatments were applied 26 April with a CO2 pressurized backpack sprayer with a single nozzle operating at 30 psi.
Control of CPB was assessed by counting the number of egg masses (EM), small larvae (SL), large larvae (LL) per plant on 10 randomly selected plants in each plot. Percent defoliation (%DF) was evaluated by visual observation of each plot. Control of PLH, was assessed by counting the number of adults and nymphs collected from 25 sweep net samples in each plot. Insect counts occurred on several dates throughout the summer and reported means were averaged across those dates. Yield and quality data were taken after harvest. Count data were log10 transformed prior to analysis. Proportion data were arcsine transformed prior to analysis. Means were separated using ANOVA with a Fisher’s Protected Least Squared Difference (LSD) option (P=0.05).
Results and DiscussionHistorically, at plant systemic insecticides have had limited efficacy on muck soils. Potato insect management with systemic insecticides has been limited due to the high binding capacity of organic matter which ties up the active ingredients and limits plant availability. Similar trends were observed in 2010 with the at plant treatments providing a limited amount of CPB efficacy when compared to the untreated plots (Tables 1 and 2). CPB larval numbers were reduced in all the seed and in furrow treatments; however there were no significant statistical differences among treatments. Defoliation was significantly reduced in at plant treatments when compared to the untreated plots.
15
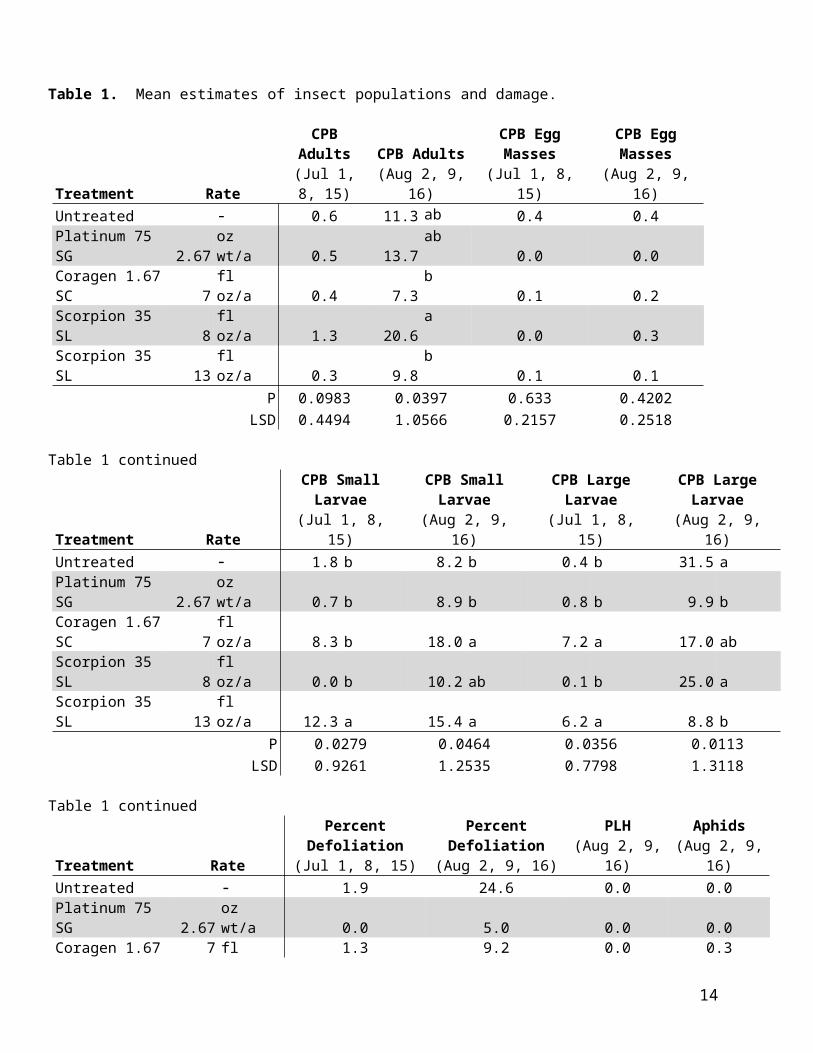
Table 1. Means of CPB in various life stages, percent defoliation, PLH, and aphids
Treatment Rate Type
Adults(Jun 28,
Jul 9, 16, 23)
Egg Masses(Jun 7, 16,
21)
Small Larvae(Jun 21, 28,
Jul 9, 16)
Large Larvae(Jun 28,
Jul 9, 16, 23)
PercentDefoliation(Jul 9, 16)
UTC 5.6 0.7 6.6 28.4 33.8 aPlatinum 75 SG 2.67 oz/a IF 5.8 0.3 5.8 9.1 9.4 bCoragen 1.67 SC 7.0 oz/a IF 7.7 0.3 5.3 13.8 14.4 bBelay 2.13 SC 12.0 oz/a IF 5.6 0.4 3.4 10.1 9.4 bDPX-HGW86 20 SC 13.5 oz/a IF 5.0 0.5 5.2 11.1 10.6 bDPX-HGW86 5 FS 0.14 oz/cwt S 3.7 0.5 4.9 10.4 10.0 bDPX-HGW86 5 FS 0.14 oz/cwt S
3.9 0.5 9.6 10.9 8.1 bTitan 600 FS 0.10 oz/cwt SPoncho 600 FS 0.20 oz/cwt S 2.4 0.2 2.6 10.2 6.3 bCruiser 600 FS 0.09 oz/cwt S 3.5 0.3 6.1 12.5 8.8 b
P 0.9897 0.8927 0.8136 0.7010 <.0001LSD 0.7764 0.3366 0.8755 0.9393 0.1354
PLH Adults(Jun 21, 28,
Jul16)PLH Nymphs
(Jul 16)Aphids(Jul 16)
5.1 a 3.5 1.40.9 b 0.5 0.36.5 a 1.0 2.01.0 b 0.0 0.84.3 a 1.5 1.64.5 a 0.8 0.9
1.1 b 0.0 0.5
1.1 b 0.0 0.81.0 b 0.3 0.5
<.0001 0.2873 0.59560.5191 0.8954 0.6368
Table 2. Mean yield and quality data.Treatment Rate Type Proportion US#1 CWT/A Specific GravityUTC 0.8 176.9 1.051Platinum 75 SG 2.67 oz/a IF 0.9 239.7 1.055Coragen 1.67 SC 7.0 oz/a IF 0.9 199.2 1.049Belay 2.13 SC 12.0 oz/a IF 0.9 223.9 1.051DPX-HGW86 20 SC 13.5 oz/a IF 0.9 216.0 1.049DPX-HGW86 5 FS 0.14 oz/cwt S 0.9 204.9 1.052DPX-HGW86 5 FS 0.14 oz/cwt S
0.9 221.6 1.049Titan 600 FS 0.10 oz/cwt SPoncho 600 FS 0.20 oz/cwt S 0.9 192.9 1.052Cruiser 600 FS 0.09 oz/cwt S 0.9 207.2 1.049
P 0.7952 0.9131 0.1049LSD 0.1259 0.4668 0.002
IF = In furrow S = Seed treatment
16
17
Evaluation of systemic insecticides for the control of the Colorado potato beetle, potato leafhopper, and aphids in potato
Purpose: The objective of this experiment was to assess the efficacy of at-plant insecticides to control Colorado potato beetle (CPB), Leptinotarsa decemlineata, potato leafhopper (PLH), Empoasca fabae, and potato colonizing aphid species in potatoes.
Materials and MethodsThis experiment was conducted at Hancock Agricultural Experiment Station (HAES) located 1.1 mile (1.8 km) southwest of Hancock, Wisconsin on a loamy sand soil in 2010. Potato, Solanum tuberosum cv. ‘Russet Burbank’, seed pieces were planted on 28 April. Seed pieces were spaced 12 inches apart within rows. Rows were 3 ft apart. The four-row plots were 12 ft wide by 20 ft long, for a total of 0.006 acres. Two untreated guard rows separated plots. Plots were arranged in an 8 tier design with 12 ft alleys between tiers. All plots were maintained according to standard commercial production practices by HAES staff.
Four replicates of 21 experimental treatments and 2 untreated controls were arranged in a randomized complete block design. All in-furrow treatments were applied in 2.0 L of water at 11.0 gpa on 28 April using a two nozzle boom equipped with TeeJet XR8002VS flat fan spray nozzles powered by a CO2 backpack sprayer at 30psi. Furrows were cut using a commercial potato planter without closing discs attached. Seed treatments were applied in 0.016 L of water on 27 April using a single nozzle boom applying 9.1 gpa equipped with an XR8002VS flat fan spray tip powered by a CO2 backpack sprayer at 30psi. Immediately after the in-furrow treatments were applied and all seed piece treatments were placed in open furrows, all seed was covered by hilling.
Stand counts were conducted on 20 May (22 DAP) by counting the number of emerged plants per 20 ft. section of row. Control of CPB, PLH nymphs, and aphids was assessed by counting the number of these insects per plant on 10 randomly selected plants in each plot. Defoliation was evaluated by visual observation of each plot. Percent defoliation was determined for each plot through visual observation. CPB were recorded in the following life stages: adults (Ad), egg masses (EM), small larvae (SL), large larvae (LL). PLH were recorded as nymphs (N) or adults (A). Adult potato leafhoppers were sampled using sweep net techniques (20 sweeps per plot). Insect counts occurred on several dates throughout the summer, and means are reported as averages over dates (Table 1). Insect count averages reflect time periods during the summer when specific life stages peaked in the plots. Experimental plots were mechanically harvested from a single row of the four-row plots and weighed and graded at the HAES. Count data were log10 transformed prior to analysis. Means were separated using ANOVA with a Fisher’s Protected LSD (P=0.05).
Results and DiscussionPopulations of CPB in this field trial were considered average to above average as defoliation in the UTC plots was nearing 10% by the time first generation CPB larval numbers began to peak in mid-June. Significant treatment effects with the DPX HGW86 5.22 FS seed and in-furrow treatments, Belay 2.13 SC seed treatments, Admire Pro 4.6 FS pre-mixes were observed relative to the untreated control including CPB larvae and % defoliation. All treatments except the DPX HGW86 alone provided effective control of PLH adults and nymphs. All treatments resulted in significantly higher tuber yields than the untreated check plots. No signs of phytotoxicity were observed following plant emergence.
18
Table 1. Mean insect counts in various life stages and percent defoliation
Treatment1 Rate TypeCPB-Ad
(Jun 2, 7)CPB-EM(Jun 2, 7)
CPB-SL(Jun 2, 7, 14)
CPB-LL(Jun 14, 22, 29)
%DF(Jul 8, 15)
Untreated - - 46.4 4.8 a-c 55.5 b 56.2 ab 62.5 aDPX-HGW86 5.22 FS 4.56 fl oz/a IF 20.6 1.8 c-g 2.6 c-e 1.2 c-e 7.9 cdDPX-HGW86 1.67 SC 10.3 fl oz/a IF 21.1 3.1 a-d 3.8 c-e 10.7 c-e 10.8 cdDPX-HGW86 1.67 SC 13.7 fl oz/a IF 26.6 1.7 c-g 4.2 c-e 2.2 c-e 9.3 cdAdmirePro 4.6 FS 7 fl oz/a IF 18.1 2.0 a-f 8.3 cd 7.2 c-e 13.8 cdAdmirePro 4.6 FS 8.7 fl oz/a IF 20.7 2.0 b-g 10.8 c-e 14.5 c-e 9.2 cdBelay 2.13 SC 12 fl oz/a IF 19.9 0.9 fg 0.3 e 0.7 e 5.0 dBelay 2.13 SC 0.6 fl oz/cwt S 16.9 1.1 d-g 3.2 de 0.8 de 13.8 cdMoncoat 7.5 SS 0.75 lb/cwt SUntreated - - 45.1 6.3 ab 72.8 a 61.5 a 36.7 bDPX-HGW86 1.67 SC 0.62 fl oz/cwt S 20.0 3.2 a-c 10.9 cd 9.3 c-e 10.8 cdDPX-HGW86 5.22 FS 0.16 fl oz/cwt S 26.1 2.9 b-g 8.5 cd 14.2 bc 15.8 cDPX-HGW86 5.22 FS 0.22 fl oz/cwt S 21.4 2.8 a-e 8.7 cd 9.0 c-e 10.5 cdDPX-HGW86 5.22 FS 0.16 fl oz/cwt S
12.5 0.8 e-g 7.9 c-e 11.0 c-e 7.9 cdTitan ST 5 FS 0.16 fl oz/cwt SDPX-HGW86 5.22 FS 0.22 g/100 kg S
18.7 0.5 g 12.2 c-e 7.2 c-e 13.5 cdTitan ST 5 FS 0.16 fl oz/cwt SDPX-HGW86 5.22 FS 0.16 fl oz/cwt S
17.6 1.1 c-g 15.6 cd 18.3 cd 16.7 cTitan ST 5 FS 0.08 fl oz/cwt SDPX-HGW86 5.22 FS 0.16 fl oz/cwt S
16.3 1.2 c-g 26.6 c 11.7 c-e 11.3 cdAdmirePro 4.6 FS 0.26 fl oz/cwt SDPX-HGW86 5.22 FS 0.22 fl oz/cwt S
31.8 0.9 d-g 7.7 c-e 7.2 c-e 15.8 cAdmirePro 4.6 FS 0.26 fl oz/cwt SDPX-HGW86 5.22 FS 0.22 fl oz/cwt S 23.5 5.2 a 9.0 c-e 19.2 bc 12.1 cdTitan ST 5 FS 0.16 fl oz/cwt S 17.2 0.5 g 7.2 c-e 8.1 c-e 10.9 cdAdmirePro 4.6 FS 0.26 fl oz/cwt S 14.7 0.8 d-g 8.7 cd 7.1 c-e 16.7 cAdmirePro 4.6 FS 0.35 fl oz/cwt S 20.1 1.3 d-g 32.5 cd 11.5 c-e 15.8 cCruiser 5 FS 0.12 fl oz/cwt S 14.1 1.3 d-g 20.1 cd 7.6 c-e 11.9 cdCruiser 5 FS 0.16 fl oz/cwt S 11.2 0.6 fg 7.8 c-e 9.0 c-e 12.5 cd
P 0.6643 <.0001 <.0001 0.0004 <.0001LSD 0.8871 0.5616 0.9689 0.9529 0.1474
PLH-A(Jul 8, 15)
PLH-N(Jul 8, 15)
Aphids(Jul 8, 15)
1.1 d-f 0.0 0.22.5 a 0.0 0.22.7 ab 0.0 0.52.0 a-d 0.0 0.10.8 f-i 0.0 0.30.6 f-i 0.0 0.30.3 hi 0.0 0.0
2.1 f-i 0.0 0.0
1.2 d-f 0.0 0.12.0 a-c 0.0 0.52.2 ab 0.0 0.51.3 c-f 0.0 0.2
0.2 i 0.0 0.1
0.4 hi 0.0 0.1
1.1 d-f 0.0 0.3
0.8 f-i 0.0 0.0
1.0 d-g 0.0 0.2
1.6 b-e 0.0 0.10.4 g-i 0.0 0.00.9 e-h 0.0 0.00.9 e-h 0.0 0.30.2 i 0.0 0.20.4 hi 0.0 0.0
<.0001 0.4777 0.35720.3224 0.0169 0.198
IF = In furrow S = Seed treatment
19
Large plot demonstration experiments for control of Colorado potato beetle in Wisconsin potatoes.
Purpose: The purpose of this experiment was to evaluate various Colorado Potato Beetle (CPB), full-season, reduced-risk, insecticide programs.
Methods and MaterialsThis experiment was conducted in 2010 on a loamy sand soil at Hancock Agricultural Research station (HAES) located 1.1 mile (1.8 km) southwest of Hancock, Wisconsin. Potato, Solanum tuberosum cv. ‘Russet Burbank’, seed pieces were planted on 26 Apr. Plants were spaced 12 inches apart within rows. Rows were 3 ft apart. The 12-row plots were 36 feet wide by 30 feet long, for a total of 0.025 acres/plot. Replicates were separated by a 6 ft border of bare ground.
Three replicates of 15 full-season insecticide programs were arranged in a randomized complete block design. Systemic insecticides were applied either at plant (26 Apr) or at time of first hilling (5/17/10). The first foliar insecticide applications were at the appearance of early-instar CPB larvae (7 Jun for all treatments). Subsequent applications were made on 17 and 21 Jun, 19 Jul, and 6 Aug. Treatment information is available in Table 1. All in-furrow treatments were applied in 2.0 L of water at 11.0 gpa on 28 April using a two nozzle boom equipped with TeeJet XR8002VS flat fan spray nozzles powered by a CO2 backpack sprayer at 30psi. Furrows were cut using a commercial potato planter without closing discs attached. Seed treatments were applied in 0.016 L of water on 27 April using a single nozzle boom applying 9.1 gpa equipped with an XR8002VS flat fan spray tip powered by a CO2 backpack sprayer at 30psi. Immediately after the in-furrow treatments were applied and all seed piece treatments were placed in open furrows, all seed was covered by hilling. An application of Platinum 75SG occurred on 17 May with a tractor mounted insecticide injector. The insecticide was injected into the side of the potato hill. Platinum 75SG was also impregnated onto a polymer and applied in furrow at planting prior to hill closure. Foliar insecticides were applied using a CO2 pressurized sprayer with a 12 ft boom operating at 30 psi delivering 22 gpa through TeeJet XR8003VS nozzles spaced 18” apart at 4.0 fps.
20
Control of CPB was assessed by counting the number of egg masses (EM), small larvae (SL), and large larvae (LL) per plant on 10 randomly selected plants in each plot. Percent defoliation (%DF) ratings were taken by visual observation of the entire plot. Control of potato leafhopper (PLH), Empoasca fabae, were assessed by counting the number of adults collected from 25 sweep net samples in each plot. Aphid and potato leafhopper nymph populations were surveyed using 25 leaves per plot. Insect counts occurred on several dates throughout the summer and reported means were averaged across those dates (Tables 2, 3). Insect count averages reflect time periods during the summer when specific life stages peaked in the plots. Yield and quality data were collected after harvest (9/14/10) (Table 4). Count data were log10 transformed prior to analysis. Proportion data were arcsine transformed prior to analysis. Means were separated using ANOVA with a Fisher’s Protected Least Squared Difference (LSD) option (P=0.05).
Results and DiscussionThis trial was designed to demonstrate that there are various effective CPB control options available to the potato growers of Wisconsin. Season long CPB efficacy was achieved with all the programs evaluated and this is reflected in the yields obtained from the plots (Table 4). Most of the systemic programs in this trial provided effective first generation CPB control (Table 1). The application of Platinum 75SG at hilling proved ineffective and an application of Radiant SC was required to limit increasing defoliation in the treatment. Applications of Radiant SC were also required in the Coragen 1.67SC and Belay 2.13SC in furrow treatments to control first generation CPB larvae. A single application of foliar materials at the correct timing provided effective first generation CPB larval control in most of the foliar based programs. However, two foliar applications were required during peak second generation larval populations in all of the treatments during late July and early August.
(continued)
21
Table 1. Treatment list
1st generation CPB 2nd generation CPBTrt AppDate Insecticide Rate †Type AppDate Insecticide Rate †Type
126-Apr Platinum 75 SG 2.67 oz wt/a IF 19-Jul aVoliam Xpress 1.25 ZC 7 fl oz/a F
6-Aug aVoliam Xpress 1.25 ZC 5 fl oz/a F
226-Apr Admire Pro 4.6 F 8.7 fl oz/a IF 19-Jul bCoragen 1.67 SC 5 fl oz/a F
6-Aug bCoragen 1.67 SC 5 fl oz/a F
3 26-Apr Coragen 1.67 SC 7 fl oz/a IF 19-Jul aActara 25 WDG 3 oz wt/a F17-Jun Radiant 1 SC 8 fl oz/a F 6-Aug aActara 25 WDG 1.5 oz wt/a F
4 26-Apr Belay 2.13 SC 12 fl oz/a IF 19-Jul aVoliam Xpress 1.25 ZC 7 fl oz/a F17-Jun Radiant 1 SC 8 fl oz/a F 6-Aug aVoliam Xpress 1.25 ZC 5 fl oz/a F
526-Apr DPX-HGW86 20 SC 13.5 fl oz/a IF 19-Jul aActara 25 WDG 3 oz wt/a F
6-Aug aActara 25 WDG 1.5 oz wt/a F
617-May Platinum 75 SG 2.67 oz wt/a PM 19-Jul aVoliam Xpress 1.25 ZC 7 fl oz/a F
6-Aug aVoliam Xpress 1.25 ZC 5 fl oz/a F
726-Apr A16901 40 WG 10 oz wt/a IF 19-Jul aVoliam Xpress 1.25 ZC 7 fl oz/a F
6-Aug aVoliam Xpress 1.25 ZC 5 fl oz/a F
817-May Platinum 75 SG 2.67 oz wt/a H 19-Jul aVoliam Xpress 1.25 ZC 7 fl oz/a F17-Jun Agri-Mek 0.15 EC 12 fl oz/a F 6-Aug aVoliam Xpress 1.25 ZC 5 fl oz/a F
97-Jun bCoragen 1.67 SC 5 fl oz/a F 19-Jul aAssail 30 SG 4 oz wt/a F
* bCoragen 1.67 SC 5 fl oz/a F 6-Aug aAssail 30 SG 2.5 oz wt/a F
107-Jun aRadiant 1 SC 8 fl oz/a F 19-Jul aAgri-flex 1.55 SC 0.79 fl oz/a F
* aRadiant 1 SC 6 fl oz/a F 6-Aug aAgri-flex 1.55 SC 0.6 fl oz/a F
117-Jun aAgri-Mek 0.15 EC 12 fl oz/a F 19-Jul aEndigo 2.06 ZC 4 fl oz/a F
* aAgri-Mek 0.15 EC 8 fl oz/a F 6-Aug aEndigo 2.06 ZC 2.5 fl oz/a F
127-Jun cRimon 0.83 EC 12 fl oz/a F 19-Jul bCoragen 1.67 SC 5 fl oz/a F
* cRimon 0.83 EC 8 fl oz/a F 6-Aug bCoragen 1.67 SC 3.5 fl oz/a F
137-Jun aActara 25 WDG 3 oz wt/a F 19-Jul aAgri-Mek 0.7 SC 2.58 fl oz/a F
17-Jun aActara 25 WDG 1.5 oz wt/a F 6-Aug aAgri-Mek 0.7 SC 2 fl oz/a F
147-Jun bCoragen 1.67 SC 5 fl oz/a F 19-Jul aRadiant 1 SC 8 fl oz/a F
* bCoragen 1.67 SC 3.5 fl oz/a F 6-Aug aRadiant 1 SC 6 fl oz/a F
157-Jun aAgri-flex 1.55 SC 0.79 fl oz/a F 19-Jul bCoragen 1.67 SC 5 fl oz/a F
17-Jun aAgri-flex 1.55 SC 0.6 fl oz/a F 6-Aug bCoragen 1.67 SC 3.5 fl oz/a F
†F=foliar, H=1st hilling, IF=In furrow, PM=Polymer impregnated* Intended spray was unnecessary because beetle count was below thresholdaNIS 100 L added at 0.5 %v/vbMSO 100 L added at 0.5 %v/vcSilwet 100 L added at 0.23 %v/v
22
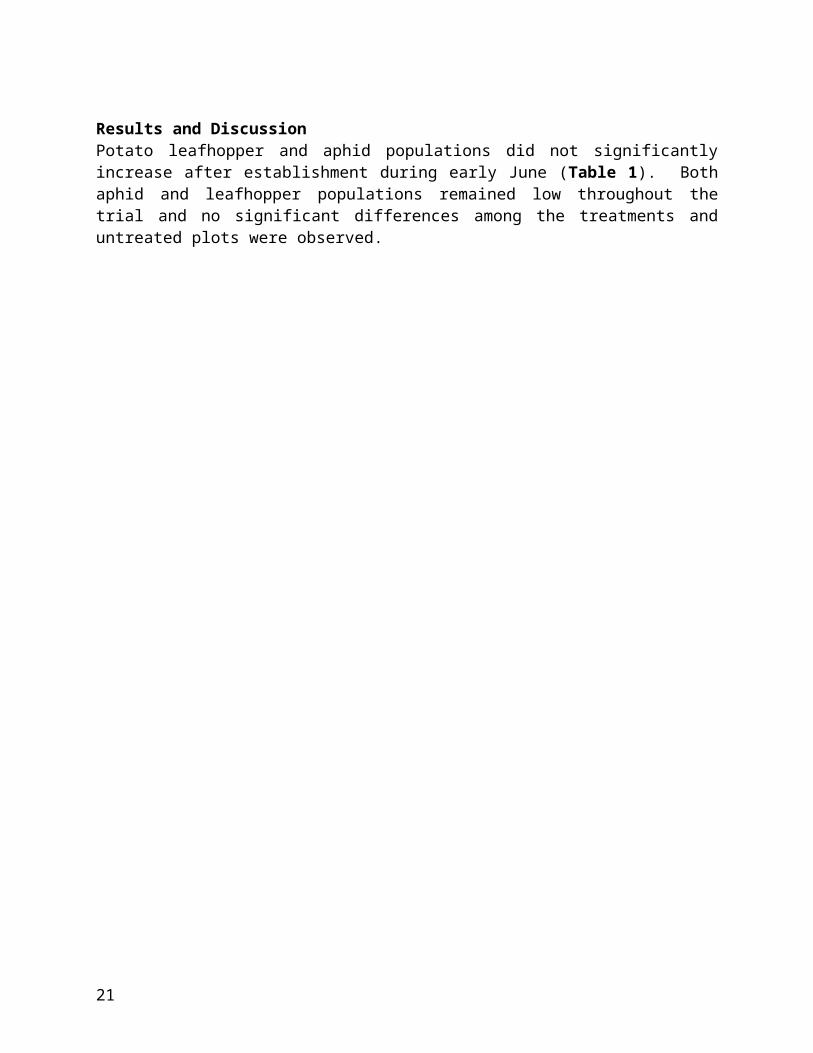
Table 2. Mean CPB counts per plant of different life stages and percent defoliation.
TrtAdults
(Jul 15, 23, Aug 2, 16)Egg Masses
(Jun 2, 7, 15, 22)Small Larvae
(Jun 7, 15, 22, Jul 1)Large Larvae
(Jun 15, 22, Jul 1, 8) % Defoliation1 9.5 0.8 c-e 5.3 c-e 5.3 cd 18.6 bc2 11.2 1.1 b-e 12.5 b-e 25.6 ab 22.8 ab3 5.7 3.3 a-c 34.7 a 14.7 a-d 19.2 bc4 6.8 0.7 de 3.1 e 4.1 cd 10.8 c5 7.3 0.9 b-e 9.5 b-e 9.8 a-d 13.5 c6 9.4 0.7 e 2.4 de 3.5 d 13.9 bc7 6.3 0.6 e 2.6 e 3.2 cd 15.0 bc8 8.3 3.0 a-e 21.6 a 8.4 a-c 12.5 c9 6.1 2.4 a-d 9.6 a 6.2 b-d 16.1 bc
10 5.6 2.4 ab 11.4 ab 7.8 cd 18.9 bc11 3.4 2.6 a-d 8.3 a-c 5.7 cd 13.6 c12 10.0 2.9 a 18.7 a 9.7 ab 31.1 a13 3.9 3.0 ab 10.4 ab 4.7 cd 15.0 bc14 3.9 2.1 a-e 4.1 a-d 6.7 a-d 18.1 bc15 16.9 2.5 a-d 22.8 a 11.9 a 35.3 a
P 0.3301 0.0075 <.0001 0.0116 0.0004LSD 0.9359 0.8595 1.3012 1.1021 0.1944
Table 3. Mean PLH and aphid counts per plant Table 4. Mean yield and quality data.
PLH adults AphidsTrt (Jun 15, 22) (Jul 8, 15) (Jun 22) (Jul 8, 15)1 0.3 e 0.3 b 0.0 0.2 ef2 0.3 e 0.5 b 0.0 0.5 d-f3 2.5 a-c 6.3 a 0.0 3.2 a4 0.5 de 0.2 b 0.0 0.7 d-f5 2.8 a-c 5.5 a 0.0 1.5 a-f6 0.3 e 0.3 b 0.0 0.2 ef7 0.7 de 0.8 b 0.0 0.0 f8 1.3 c-e 0.3 b 0.0 1.0 b-f9 1.8 b-d 4.8 a 0.0 4.0 ab
10 2.7 a-c 7.0 a 0.0 2.0 a-e11 3.0 a-c 6.0 a 0.3 2.5 a-c12 5.2 a 6.5 a 0.0 2.8 ab13 1.3 c-e 3.5 a 0.0 0.8 c-f14 3.3 ab 4.8 a 1.0 2.8 ab15 2.7 a-d 5.0 a 0.0 2.5 a-d
P <.0001 <.0001 0.6818 0.0005LSD 0.6634 0.6491 0.4696 0.7111
Trt Proportion US #1 CWT/ASpecific Gravity
1 0.8 484.5 1.0752 0.9 460.2 1.0743 0.9 498.5 1.0754 0.8 486.8 1.0785 0.9 506.0 1.0756 0.9 489.5 1.0777 0.8 426.1 1.0748 0.9 509.7 1.0759 0.8 515.3 1.072
10 0.9 491.9 1.07411 0.9 607.0 1.07612 0.9 424.1 1.07113 0.9 583.0 1.07714 0.9 505.7 1.07515 0.8 395.3 1.072
P 0.3953 0.4103 0.4035LSD 0.1212 0.333 0.0025
23
Foliar insecticide treatments for the control of European corn borer in Wisconsin snap bean production
Purpose: The purpose of this experiment is to evaluate various foliar-applied, registered and experimental insecticides targeting populations of European corn borer (ECB), Ostrinia nubilalis, larvae in snap beans.
Materials and Methods: This experiment was conducted at Arlington Agricultural Experiment Station (AAES) in Arlington, WI in 2010. Snap bean, Phaseolus vulgaris var. ‘Hercules’, was seeded on 14 Jun at a rate of 8 seeds per foot within rows. Rows were 30 inches apart. The two-row plots were 5 ft wide by 25 ft long, for a total of 0.03 acres. Replicates were separated by two untreated rows. All plots received an at-plant seed treatment application of thiamethoxam (Cruiser® 5FS), and were managed per commercial management practices.
Four replicates of 14 treatments and 1 untreated control were arranged in a randomized complete block design. The foliar treatments were applied 11 Jul when plants had reached the flowering and pin-bean development stage. Treatments were applied with a CO2 pressurized backpack sprayer with a 6’ boom operating at 29.2 psi delivering 24 gpa through 4 flat-fan nozzles (XR8003VS) spaced 18” apart while travelling at 3.5 ft / sec.
Each plot was infested with ECB egg masses on two dates, one before and one after a single insecticide treatment (8 and 14 Jul, respectively). In each plot for each pinning date, five successive plants were infested, each with five egg masses for a total of 25 egg masses applied in each plot.
Populations of ECB and associated damage estimates were surveyed 30 Jul, 16 days after the second insect pinning by counting (1) total number of damaged plants, (2) number of damaged stems per plant, (3) number of damaged pods, and (4) the number of viable larvae observed in both stems and pods. The survey was done only on the five plants that had been infested. See Table 1 for a summary of key field activity dates. Count data were log10 transformed prior to analysis. Proportion data were arcsin transformed prior to analysis. Means were separated using ANOVA with a Least Squared Difference (LSD) option (P=0.05). Data are presented in Table 2.
Table 1. Summary of key field activity dates.Action Planting First infestation Insecticide app. Second infestation EvaluationDate 14 Jun 8 Jul 11 Jul 14 Jul 30 Jul
Days from last action 24 3 3 16
Results and DiscussionNatural populations of ECB at AAES are annually variable and require that experimental plots be artificially infested with test insects. Established infestation levels in the experimental plots and particularly the untreated control were considered to be above average for what is typically observed during annual trials.
24
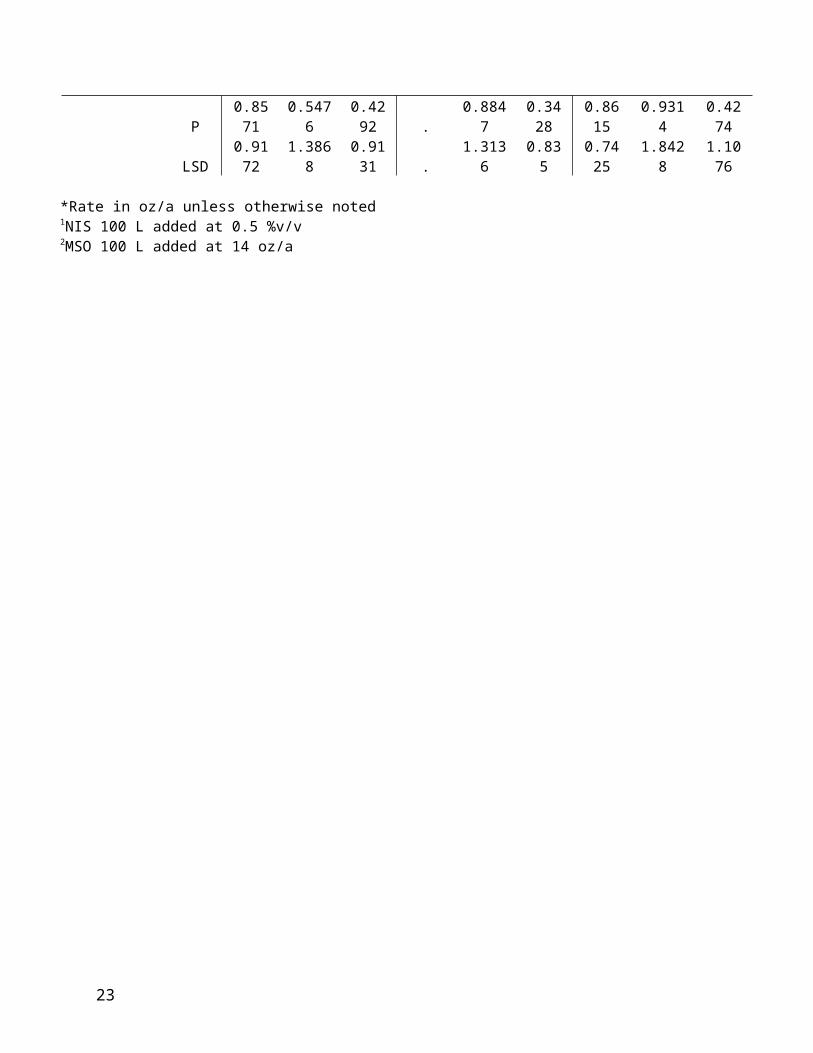
Table 2. Mean damage estimates of plants, stems, pods, and number of larvae.
Infested 8 Jul (before insecticide application)
Treatment Rate*
Proportion Damaged
Plants
Proportion Damaged
Pods# Larvae in Stem
# Larvae in Pods US ton/a
Untreated 0.7 0.2 3.5 2.3 4.8HGW 86 10 SE 0.134 0.5 0.1 0.8 1.3 5.3MSO 100 L 0.5 %v/vCoragen 1.67 SC 0.059 0.2 0.1 0.3 0.5 3.1MSO 100 EC 0.5 %v/vCoragen 1.67 SC 0.066 0.5 0.1 0.8 1.8 6.0MSO 100 EC 0.5 %v/vBelt 4 SC 0.094 0.4 0.1 0.8 1.5 4.8NIS 100 XL 0.25 %v/vBrigade 2 EC 0.1 0.5 0.0 1.3 0.8 4.8Warrior II 2.08 SC 0.0312 0.3 0.0 0.3 0.5 5.5Radiant 1 SC 0.0625 0.4 0.1 1.0 0.8 5.9Orthene 97 SG 1 0.3 0.1 0.0 0.5 5.7Rimon 0.83 EC 0.058 0.5 0.0 1.0 0.0 4.0Rimon 0.83 EC 0.078 0.8 0.1 1.0 1.0 6.8Rimon 0.83 EC 0.058 0.6 0.1 1.3 0.8 6.1Warrior 1 CS 0.02Rimon 0.83 EC 0.078 0.7 0.2 1.5 2.3 6.0Warrior 1 CS 0.03Mustang Max 0.8 EC 0.025 0.4 0.1 0.0 0.8 4.5Hero 1.14 EW 0.075 0.4 0.1 0.0 1.5 6.8
P 0.4359 0.2258 0.2470 0.5294 0.4968LSD 0.7168 0.2610 3.5964 3.7707 1.3781
Infested 14 Jul (after insecticide application)Proportion Damaged
Plants
Proportion Damaged
Pods# Larvae in Stem
# Larvae in Pods US ton/a
0.4 0.1 1.5 0.3 4.2
0.2 0.1 0.5 0.0 4.5
0.2 0.1 0.3 0.3 5.0
0.2 0.0 0.3 0.5 4.8
0.2 0.1 0.0 1.3 5.5
0.1 0.0 0.0 0.0 3.70.2 0.1 0.0 0.0 5.50.2 0.0 0.3 0.0 3.70.2 0.1 0.3 0.5 4.20.2 0.0 0.0 0.3 5.60.2 0.1 0.0 0.8 6.0
0.4 0.0 0.8 1.0 5.0
0.3 0.1 0.5 0.8 1.2
0.2 0.0 0.3 0.0 3.80.3 0.1 0.3 0.5 5.6
0.9457 0.9420 0.7915 0.2948 0.08520.5038 0.2327 2.9516 3.0755 1.3910
*Rate unit is lb ai/a unless otherwise noted
25
Systemic insecticide treatments for the control of European corn borer in Wisconsin snap bean production
Purpose: The purpose of this experiment was to evaluate the efficacy of several seed treatments on soil and foliar insect pests on snap beans.
Materials and MethodsThis experiment was conducted at Arlington Agricultural Experiment Station in Arlington, WI in 2010. Snap bean, Phaseolus vulgaris var. ‘Caprice’, was seeded on 1 Jun at a rate of 8 seeds per foot within rows. Rows were 30 inches apart. The two-row plots were 5 ft wide by 20 ft long, for a total of 0.03 acres. Replicates were separated by two untreated rows. All plots were managed per commercial management practices.
Four replicates of 11 treatments and 1 untreated control were arranged in a randomized complete block design. The foliar treatments were applied 11 Jul when plants had reached the flowering and pin-bean development stage. Treatments were applied with a CO2 pressurized backpack sprayer with a 6’ boom operating at 29.2 psi delivering 24 gpa through 4 flat-fan nozzles (XR8003VS) spaced 18” apart while travelling at 3.5 ft / sec.
All plots were infested with ECB egg masses on 18 and 24 Jun and 8 Jul. In each plot for each pinning date, five successive plants were infested, each with five egg masses for a total of 25 egg masses applied in each plot.
Counts of emerged plants, fiddleheads and yellow plants per row were taken from 2 rows on 16 Jun. Counts of potato leafhopper (PLH), Empoasca fabae, nymphs (N) and adults (A), as well as aphid counts were taken from 20 sweeps in each plot on 13 Jul. Populations of ECB and associated damage estimates were surveyed 29 Jul, 18 days after the second insecticide application by counting (1) total number of damaged plants, (2) number of damaged stems per plant, (3) number of damaged pods, and (4) the number of viable larvae observed in both stems and pods. The survey was done only on the five plants that had been infested. Count data were log10 transformed prior to analysis. Proportion data were arcsin transformed prior to analysis. Means were separated using ANOVA with a Least Squared Difference (LSD) option.
Results and DiscussionSeed corn maggot levels were above average in the trial with damaged seedling (fiddlehead) numbers reaching an average of 20 plants per row in the untreated plots. Among the treatments evaluated the seed treatments provided a higher level of efficacy when compared to the in-furrow treatments. The in-furrow treatments proved to be ineffective with fiddlehead numbers similar to the untreated plots. European corn borer efficacy was achieved with both seed and in-furrow treatments. Both plant and pod damage was reduced in the treated plots.
26
Table 1.a. Mean stand measurements
Trt Rate Type*Stand Count
Fiddle-head
Yellow Plants
Untreated 46.9 e 20.0 ab 0.8 b-dCoragen625 FS 91 µg S 69.3 cd 11.3 a-d 1.0 b-d
Coragen625 FS 182 µg S 67.6 cd 8.5 b-e 0.0 d
Coragen625 FS 273 µg S 98.4 bc 8.0 ef 0.0 d
Coragen625 FS 91 µg
S 100.1 ab 4.1 ef 2.0 abYX8605 FS 91 µg
HGW86625 FS 91 µg S 86.5 a-c 6.0 d-f 2.0 a
HGW86625 FS 273 µg S 123.9 a 6.3 c-f 3.5 a
Cruiser5 FS 91 µg S 113.5 ab 2.9 f 3.5 a
Coragen1.67 SC 0.066 lb ai/a IF 60.5 de 13.5 a-c 1.0 a-c
Coragen1.67 SC 0.091 lb ai/a IF 69.3 cd 14.8 a-c 0.3 cd
HGW 8610 SE 10.1 oz/a
F 54.0 de 12.0 a-d 0.0 dMSO100 L 0.5 % v/v
Coragen1.67 SC 3.5 oz/a
F 46.9 e 20.1 a 1.0 a-cMSO100 EC 0.5 % v/v
P <.0001 <.0001 <.0001LSD 0.3213 0.8491 2.7047
b. Mean sweep net counts
PLHA
PLHN Aphids
2.5 3.8 0.5
6.0 4.8 0.5
1.0 1.5 0.3
3.3 1.5 2.5
1.5 0.8 0.5
3.3 1.5 0.0
2.8 1.5 0.5
1.3 1.0 0.3
3.3 3.3 0.5
1.0 1.0 0.0
4.0 1.3 0.3
2.5 1.0 1.0
0.062 0.316 0.92322.2881 3.7004 3.5268
c. Mean damage, larval numbers and yieldProportion Damaged
Plants
Proportion Damaged
Pods# Larvae in Stem
# Larvae in Pod
Calculated Yield
(ton/a)1.0 a 0.1 ab 6.8 a 2.8 2.8
0.7 bc 0.1 a 1.8 ab 3.0 5.2
0.7 bc 0.0 bc 5.0 a 1.5 4.6
0.7 b 0.1 ab 1.3 a-c 0.8 6.7
0.7 b 0.1 a 2.8 a 3.0 5.6
0.8 ab 0.1 ab 3.0 ab 1.5 4.9
0.8 ab 0.1 a 4.0 a 3.0 6.1
0.8 ab 0.1 a 3.5 a 3.0 6.4
0.3 d 0.0 c 0.3 cd 0.5 5.7
0.4 cd 0.0 c 0.3 cd 0.3 4.5
0.4 cd 0.0 c 1.0 b-d 0.0 4.0
0.1 d 0.0 c 0.0 d 0.0 3.7
<.0001 <.0001 <.0001 0.2617 0.22640.4949 0.1734 2.7662 3.8374 0.5882
*S = Seed treatment, IF = In furrow, F = Foliar
27
Foliar insecticide treatments for the control of tomato fruitworm in Wisconsin fresh market tomato production
Purpose: The purpose of this experiment was to evaluate various foliar-applied, registered insecticides targeting early larval instars of tomato fruitworm (TFW), Helicoverpa zea, infesting tomato fruit
Materials and MethodsThis experiment was conducted at Arlington Agricultural Experiment Station in Arlington, WI in 2010. Tomato, Solanum lycopersicon cv. ‘Celebrity’, transplants were planted 25 May. Plants were spaced 36 inches apart within rows. Rows were 6 ft apart. Plots were single rows, 6 ft wide by 30 ft long, for a total of 0.004 acres. Replicates were separated by a 12 border of bare ground. The trial was established over black plastic and was trellised at regular intervals through the growing season using the Florida weave. The trial was sprinkler irrigated and plots managed according to commercial herbicide and fungicide recommendations for weed control and control of the late blight pathogen.
Each plot was infested with TFW egg masses on 29 Jul. In each plot, five successive plants were infested, each with five egg masses for a total of 25 egg masses applied in each plot. Egg masses were attached to plants mid-canopy and onto a fruit “hand” with green fruit. Each egg mass contained approximately 150-400 eggs / mass.
Four replicates of 6 experimental foliar treatments and 1 untreated control were arranged in a randomized complete block design. The treatments were applied 29 Jul when the crop development had reached maturation of the first fruit clusters in lower canopy positions. Treatments were applied by a CO2 pressurized backpack sprayer with a 6’ boom operating at 42 psi delivering 29.4 gpa through 4 flat-fan nozzles (8002VS-XR) spaced 18” apart @ 3.5 ft / sec. Subsequent sprays followed on weekly intervals following initial application.
Populations of TFW and associated damage estimates were surveyed 18 August following the third application of insecticide by counting (1) total number of fruit, (2) the weight in pounds of fruit (3) number of damaged fruit, and (4) the number of viable larvae observed in fruit. Counts were taken from the five plants that had been pinned. See Table 1 for a summary of key field activity dates. Count data were log10 transformed prior to analysis. Proportion data were arcsin transformed prior to analysis. Means were separated using ANOVA with a Least Squared Difference (LSD) option (P=0.05). Data are presented in Table 2.
Table 1. Summary of key field activity dates.Action Planting Infestation Insecticide app. EvaluationDate 25 May 29 Jul 1 Aug 18 Aug
Days from last action 3 20
28
Results and DiscussionNatural populations of tomato fruitworm at the experimental site (AAES) are annually variable and require that experimental plots be artificially infested with test insects to ensure an adequate pest pressure. Established infestation levels in the experimental plots and particularly the UTC were considered adequate for the experimental trial.
Table 2. Mean larval counts and yield and damage estimates.
Treatment Rate Tot No. Fruit Weight (lb) No. damaged fruitProportion
Damaged Fruit Total LarvaeUntreated 57.1 28.0 9.0 a 0.2 a 0.7 aRimon 0.83 EC 12 fl oz/a 56.0 25.5 3.6 ab 0.1 bc 0.2 bRimon 0.83 EC 9 fl oz/a 50.8 22.6 4.6 ab 0.1 b 0.2 bRimon 0.83 EC 12 fl oz/a 50.8 25.8 1.8 c 0.0 cd 0.0 bWarrior 1 CS 3.84 fl oz/aRimon 0.83 EC 9 fl oz/a 55.2 27.4 2.4 bc 0.0 b-d 0.0 bWarrior 2 CS 2.56 fl oz/aRimon 0.83 EC 12 fl oz/a 56.2 25.5 1.2 c 0.0 d 0.0 bProvado 1.6 F 3.8 fl oz/aCoragen 1.67 SC 5 fl oz/a 47.4 24.9 3.3 a-c 0.1 bc 0.0 b
P 0.2248 0.1366 0.0068 <.0001 <.0001LSD 0.1978 0.2102 1.47 0.0845 0.802
29