Embed Size (px)
Citation preview
Labview Virtual Instrument Based on Intelligent
Management and Monitoring of Microclimate in Precision
Pig Farming with Wireless Sensor Network
Belma Gaazi, Plamen Daskalov, Tsvetelina Georgieva, and Eleonora Kirilova Department of Autromatics and Mechatronics, Ruse 7017, Bulgaria
Email: {bgaazi, pdaskalov, cgeorgieva, ekirilova}@uni-ruse.bg
Abstract—The article proposes a Labview based virtual
instrument for visualization on technological and economic
parameters in precision pig farming with WSN (Wireless Sensor
Network). The dynamic economic model is applied in the
virtual instrument, which calculates the economic effective
temperature with a direct search optimization algorithm. On the
front panel are visualized the current values of profit, feed
consumption and heating depending on the input and measured
parameters. Based on the received data, the relevant outputs for
the control are activated. The proposed system offers a useful
cost-effective way to manage in the precision pig farm. Index Terms—Labview, WSN, precision pig farming,
economic effective temperature
I. INTRODUCTION
Pig farming in Bulgaria is one of the most promising
branches of stock breeding in Bulgaria. In the context of
increasing competition, more and more efforts are being
made to improve the quality and reduce the cost of
production [26]. To achieve this goal, it is necessary to
improve the living environment in the livestock housing
and lower energy costs, with emphasis on computer based
management support and real-time production monitoring
capabilities with state-of-the-art computer technology and
wireless sensors networks [1]-[3]. The application of
wireless sensing networks in the field of agriculture is an
increasingly widely used technological innovation in
building decision-making systems to solve and facilitate a
number of problems in this sector [4], [5], [8], [9], [19].
Therefore, in advanced precision farming, sensor data
networks are used to derive the optimal solution for
managing and adjusting environmental parameters to
achieve higher productivity and optimize resource use [7],
[10], [11].
Modernization in the field of agriculture is needed in
order to develop and it is necessary to emphasize the
automated processes with decision-making systems [25],
[27]. New concepts of information management mean
that farmers need to be ready to acquire skills to use new
Manuscript received April 30, 2018; revised August 16, 2018.
This work was supported by Project No BG05M20P001-2.009-0011
''Support for the development of human resources in Research and
Innovation at Ruse University ‘A. Kanchev’” Corresponding author email: [email protected].
doi:10.12720/jcm.13.9.530-534
technologies to collect and analyze data coming from
sensors in different formats [10], [15].
The microclimate in livestock breeding must provide
an optimum animal environment, which in turn
influences the growth, consumption of feed, which
determines the economic efficiency of the production.
One of the main components that increase productivity in
agriculture is the choice of appropriate management
technology, and it is related to the efficient and
economical use of energy resources with the potential to
reduce production costs [23], [24]. The main task in
livestock management is choosing the right temperature
to maximize growth and minimize feed costs. The aim is
not to choose the biologically optimal temperature by a
norm [21] but to calculate the cost-effective internal
temperature in relation to the other factors influencing it
[22].
This article presents the concept of a virtual
supervision system enabling the control and monitoring
of the temperature at the pig farm. Therefore it will be
possible to improve the comfort of use of the system, to
increase growth and to reduce the energy costs by
optimization algorithm.
Three tasks are essential to achieve precise control of
the production environment: 1) monitoring the
microclimatic parameters [6], [12], [13]; 2) analysis of
observed data and decision-making, accompanied by
optimization [25]; and 3) application of control
mechanisms.
II. STRUCTURE SCHEME OF THE SYSTEM
The system is a set of input and output parameters,
some of which are setting by an operator such as:
'm' – the mass of the animal, kg;
'Np' - Number of animals kept in the building,, pcs.
'da' - humidity of outdoor atmospheric air, g/kg
and 'Vw' - wind speed, m/s is the average for the season,
'Gb' - the air exchange in the building is set according to
the norm basis for the type and age of farmed animals,
m/s.
'CenaQf' - current price of electricity for
business customers, BGN/kWh,
'CenaF' - average price of fodder, BGN/kg and
'CenaM' - average purchase price of pork meal, BGN/kg.
530
Journal of Communications Vol. 13, No. 9, September 2018
©2018 Journal of Communications
'ta' and 'tb' are the measured current values of the
external and internal temperature of the sensor
devices, °C.
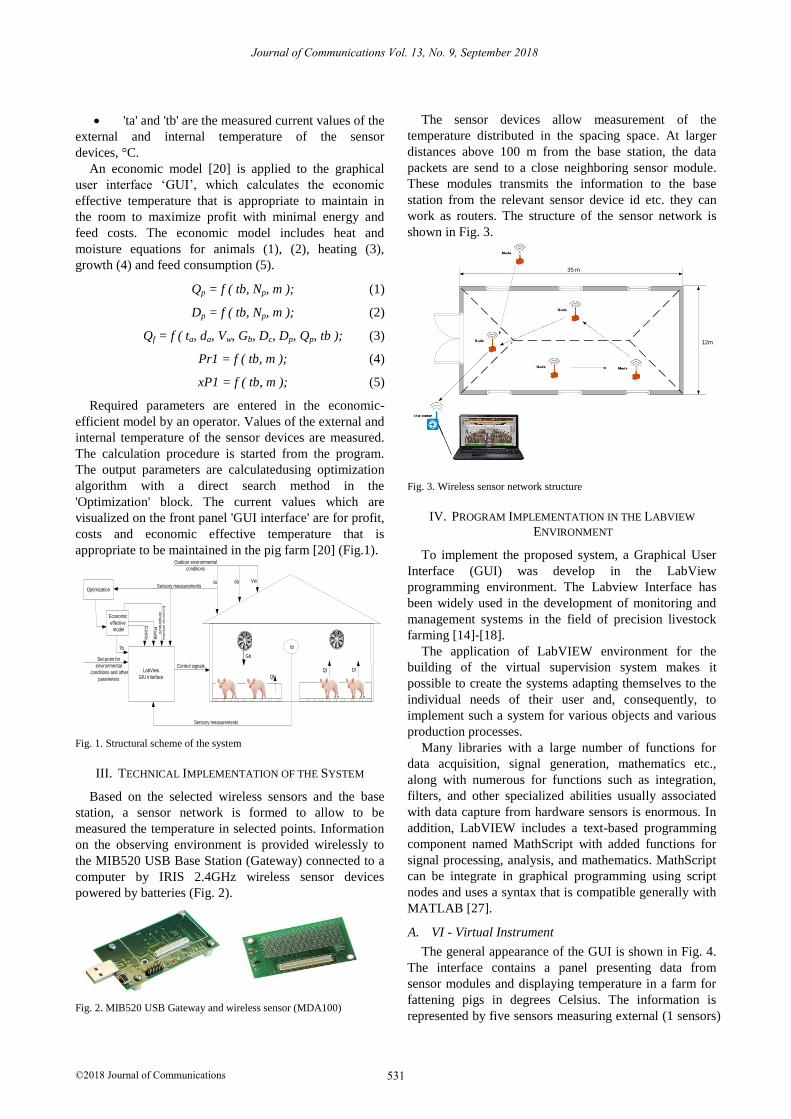
An economic model [20] is applied to the graphical
user interface ‘GUI’, which calculates the economic
effective temperature that is appropriate to maintain in
the room to maximize profit with minimal energy and
feed costs. The economic model includes heat and
moisture equations for animals (1), (2), heating (3),
growth (4) and feed consumption (5).
Qp = f ( tb, Np, m ); (1)
Dp = f ( tb, Np, m ); (2)
Qf = f ( ta, da, Vw, Gb, Dc, Dp, Qp, tb ); (3)
Pr1 = f ( tb, m ); (4)
xP1 = f ( tb, m ); (5)
Required parameters are entered in the economic-
efficient model by an operator. Values of the external and
internal temperature of the sensor devices are measured.
The calculation procedure is started from the program.
The output parameters are calculatedusing optimization
algorithm with a direct search method in the
'Optimization' block. The current values which are
visualized on the front panel 'GUI interface' are for profit,
costs and economic effective temperature that is
appropriate to be maintained in the pig farm [20] (Fig.1).
Fig. 1. Structural scheme of the system
III. TECHNICAL IMPLEMENTATION OF THE SYSTEM
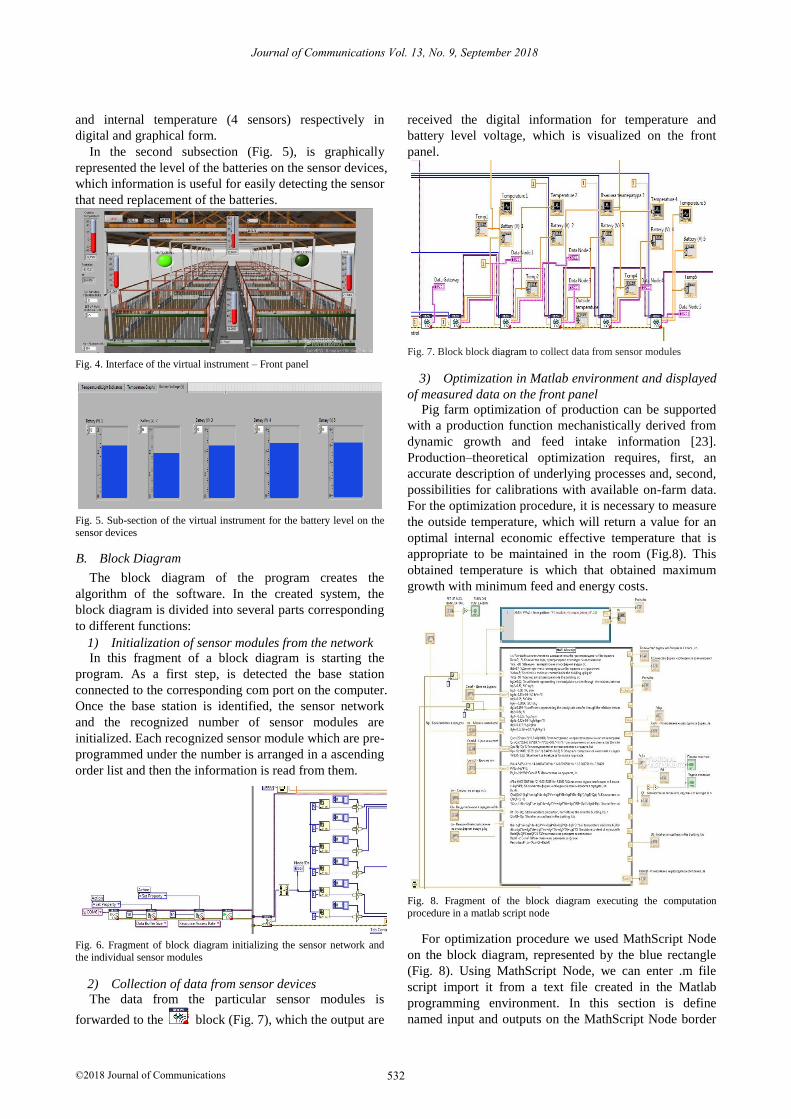
Based on the selected wireless sensors and the base
station, a sensor network is formed to allow to be
measured the temperature in selected points. Information
on the observing environment is provided wirelessly to
the MIB520 USB Base Station (Gateway) connected to a
computer by IRIS 2.4GHz wireless sensor devices
powered by batteries (Fig. 2).
Fig. 2. MIB520 USB Gateway and wireless sensor (MDA100)
The sensor devices allow measurement of the
temperature distributed in the spacing space. At larger
distances above 100 m from the base station, the data
packets are send to a close neighboring sensor module.
These modules transmits the information to the base
station from the relevant sensor device id etc. they can
work as routers. The structure of the sensor network is
shown in Fig. 3.
Fig. 3. Wireless sensor network structure
IV. PROGRAM IMPLEMENTATION IN THE LABVIEW
ENVIRONMENT
To implement the proposed system, a Graphical User
Interface (GUI) was develop in the LabView
programming environment. The Labview Interface has
been widely used in the development of monitoring and
management systems in the field of precision livestock
farming [14]-[18].
The application of LabVIEW environment for the
building of the virtual supervision system makes it
possible to create the systems adapting themselves to the
individual needs of their user and, consequently, to
implement such a system for various objects and various
production processes.
Many libraries with a large number of functions for
data acquisition, signal generation, mathematics etc.,
along with numerous for functions such as integration,
filters, and other specialized abilities usually associated
with data capture from hardware sensors is enormous. In
addition, LabVIEW includes a text-based programming
component named MathScript with added functions for
signal processing, analysis, and mathematics. MathScript
can be integrate in graphical programming using script
nodes and uses a syntax that is compatible generally with
MATLAB [27].
A. VI - Virtual Instrument
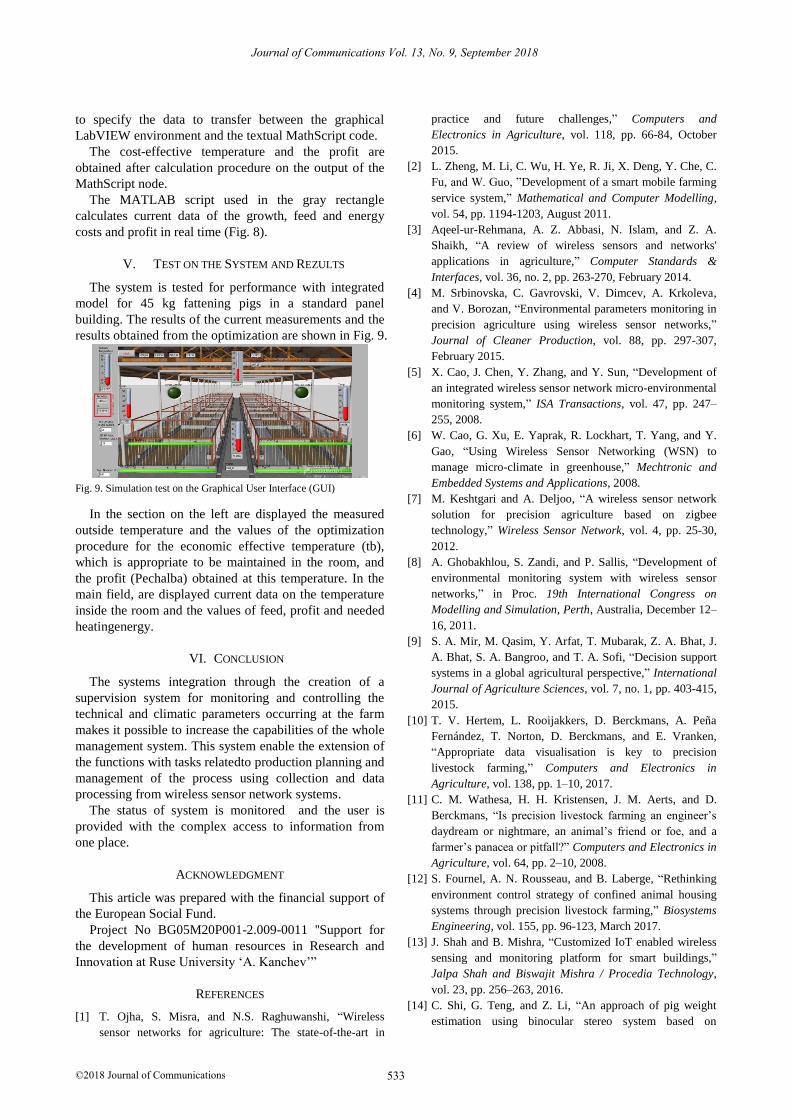
The general appearance of the GUI is shown in Fig. 4.
The interface contains a panel presenting data from
sensor modules and displaying temperature in a farm for
fattening pigs in degrees Celsius. The information is
represented by five sensors measuring external (1 sensors)
ta da Vw
Qt Dt
Outdoor environmental
conditions
LabView
GIU interface
Gb
Optimization
Sensory measurements
Sensory measurements
Set-point for
environmental
conditions and other
parameters
Economic
effective
model
tb
Control signals
Tb
Qf
Pro
fit
Co
sts
Eco
no
mic
effe
ctiv
e
tem
pe
ratu
re
35 m
12m
531
Journal of Communications Vol. 13, No. 9, September 2018
©2018 Journal of Communications
and internal temperature (4 sensors) respectively in
digital and graphical form.
In the second subsection (Fig. 5), is graphically
represented the level of the batteries on the sensor devices,
which information is useful for easily detecting the sensor
that need replacement of the batteries.
Fig. 4. Interface of the virtual instrument – Front panel
Fig. 5. Sub-section of the virtual instrument for the battery level on the
sensor devices
B. Block Diagram
The block diagram of the program creates the
algorithm of the software. In the created system, the
block diagram is divided into several parts corresponding
to different functions:
1) Initialization of sensor modules from the network
In this fragment of a block diagram is starting the
program. As a first step, is detected the base station
connected to the corresponding com port on the computer.
Once the base station is identified, the sensor network
and the recognized number of sensor modules are
initialized. Each recognized sensor module which are pre-
programmed under the number is arranged in a ascending
order list and then the information is read from them.
Fig. 6. Fragment of block diagram initializing the sensor network and
the individual sensor modules
2) Collection of data from sensor devices
The data from the particular sensor modules is
forwarded to the block (Fig. 7), which the output are
received the digital information for temperature and
battery level voltage, which is visualized on the front
panel.
Fig. 7. Block block diagram to collect data from sensor modules
3) Optimization in Matlab environment and displayed
of measured data on the front panel
Pig farm optimization of production can be supported
with a production function mechanistically derived from
dynamic growth and feed intake information [23].
Production–theoretical optimization requires, first, an
accurate description of underlying processes and, second,
possibilities for calibrations with available on-farm data.
For the optimization procedure, it is necessary to measure
the outside temperature, which will return a value for an
optimal internal economic effective temperature that is
appropriate to be maintained in the room (Fig.8). This
obtained temperature is which that obtained maximum
growth with minimum feed and energy costs.
Fig. 8. Fragment of the block diagram executing the computation
procedure in a matlab script node
For optimization procedure we used MathScript Node
on the block diagram, represented by the blue rectangle
(Fig. 8). Using MathScript Node, we can enter .m file
script import it from a text file created in the Matlab
programming environment. In this section is define
named input and outputs on the MathScript Node border
532
Journal of Communications Vol. 13, No. 9, September 2018
©2018 Journal of Communications
to specify the data to transfer between the graphical
LabVIEW environment and the textual MathScript code.
The cost-effective temperature and the profit are
obtained after calculation procedure on the output of the
MathScript node.
The MATLAB script used in the gray rectangle
calculates current data of the growth, feed and energy
costs and profit in real time (Fig. 8).
V. TEST ON THE SYSTEM AND REZULTS
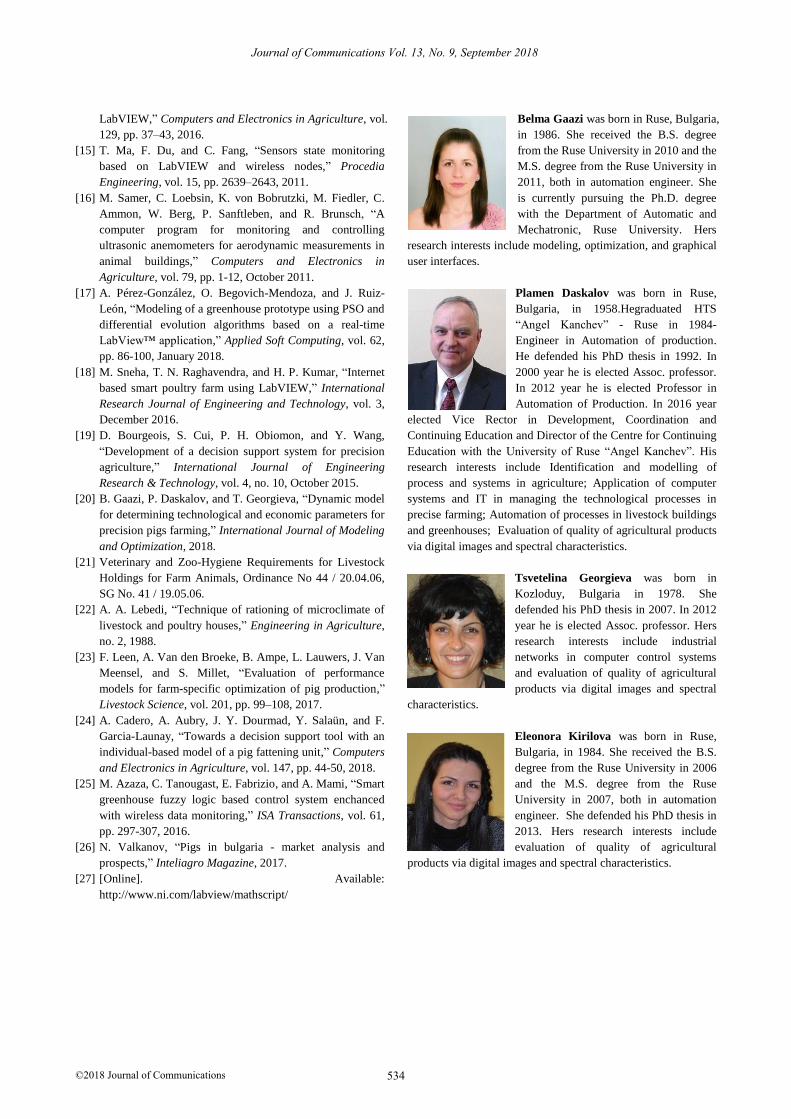
The system is tested for performance with integrated
model for 45 kg fattening pigs in a standard panel
building. The results of the current measurements and the
results obtained from the optimization are shown in Fig. 9.
Fig. 9. Simulation test on the Graphical User Interface (GUI)
In the section on the left are displayed the measured
outside temperature and the values of the optimization
procedure for the economic effective temperature (tb),
which is appropriate to be maintained in the room, and
the profit (Pechalba) obtained at this temperature. In the
main field, are displayed current data on the temperature
inside the room and the values of feed, profit and needed
heatingenergy.
VI. CONCLUSION
The systems integration through the creation of a
supervision system for monitoring and controlling the
technical and climatic parameters occurring at the farm
makes it possible to increase the capabilities of the whole
management system. This system enable the extension of
the functions with tasks relatedto production planning and
management of the process using collection and data
processing from wireless sensor network systems.
The status of system is monitored and the user is
provided with the complex access to information from
one place.
ACKNOWLEDGMENT
This article was prepared with the financial support of
the European Social Fund.
Project No BG05M20P001-2.009-0011 ''Support for
the development of human resources in Research and
Innovation at Ruse University ‘A. Kanchev’”
REFERENCES
[1] T. Ojha, S. Misra, and N.S. Raghuwanshi, “Wireless
sensor networks for agriculture: The state-of-the-art in
practice and future challenges,” Computers and
Electronics in Agriculture, vol. 118, pp. 66-84, October
2015.
[2] L. Zheng, M. Li, C. Wu, H. Ye, R. Ji, X. Deng, Y. Che, C.
Fu, and W. Guo, ”Development of a smart mobile farming
service system,” Mathematical and Computer Modelling,
vol. 54, pp. 1194-1203, August 2011.
[3] Aqeel-ur-Rehmana, A. Z. Abbasi, N. Islam, and Z. A.
Shaikh, “A review of wireless sensors and networks'
applications in agriculture,” Computer Standards &
Interfaces, vol. 36, no. 2, pp. 263-270, February 2014.
[4] M. Srbinovska, C. Gavrovski, V. Dimcev, A. Krkoleva,
and V. Borozan, “Environmental parameters monitoring in
precision agriculture using wireless sensor networks,”
Journal of Cleaner Production, vol. 88, pp. 297-307,
February 2015.
[5] X. Cao, J. Chen, Y. Zhang, and Y. Sun, “Development of
an integrated wireless sensor network micro-environmental
monitoring system,” ISA Transactions, vol. 47, pp. 247–
255, 2008.
[6] W. Cao, G. Xu, E. Yaprak, R. Lockhart, T. Yang, and Y.
Gao, “Using Wireless Sensor Networking (WSN) to
manage micro-climate in greenhouse,” Mechtronic and
Embedded Systems and Applications, 2008.
[7] M. Keshtgari and A. Deljoo, “A wireless sensor network
solution for precision agriculture based on zigbee
technology,” Wireless Sensor Network, vol. 4, pp. 25-30,
2012.
[8] A. Ghobakhlou, S. Zandi, and P. Sallis, “Development of
environmental monitoring system with wireless sensor
networks,” in Proc. 19th International Congress on
Modelling and Simulation, Perth, Australia, December 12–
16, 2011.
[9] S. A. Mir, M. Qasim, Y. Arfat, T. Mubarak, Z. A. Bhat, J.
A. Bhat, S. A. Bangroo, and T. A. Sofi, “Decision support
systems in a global agricultural perspective,” International
Journal of Agriculture Sciences, vol. 7, no. 1, pp. 403-415,
2015.
[10] T. V. Hertem, L. Rooijakkers, D. Berckmans, A. Peña
Fernández, T. Norton, D. Berckmans, and E. Vranken,
“Appropriate data visualisation is key to precision
livestock farming,” Computers and Electronics in
Agriculture, vol. 138, pp. 1–10, 2017.
[11] C. M. Wathesa, H. H. Kristensen, J. M. Aerts, and D.
Berckmans, “Is precision livestock farming an engineer’s
daydream or nightmare, an animal’s friend or foe, and a
farmer’s panacea or pitfall?” Computers and Electronics in
Agriculture, vol. 64, pp. 2–10, 2008.
[12] S. Fournel, A. N. Rousseau, and B. Laberge, “Rethinking
environment control strategy of confined animal housing
systems through precision livestock farming,” Biosystems
Engineering, vol. 155, pp. 96-123, March 2017.
[13] J. Shah and B. Mishra, “Customized IoT enabled wireless
sensing and monitoring platform for smart buildings,”
Jalpa Shah and Biswajit Mishra / Procedia Technology,
vol. 23, pp. 256–263, 2016.
[14] C. Shi, G. Teng, and Z. Li, “An approach of pig weight
estimation using binocular stereo system based on
533
Journal of Communications Vol. 13, No. 9, September 2018
©2018 Journal of Communications
LabVIEW,” Computers and Electronics in Agriculture, vol.
129, pp. 37–43, 2016.
[15] T. Ma, F. Du, and C. Fang, “Sensors state monitoring
based on LabVIEW and wireless nodes,” Procedia
Engineering, vol. 15, pp. 2639–2643, 2011.
[16] M. Samer, C. Loebsin, K. von Bobrutzki, M. Fiedler, C.
Ammon, W. Berg, P. Sanftleben, and R. Brunsch, “A
computer program for monitoring and controlling
ultrasonic anemometers for aerodynamic measurements in
animal buildings,” Computers and Electronics in
Agriculture, vol. 79, pp. 1-12, October 2011.
[17] A. Pérez-González, O. Begovich-Mendoza, and J. Ruiz-
León, “Modeling of a greenhouse prototype using PSO and
differential evolution algorithms based on a real-time
LabView™ application,” Applied Soft Computing, vol. 62,
pp. 86-100, January 2018.
[18] M. Sneha, T. N. Raghavendra, and H. P. Kumar, “Internet
based smart poultry farm using LabVIEW,” International
Research Journal of Engineering and Technology, vol. 3,
December 2016.
[19] D. Bourgeois, S. Cui, P. H. Obiomon, and Y. Wang,
“Development of a decision support system for precision
agriculture,” International Journal of Engineering
Research & Technology, vol. 4, no. 10, October 2015.
[20] B. Gaazi, P. Daskalov, and T. Georgieva, “Dynamic model
for determining technological and economic parameters for
precision pigs farming,” International Journal of Modeling
and Optimization, 2018.
[21] Veterinary and Zoo-Hygiene Requirements for Livestock
Holdings for Farm Animals, Ordinance No 44 / 20.04.06,
SG No. 41 / 19.05.06.
[22] A. A. Lebedi, “Technique of rationing of microclimate of
livestock and poultry houses,” Engineering in Agriculture,
no. 2, 1988.
[23] F. Leen, A. Van den Broeke, B. Ampe, L. Lauwers, J. Van
Meensel, and S. Millet, “Evaluation of performance
models for farm-specific optimization of pig production,”
Livestock Science, vol. 201, pp. 99–108, 2017.
[24] A. Cadero, A. Aubry, J. Y. Dourmad, Y. Salaün, and F.
Garcia-Launay, “Towards a decision support tool with an
individual-based model of a pig fattening unit,” Computers
and Electronics in Agriculture, vol. 147, pp. 44-50, 2018.
[25] M. Azaza, C. Tanougast, E. Fabrizio, and A. Mami, “Smart
greenhouse fuzzy logic based control system enchanced
with wireless data monitoring,” ISA Transactions, vol. 61,
pp. 297-307, 2016.
[26] N. Valkanov, “Pigs in bulgaria - market analysis and
prospects,” Inteliagro Magazine, 2017.
[27] [Online]. Available:
http://www.ni.com/labview/mathscript/
Belma Gaazi was born in Ruse, Bulgaria,
in 1986. She received the B.S. degree
from the Ruse University in 2010 and the
M.S. degree from the Ruse University in
2011, both in automation engineer. She
is currently pursuing the Ph.D. degree
with the Department of Automatic and
Mechatronic, Ruse University. Hers
research interests include modeling, optimization, and graphical
user interfaces.
Plamen Daskalov was born in Ruse,
Bulgaria, in 1958.Hegraduated HTS
“Angel Kanchev” - Ruse in 1984-
Engineer in Automation of production.
He defended his PhD thesis in 1992. In
2000 year he is elected Assoc. professor.
In 2012 year he is elected Professor in
Automation of Production. In 2016 year
elected Vice Rector in Development, Coordination and
Continuing Education and Director of the Centre for Continuing
Education with the University of Ruse “Angel Kanchev”. His
research interests include Identification and modelling of
process and systems in agriculture; Application of computer
systems and IT in managing the technological processes in
precise farming; Automation of processes in livestock buildings
and greenhouses; Evaluation of quality of agricultural products
via digital images and spectral characteristics.
Tsvetelina Georgieva was born in
Kozloduy, Bulgaria in 1978. She
defended his PhD thesis in 2007. In 2012
year he is elected Assoc. professor. Hers
research interests include industrial
networks in computer control systems
and evaluation of quality of agricultural
products via digital images and spectral
characteristics.
Eleonora Kirilova was born in Ruse,
Bulgaria, in 1984. She received the B.S.
degree from the Ruse University in 2006
and the M.S. degree from the Ruse
University in 2007, both in automation
engineer. She defended his PhD thesis in
2013. Hers research interests include
evaluation of quality of agricultural
products via digital images and spectral characteristics.
534
Journal of Communications Vol. 13, No. 9, September 2018
©2018 Journal of Communications