Embed Size (px)
Citation preview
Lac qui Parle County Data Book 2010 Southwest/South Central Adult Health Survey
D E C E M B E R 2 0 1 0
Lac qui Parle County Data Book 2010 Southwest/South Central Adult Health Survey
December 2010
Prepared by:
Wilder Research 451 Lexington Parkway North Saint Paul, Minnesota 55104 651-280-2700 www.wilderresearch.org
Lac qui Parle County Data Book Wilder Research, December 2010 2010 Southwest/South Central Adult Health Survey
Contents Introduction ......................................................................................................................... 1
Section A. General health .............................................................................................. 3
Section B. Eating habits ............................................................................................... 14
Section C. Physical activity ......................................................................................... 30
Section D. Your local area ........................................................................................... 53
Section E. Tobacco use ................................................................................................ 81
Section F. Health concerns .......................................................................................... 98
Section G. About you ................................................................................................. 104
Appendix ......................................................................................................................... 111
Detailed study methodology ....................................................................................... 113
Survey instrument ....................................................................................................... 116
Lac qui Parle County Data Book Wilder Research, December 2010 2010 Southwest/South Central Adult Health Survey
Acknowledgments We would like to thank the residents of Southwest and South Central Minnesota who completed the survey upon which this data book is based.
In addition, we would like to thank the public health staff who contributed to the completion of this study, including: BobbiJo Berg, Carol Biren, Michelle Breidenbach, Roxanne Erickson, Bonnie Frisk, Bonnie Frederickson, Craig Miller, Karen Moritz, Cindy Skulstad, and Becky Weber. We would also like to thank Ann Kinney, from the Minnesota Department of Health, for the technical assistance she provided.
The following Wilder Research staff worked on this study:
Natalie Alizaga Mark Anton Rena Cleveland Marilyn Conrad Phil Cooper Diane Elwood Janell Felker Louann Graham Nancy Hartzler
Muneer Karcher-Ramos Margaree Levy Bryan Lloyd Dolores Martin Nicole MartinRogers Alicia Matos Miguel Salazar Dan Swanson Lue Thao Mary Ann Thoma
This study was funded by the Minnesota Department of Health’s Statewide Health Improvement Program (SHIP).
Lac qui Parle County Data Book Wilder Research, December 2010 2010 Southwest/South Central Adult Health Survey
1
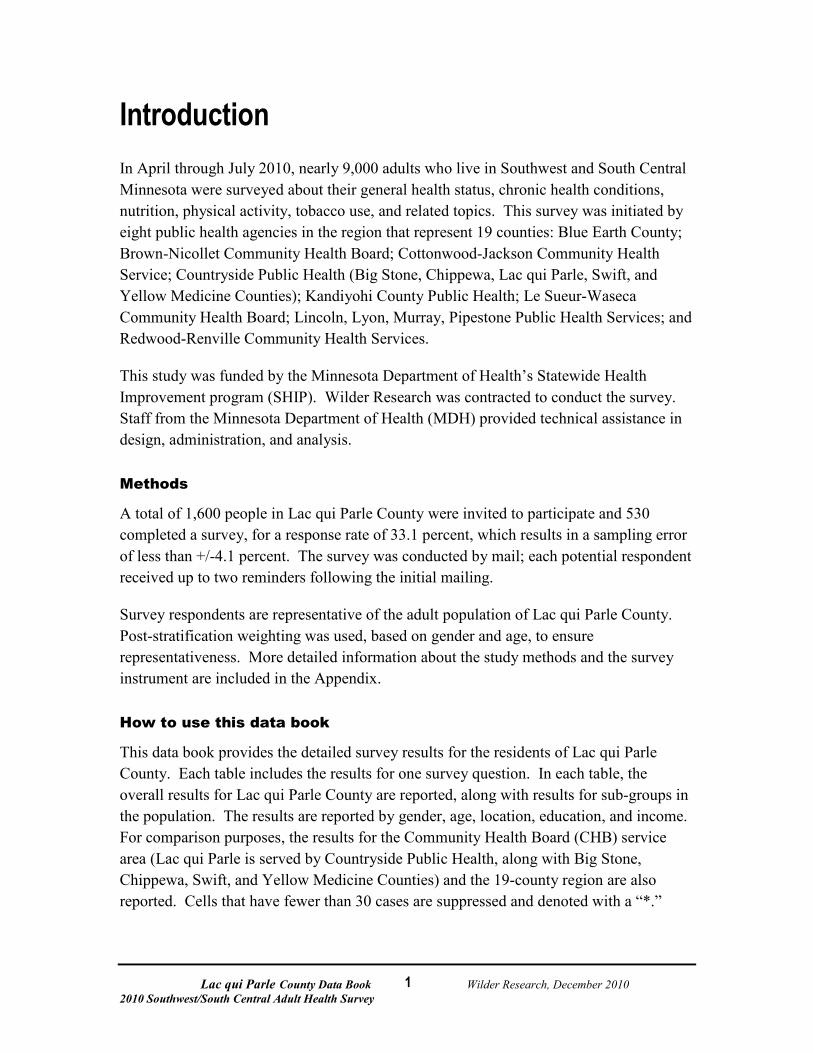
Introduction In April through July 2010, nearly 9,000 adults who live in Southwest and South Central Minnesota were surveyed about their general health status, chronic health conditions, nutrition, physical activity, tobacco use, and related topics. This survey was initiated by eight public health agencies in the region that represent 19 counties: Blue Earth County; Brown-Nicollet Community Health Board; Cottonwood-Jackson Community Health Service; Countryside Public Health (Big Stone, Chippewa, Lac qui Parle, Swift, and Yellow Medicine Counties); Kandiyohi County Public Health; Le Sueur-Waseca Community Health Board; Lincoln, Lyon, Murray, Pipestone Public Health Services; and Redwood-Renville Community Health Services.
This study was funded by the Minnesota Department of Health’s Statewide Health Improvement program (SHIP). Wilder Research was contracted to conduct the survey. Staff from the Minnesota Department of Health (MDH) provided technical assistance in design, administration, and analysis.
Methods
A total of 1,600 people in Lac qui Parle County were invited to participate and 530 completed a survey, for a response rate of 33.1 percent, which results in a sampling error of less than +/-4.1 percent. The survey was conducted by mail; each potential respondent received up to two reminders following the initial mailing.
Survey respondents are representative of the adult population of Lac qui Parle County. Post-stratification weighting was used, based on gender and age, to ensure representativeness. More detailed information about the study methods and the survey instrument are included in the Appendix.
How to use this data book
This data book provides the detailed survey results for the residents of Lac qui Parle County. Each table includes the results for one survey question. In each table, the overall results for Lac qui Parle County are reported, along with results for sub-groups in the population. The results are reported by gender, age, location, education, and income. For comparison purposes, the results for the Community Health Board (CHB) service area (Lac qui Parle is served by Countryside Public Health, along with Big Stone, Chippewa, Swift, and Yellow Medicine Counties) and the 19-county region are also reported. Cells that have fewer than 30 cases are suppressed and denoted with a “*.”
Lac qui Parle County Data Book Wilder Research, December 2010 2010 Southwest/South Central Adult Health Survey
2
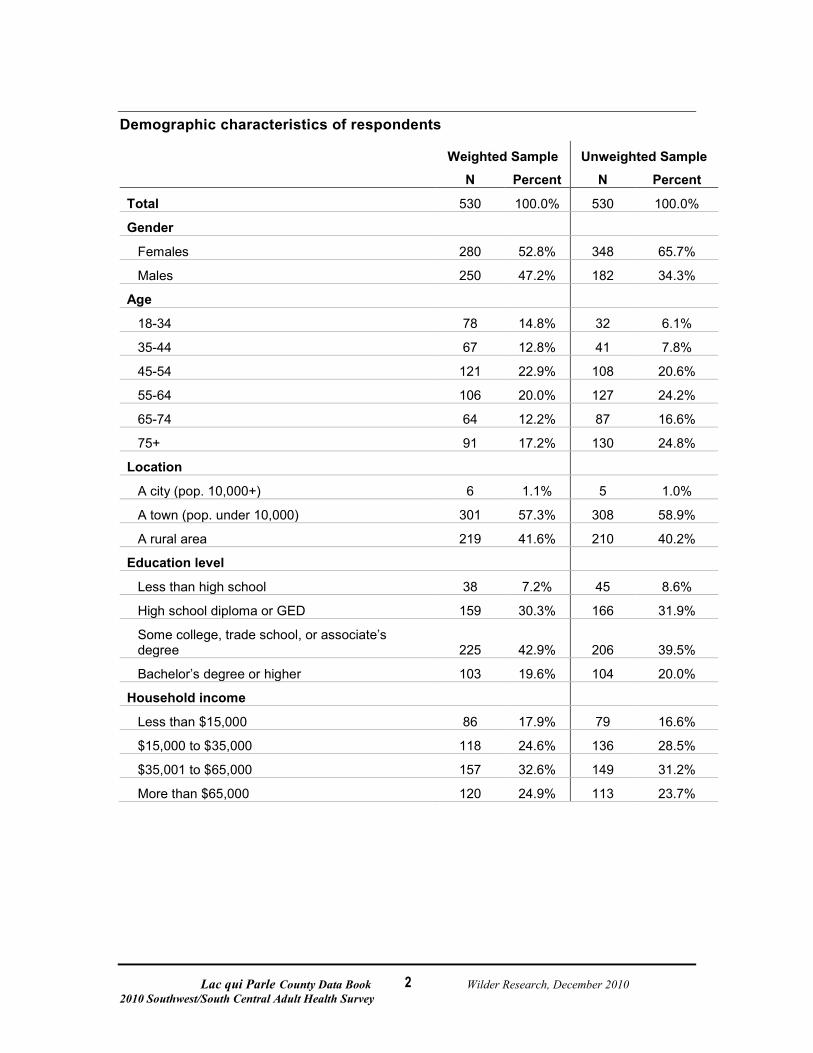
Demographic characteristics of respondents
Weighted Sample Unweighted Sample
N Percent N Percent
Total 530 100.0% 530 100.0%
Gender
Females 280 52.8% 348 65.7%
Males 250 47.2% 182 34.3%
Age
18-34 78 14.8% 32 6.1%
35-44 67 12.8% 41 7.8%
45-54 121 22.9% 108 20.6%
55-64 106 20.0% 127 24.2%
65-74 64 12.2% 87 16.6%
75+ 91 17.2% 130 24.8%
Location
A city (pop. 10,000+) 6 1.1% 5 1.0%
A town (pop. under 10,000) 301 57.3% 308 58.9%
A rural area 219 41.6% 210 40.2%
Education level
Less than high school 38 7.2% 45 8.6%
High school diploma or GED 159 30.3% 166 31.9%
Some college, trade school, or associate’s degree 225 42.9% 206 39.5%
Bachelor’s degree or higher 103 19.6% 104 20.0%
Household income
Less than $15,000 86 17.9% 79 16.6%
$15,000 to $35,000 118 24.6% 136 28.5%
$35,001 to $65,000 157 32.6% 149 31.2%
More than $65,000 120 24.9% 113 23.7%
Lac qui Parle County Data Book Wilder Research, December 2010 2010 Southwest/South Central Adult Health Survey
3
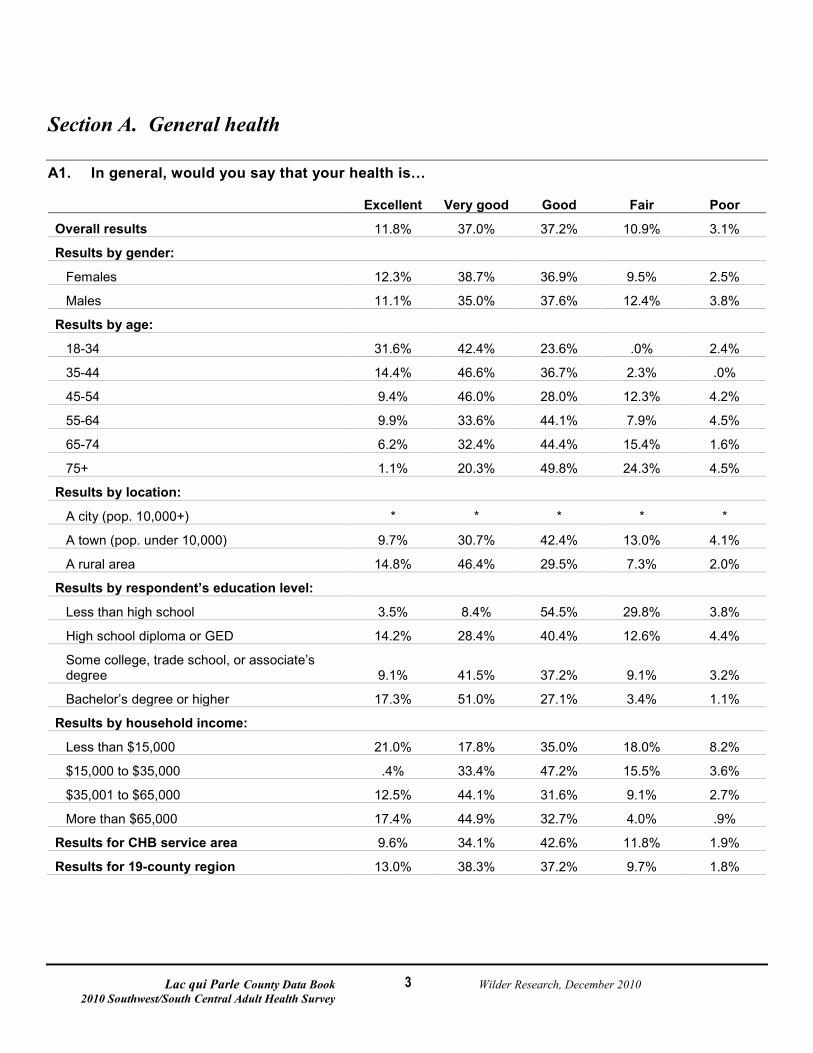
Section A. General health
A1. In general, would you say that your health is…
Excellent Very good Good Fair Poor
Overall results 11.8% 37.0% 37.2% 10.9% 3.1%
Results by gender:
Females 12.3% 38.7% 36.9% 9.5% 2.5%
Males 11.1% 35.0% 37.6% 12.4% 3.8%
Results by age:
18-34 31.6% 42.4% 23.6% .0% 2.4%
35-44 14.4% 46.6% 36.7% 2.3% .0%
45-54 9.4% 46.0% 28.0% 12.3% 4.2%
55-64 9.9% 33.6% 44.1% 7.9% 4.5%
65-74 6.2% 32.4% 44.4% 15.4% 1.6%
75+ 1.1% 20.3% 49.8% 24.3% 4.5%
Results by location:
A city (pop. 10,000+) * * * * *
A town (pop. under 10,000) 9.7% 30.7% 42.4% 13.0% 4.1%
A rural area 14.8% 46.4% 29.5% 7.3% 2.0%
Results by respondent’s education level:
Less than high school 3.5% 8.4% 54.5% 29.8% 3.8%
High school diploma or GED 14.2% 28.4% 40.4% 12.6% 4.4%
Some college, trade school, or associate’s degree 9.1% 41.5% 37.2% 9.1% 3.2%
Bachelor’s degree or higher 17.3% 51.0% 27.1% 3.4% 1.1%
Results by household income:
Less than $15,000 21.0% 17.8% 35.0% 18.0% 8.2%
$15,000 to $35,000 .4% 33.4% 47.2% 15.5% 3.6%
$35,001 to $65,000 12.5% 44.1% 31.6% 9.1% 2.7%
More than $65,000 17.4% 44.9% 32.7% 4.0% .9%
Results for CHB service area 9.6% 34.1% 42.6% 11.8% 1.9%
Results for 19-county region 13.0% 38.3% 37.2% 9.7% 1.8%
Lac qui Parle County Data Book Wilder Research, December 2010 2010 Southwest/South Central Adult Health Survey
4
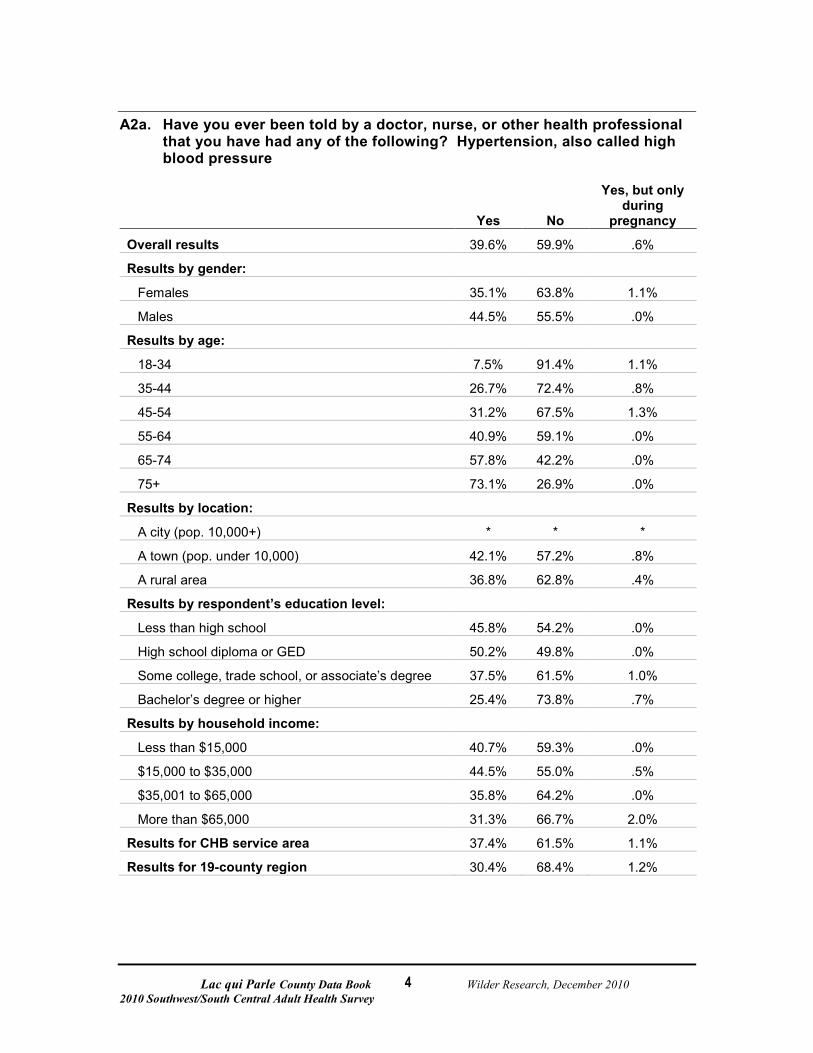
A2a. Have you ever been told by a doctor, nurse, or other health professional that you have had any of the following? Hypertension, also called high blood pressure
Yes No
Yes, but only during
pregnancy
Overall results 39.6% 59.9% .6%
Results by gender:
Females 35.1% 63.8% 1.1%
Males 44.5% 55.5% .0%
Results by age:
18-34 7.5% 91.4% 1.1%
35-44 26.7% 72.4% .8%
45-54 31.2% 67.5% 1.3%
55-64 40.9% 59.1% .0%
65-74 57.8% 42.2% .0%
75+ 73.1% 26.9% .0%
Results by location:
A city (pop. 10,000+) * * *
A town (pop. under 10,000) 42.1% 57.2% .8%
A rural area 36.8% 62.8% .4%
Results by respondent’s education level:
Less than high school 45.8% 54.2% .0%
High school diploma or GED 50.2% 49.8% .0%
Some college, trade school, or associate’s degree 37.5% 61.5% 1.0%
Bachelor’s degree or higher 25.4% 73.8% .7%
Results by household income:
Less than $15,000 40.7% 59.3% .0%
$15,000 to $35,000 44.5% 55.0% .5%
$35,001 to $65,000 35.8% 64.2% .0%
More than $65,000 31.3% 66.7% 2.0%
Results for CHB service area 37.4% 61.5% 1.1%
Results for 19-county region 30.4% 68.4% 1.2%
Lac qui Parle County Data Book Wilder Research, December 2010 2010 Southwest/South Central Adult Health Survey
5
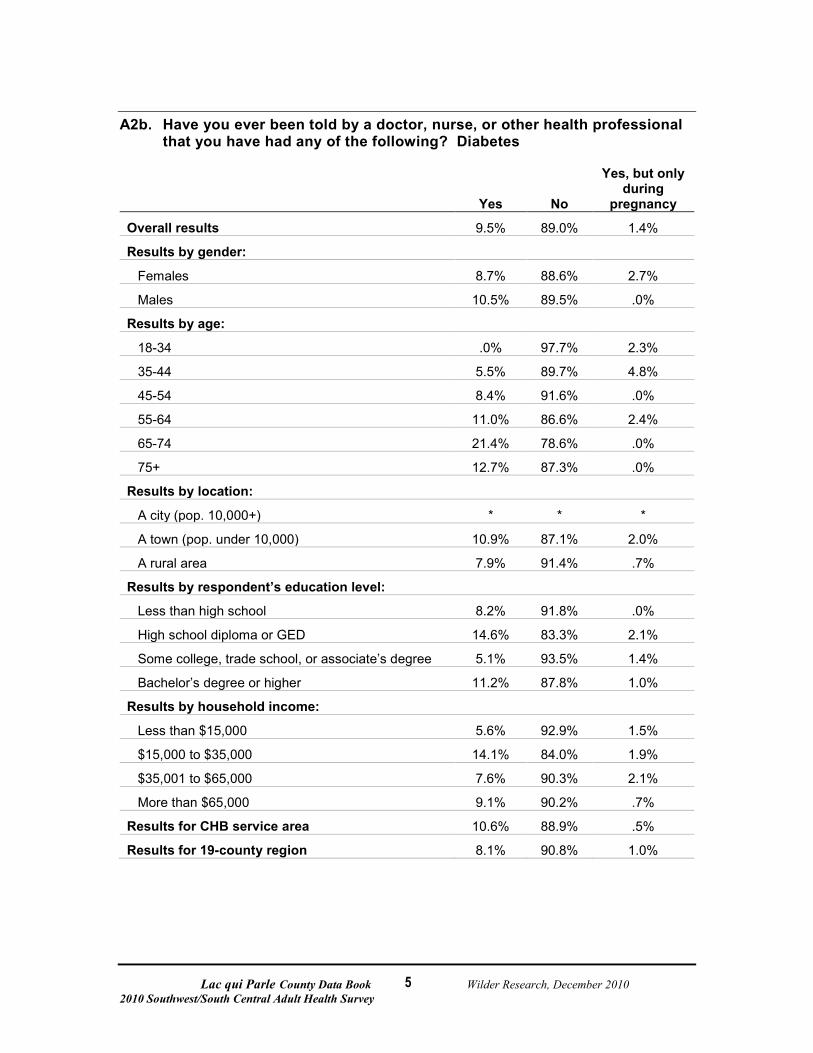
A2b. Have you ever been told by a doctor, nurse, or other health professional that you have had any of the following? Diabetes
Yes No
Yes, but only during
pregnancy
Overall results 9.5% 89.0% 1.4%
Results by gender:
Females 8.7% 88.6% 2.7%
Males 10.5% 89.5% .0%
Results by age:
18-34 .0% 97.7% 2.3%
35-44 5.5% 89.7% 4.8%
45-54 8.4% 91.6% .0%
55-64 11.0% 86.6% 2.4%
65-74 21.4% 78.6% .0%
75+ 12.7% 87.3% .0%
Results by location:
A city (pop. 10,000+) * * *
A town (pop. under 10,000) 10.9% 87.1% 2.0%
A rural area 7.9% 91.4% .7%
Results by respondent’s education level:
Less than high school 8.2% 91.8% .0%
High school diploma or GED 14.6% 83.3% 2.1%
Some college, trade school, or associate’s degree 5.1% 93.5% 1.4%
Bachelor’s degree or higher 11.2% 87.8% 1.0%
Results by household income:
Less than $15,000 5.6% 92.9% 1.5%
$15,000 to $35,000 14.1% 84.0% 1.9%
$35,001 to $65,000 7.6% 90.3% 2.1%
More than $65,000 9.1% 90.2% .7%
Results for CHB service area 10.6% 88.9% .5%
Results for 19-county region 8.1% 90.8% 1.0%
Lac qui Parle County Data Book Wilder Research, December 2010 2010 Southwest/South Central Adult Health Survey
6
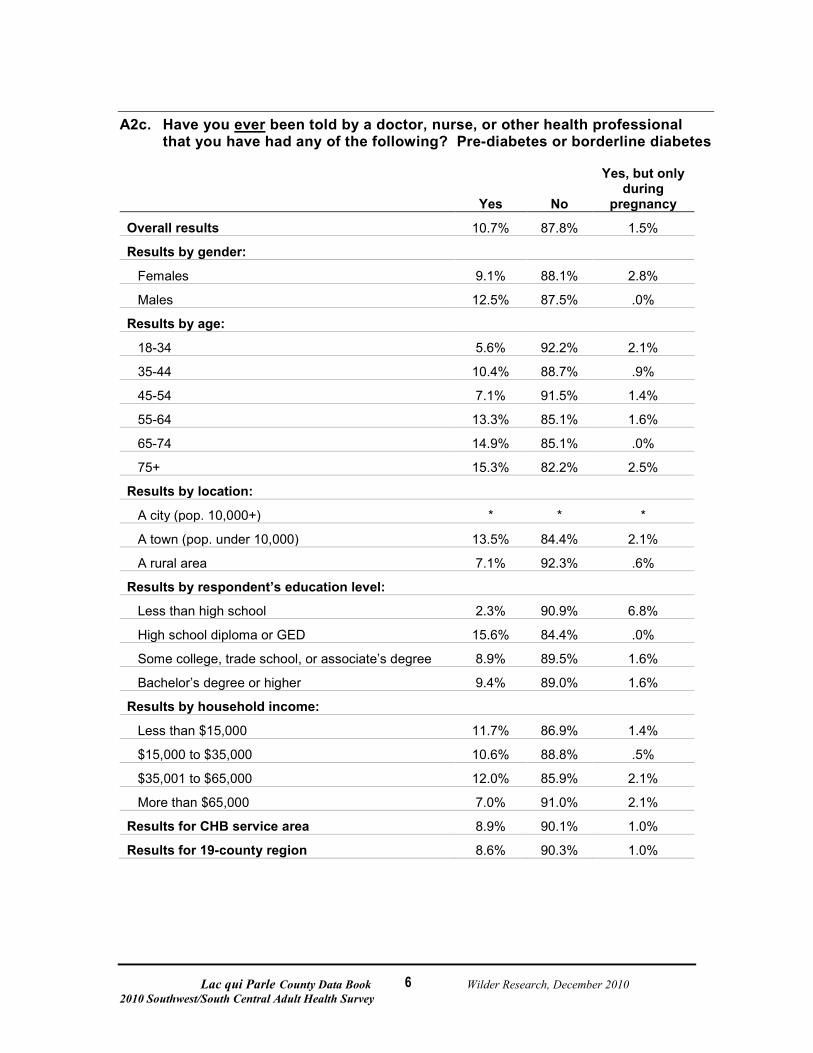
A2c. Have you ever
been told by a doctor, nurse, or other health professional that you have had any of the following? Pre-diabetes or borderline diabetes
Yes No
Yes, but only during
pregnancy
Overall results 10.7% 87.8% 1.5%
Results by gender:
Females 9.1% 88.1% 2.8%
Males 12.5% 87.5% .0%
Results by age:
18-34 5.6% 92.2% 2.1%
35-44 10.4% 88.7% .9%
45-54 7.1% 91.5% 1.4%
55-64 13.3% 85.1% 1.6%
65-74 14.9% 85.1% .0%
75+ 15.3% 82.2% 2.5%
Results by location:
A city (pop. 10,000+) * * *
A town (pop. under 10,000) 13.5% 84.4% 2.1%
A rural area 7.1% 92.3% .6%
Results by respondent’s education level:
Less than high school 2.3% 90.9% 6.8%
High school diploma or GED 15.6% 84.4% .0%
Some college, trade school, or associate’s degree 8.9% 89.5% 1.6%
Bachelor’s degree or higher 9.4% 89.0% 1.6%
Results by household income:
Less than $15,000 11.7% 86.9% 1.4%
$15,000 to $35,000 10.6% 88.8% .5%
$35,001 to $65,000 12.0% 85.9% 2.1%
More than $65,000 7.0% 91.0% 2.1%
Results for CHB service area 8.9% 90.1% 1.0%
Results for 19-county region 8.6% 90.3% 1.0%
Lac qui Parle County Data Book Wilder Research, December 2010 2010 Southwest/South Central Adult Health Survey
7
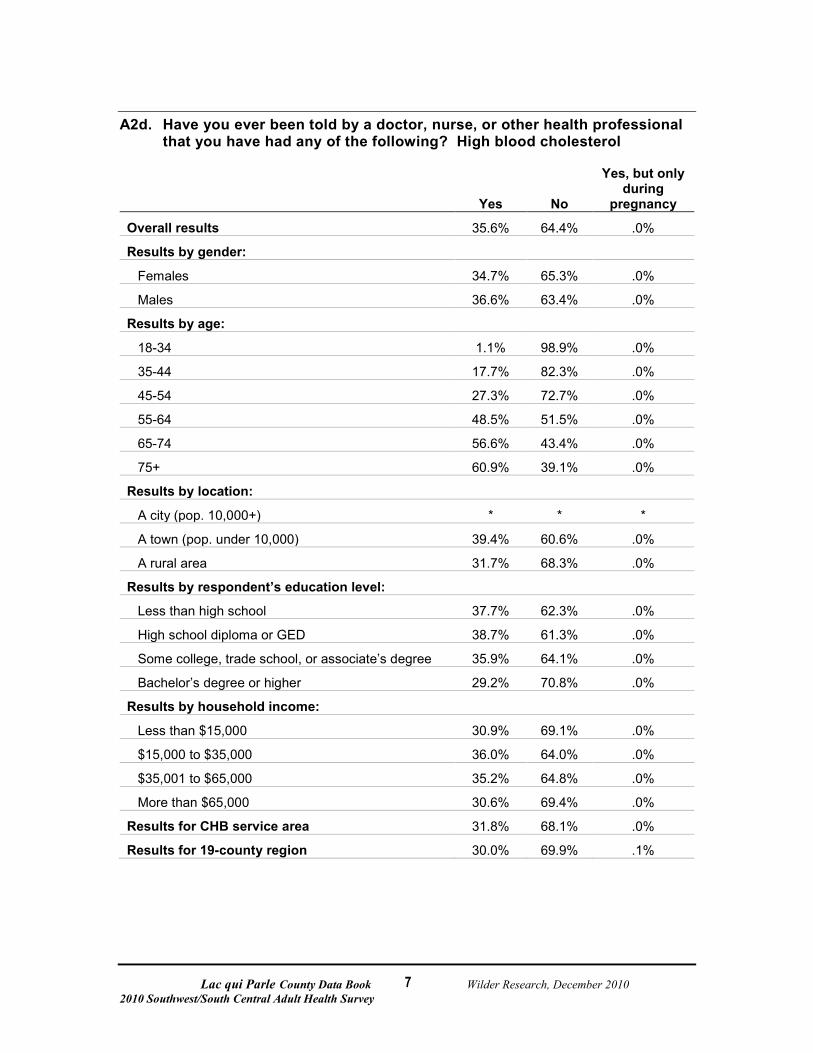
A2d. Have you ever been told by a doctor, nurse, or other health professional that you have had any of the following? High blood cholesterol
Yes No
Yes, but only during
pregnancy
Overall results 35.6% 64.4% .0%
Results by gender:
Females 34.7% 65.3% .0%
Males 36.6% 63.4% .0%
Results by age:
18-34 1.1% 98.9% .0%
35-44 17.7% 82.3% .0%
45-54 27.3% 72.7% .0%
55-64 48.5% 51.5% .0%
65-74 56.6% 43.4% .0%
75+ 60.9% 39.1% .0%
Results by location:
A city (pop. 10,000+) * * *
A town (pop. under 10,000) 39.4% 60.6% .0%
A rural area 31.7% 68.3% .0%
Results by respondent’s education level:
Less than high school 37.7% 62.3% .0%
High school diploma or GED 38.7% 61.3% .0%
Some college, trade school, or associate’s degree 35.9% 64.1% .0%
Bachelor’s degree or higher 29.2% 70.8% .0%
Results by household income:
Less than $15,000 30.9% 69.1% .0%
$15,000 to $35,000 36.0% 64.0% .0%
$35,001 to $65,000 35.2% 64.8% .0%
More than $65,000 30.6% 69.4% .0%
Results for CHB service area 31.8% 68.1% .0%
Results for 19-county region 30.0% 69.9% .1%

Lac qui Parle County Data Book Wilder Research, December 2010 2010 Southwest/South Central Adult Health Survey
8
A2e. Have you ever
been told by a doctor, nurse, or other health professional that you have had any of the following? A heart attack, also called a myocardial infarction
Yes No
Overall results 5.9% 94.1%
Results by gender:
Females 4.2% 95.8%
Males 7.8% 92.2%
Results by age:
18-34 .0% 100.0%
35-44 .0% 100.0%
45-54 6.0% 94.0%
55-64 3.2% 96.8%
65-74 17.0% 83.0%
75+ 10.8% 89.2%
Results by location:
A city (pop. 10,000+) * *
A town (pop. under 10,000) 8.2% 91.8%
A rural area 3.0% 97.0%
Results by respondent’s education level:
Less than high school 24.8% 75.2%
High school diploma or GED 7.8% 92.2%
Some college, trade school, or associate’s degree 2.7% 97.3%
Bachelor’s degree or higher 3.2% 96.8%
Results by household income:
Less than $15,000 10.5% 89.5%
$15,000 to $35,000 7.0% 93.0%
$35,001 to $65,000 2.8% 97.2%
More than $65,000 3.2% 96.8%
Results for CHB service area 5.6% 94.4%
Results for 19-county region 4.3% 95.7%

Lac qui Parle County Data Book Wilder Research, December 2010 2010 Southwest/South Central Adult Health Survey
9
A2f. Have you ever
been told by a doctor, nurse, or other health professional that you have had any of the following? Angina, or coronary heart disease
Yes No
Overall results 5.8% 94.2%
Results by gender:
Females 5.4% 94.6%
Males 6.3% 93.7%
Results by age:
18-34 .0% 100.0%
35-44 .0% 100.0%
45-54 1.0% 99.0%
55-64 9.3% 90.7%
65-74 13.4% 86.6%
75+ 13.4% 86.6%
Results by location:
A city (pop. 10,000+) * *
A town (pop. under 10,000) 7.8% 92.2%
A rural area 3.3% 96.7%
Results by respondent’s education level:
Less than high school 8.1% 91.9%
High school diploma or GED 12.2% 87.8%
Some college, trade school, or associate’s degree 2.7% 97.3%
Bachelor’s degree or higher 1.9% 98.1%
Results by household income:
Less than $15,000 3.1% 96.9%
$15,000 to $35,000 7.8% 92.2%
$35,001 to $65,000 4.2% 95.8%
More than $65,000 5.9% 94.1%
Results for CHB service area 6.0% 94.0%
Results for 19-county region 5.2% 94.8%
Lac qui Parle County Data Book Wilder Research, December 2010 2010 Southwest/South Central Adult Health Survey
10
A2g. Have you ever
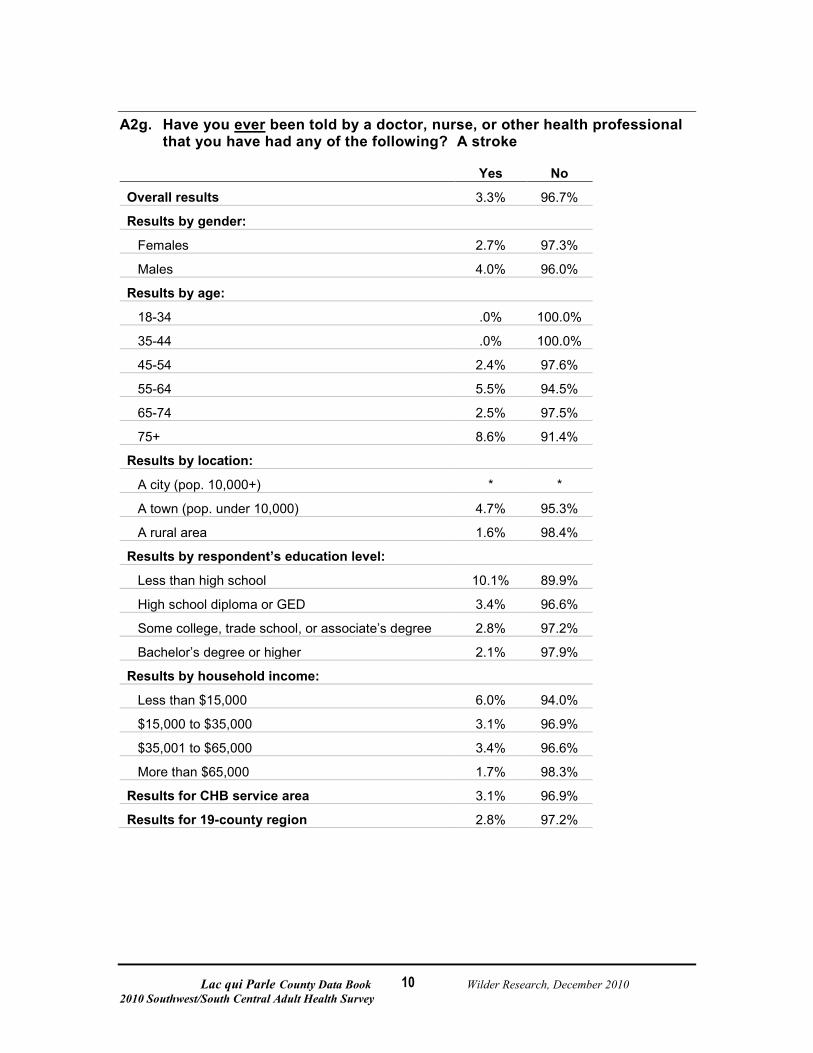
been told by a doctor, nurse, or other health professional that you have had any of the following? A stroke
Yes No
Overall results 3.3% 96.7%
Results by gender:
Females 2.7% 97.3%
Males 4.0% 96.0%
Results by age:
18-34 .0% 100.0%
35-44 .0% 100.0%
45-54 2.4% 97.6%
55-64 5.5% 94.5%
65-74 2.5% 97.5%
75+ 8.6% 91.4%
Results by location:
A city (pop. 10,000+) * *
A town (pop. under 10,000) 4.7% 95.3%
A rural area 1.6% 98.4%
Results by respondent’s education level:
Less than high school 10.1% 89.9%
High school diploma or GED 3.4% 96.6%
Some college, trade school, or associate’s degree 2.8% 97.2%
Bachelor’s degree or higher 2.1% 97.9%
Results by household income:
Less than $15,000 6.0% 94.0%
$15,000 to $35,000 3.1% 96.9%
$35,001 to $65,000 3.4% 96.6%
More than $65,000 1.7% 98.3%
Results for CHB service area 3.1% 96.9%
Results for 19-county region 2.8% 97.2%
Lac qui Parle County Data Book Wilder Research, December 2010 2010 Southwest/South Central Adult Health Survey
11
A2h. Have you ever
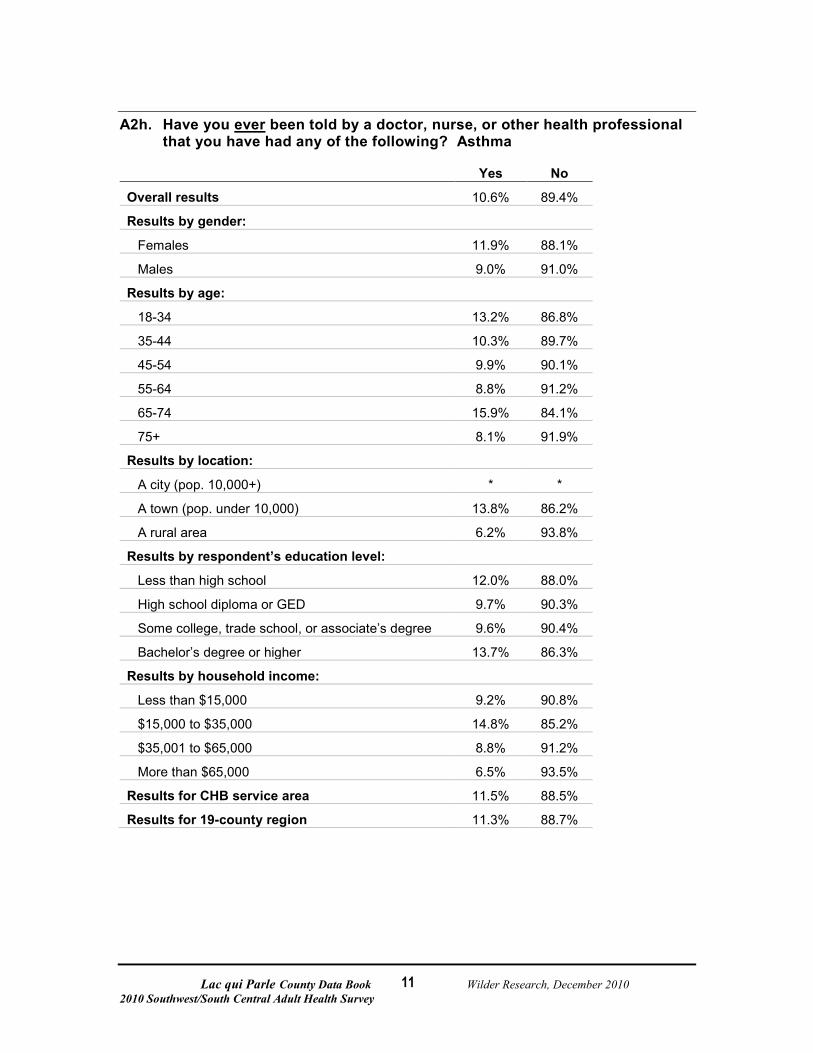
been told by a doctor, nurse, or other health professional that you have had any of the following? Asthma
Yes No
Overall results 10.6% 89.4%
Results by gender:
Females 11.9% 88.1%
Males 9.0% 91.0%
Results by age:
18-34 13.2% 86.8%
35-44 10.3% 89.7%
45-54 9.9% 90.1%
55-64 8.8% 91.2%
65-74 15.9% 84.1%
75+ 8.1% 91.9%
Results by location:
A city (pop. 10,000+) * *
A town (pop. under 10,000) 13.8% 86.2%
A rural area 6.2% 93.8%
Results by respondent’s education level:
Less than high school 12.0% 88.0%
High school diploma or GED 9.7% 90.3%
Some college, trade school, or associate’s degree 9.6% 90.4%
Bachelor’s degree or higher 13.7% 86.3%
Results by household income:
Less than $15,000 9.2% 90.8%
$15,000 to $35,000 14.8% 85.2%
$35,001 to $65,000 8.8% 91.2%
More than $65,000 6.5% 93.5%
Results for CHB service area 11.5% 88.5%
Results for 19-county region 11.3% 88.7%
Lac qui Parle County Data Book Wilder Research, December 2010 2010 Southwest/South Central Adult Health Survey
12
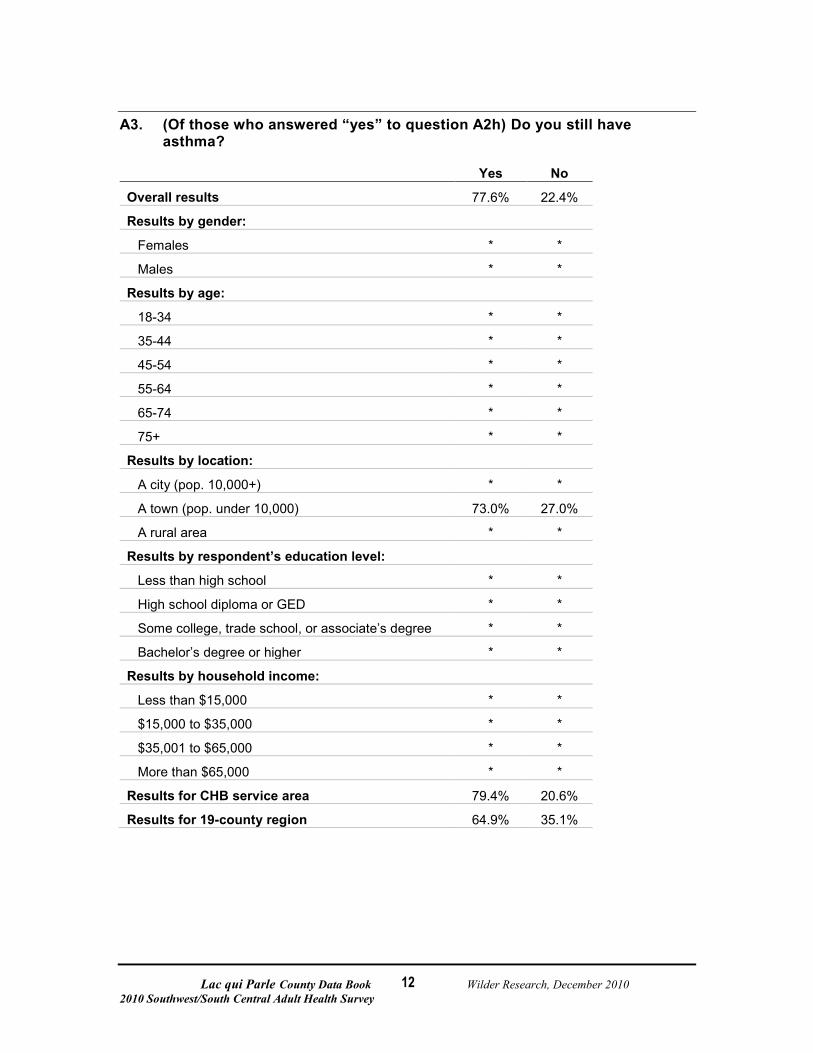
A3. (Of those who answered “yes” to question A2h) Do you still have asthma?
Yes No
Overall results 77.6% 22.4%
Results by gender:
Females * *
Males * *
Results by age:
18-34 * *
35-44 * *
45-54 * *
55-64 * *
65-74 * *
75+ * *
Results by location:
A city (pop. 10,000+) * *
A town (pop. under 10,000) 73.0% 27.0%
A rural area * *
Results by respondent’s education level:
Less than high school * *
High school diploma or GED * *
Some college, trade school, or associate’s degree * *
Bachelor’s degree or higher * *
Results by household income:
Less than $15,000 * *
$15,000 to $35,000 * *
$35,001 to $65,000 * *
More than $65,000 * *
Results for CHB service area 79.4% 20.6%
Results for 19-county region 64.9% 35.1%
Lac qui Parle County Data Book Wilder Research, December 2010 2010 Southwest/South Central Adult Health Survey
13
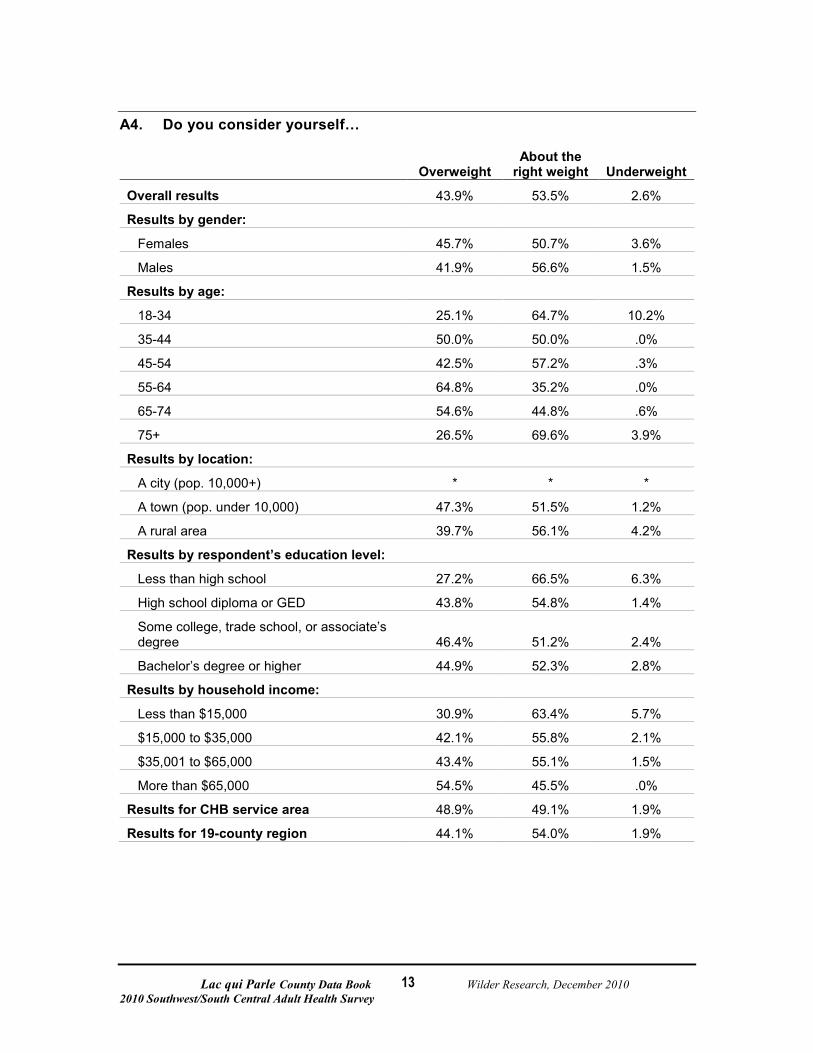
A4. Do you consider yourself…
Overweight About the
right weight Underweight
Overall results 43.9% 53.5% 2.6%
Results by gender:
Females 45.7% 50.7% 3.6%
Males 41.9% 56.6% 1.5%
Results by age:
18-34 25.1% 64.7% 10.2%
35-44 50.0% 50.0% .0%
45-54 42.5% 57.2% .3%
55-64 64.8% 35.2% .0%
65-74 54.6% 44.8% .6%
75+ 26.5% 69.6% 3.9%
Results by location:
A city (pop. 10,000+) * * *
A town (pop. under 10,000) 47.3% 51.5% 1.2%
A rural area 39.7% 56.1% 4.2%
Results by respondent’s education level:
Less than high school 27.2% 66.5% 6.3%
High school diploma or GED 43.8% 54.8% 1.4%
Some college, trade school, or associate’s degree 46.4% 51.2% 2.4%
Bachelor’s degree or higher 44.9% 52.3% 2.8%
Results by household income:
Less than $15,000 30.9% 63.4% 5.7%
$15,000 to $35,000 42.1% 55.8% 2.1%
$35,001 to $65,000 43.4% 55.1% 1.5%
More than $65,000 54.5% 45.5% .0%
Results for CHB service area 48.9% 49.1% 1.9%
Results for 19-county region 44.1% 54.0% 1.9%
Lac qui Parle County Data Book Wilder Research, December 2010 2010 Southwest/South Central Adult Health Survey
14
Section B. Eating habits
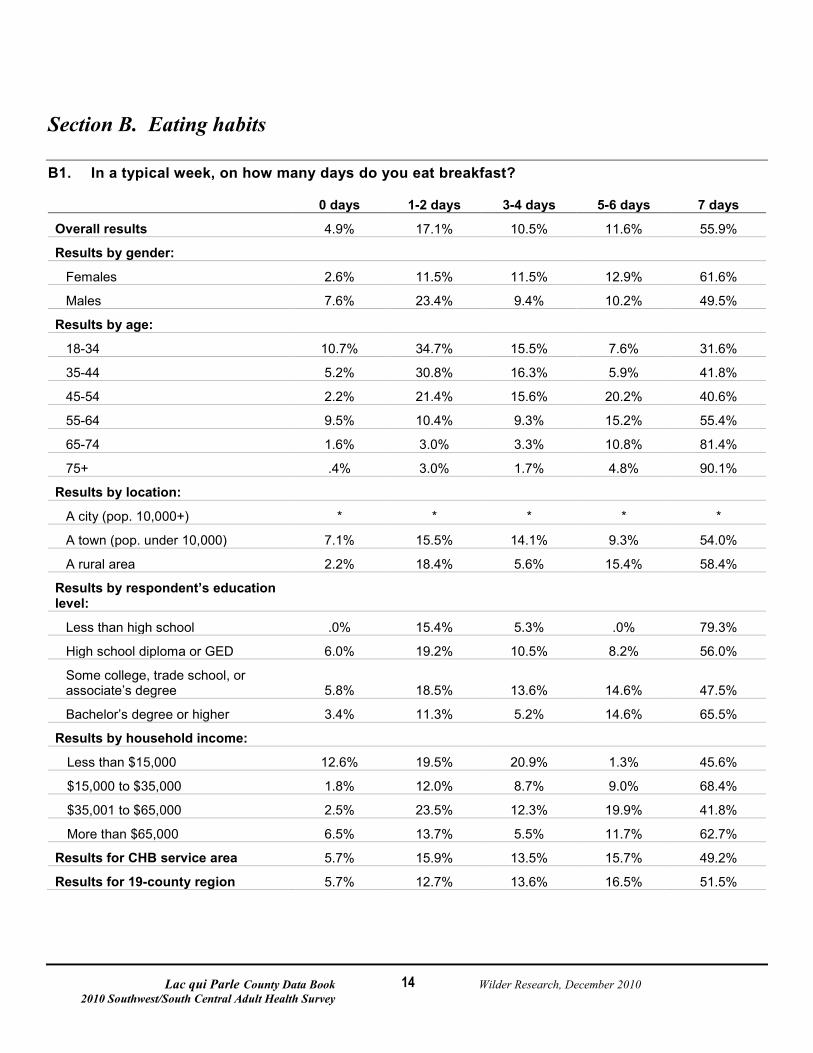
B1. In a typical week, on how many days do you eat breakfast?
0 days 1-2 days 3-4 days 5-6 days 7 days
Overall results 4.9% 17.1% 10.5% 11.6% 55.9%
Results by gender:
Females 2.6% 11.5% 11.5% 12.9% 61.6%
Males 7.6% 23.4% 9.4% 10.2% 49.5%
Results by age:
18-34 10.7% 34.7% 15.5% 7.6% 31.6%
35-44 5.2% 30.8% 16.3% 5.9% 41.8%
45-54 2.2% 21.4% 15.6% 20.2% 40.6%
55-64 9.5% 10.4% 9.3% 15.2% 55.4%
65-74 1.6% 3.0% 3.3% 10.8% 81.4%
75+ .4% 3.0% 1.7% 4.8% 90.1%
Results by location:
A city (pop. 10,000+) * * * * *
A town (pop. under 10,000) 7.1% 15.5% 14.1% 9.3% 54.0%
A rural area 2.2% 18.4% 5.6% 15.4% 58.4%
Results by respondent’s education level:
Less than high school .0% 15.4% 5.3% .0% 79.3%
High school diploma or GED 6.0% 19.2% 10.5% 8.2% 56.0%
Some college, trade school, or associate’s degree 5.8% 18.5% 13.6% 14.6% 47.5%
Bachelor’s degree or higher 3.4% 11.3% 5.2% 14.6% 65.5%
Results by household income:
Less than $15,000 12.6% 19.5% 20.9% 1.3% 45.6%
$15,000 to $35,000 1.8% 12.0% 8.7% 9.0% 68.4%
$35,001 to $65,000 2.5% 23.5% 12.3% 19.9% 41.8%
More than $65,000 6.5% 13.7% 5.5% 11.7% 62.7%
Results for CHB service area 5.7% 15.9% 13.5% 15.7% 49.2%
Results for 19-county region 5.7% 12.7% 13.6% 16.5% 51.5%
Lac qui Parle County Data Book Wilder Research, December 2010 2010 Southwest/South Central Adult Health Survey
15
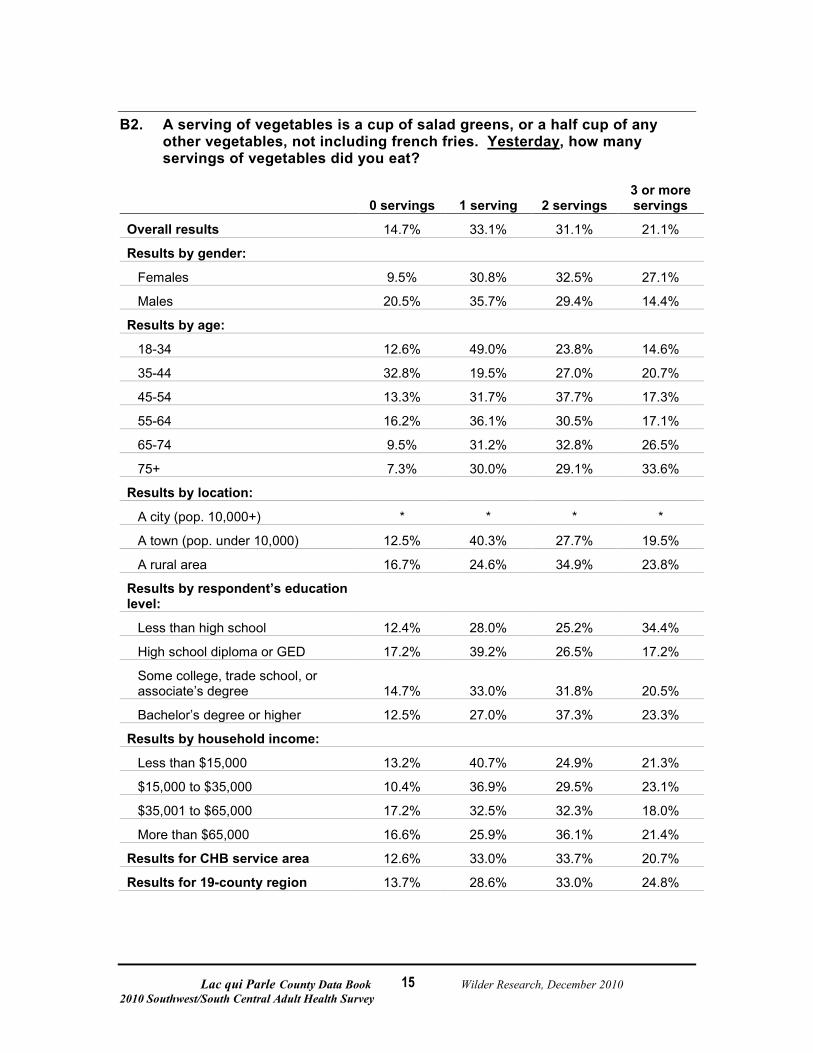
B2. A serving of vegetables is a cup of salad greens, or a half cup of any other vegetables, not including french fries. Yesterday
, how many servings of vegetables did you eat?
0 servings 1 serving 2 servings 3 or more servings
Overall results 14.7% 33.1% 31.1% 21.1%
Results by gender:
Females 9.5% 30.8% 32.5% 27.1%
Males 20.5% 35.7% 29.4% 14.4%
Results by age:
18-34 12.6% 49.0% 23.8% 14.6%
35-44 32.8% 19.5% 27.0% 20.7%
45-54 13.3% 31.7% 37.7% 17.3%
55-64 16.2% 36.1% 30.5% 17.1%
65-74 9.5% 31.2% 32.8% 26.5%
75+ 7.3% 30.0% 29.1% 33.6%
Results by location:
A city (pop. 10,000+) * * * *
A town (pop. under 10,000) 12.5% 40.3% 27.7% 19.5%
A rural area 16.7% 24.6% 34.9% 23.8%
Results by respondent’s education level:
Less than high school 12.4% 28.0% 25.2% 34.4%
High school diploma or GED 17.2% 39.2% 26.5% 17.2%
Some college, trade school, or associate’s degree 14.7% 33.0% 31.8% 20.5%
Bachelor’s degree or higher 12.5% 27.0% 37.3% 23.3%
Results by household income:
Less than $15,000 13.2% 40.7% 24.9% 21.3%
$15,000 to $35,000 10.4% 36.9% 29.5% 23.1%
$35,001 to $65,000 17.2% 32.5% 32.3% 18.0%
More than $65,000 16.6% 25.9% 36.1% 21.4%
Results for CHB service area 12.6% 33.0% 33.7% 20.7%
Results for 19-county region 13.7% 28.6% 33.0% 24.8%
Lac qui Parle County Data Book Wilder Research, December 2010 2010 Southwest/South Central Adult Health Survey
16
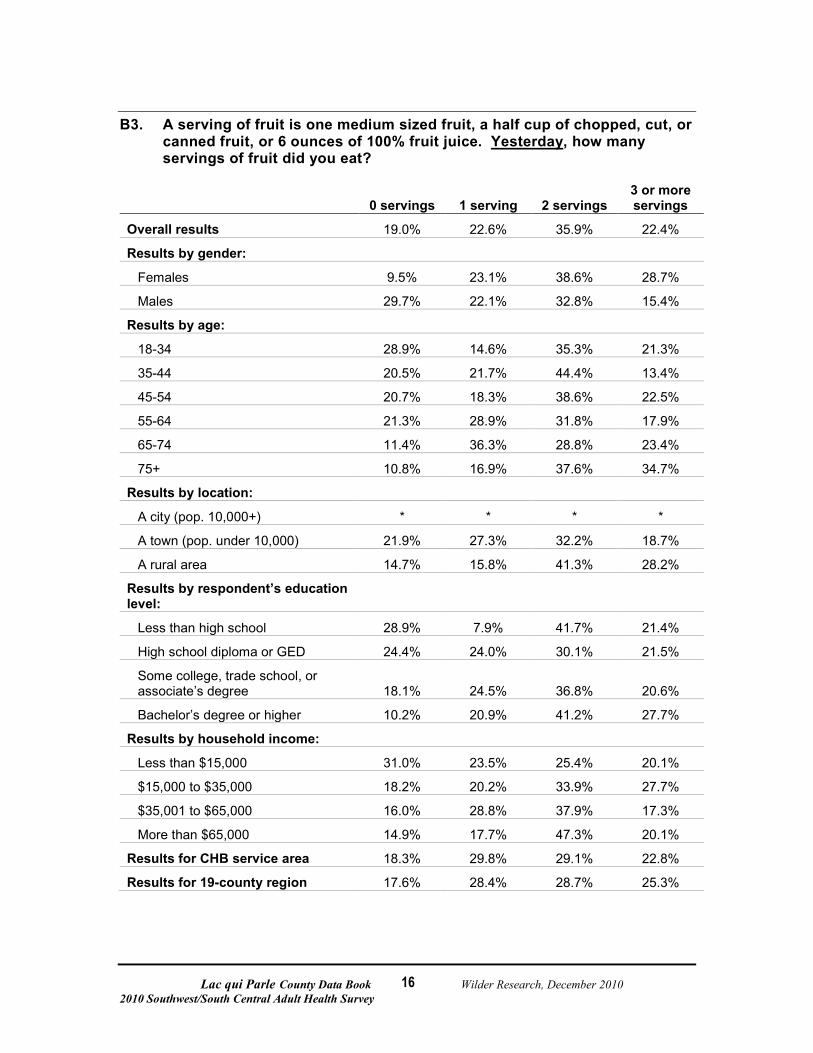
B3. A serving of fruit is one medium sized fruit, a half cup of chopped, cut, or canned fruit, or 6 ounces of 100% fruit juice. Yesterday
, how many servings of fruit did you eat?
0 servings 1 serving 2 servings 3 or more servings
Overall results 19.0% 22.6% 35.9% 22.4%
Results by gender:
Females 9.5% 23.1% 38.6% 28.7%
Males 29.7% 22.1% 32.8% 15.4%
Results by age:
18-34 28.9% 14.6% 35.3% 21.3%
35-44 20.5% 21.7% 44.4% 13.4%
45-54 20.7% 18.3% 38.6% 22.5%
55-64 21.3% 28.9% 31.8% 17.9%
65-74 11.4% 36.3% 28.8% 23.4%
75+ 10.8% 16.9% 37.6% 34.7%
Results by location:
A city (pop. 10,000+) * * * *
A town (pop. under 10,000) 21.9% 27.3% 32.2% 18.7%
A rural area 14.7% 15.8% 41.3% 28.2%
Results by respondent’s education level:
Less than high school 28.9% 7.9% 41.7% 21.4%
High school diploma or GED 24.4% 24.0% 30.1% 21.5%
Some college, trade school, or associate’s degree 18.1% 24.5% 36.8% 20.6%
Bachelor’s degree or higher 10.2% 20.9% 41.2% 27.7%
Results by household income:
Less than $15,000 31.0% 23.5% 25.4% 20.1%
$15,000 to $35,000 18.2% 20.2% 33.9% 27.7%
$35,001 to $65,000 16.0% 28.8% 37.9% 17.3%
More than $65,000 14.9% 17.7% 47.3% 20.1%
Results for CHB service area 18.3% 29.8% 29.1% 22.8%
Results for 19-county region 17.6% 28.4% 28.7% 25.3%
Lac qui Parle County Data Book Wilder Research, December 2010 2010 Southwest/South Central Adult Health Survey
17
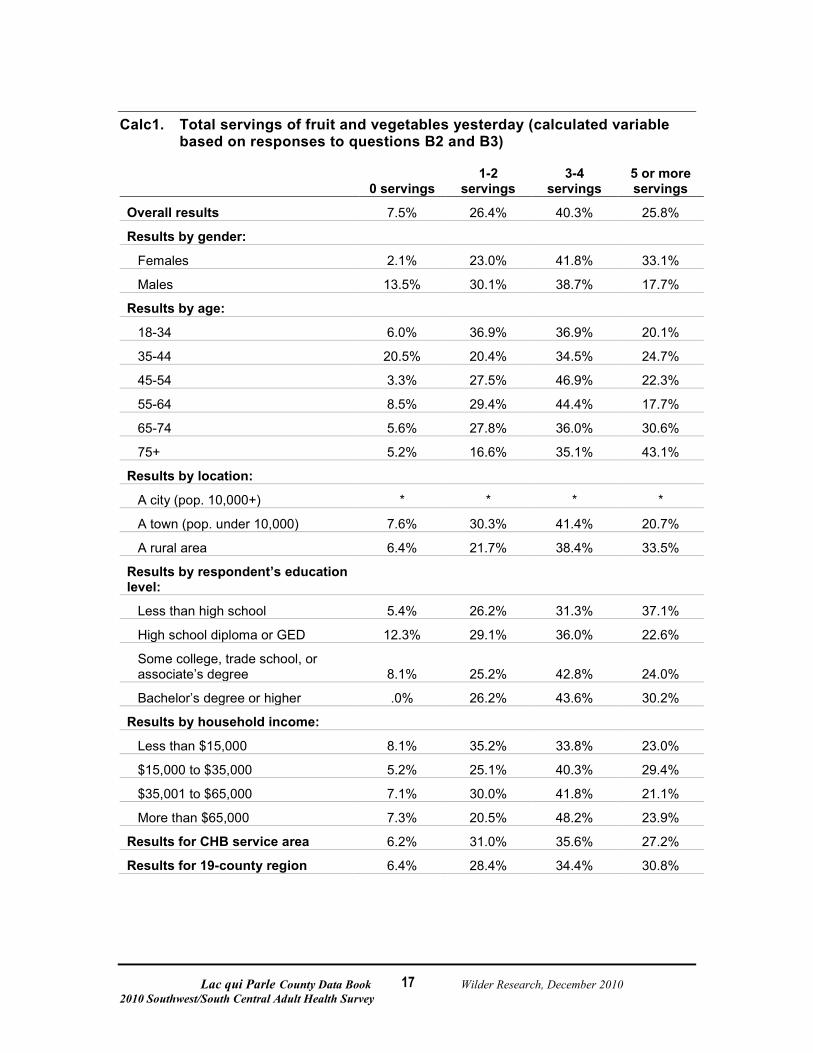
Calc1. Total servings of fruit and vegetables yesterday (calculated variable based on responses to questions B2 and B3)
0 servings 1-2
servings 3-4
servings 5 or more servings
Overall results 7.5% 26.4% 40.3% 25.8%
Results by gender:
Females 2.1% 23.0% 41.8% 33.1%
Males 13.5% 30.1% 38.7% 17.7%
Results by age:
18-34 6.0% 36.9% 36.9% 20.1%
35-44 20.5% 20.4% 34.5% 24.7%
45-54 3.3% 27.5% 46.9% 22.3%
55-64 8.5% 29.4% 44.4% 17.7%
65-74 5.6% 27.8% 36.0% 30.6%
75+ 5.2% 16.6% 35.1% 43.1%
Results by location:
A city (pop. 10,000+) * * * *
A town (pop. under 10,000) 7.6% 30.3% 41.4% 20.7%
A rural area 6.4% 21.7% 38.4% 33.5%
Results by respondent’s education level:
Less than high school 5.4% 26.2% 31.3% 37.1%
High school diploma or GED 12.3% 29.1% 36.0% 22.6%
Some college, trade school, or associate’s degree 8.1% 25.2% 42.8% 24.0%
Bachelor’s degree or higher .0% 26.2% 43.6% 30.2%
Results by household income:
Less than $15,000 8.1% 35.2% 33.8% 23.0%
$15,000 to $35,000 5.2% 25.1% 40.3% 29.4%
$35,001 to $65,000 7.1% 30.0% 41.8% 21.1%
More than $65,000 7.3% 20.5% 48.2% 23.9%
Results for CHB service area 6.2% 31.0% 35.6% 27.2%
Results for 19-county region 6.4% 28.4% 34.4% 30.8%
Lac qui Parle County Data Book Wilder Research, December 2010 2010 Southwest/South Central Adult Health Survey
18
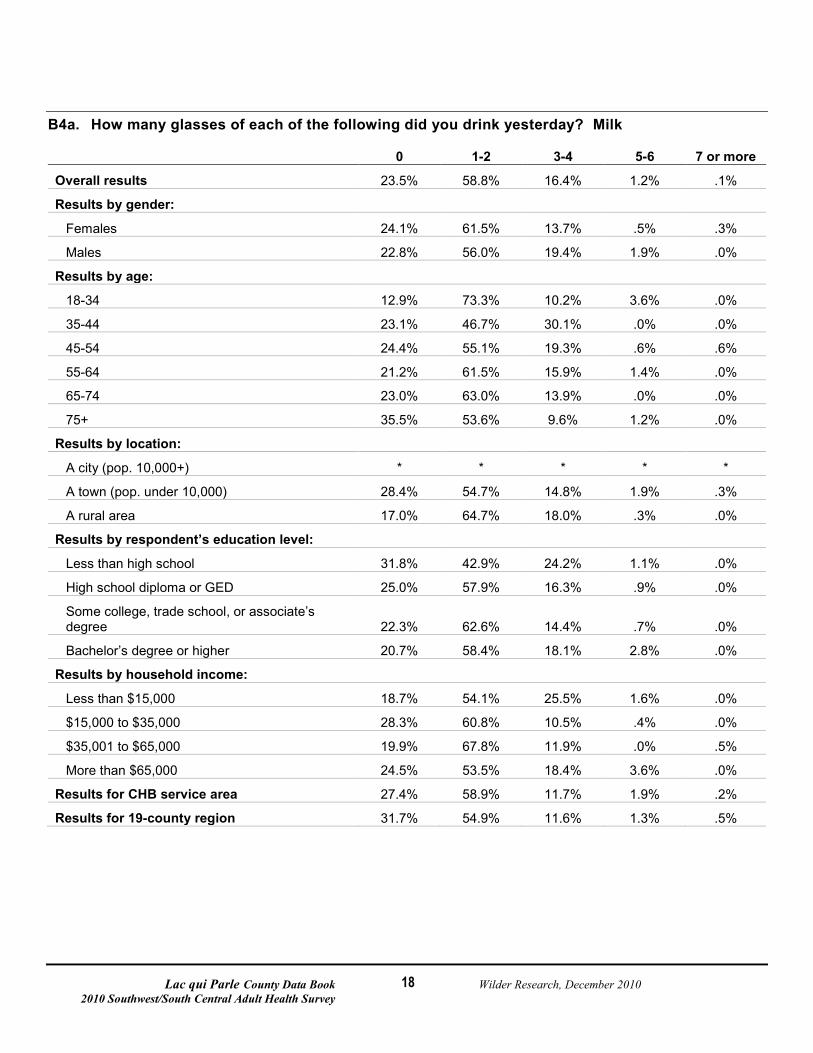
B4a. How many glasses of each of the following did you drink yesterday? Milk
0 1-2 3-4 5-6 7 or more
Overall results 23.5% 58.8% 16.4% 1.2% .1%
Results by gender:
Females 24.1% 61.5% 13.7% .5% .3%
Males 22.8% 56.0% 19.4% 1.9% .0%
Results by age:
18-34 12.9% 73.3% 10.2% 3.6% .0%
35-44 23.1% 46.7% 30.1% .0% .0%
45-54 24.4% 55.1% 19.3% .6% .6%
55-64 21.2% 61.5% 15.9% 1.4% .0%
65-74 23.0% 63.0% 13.9% .0% .0%
75+ 35.5% 53.6% 9.6% 1.2% .0%
Results by location:
A city (pop. 10,000+) * * * * *
A town (pop. under 10,000) 28.4% 54.7% 14.8% 1.9% .3%
A rural area 17.0% 64.7% 18.0% .3% .0%
Results by respondent’s education level:
Less than high school 31.8% 42.9% 24.2% 1.1% .0%
High school diploma or GED 25.0% 57.9% 16.3% .9% .0%
Some college, trade school, or associate’s degree 22.3% 62.6% 14.4% .7% .0%
Bachelor’s degree or higher 20.7% 58.4% 18.1% 2.8% .0%
Results by household income:
Less than $15,000 18.7% 54.1% 25.5% 1.6% .0%
$15,000 to $35,000 28.3% 60.8% 10.5% .4% .0%
$35,001 to $65,000 19.9% 67.8% 11.9% .0% .5%
More than $65,000 24.5% 53.5% 18.4% 3.6% .0%
Results for CHB service area 27.4% 58.9% 11.7% 1.9% .2%
Results for 19-county region 31.7% 54.9% 11.6% 1.3% .5%
Lac qui Parle County Data Book Wilder Research, December 2010 2010 Southwest/South Central Adult Health Survey
19
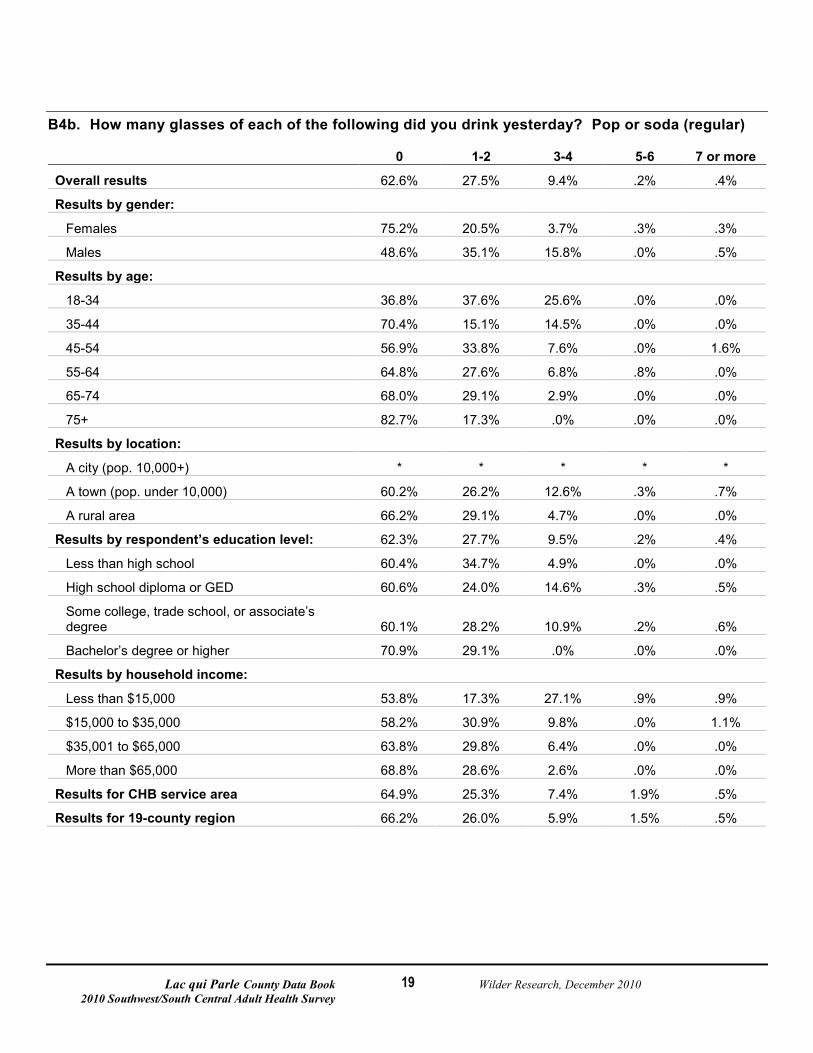
B4b. How many glasses of each of the following did you drink yesterday? Pop or soda (regular)
0 1-2 3-4 5-6 7 or more
Overall results 62.6% 27.5% 9.4% .2% .4%
Results by gender:
Females 75.2% 20.5% 3.7% .3% .3%
Males 48.6% 35.1% 15.8% .0% .5%
Results by age:
18-34 36.8% 37.6% 25.6% .0% .0%
35-44 70.4% 15.1% 14.5% .0% .0%
45-54 56.9% 33.8% 7.6% .0% 1.6%
55-64 64.8% 27.6% 6.8% .8% .0%
65-74 68.0% 29.1% 2.9% .0% .0%
75+ 82.7% 17.3% .0% .0% .0%
Results by location:
A city (pop. 10,000+) * * * * *
A town (pop. under 10,000) 60.2% 26.2% 12.6% .3% .7%
A rural area 66.2% 29.1% 4.7% .0% .0%
Results by respondent’s education level: 62.3% 27.7% 9.5% .2% .4%
Less than high school 60.4% 34.7% 4.9% .0% .0%
High school diploma or GED 60.6% 24.0% 14.6% .3% .5%
Some college, trade school, or associate’s degree 60.1% 28.2% 10.9% .2% .6%
Bachelor’s degree or higher 70.9% 29.1% .0% .0% .0%
Results by household income:
Less than $15,000 53.8% 17.3% 27.1% .9% .9%
$15,000 to $35,000 58.2% 30.9% 9.8% .0% 1.1%
$35,001 to $65,000 63.8% 29.8% 6.4% .0% .0%
More than $65,000 68.8% 28.6% 2.6% .0% .0%
Results for CHB service area 64.9% 25.3% 7.4% 1.9% .5%
Results for 19-county region 66.2% 26.0% 5.9% 1.5% .5%

Lac qui Parle County Data Book Wilder Research, December 2010 2010 Southwest/South Central Adult Health Survey
20
B4c. How many glasses of each of the following did you drink yesterday? Pop or soda (diet)
0 1-2 3-4 5-6 7 or more
Overall results 67.0% 22.4% 9.1% 1.4% .1%
Results by gender:
Females 63.3% 28.4% 7.1% 1.1% .1%
Males 71.5% 15.4% 11.4% 1.8% .0%
Results by age:
18-34 82.9% 8.1% 7.7% 1.3% .0%
35-44 44.5% 26.4% 29.1% .0% .0%
45-54 61.5% 24.4% 10.7% 3.1% .3%
55-64 59.9% 33.3% 5.2% 1.6% .0%
65-74 73.7% 22.4% 3.9% .0% .0%
75+ 83.2% 15.7% .0% 1.1% .0%
Results by location:
A city (pop. 10,000+) * * * * *
A town (pop. under 10,000) 64.6% 23.6% 10.0% 1.8% .0%
A rural area 69.4% 21.5% 8.1% .9% .2%
Results by respondent’s education level:
Less than high school 85.7% 14.3% .0% .0% .0%
High school diploma or GED 74.7% 16.3% 6.8% 2.1% .0%
Some college, trade school, or associate’s degree 60.0% 26.0% 12.1% 1.7% .2%
Bachelor’s degree or higher 64.6% 26.3% 9.1% .0% .0%
Results by household income:
Less than $15,000 83.2% 13.7% 2.2% .5% .5%
$15,000 to $35,000 69.4% 20.9% 7.4% 2.2% .0%
$35,001 to $65,000 58.2% 24.6% 15.1% 2.1% .0%
More than $65,000 61.5% 28.0% 10.5% .0% .0%
Results for CHB service area 67.1% 25.0% 6.5% 1.0% .4%
Results for 19-county region 68.5% 24.5% 5.5% 1.2% .4%
Lac qui Parle County Data Book Wilder Research, December 2010 2010 Southwest/South Central Adult Health Survey
21
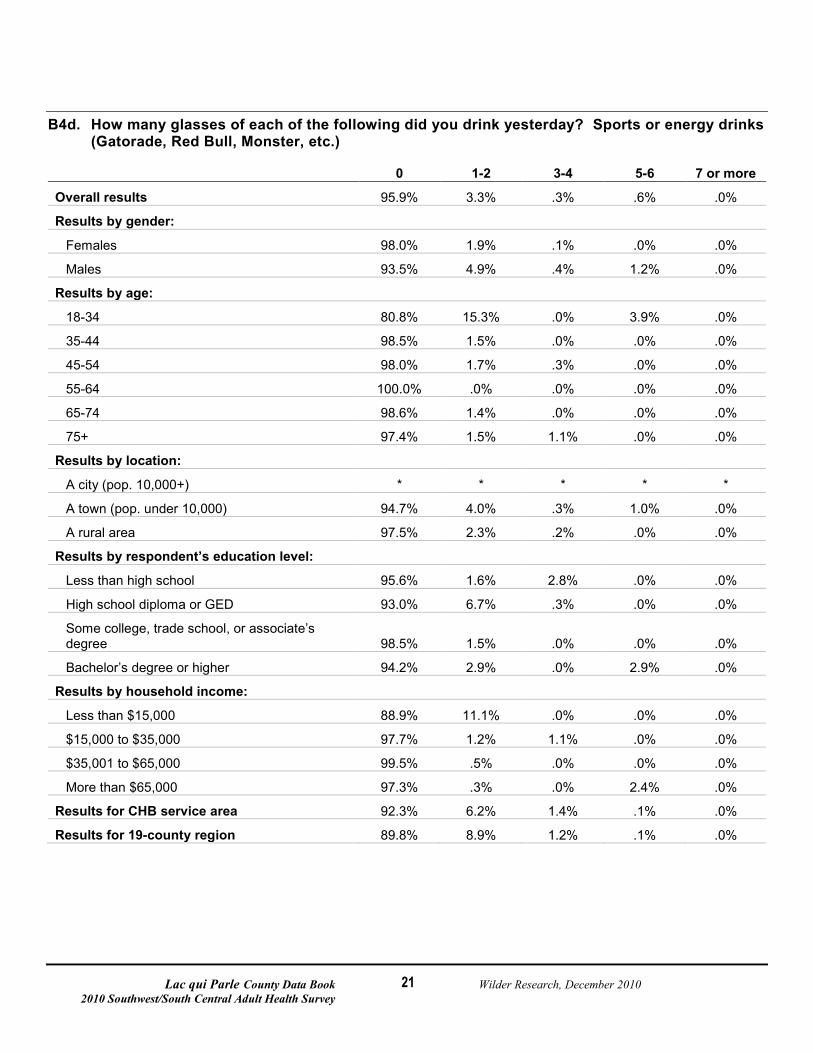
B4d. How many glasses of each of the following did you drink yesterday? Sports or energy drinks (Gatorade, Red Bull, Monster, etc.)
0 1-2 3-4 5-6 7 or more
Overall results 95.9% 3.3% .3% .6% .0%
Results by gender:
Females 98.0% 1.9% .1% .0% .0%
Males 93.5% 4.9% .4% 1.2% .0%
Results by age:
18-34 80.8% 15.3% .0% 3.9% .0%
35-44 98.5% 1.5% .0% .0% .0%
45-54 98.0% 1.7% .3% .0% .0%
55-64 100.0% .0% .0% .0% .0%
65-74 98.6% 1.4% .0% .0% .0%
75+ 97.4% 1.5% 1.1% .0% .0%
Results by location:
A city (pop. 10,000+) * * * * *
A town (pop. under 10,000) 94.7% 4.0% .3% 1.0% .0%
A rural area 97.5% 2.3% .2% .0% .0%
Results by respondent’s education level:
Less than high school 95.6% 1.6% 2.8% .0% .0%
High school diploma or GED 93.0% 6.7% .3% .0% .0%
Some college, trade school, or associate’s degree 98.5% 1.5% .0% .0% .0%
Bachelor’s degree or higher 94.2% 2.9% .0% 2.9% .0%
Results by household income:
Less than $15,000 88.9% 11.1% .0% .0% .0%
$15,000 to $35,000 97.7% 1.2% 1.1% .0% .0%
$35,001 to $65,000 99.5% .5% .0% .0% .0%
More than $65,000 97.3% .3% .0% 2.4% .0%
Results for CHB service area 92.3% 6.2% 1.4% .1% .0%
Results for 19-county region 89.8% 8.9% 1.2% .1% .0%
Lac qui Parle County Data Book Wilder Research, December 2010 2010 Southwest/South Central Adult Health Survey
22
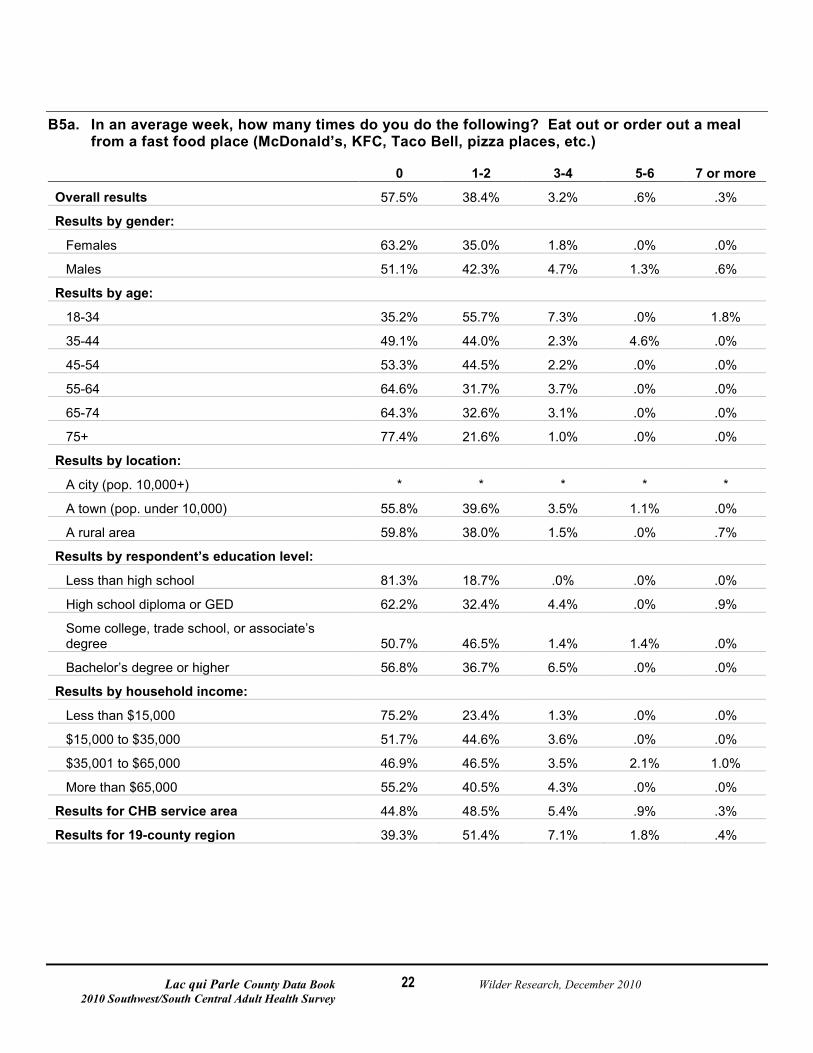
B5a. In an average week, how many times do you do the following? Eat out or order out a meal from a fast food place (McDonald’s, KFC, Taco Bell, pizza places, etc.)
0 1-2 3-4 5-6 7 or more
Overall results 57.5% 38.4% 3.2% .6% .3%
Results by gender:
Females 63.2% 35.0% 1.8% .0% .0%
Males 51.1% 42.3% 4.7% 1.3% .6%
Results by age:
18-34 35.2% 55.7% 7.3% .0% 1.8%
35-44 49.1% 44.0% 2.3% 4.6% .0%
45-54 53.3% 44.5% 2.2% .0% .0%
55-64 64.6% 31.7% 3.7% .0% .0%
65-74 64.3% 32.6% 3.1% .0% .0%
75+ 77.4% 21.6% 1.0% .0% .0%
Results by location:
A city (pop. 10,000+) * * * * *
A town (pop. under 10,000) 55.8% 39.6% 3.5% 1.1% .0%
A rural area 59.8% 38.0% 1.5% .0% .7%
Results by respondent’s education level:
Less than high school 81.3% 18.7% .0% .0% .0%
High school diploma or GED 62.2% 32.4% 4.4% .0% .9%
Some college, trade school, or associate’s degree 50.7% 46.5% 1.4% 1.4% .0%
Bachelor’s degree or higher 56.8% 36.7% 6.5% .0% .0%
Results by household income:
Less than $15,000 75.2% 23.4% 1.3% .0% .0%
$15,000 to $35,000 51.7% 44.6% 3.6% .0% .0%
$35,001 to $65,000 46.9% 46.5% 3.5% 2.1% 1.0%
More than $65,000 55.2% 40.5% 4.3% .0% .0%
Results for CHB service area 44.8% 48.5% 5.4% .9% .3%
Results for 19-county region 39.3% 51.4% 7.1% 1.8% .4%
Lac qui Parle County Data Book Wilder Research, December 2010 2010 Southwest/South Central Adult Health Survey
23
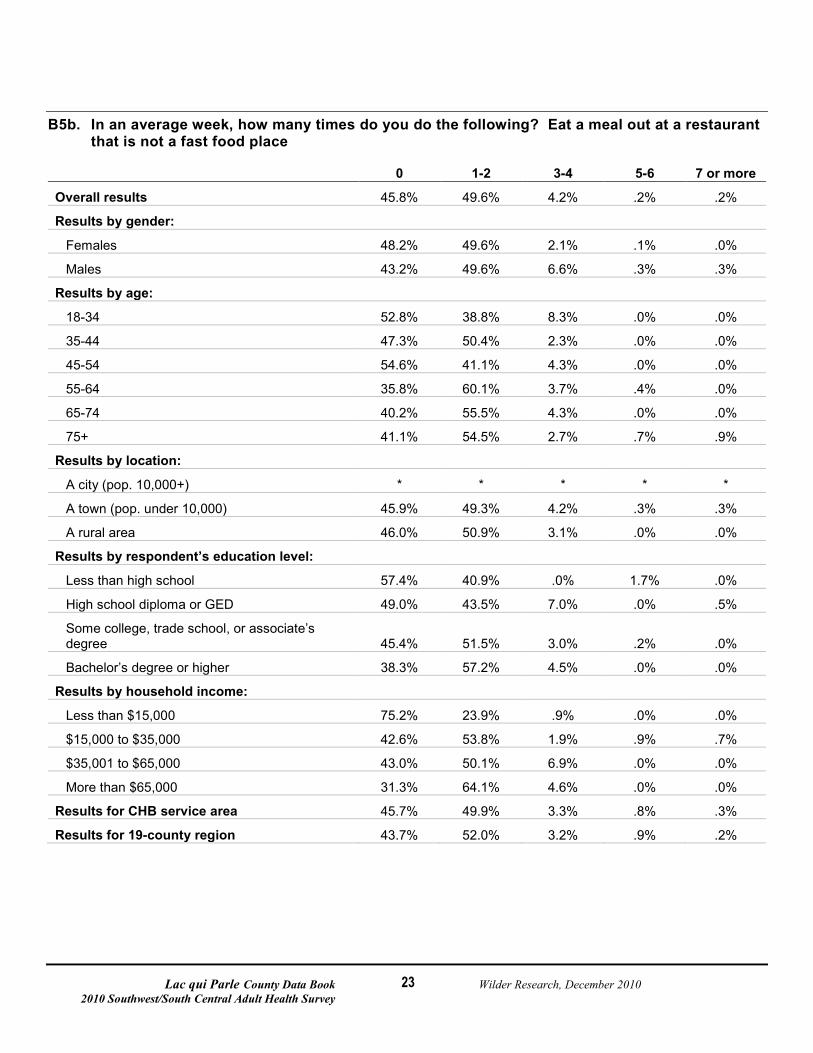
B5b. In an average week, how many times do you do the following? Eat a meal out at a restaurant that is not a fast food place
0 1-2 3-4 5-6 7 or more
Overall results 45.8% 49.6% 4.2% .2% .2%
Results by gender:
Females 48.2% 49.6% 2.1% .1% .0%
Males 43.2% 49.6% 6.6% .3% .3%
Results by age:
18-34 52.8% 38.8% 8.3% .0% .0%
35-44 47.3% 50.4% 2.3% .0% .0%
45-54 54.6% 41.1% 4.3% .0% .0%
55-64 35.8% 60.1% 3.7% .4% .0%
65-74 40.2% 55.5% 4.3% .0% .0%
75+ 41.1% 54.5% 2.7% .7% .9%
Results by location:
A city (pop. 10,000+) * * * * *
A town (pop. under 10,000) 45.9% 49.3% 4.2% .3% .3%
A rural area 46.0% 50.9% 3.1% .0% .0%
Results by respondent’s education level:
Less than high school 57.4% 40.9% .0% 1.7% .0%
High school diploma or GED 49.0% 43.5% 7.0% .0% .5%
Some college, trade school, or associate’s degree 45.4% 51.5% 3.0% .2% .0%
Bachelor’s degree or higher 38.3% 57.2% 4.5% .0% .0%
Results by household income:
Less than $15,000 75.2% 23.9% .9% .0% .0%
$15,000 to $35,000 42.6% 53.8% 1.9% .9% .7%
$35,001 to $65,000 43.0% 50.1% 6.9% .0% .0%
More than $65,000 31.3% 64.1% 4.6% .0% .0%
Results for CHB service area 45.7% 49.9% 3.3% .8% .3%
Results for 19-county region 43.7% 52.0% 3.2% .9% .2%
Lac qui Parle County Data Book Wilder Research, December 2010 2010 Southwest/South Central Adult Health Survey
24
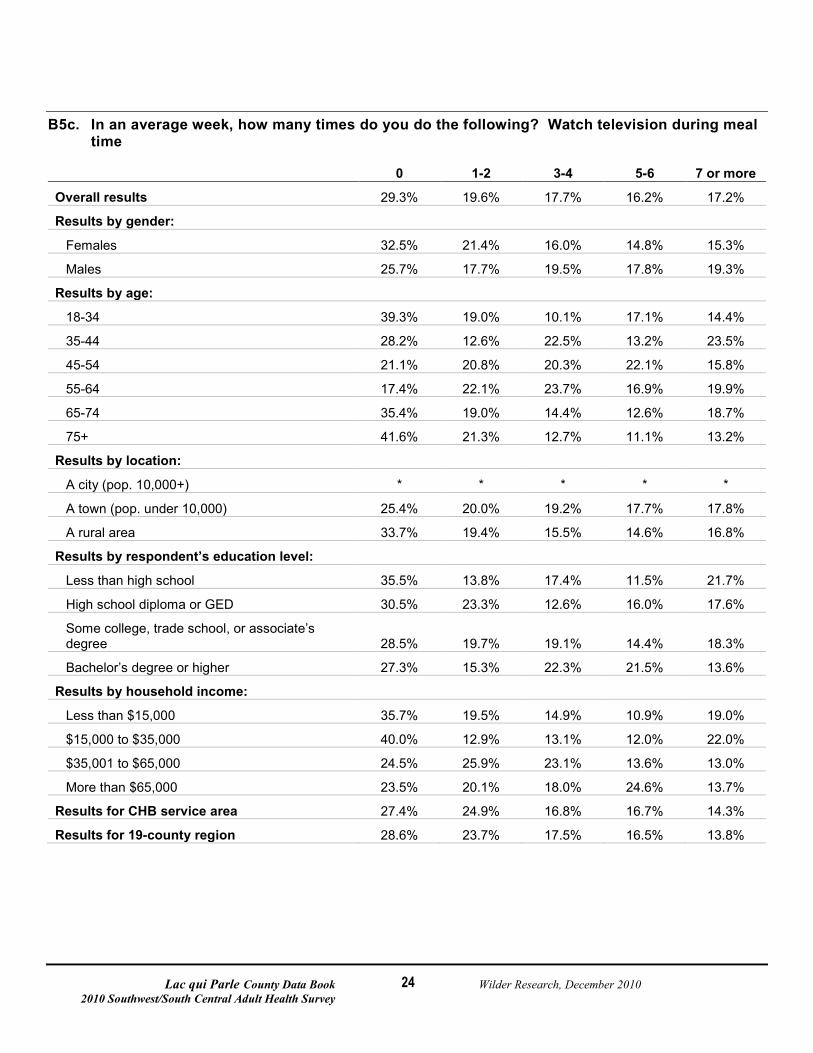
B5c. In an average week, how many times do you do the following? Watch television during meal time
0 1-2 3-4 5-6 7 or more
Overall results 29.3% 19.6% 17.7% 16.2% 17.2%
Results by gender:
Females 32.5% 21.4% 16.0% 14.8% 15.3%
Males 25.7% 17.7% 19.5% 17.8% 19.3%
Results by age:
18-34 39.3% 19.0% 10.1% 17.1% 14.4%
35-44 28.2% 12.6% 22.5% 13.2% 23.5%
45-54 21.1% 20.8% 20.3% 22.1% 15.8%
55-64 17.4% 22.1% 23.7% 16.9% 19.9%
65-74 35.4% 19.0% 14.4% 12.6% 18.7%
75+ 41.6% 21.3% 12.7% 11.1% 13.2%
Results by location:
A city (pop. 10,000+) * * * * *
A town (pop. under 10,000) 25.4% 20.0% 19.2% 17.7% 17.8%
A rural area 33.7% 19.4% 15.5% 14.6% 16.8%
Results by respondent’s education level:
Less than high school 35.5% 13.8% 17.4% 11.5% 21.7%
High school diploma or GED 30.5% 23.3% 12.6% 16.0% 17.6%
Some college, trade school, or associate’s degree 28.5% 19.7% 19.1% 14.4% 18.3%
Bachelor’s degree or higher 27.3% 15.3% 22.3% 21.5% 13.6%
Results by household income:
Less than $15,000 35.7% 19.5% 14.9% 10.9% 19.0%
$15,000 to $35,000 40.0% 12.9% 13.1% 12.0% 22.0%
$35,001 to $65,000 24.5% 25.9% 23.1% 13.6% 13.0%
More than $65,000 23.5% 20.1% 18.0% 24.6% 13.7%
Results for CHB service area 27.4% 24.9% 16.8% 16.7% 14.3%
Results for 19-county region 28.6% 23.7% 17.5% 16.5% 13.8%
Lac qui Parle County Data Book Wilder Research, December 2010 2010 Southwest/South Central Adult Health Survey
25
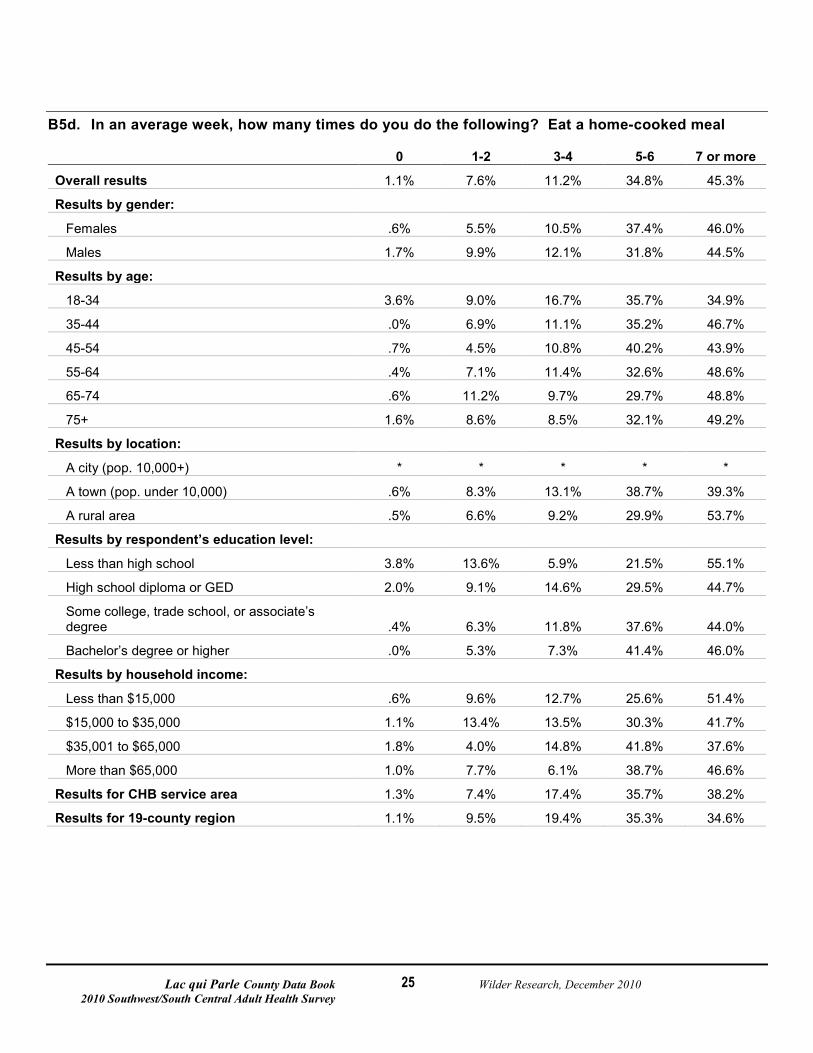
B5d. In an average week, how many times do you do the following? Eat a home-cooked meal
0 1-2 3-4 5-6 7 or more
Overall results 1.1% 7.6% 11.2% 34.8% 45.3%
Results by gender:
Females .6% 5.5% 10.5% 37.4% 46.0%
Males 1.7% 9.9% 12.1% 31.8% 44.5%
Results by age:
18-34 3.6% 9.0% 16.7% 35.7% 34.9%
35-44 .0% 6.9% 11.1% 35.2% 46.7%
45-54 .7% 4.5% 10.8% 40.2% 43.9%
55-64 .4% 7.1% 11.4% 32.6% 48.6%
65-74 .6% 11.2% 9.7% 29.7% 48.8%
75+ 1.6% 8.6% 8.5% 32.1% 49.2%
Results by location:
A city (pop. 10,000+) * * * * *
A town (pop. under 10,000) .6% 8.3% 13.1% 38.7% 39.3%
A rural area .5% 6.6% 9.2% 29.9% 53.7%
Results by respondent’s education level:
Less than high school 3.8% 13.6% 5.9% 21.5% 55.1%
High school diploma or GED 2.0% 9.1% 14.6% 29.5% 44.7%
Some college, trade school, or associate’s degree .4% 6.3% 11.8% 37.6% 44.0%
Bachelor’s degree or higher .0% 5.3% 7.3% 41.4% 46.0%
Results by household income:
Less than $15,000 .6% 9.6% 12.7% 25.6% 51.4%
$15,000 to $35,000 1.1% 13.4% 13.5% 30.3% 41.7%
$35,001 to $65,000 1.8% 4.0% 14.8% 41.8% 37.6%
More than $65,000 1.0% 7.7% 6.1% 38.7% 46.6%
Results for CHB service area 1.3% 7.4% 17.4% 35.7% 38.2%
Results for 19-county region 1.1% 9.5% 19.4% 35.3% 34.6%
Lac qui Parle County Data Book Wilder Research, December 2010 2010 Southwest/South Central Adult Health Survey
26
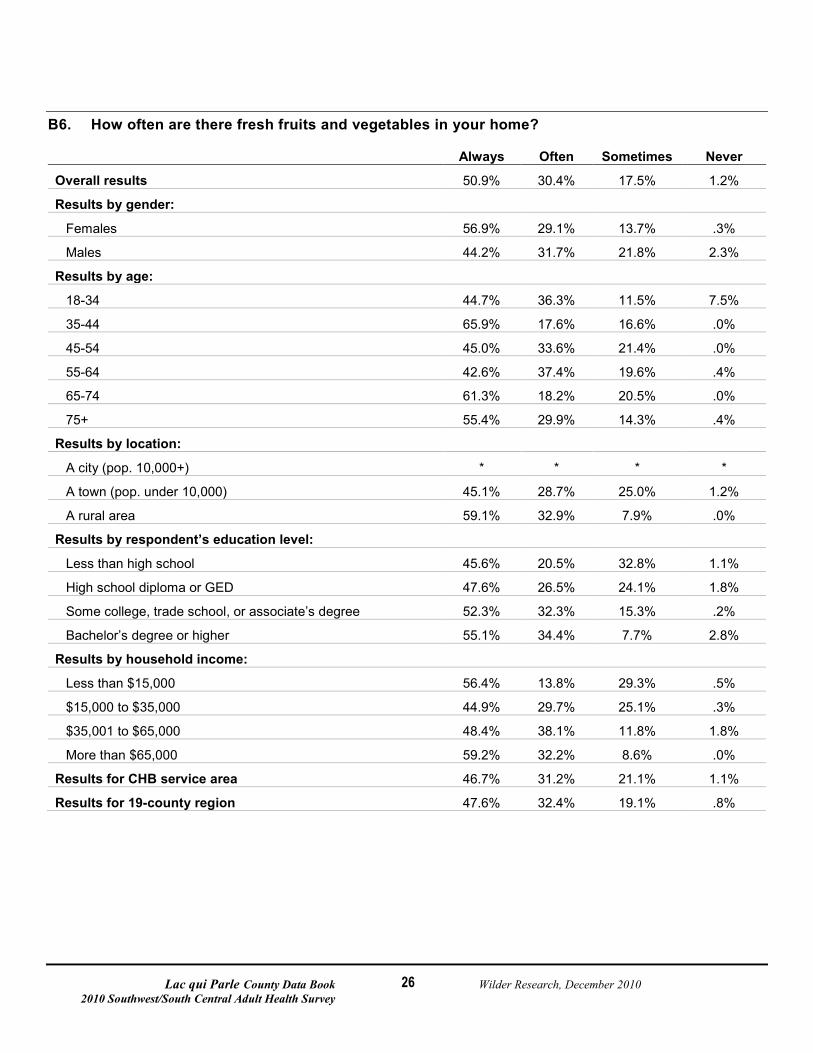
B6. How often are there fresh fruits and vegetables in your home?
Always Often Sometimes Never
Overall results 50.9% 30.4% 17.5% 1.2%
Results by gender:
Females 56.9% 29.1% 13.7% .3%
Males 44.2% 31.7% 21.8% 2.3%
Results by age:
18-34 44.7% 36.3% 11.5% 7.5%
35-44 65.9% 17.6% 16.6% .0%
45-54 45.0% 33.6% 21.4% .0%
55-64 42.6% 37.4% 19.6% .4%
65-74 61.3% 18.2% 20.5% .0%
75+ 55.4% 29.9% 14.3% .4%
Results by location:
A city (pop. 10,000+) * * * *
A town (pop. under 10,000) 45.1% 28.7% 25.0% 1.2%
A rural area 59.1% 32.9% 7.9% .0%
Results by respondent’s education level:
Less than high school 45.6% 20.5% 32.8% 1.1%
High school diploma or GED 47.6% 26.5% 24.1% 1.8%
Some college, trade school, or associate’s degree 52.3% 32.3% 15.3% .2%
Bachelor’s degree or higher 55.1% 34.4% 7.7% 2.8%
Results by household income:
Less than $15,000 56.4% 13.8% 29.3% .5%
$15,000 to $35,000 44.9% 29.7% 25.1% .3%
$35,001 to $65,000 48.4% 38.1% 11.8% 1.8%
More than $65,000 59.2% 32.2% 8.6% .0%
Results for CHB service area 46.7% 31.2% 21.1% 1.1%
Results for 19-county region 47.6% 32.4% 19.1% .8%
Lac qui Parle County Data Book Wilder Research, December 2010 2010 Southwest/South Central Adult Health Survey
27
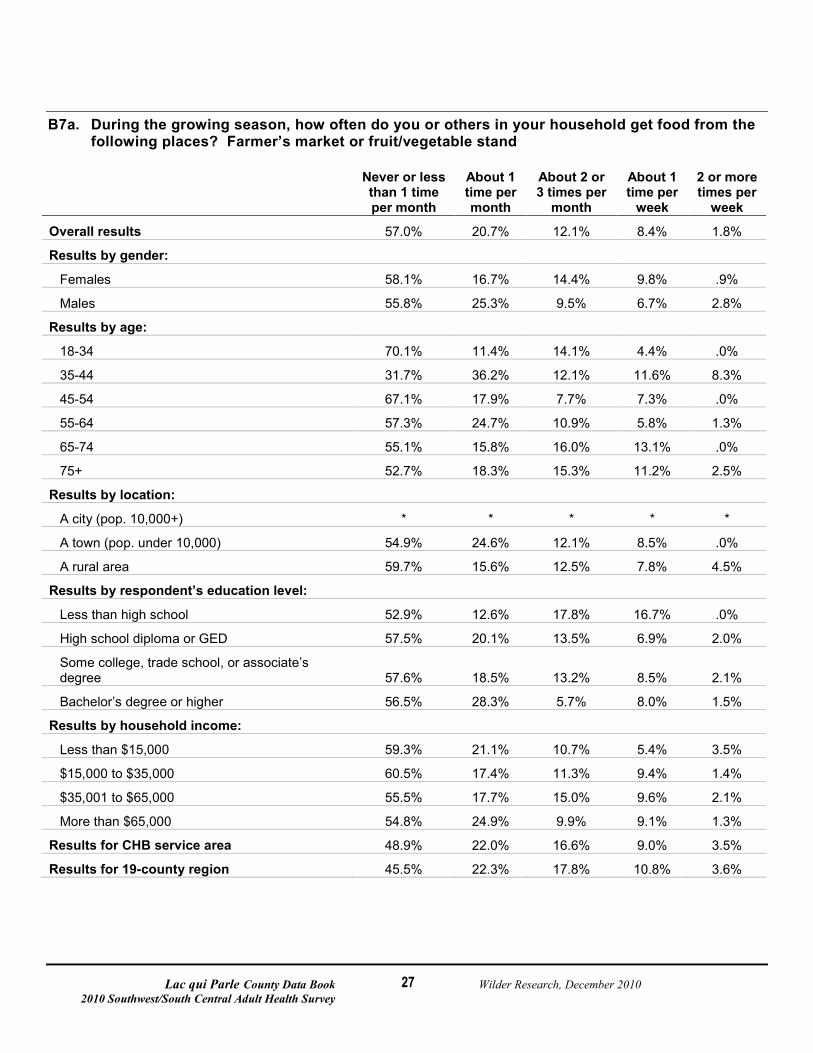
B7a. During the growing season, how often do you or others in your household get food from the following places? Farmer’s market or fruit/vegetable stand
Never or less than 1 time per month
About 1 time per month
About 2 or 3 times per
month
About 1 time per
week
2 or more times per
week
Overall results 57.0% 20.7% 12.1% 8.4% 1.8%
Results by gender:
Females 58.1% 16.7% 14.4% 9.8% .9%
Males 55.8% 25.3% 9.5% 6.7% 2.8%
Results by age:
18-34 70.1% 11.4% 14.1% 4.4% .0%
35-44 31.7% 36.2% 12.1% 11.6% 8.3%
45-54 67.1% 17.9% 7.7% 7.3% .0%
55-64 57.3% 24.7% 10.9% 5.8% 1.3%
65-74 55.1% 15.8% 16.0% 13.1% .0%
75+ 52.7% 18.3% 15.3% 11.2% 2.5%
Results by location:
A city (pop. 10,000+) * * * * *
A town (pop. under 10,000) 54.9% 24.6% 12.1% 8.5% .0%
A rural area 59.7% 15.6% 12.5% 7.8% 4.5%
Results by respondent’s education level:
Less than high school 52.9% 12.6% 17.8% 16.7% .0%
High school diploma or GED 57.5% 20.1% 13.5% 6.9% 2.0%
Some college, trade school, or associate’s degree 57.6% 18.5% 13.2% 8.5% 2.1%
Bachelor’s degree or higher 56.5% 28.3% 5.7% 8.0% 1.5%
Results by household income:
Less than $15,000 59.3% 21.1% 10.7% 5.4% 3.5%
$15,000 to $35,000 60.5% 17.4% 11.3% 9.4% 1.4%
$35,001 to $65,000 55.5% 17.7% 15.0% 9.6% 2.1%
More than $65,000 54.8% 24.9% 9.9% 9.1% 1.3%
Results for CHB service area 48.9% 22.0% 16.6% 9.0% 3.5%
Results for 19-county region 45.5% 22.3% 17.8% 10.8% 3.6%
Lac qui Parle County Data Book Wilder Research, December 2010 2010 Southwest/South Central Adult Health Survey
28
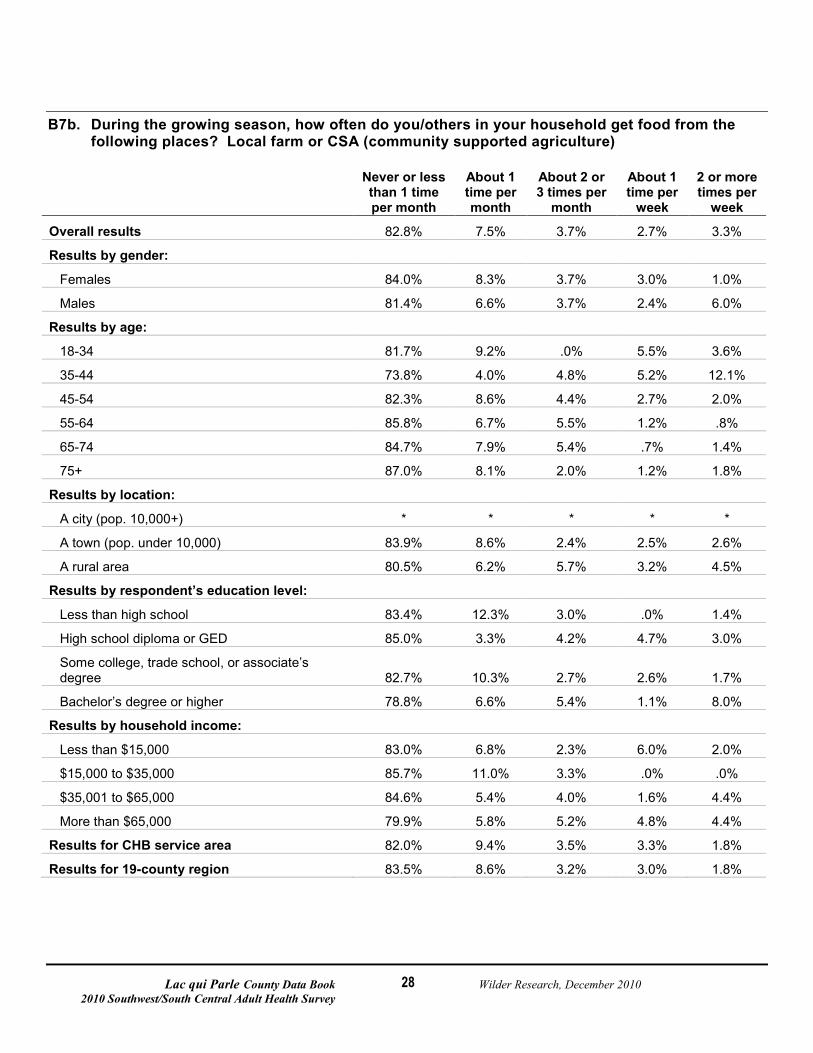
B7b. During the growing season, how often do you/others in your household get food from the following places? Local farm or CSA (community supported agriculture)
Never or less than 1 time per month
About 1 time per month
About 2 or 3 times per
month
About 1 time per
week
2 or more times per
week
Overall results 82.8% 7.5% 3.7% 2.7% 3.3%
Results by gender:
Females 84.0% 8.3% 3.7% 3.0% 1.0%
Males 81.4% 6.6% 3.7% 2.4% 6.0%
Results by age:
18-34 81.7% 9.2% .0% 5.5% 3.6%
35-44 73.8% 4.0% 4.8% 5.2% 12.1%
45-54 82.3% 8.6% 4.4% 2.7% 2.0%
55-64 85.8% 6.7% 5.5% 1.2% .8%
65-74 84.7% 7.9% 5.4% .7% 1.4%
75+ 87.0% 8.1% 2.0% 1.2% 1.8%
Results by location:
A city (pop. 10,000+) * * * * *
A town (pop. under 10,000) 83.9% 8.6% 2.4% 2.5% 2.6%
A rural area 80.5% 6.2% 5.7% 3.2% 4.5%
Results by respondent’s education level:
Less than high school 83.4% 12.3% 3.0% .0% 1.4%
High school diploma or GED 85.0% 3.3% 4.2% 4.7% 3.0%
Some college, trade school, or associate’s degree 82.7% 10.3% 2.7% 2.6% 1.7%
Bachelor’s degree or higher 78.8% 6.6% 5.4% 1.1% 8.0%
Results by household income:
Less than $15,000 83.0% 6.8% 2.3% 6.0% 2.0%
$15,000 to $35,000 85.7% 11.0% 3.3% .0% .0%
$35,001 to $65,000 84.6% 5.4% 4.0% 1.6% 4.4%
More than $65,000 79.9% 5.8% 5.2% 4.8% 4.4%
Results for CHB service area 82.0% 9.4% 3.5% 3.3% 1.8%
Results for 19-county region 83.5% 8.6% 3.2% 3.0% 1.8%
Lac qui Parle County Data Book Wilder Research, December 2010 2010 Southwest/South Central Adult Health Survey
29
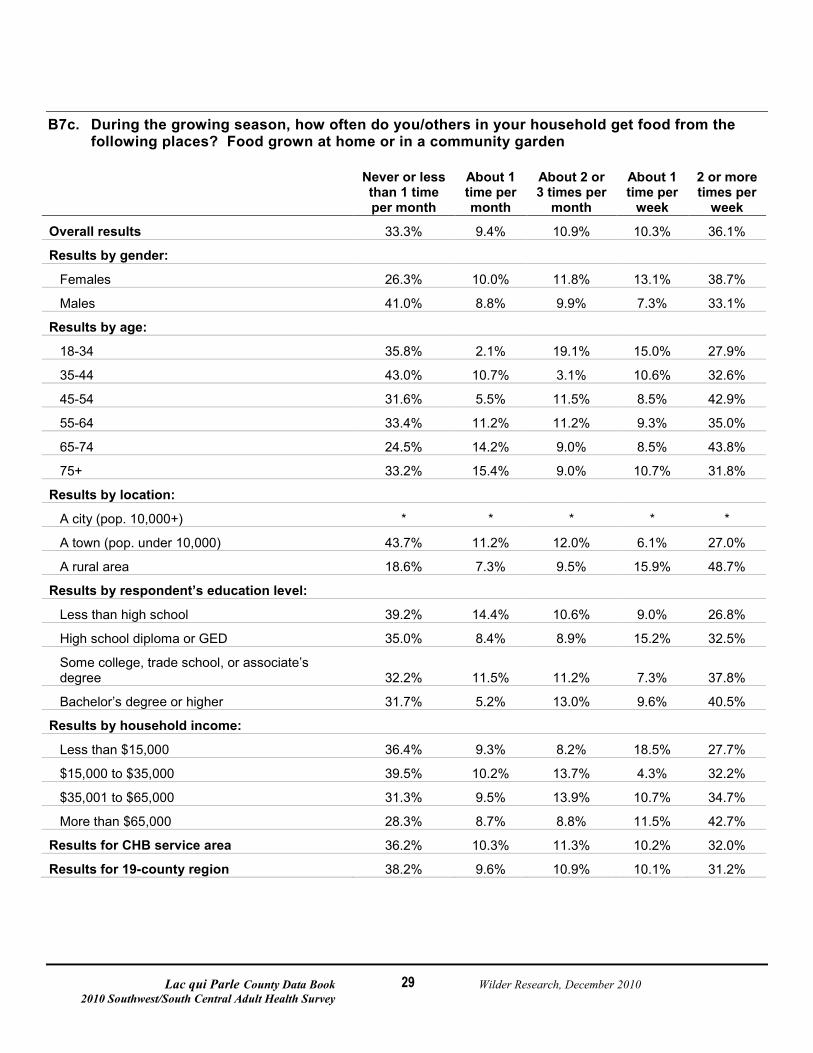
B7c. During the growing season, how often do you/others in your household get food from the following places? Food grown at home or in a community garden
Never or less than 1 time per month
About 1 time per month
About 2 or 3 times per
month
About 1 time per
week
2 or more times per
week
Overall results 33.3% 9.4% 10.9% 10.3% 36.1%
Results by gender:
Females 26.3% 10.0% 11.8% 13.1% 38.7%
Males 41.0% 8.8% 9.9% 7.3% 33.1%
Results by age:
18-34 35.8% 2.1% 19.1% 15.0% 27.9%
35-44 43.0% 10.7% 3.1% 10.6% 32.6%
45-54 31.6% 5.5% 11.5% 8.5% 42.9%
55-64 33.4% 11.2% 11.2% 9.3% 35.0%
65-74 24.5% 14.2% 9.0% 8.5% 43.8%
75+ 33.2% 15.4% 9.0% 10.7% 31.8%
Results by location:
A city (pop. 10,000+) * * * * *
A town (pop. under 10,000) 43.7% 11.2% 12.0% 6.1% 27.0%
A rural area 18.6% 7.3% 9.5% 15.9% 48.7%
Results by respondent’s education level:
Less than high school 39.2% 14.4% 10.6% 9.0% 26.8%
High school diploma or GED 35.0% 8.4% 8.9% 15.2% 32.5%
Some college, trade school, or associate’s degree 32.2% 11.5% 11.2% 7.3% 37.8%
Bachelor’s degree or higher 31.7% 5.2% 13.0% 9.6% 40.5%
Results by household income:
Less than $15,000 36.4% 9.3% 8.2% 18.5% 27.7%
$15,000 to $35,000 39.5% 10.2% 13.7% 4.3% 32.2%
$35,001 to $65,000 31.3% 9.5% 13.9% 10.7% 34.7%
More than $65,000 28.3% 8.7% 8.8% 11.5% 42.7%
Results for CHB service area 36.2% 10.3% 11.3% 10.2% 32.0%
Results for 19-county region 38.2% 9.6% 10.9% 10.1% 31.2%
Lac qui Parle County Data Book Wilder Research, December 2010 2010 Southwest/South Central Adult Health Survey
30
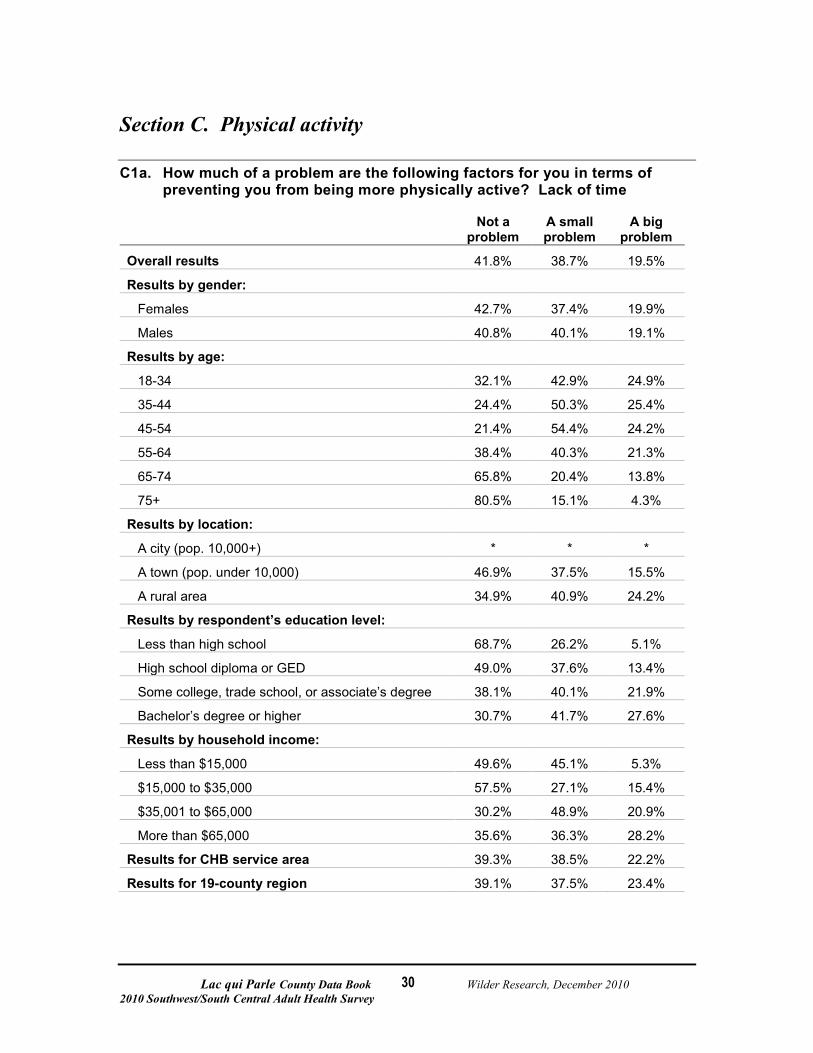
Section C. Physical activity
C1a. How much of a problem are the following factors for you in terms of preventing you from being more physically active? Lack of time
Not a
problem A small problem
A big problem
Overall results 41.8% 38.7% 19.5%
Results by gender:
Females 42.7% 37.4% 19.9%
Males 40.8% 40.1% 19.1%
Results by age:
18-34 32.1% 42.9% 24.9%
35-44 24.4% 50.3% 25.4%
45-54 21.4% 54.4% 24.2%
55-64 38.4% 40.3% 21.3%
65-74 65.8% 20.4% 13.8%
75+ 80.5% 15.1% 4.3%
Results by location:
A city (pop. 10,000+) * * *
A town (pop. under 10,000) 46.9% 37.5% 15.5%
A rural area 34.9% 40.9% 24.2%
Results by respondent’s education level:
Less than high school 68.7% 26.2% 5.1%
High school diploma or GED 49.0% 37.6% 13.4%
Some college, trade school, or associate’s degree 38.1% 40.1% 21.9%
Bachelor’s degree or higher 30.7% 41.7% 27.6%
Results by household income:
Less than $15,000 49.6% 45.1% 5.3%
$15,000 to $35,000 57.5% 27.1% 15.4%
$35,001 to $65,000 30.2% 48.9% 20.9%
More than $65,000 35.6% 36.3% 28.2%
Results for CHB service area 39.3% 38.5% 22.2%
Results for 19-county region 39.1% 37.5% 23.4%

Lac qui Parle County Data Book Wilder Research, December 2010 2010 Southwest/South Central Adult Health Survey
31
C1b. How much of a problem are the following factors for you in terms of preventing you from being more physically active? Lack of programs, leaders, or facilities
Not a
problem A small problem
A big problem
Overall results 50.8% 30.7% 18.4%
Results by gender:
Females 48.1% 33.1% 18.8%
Males 53.9% 28.1% 18.0%
Results by age:
18-34 41.5% 41.3% 17.2%
35-44 34.1% 40.0% 25.9%
45-54 48.6% 27.4% 24.0%
55-64 60.2% 25.2% 14.6%
65-74 49.8% 31.8% 18.4%
75+ 67.4% 23.5% 9.1%
Results by location:
A city (pop. 10,000+) * * *
A town (pop. under 10,000) 49.3% 28.8% 21.9%
A rural area 53.0% 33.1% 13.9%
Results by respondent’s education level:
Less than high school 53.0% 21.0% 26.0%
High school diploma or GED 55.9% 24.7% 19.3%
Some college, trade school, or associate’s degree 50.5% 30.8% 18.7%
Bachelor’s degree or higher 43.7% 42.6% 13.7%
Results by household income:
Less than $15,000 45.7% 26.0% 28.3%
$15,000 to $35,000 52.6% 30.6% 16.9%
$35,001 to $65,000 50.4% 30.5% 19.1%
More than $65,000 49.1% 38.0% 12.9%
Results for CHB service area 57.8% 27.4% 14.9%
Results for 19-county region 67.1% 24.3% 8.6%
Lac qui Parle County Data Book Wilder Research, December 2010 2010 Southwest/South Central Adult Health Survey
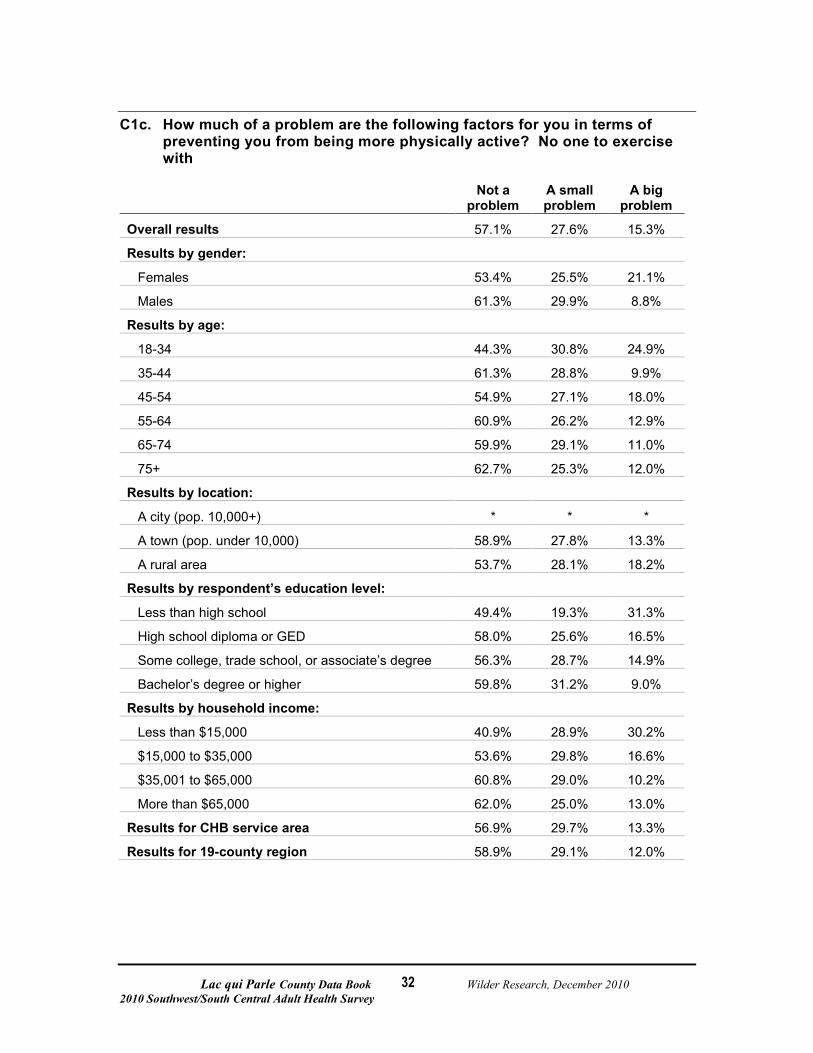
32
C1c. How much of a problem are the following factors for you in terms of preventing you from being more physically active? No one to exercise with
Not a
problem A small problem
A big problem
Overall results 57.1% 27.6% 15.3%
Results by gender:
Females 53.4% 25.5% 21.1%
Males 61.3% 29.9% 8.8%
Results by age:
18-34 44.3% 30.8% 24.9%
35-44 61.3% 28.8% 9.9%
45-54 54.9% 27.1% 18.0%
55-64 60.9% 26.2% 12.9%
65-74 59.9% 29.1% 11.0%
75+ 62.7% 25.3% 12.0%
Results by location:
A city (pop. 10,000+) * * *
A town (pop. under 10,000) 58.9% 27.8% 13.3%
A rural area 53.7% 28.1% 18.2%
Results by respondent’s education level:
Less than high school 49.4% 19.3% 31.3%
High school diploma or GED 58.0% 25.6% 16.5%
Some college, trade school, or associate’s degree 56.3% 28.7% 14.9%
Bachelor’s degree or higher 59.8% 31.2% 9.0%
Results by household income:
Less than $15,000 40.9% 28.9% 30.2%
$15,000 to $35,000 53.6% 29.8% 16.6%
$35,001 to $65,000 60.8% 29.0% 10.2%
More than $65,000 62.0% 25.0% 13.0%
Results for CHB service area 56.9% 29.7% 13.3%
Results for 19-county region 58.9% 29.1% 12.0%
Lac qui Parle County Data Book Wilder Research, December 2010 2010 Southwest/South Central Adult Health Survey
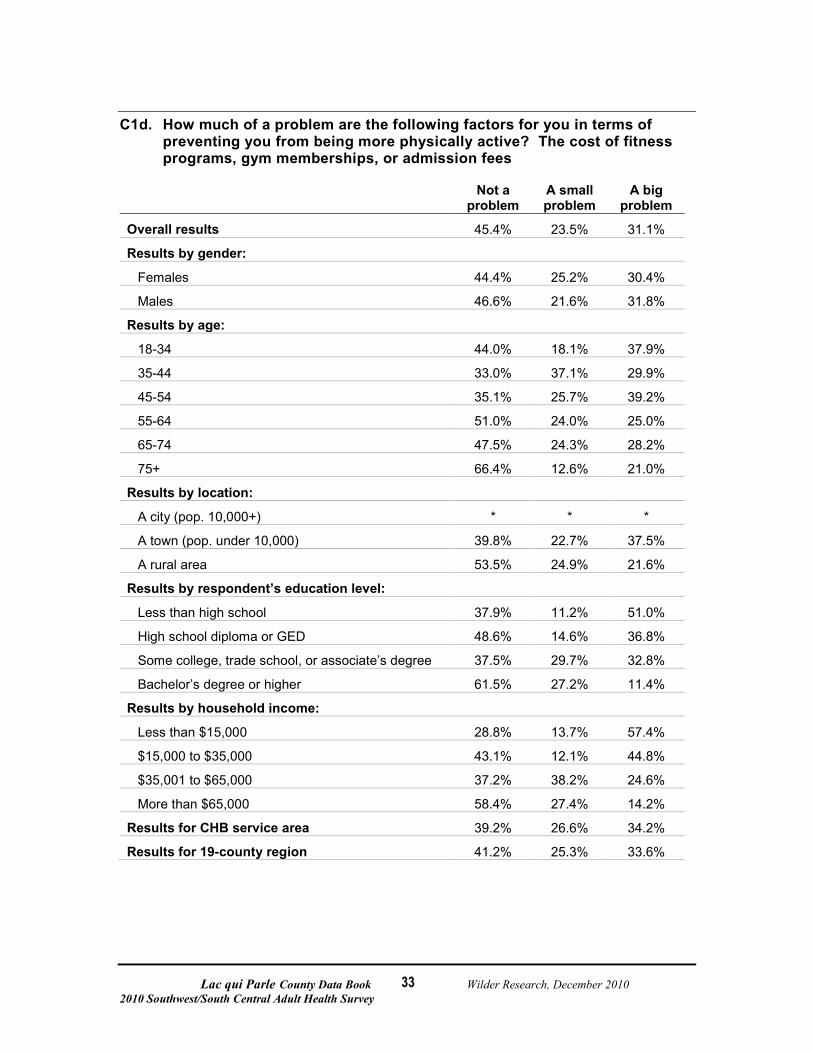
33
C1d. How much of a problem are the following factors for you in terms of preventing you from being more physically active? The cost of fitness programs, gym memberships, or admission fees
Not a
problem A small problem
A big problem
Overall results 45.4% 23.5% 31.1%
Results by gender:
Females 44.4% 25.2% 30.4%
Males 46.6% 21.6% 31.8%
Results by age:
18-34 44.0% 18.1% 37.9%
35-44 33.0% 37.1% 29.9%
45-54 35.1% 25.7% 39.2%
55-64 51.0% 24.0% 25.0%
65-74 47.5% 24.3% 28.2%
75+ 66.4% 12.6% 21.0%
Results by location:
A city (pop. 10,000+) * * *
A town (pop. under 10,000) 39.8% 22.7% 37.5%
A rural area 53.5% 24.9% 21.6%
Results by respondent’s education level:
Less than high school 37.9% 11.2% 51.0%
High school diploma or GED 48.6% 14.6% 36.8%
Some college, trade school, or associate’s degree 37.5% 29.7% 32.8%
Bachelor’s degree or higher 61.5% 27.2% 11.4%
Results by household income:
Less than $15,000 28.8% 13.7% 57.4%
$15,000 to $35,000 43.1% 12.1% 44.8%
$35,001 to $65,000 37.2% 38.2% 24.6%
More than $65,000 58.4% 27.4% 14.2%
Results for CHB service area 39.2% 26.6% 34.2%
Results for 19-county region 41.2% 25.3% 33.6%
Lac qui Parle County Data Book Wilder Research, December 2010 2010 Southwest/South Central Adult Health Survey
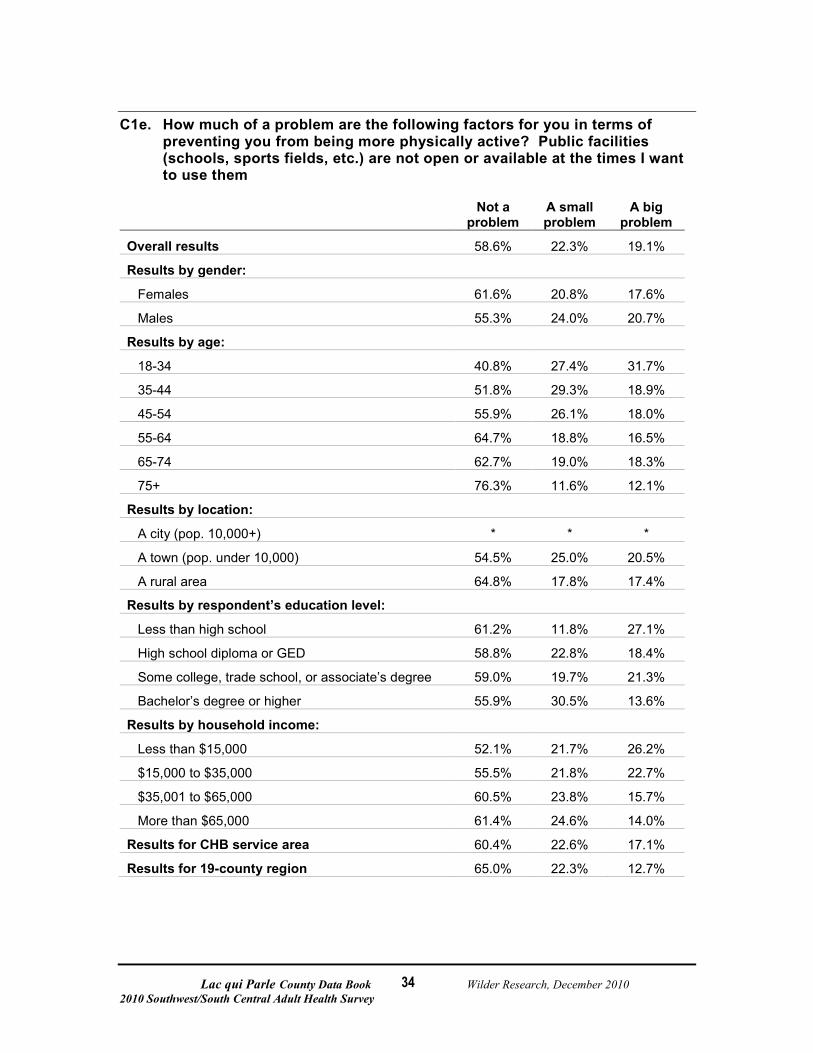
34
C1e. How much of a problem are the following factors for you in terms of preventing you from being more physically active? Public facilities (schools, sports fields, etc.) are not open or available at the times I want to use them
Not a
problem A small problem
A big problem
Overall results 58.6% 22.3% 19.1%
Results by gender:
Females 61.6% 20.8% 17.6%
Males 55.3% 24.0% 20.7%
Results by age:
18-34 40.8% 27.4% 31.7%
35-44 51.8% 29.3% 18.9%
45-54 55.9% 26.1% 18.0%
55-64 64.7% 18.8% 16.5%
65-74 62.7% 19.0% 18.3%
75+ 76.3% 11.6% 12.1%
Results by location:
A city (pop. 10,000+) * * *
A town (pop. under 10,000) 54.5% 25.0% 20.5%
A rural area 64.8% 17.8% 17.4%
Results by respondent’s education level:
Less than high school 61.2% 11.8% 27.1%
High school diploma or GED 58.8% 22.8% 18.4%
Some college, trade school, or associate’s degree 59.0% 19.7% 21.3%
Bachelor’s degree or higher 55.9% 30.5% 13.6%
Results by household income:
Less than $15,000 52.1% 21.7% 26.2%
$15,000 to $35,000 55.5% 21.8% 22.7%
$35,001 to $65,000 60.5% 23.8% 15.7%
More than $65,000 61.4% 24.6% 14.0%
Results for CHB service area 60.4% 22.6% 17.1%
Results for 19-county region 65.0% 22.3% 12.7%

Lac qui Parle County Data Book Wilder Research, December 2010 2010 Southwest/South Central Adult Health Survey
35
C1f. How much of a problem are the following factors for you in terms of preventing you from being more physically active? Long-term illness, injury, or disability
Not a
problem A small problem
A big problem
Overall results 68.9% 19.0% 12.0%
Results by gender:
Females 69.7% 17.6% 12.7%
Males 68.0% 20.6% 11.3%
Results by age:
18-34 87.2% 8.3% 4.5%
35-44 84.8% 7.5% 7.6%
45-54 68.6% 21.6% 9.7%
55-64 65.8% 21.9% 12.4%
65-74 62.6% 18.7% 18.7%
75+ 47.9% 31.3% 20.8%
Results by location:
A city (pop. 10,000+) * * *
A town (pop. under 10,000) 65.5% 19.5% 14.9%
A rural area 73.4% 18.0% 8.6%
Results by respondent’s education level:
Less than high school 45.0% 30.3% 24.6%
High school diploma or GED 66.9% 15.2% 17.9%
Some college, trade school, or associate’s degree 69.2% 22.0% 8.8%
Bachelor’s degree or higher 78.6% 15.0% 6.4%
Results by household income:
Less than $15,000 56.7% 20.6% 22.7%
$15,000 to $35,000 61.9% 23.0% 15.1%
$35,001 to $65,000 73.9% 17.6% 8.6%
More than $65,000 78.8% 15.8% 5.4%
Results for CHB service area 69.9% 17.7% 12.4%
Results for 19-county region 74.2% 15.4% 10.3%

Lac qui Parle County Data Book Wilder Research, December 2010 2010 Southwest/South Central Adult Health Survey
36
C1g. How much of a problem are the following factors for you in terms of preventing you from being more physically active? Distance I have to travel to a place where I can be physically active
Not a
problem A small problem
A big problem
Overall results 62.9% 22.0% 15.0%
Results by gender:
Females 60.3% 21.8% 17.9%
Males 65.9% 22.3% 11.8%
Results by age:
18-34 63.9% 26.2% 9.8%
35-44 61.7% 18.5% 19.8%
45-54 54.1% 24.2% 21.7%
55-64 66.7% 22.6% 10.7%
65-74 62.6% 23.1% 14.3%
75+ 73.5% 16.3% 10.2%
Results by location:
A city (pop. 10,000+) * * *
A town (pop. under 10,000) 68.7% 19.8% 11.5%
A rural area 54.9% 25.7% 19.4%
Results by respondent’s education level:
Less than high school 46.0% 24.9% 29.1%
High school diploma or GED 68.0% 21.0% 11.0%
Some college, trade school, or associate’s degree 61.5% 20.0% 18.5%
Bachelor’s degree or higher 63.7% 28.0% 8.2%
Results by household income:
Less than $15,000 56.2% 27.8% 16.0%
$15,000 to $35,000 62.7% 21.5% 15.7%
$35,001 to $65,000 64.8% 20.9% 14.3%
More than $65,000 63.8% 19.1% 17.2%
Results for CHB service area 68.0% 18.6% 13.5%
Results for 19-county region 74.1% 17.6% 8.3%
Lac qui Parle County Data Book Wilder Research, December 2010 2010 Southwest/South Central Adult Health Survey
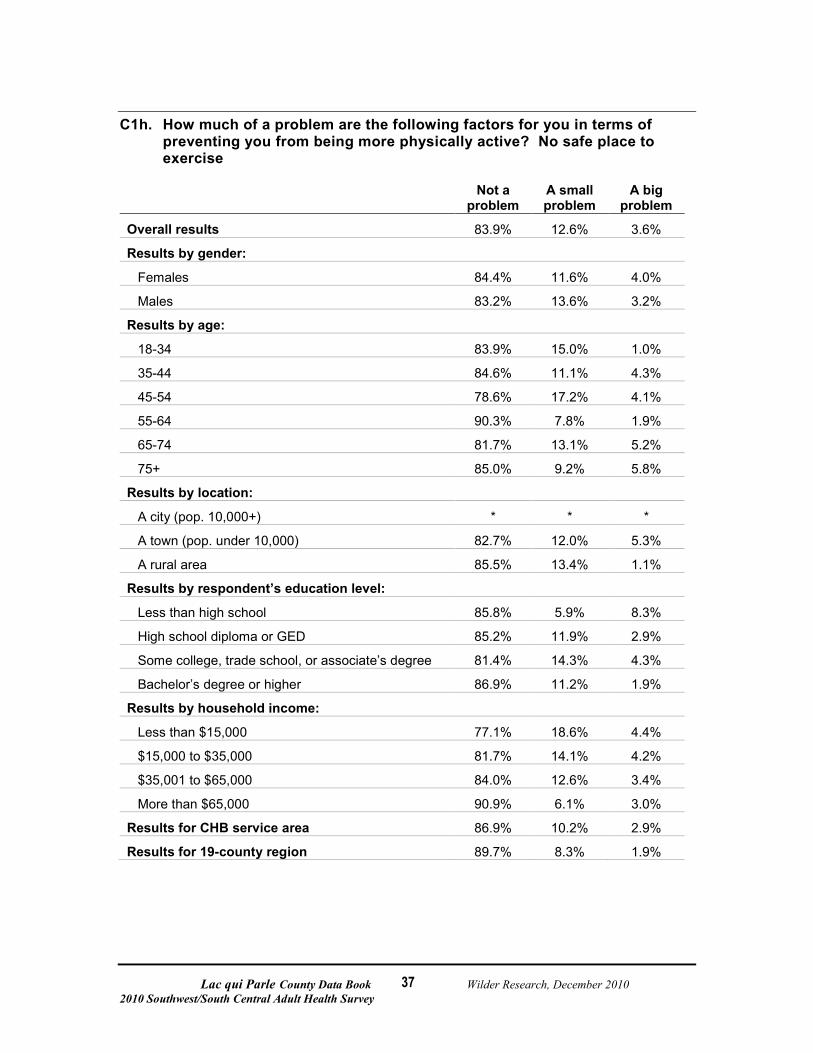
37
C1h. How much of a problem are the following factors for you in terms of preventing you from being more physically active? No safe place to exercise
Not a
problem A small problem
A big problem
Overall results 83.9% 12.6% 3.6%
Results by gender:
Females 84.4% 11.6% 4.0%
Males 83.2% 13.6% 3.2%
Results by age:
18-34 83.9% 15.0% 1.0%
35-44 84.6% 11.1% 4.3%
45-54 78.6% 17.2% 4.1%
55-64 90.3% 7.8% 1.9%
65-74 81.7% 13.1% 5.2%
75+ 85.0% 9.2% 5.8%
Results by location:
A city (pop. 10,000+) * * *
A town (pop. under 10,000) 82.7% 12.0% 5.3%
A rural area 85.5% 13.4% 1.1%
Results by respondent’s education level:
Less than high school 85.8% 5.9% 8.3%
High school diploma or GED 85.2% 11.9% 2.9%
Some college, trade school, or associate’s degree 81.4% 14.3% 4.3%
Bachelor’s degree or higher 86.9% 11.2% 1.9%
Results by household income:
Less than $15,000 77.1% 18.6% 4.4%
$15,000 to $35,000 81.7% 14.1% 4.2%
$35,001 to $65,000 84.0% 12.6% 3.4%
More than $65,000 90.9% 6.1% 3.0%
Results for CHB service area 86.9% 10.2% 2.9%
Results for 19-county region 89.7% 8.3% 1.9%
Lac qui Parle County Data Book Wilder Research, December 2010 2010 Southwest/South Central Adult Health Survey
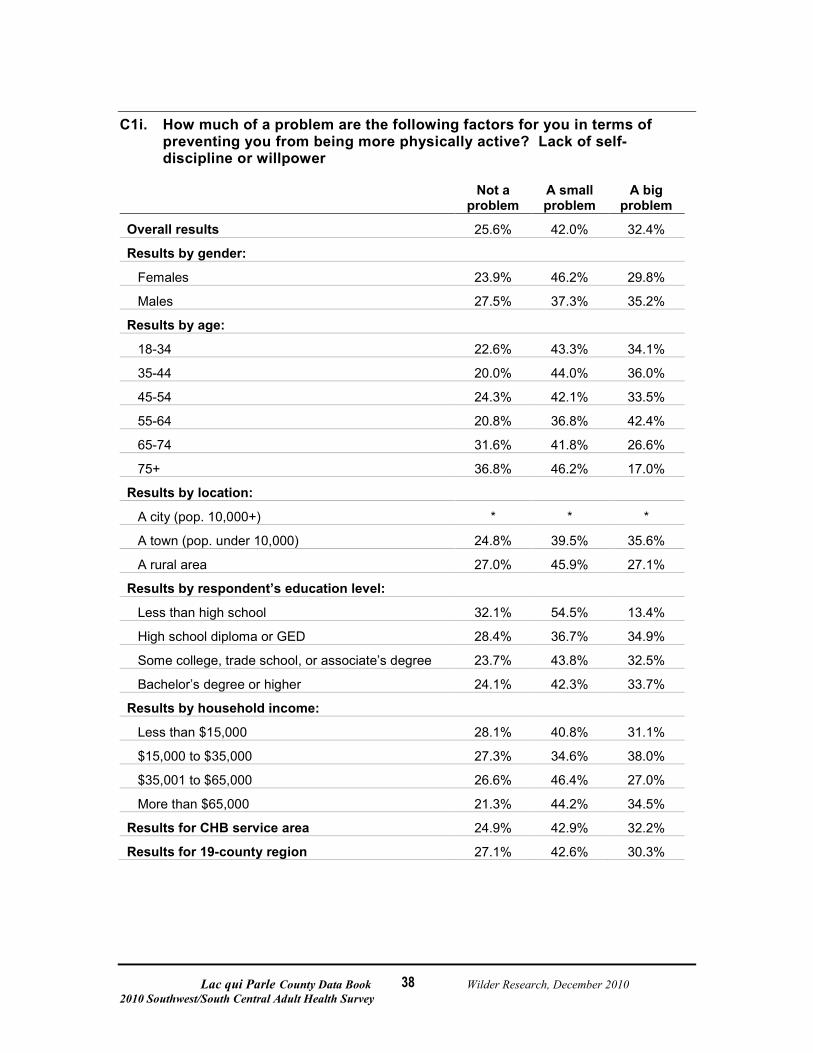
38
C1i. How much of a problem are the following factors for you in terms of preventing you from being more physically active? Lack of self-discipline or willpower
Not a
problem A small problem
A big problem
Overall results 25.6% 42.0% 32.4%
Results by gender:
Females 23.9% 46.2% 29.8%
Males 27.5% 37.3% 35.2%
Results by age:
18-34 22.6% 43.3% 34.1%
35-44 20.0% 44.0% 36.0%
45-54 24.3% 42.1% 33.5%
55-64 20.8% 36.8% 42.4%
65-74 31.6% 41.8% 26.6%
75+ 36.8% 46.2% 17.0%
Results by location:
A city (pop. 10,000+) * * *
A town (pop. under 10,000) 24.8% 39.5% 35.6%
A rural area 27.0% 45.9% 27.1%
Results by respondent’s education level:
Less than high school 32.1% 54.5% 13.4%
High school diploma or GED 28.4% 36.7% 34.9%
Some college, trade school, or associate’s degree 23.7% 43.8% 32.5%
Bachelor’s degree or higher 24.1% 42.3% 33.7%
Results by household income:
Less than $15,000 28.1% 40.8% 31.1%
$15,000 to $35,000 27.3% 34.6% 38.0%
$35,001 to $65,000 26.6% 46.4% 27.0%
More than $65,000 21.3% 44.2% 34.5%
Results for CHB service area 24.9% 42.9% 32.2%
Results for 19-county region 27.1% 42.6% 30.3%
Lac qui Parle County Data Book Wilder Research, December 2010 2010 Southwest/South Central Adult Health Survey
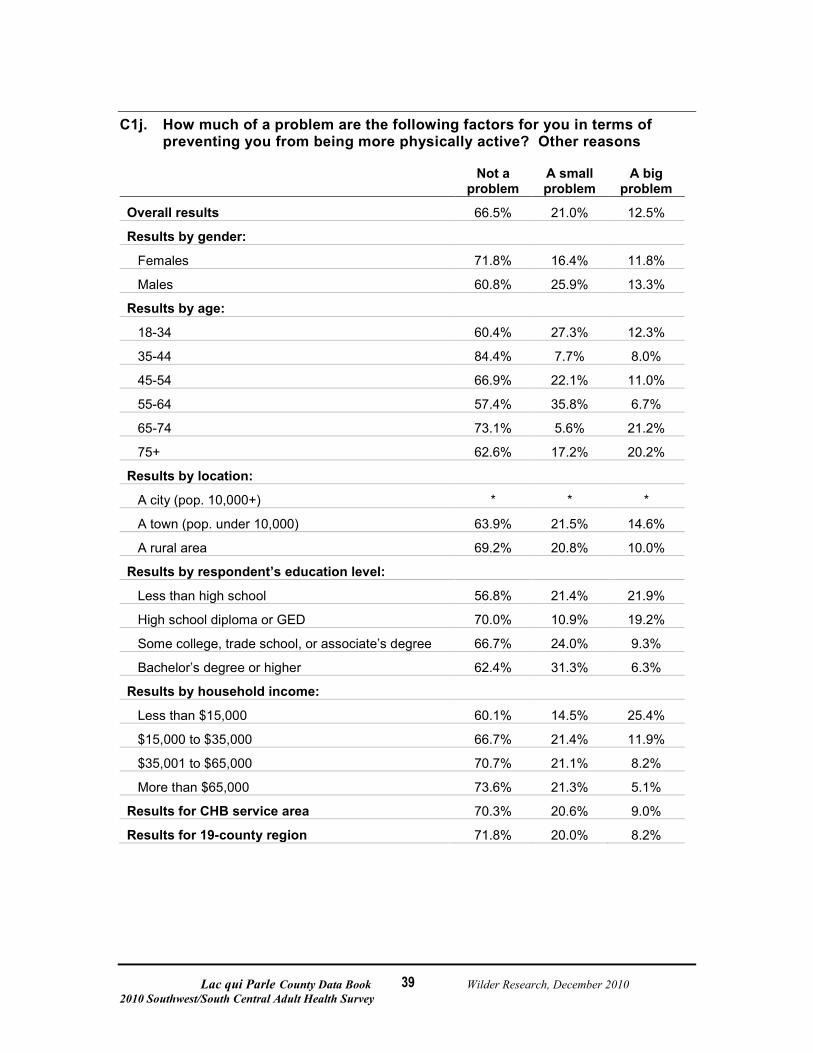
39
C1j. How much of a problem are the following factors for you in terms of preventing you from being more physically active? Other reasons
Not a
problem A small problem
A big problem
Overall results 66.5% 21.0% 12.5%
Results by gender:
Females 71.8% 16.4% 11.8%
Males 60.8% 25.9% 13.3%
Results by age:
18-34 60.4% 27.3% 12.3%
35-44 84.4% 7.7% 8.0%
45-54 66.9% 22.1% 11.0%
55-64 57.4% 35.8% 6.7%
65-74 73.1% 5.6% 21.2%
75+ 62.6% 17.2% 20.2%
Results by location:
A city (pop. 10,000+) * * *
A town (pop. under 10,000) 63.9% 21.5% 14.6%
A rural area 69.2% 20.8% 10.0%
Results by respondent’s education level:
Less than high school 56.8% 21.4% 21.9%
High school diploma or GED 70.0% 10.9% 19.2%
Some college, trade school, or associate’s degree 66.7% 24.0% 9.3%
Bachelor’s degree or higher 62.4% 31.3% 6.3%
Results by household income:
Less than $15,000 60.1% 14.5% 25.4%
$15,000 to $35,000 66.7% 21.4% 11.9%
$35,001 to $65,000 70.7% 21.1% 8.2%
More than $65,000 73.6% 21.3% 5.1%
Results for CHB service area 70.3% 20.6% 9.0%
Results for 19-county region 71.8% 20.0% 8.2%
Laq qui Parle County Data Book Wilder Research, December 2010 2010 Southwest/South Central Adult Health Survey
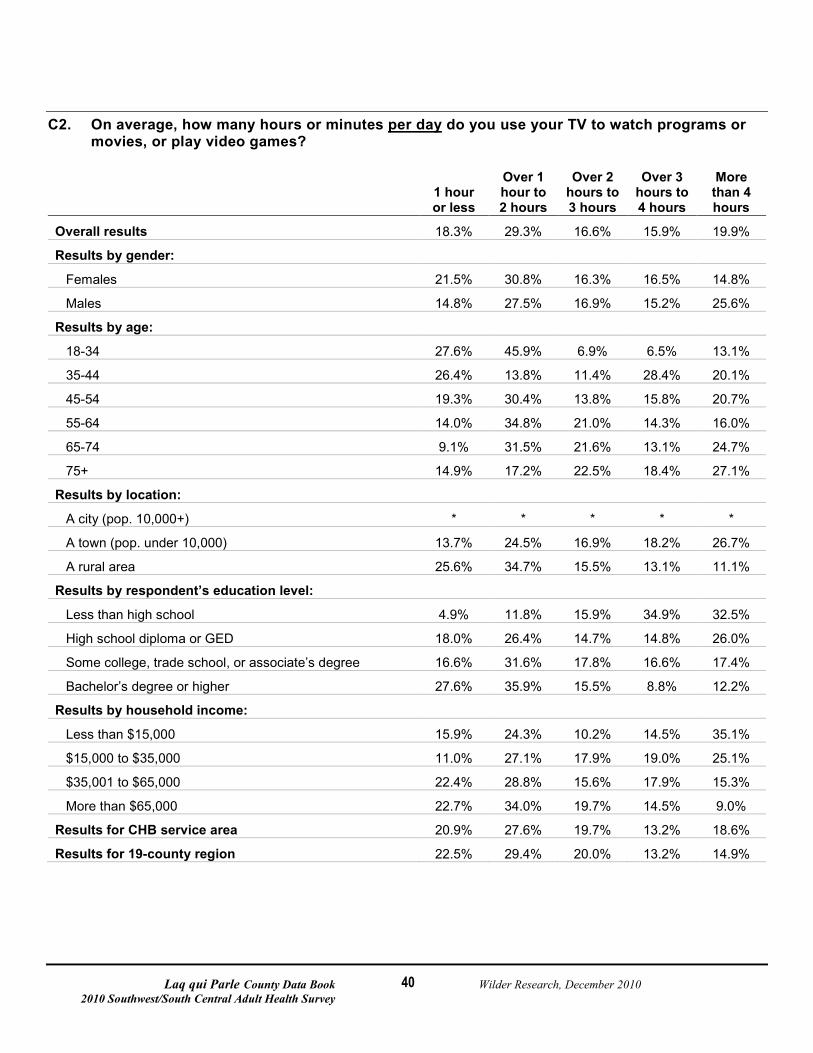
40
C2. On average, how many hours or minutes per day
do you use your TV to watch programs or movies, or play video games?
1 hour or less
Over 1 hour to 2 hours
Over 2 hours to 3 hours
Over 3 hours to 4 hours
More than 4 hours
Overall results 18.3% 29.3% 16.6% 15.9% 19.9%
Results by gender:
Females 21.5% 30.8% 16.3% 16.5% 14.8%
Males 14.8% 27.5% 16.9% 15.2% 25.6%
Results by age:
18-34 27.6% 45.9% 6.9% 6.5% 13.1%
35-44 26.4% 13.8% 11.4% 28.4% 20.1%
45-54 19.3% 30.4% 13.8% 15.8% 20.7%
55-64 14.0% 34.8% 21.0% 14.3% 16.0%
65-74 9.1% 31.5% 21.6% 13.1% 24.7%
75+ 14.9% 17.2% 22.5% 18.4% 27.1%
Results by location:
A city (pop. 10,000+) * * * * *
A town (pop. under 10,000) 13.7% 24.5% 16.9% 18.2% 26.7%
A rural area 25.6% 34.7% 15.5% 13.1% 11.1%
Results by respondent’s education level:
Less than high school 4.9% 11.8% 15.9% 34.9% 32.5%
High school diploma or GED 18.0% 26.4% 14.7% 14.8% 26.0%
Some college, trade school, or associate’s degree 16.6% 31.6% 17.8% 16.6% 17.4%
Bachelor’s degree or higher 27.6% 35.9% 15.5% 8.8% 12.2%
Results by household income:
Less than $15,000 15.9% 24.3% 10.2% 14.5% 35.1%
$15,000 to $35,000 11.0% 27.1% 17.9% 19.0% 25.1%
$35,001 to $65,000 22.4% 28.8% 15.6% 17.9% 15.3%
More than $65,000 22.7% 34.0% 19.7% 14.5% 9.0%
Results for CHB service area 20.9% 27.6% 19.7% 13.2% 18.6%
Results for 19-county region 22.5% 29.4% 20.0% 13.2% 14.9%
Laq qui Parle County Data Book Wilder Research, December 2010 2010 Southwest/South Central Adult Health Survey
41
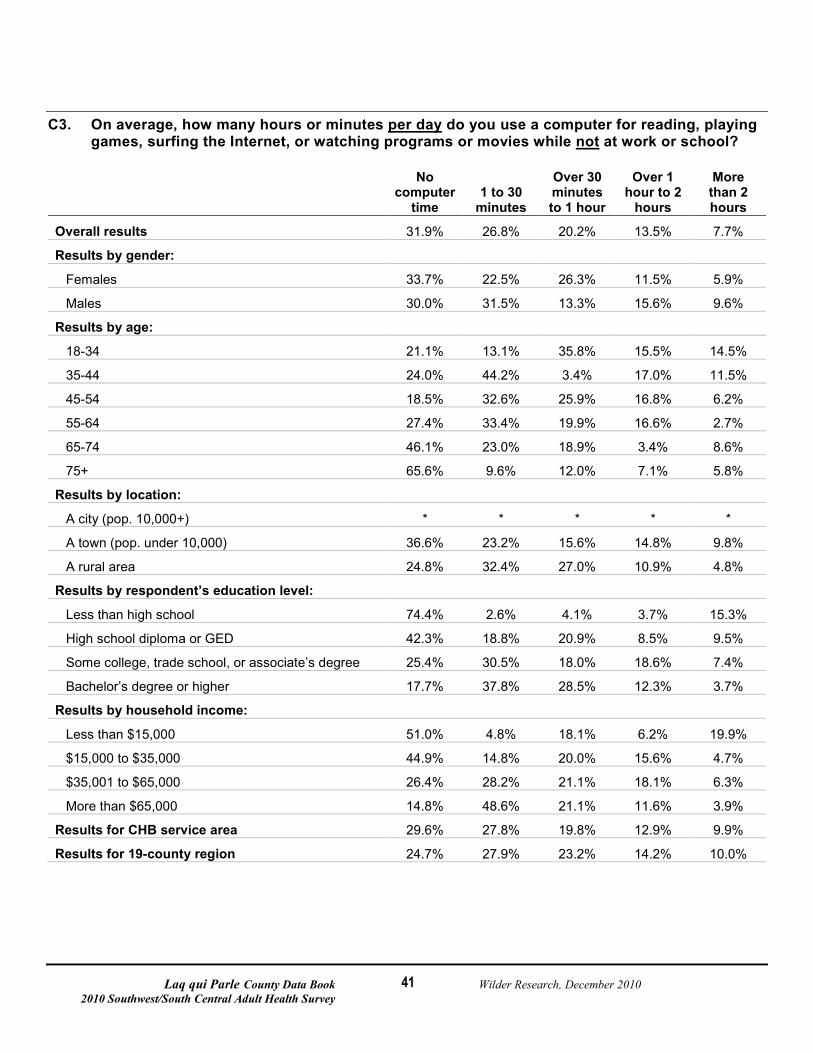
C3. On average, how many hours or minutes per day do you use a computer for reading, playing games, surfing the Internet, or watching programs or movies while not
at work or school?
No computer
time 1 to 30
minutes
Over 30 minutes to 1 hour
Over 1 hour to 2
hours
More than 2 hours
Overall results 31.9% 26.8% 20.2% 13.5% 7.7%
Results by gender:
Females 33.7% 22.5% 26.3% 11.5% 5.9%
Males 30.0% 31.5% 13.3% 15.6% 9.6%
Results by age:
18-34 21.1% 13.1% 35.8% 15.5% 14.5%
35-44 24.0% 44.2% 3.4% 17.0% 11.5%
45-54 18.5% 32.6% 25.9% 16.8% 6.2%
55-64 27.4% 33.4% 19.9% 16.6% 2.7%
65-74 46.1% 23.0% 18.9% 3.4% 8.6%
75+ 65.6% 9.6% 12.0% 7.1% 5.8%
Results by location:
A city (pop. 10,000+) * * * * *
A town (pop. under 10,000) 36.6% 23.2% 15.6% 14.8% 9.8%
A rural area 24.8% 32.4% 27.0% 10.9% 4.8%
Results by respondent’s education level:
Less than high school 74.4% 2.6% 4.1% 3.7% 15.3%
High school diploma or GED 42.3% 18.8% 20.9% 8.5% 9.5%
Some college, trade school, or associate’s degree 25.4% 30.5% 18.0% 18.6% 7.4%
Bachelor’s degree or higher 17.7% 37.8% 28.5% 12.3% 3.7%
Results by household income:
Less than $15,000 51.0% 4.8% 18.1% 6.2% 19.9%
$15,000 to $35,000 44.9% 14.8% 20.0% 15.6% 4.7%
$35,001 to $65,000 26.4% 28.2% 21.1% 18.1% 6.3%
More than $65,000 14.8% 48.6% 21.1% 11.6% 3.9%
Results for CHB service area 29.6% 27.8% 19.8% 12.9% 9.9%
Results for 19-county region 24.7% 27.9% 23.2% 14.2% 10.0%
Lac qui Parle County Data Book Wilder Research, December 2010 2010 Southwest/South Central Adult Health Survey
42
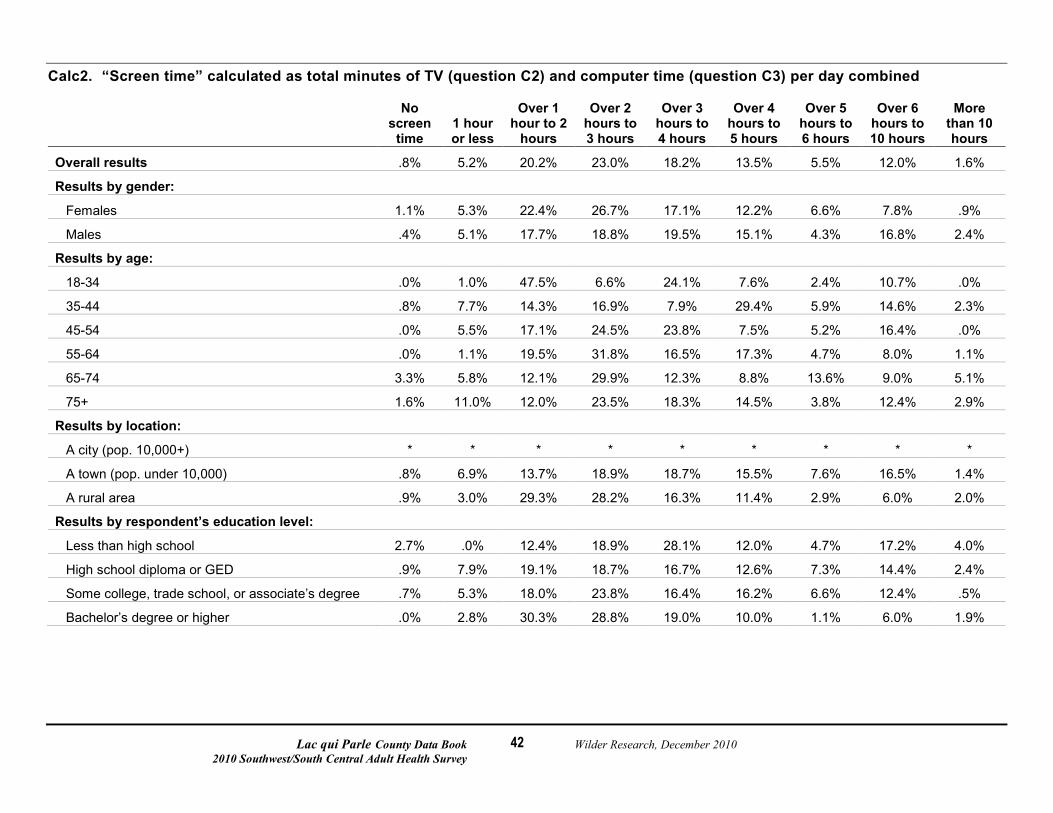
Calc2. “Screen time” calculated as total minutes of TV (question C2) and computer time (question C3) per day combined
No screen
time 1 hour or less
Over 1 hour to 2
hours
Over 2 hours to 3 hours
Over 3 hours to 4 hours
Over 4 hours to 5 hours
Over 5 hours to 6 hours
Over 6 hours to 10 hours
More than 10 hours
Overall results .8% 5.2% 20.2% 23.0% 18.2% 13.5% 5.5% 12.0% 1.6%
Results by gender:
Females 1.1% 5.3% 22.4% 26.7% 17.1% 12.2% 6.6% 7.8% .9%
Males .4% 5.1% 17.7% 18.8% 19.5% 15.1% 4.3% 16.8% 2.4%
Results by age:
18-34 .0% 1.0% 47.5% 6.6% 24.1% 7.6% 2.4% 10.7% .0%
35-44 .8% 7.7% 14.3% 16.9% 7.9% 29.4% 5.9% 14.6% 2.3%
45-54 .0% 5.5% 17.1% 24.5% 23.8% 7.5% 5.2% 16.4% .0%
55-64 .0% 1.1% 19.5% 31.8% 16.5% 17.3% 4.7% 8.0% 1.1%
65-74 3.3% 5.8% 12.1% 29.9% 12.3% 8.8% 13.6% 9.0% 5.1%
75+ 1.6% 11.0% 12.0% 23.5% 18.3% 14.5% 3.8% 12.4% 2.9%
Results by location:
A city (pop. 10,000+) * * * * * * * * *
A town (pop. under 10,000) .8% 6.9% 13.7% 18.9% 18.7% 15.5% 7.6% 16.5% 1.4%
A rural area .9% 3.0% 29.3% 28.2% 16.3% 11.4% 2.9% 6.0% 2.0%
Results by respondent’s education level:
Less than high school 2.7% .0% 12.4% 18.9% 28.1% 12.0% 4.7% 17.2% 4.0%
High school diploma or GED .9% 7.9% 19.1% 18.7% 16.7% 12.6% 7.3% 14.4% 2.4%
Some college, trade school, or associate’s degree .7% 5.3% 18.0% 23.8% 16.4% 16.2% 6.6% 12.4% .5%
Bachelor’s degree or higher .0% 2.8% 30.3% 28.8% 19.0% 10.0% 1.1% 6.0% 1.9%
Lac qui Parle County Data Book Wilder Research, December 2010 2010 Southwest/South Central Adult Health Survey
43
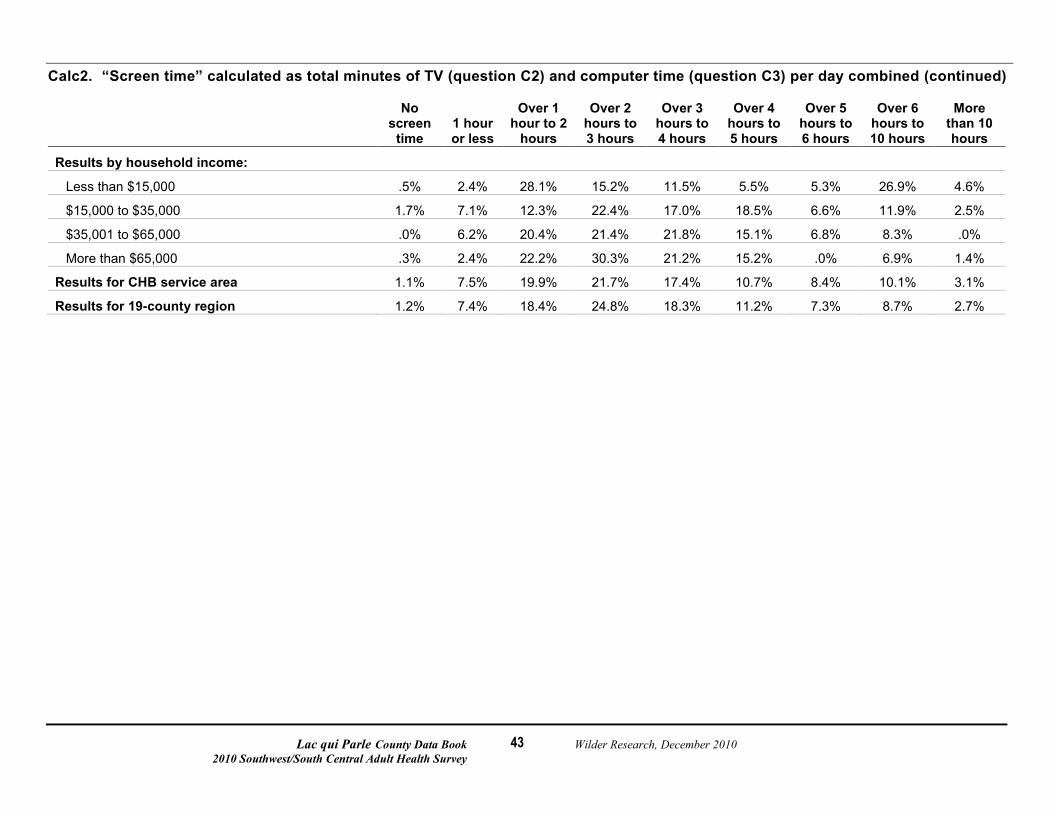
Calc2. “Screen time” calculated as total minutes of TV (question C2) and computer time (question C3) per day combined (continued)
No screen
time 1 hour or less
Over 1 hour to 2
hours
Over 2 hours to 3 hours
Over 3 hours to 4 hours
Over 4 hours to 5 hours
Over 5 hours to 6 hours
Over 6 hours to 10 hours
More than 10 hours
Results by household income:
Less than $15,000 .5% 2.4% 28.1% 15.2% 11.5% 5.5% 5.3% 26.9% 4.6%
$15,000 to $35,000 1.7% 7.1% 12.3% 22.4% 17.0% 18.5% 6.6% 11.9% 2.5%
$35,001 to $65,000 .0% 6.2% 20.4% 21.4% 21.8% 15.1% 6.8% 8.3% .0%
More than $65,000 .3% 2.4% 22.2% 30.3% 21.2% 15.2% .0% 6.9% 1.4%
Results for CHB service area 1.1% 7.5% 19.9% 21.7% 17.4% 10.7% 8.4% 10.1% 3.1%
Results for 19-county region 1.2% 7.4% 18.4% 24.8% 18.3% 11.2% 7.3% 8.7% 2.7%
Laq qui Parle County Data Book Wilder Research, December 2010 2010 Southwest/South Central Adult Health Survey
44
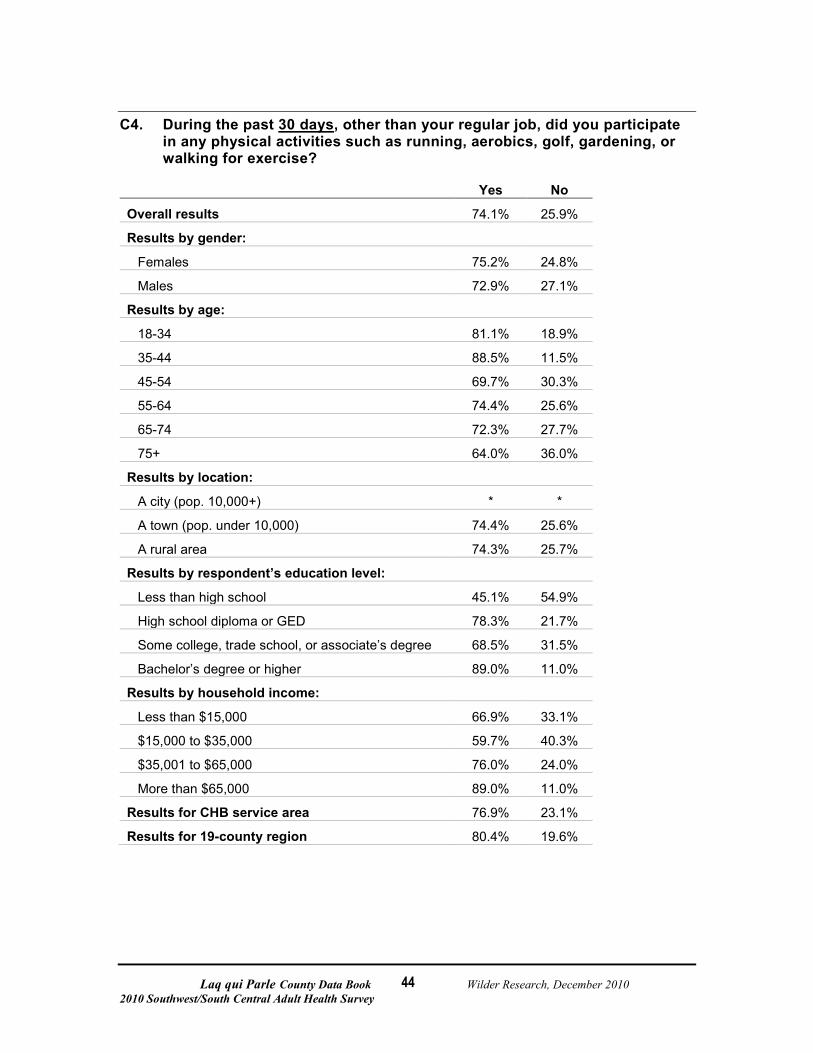
C4. During the past 30 days
, other than your regular job, did you participate in any physical activities such as running, aerobics, golf, gardening, or walking for exercise?
Yes No
Overall results 74.1% 25.9%
Results by gender:
Females 75.2% 24.8%
Males 72.9% 27.1%
Results by age:
18-34 81.1% 18.9%
35-44 88.5% 11.5%
45-54 69.7% 30.3%
55-64 74.4% 25.6%
65-74 72.3% 27.7%
75+ 64.0% 36.0%
Results by location:
A city (pop. 10,000+) * *
A town (pop. under 10,000) 74.4% 25.6%
A rural area 74.3% 25.7%
Results by respondent’s education level:
Less than high school 45.1% 54.9%
High school diploma or GED 78.3% 21.7%
Some college, trade school, or associate’s degree 68.5% 31.5%
Bachelor’s degree or higher 89.0% 11.0%
Results by household income:
Less than $15,000 66.9% 33.1%
$15,000 to $35,000 59.7% 40.3%
$35,001 to $65,000 76.0% 24.0%
More than $65,000 89.0% 11.0%
Results for CHB service area 76.9% 23.1%
Results for 19-county region 80.4% 19.6%
Laq qui Parle County Data Book Wilder Research, December 2010 2010 Southwest/South Central Adult Health Survey
45
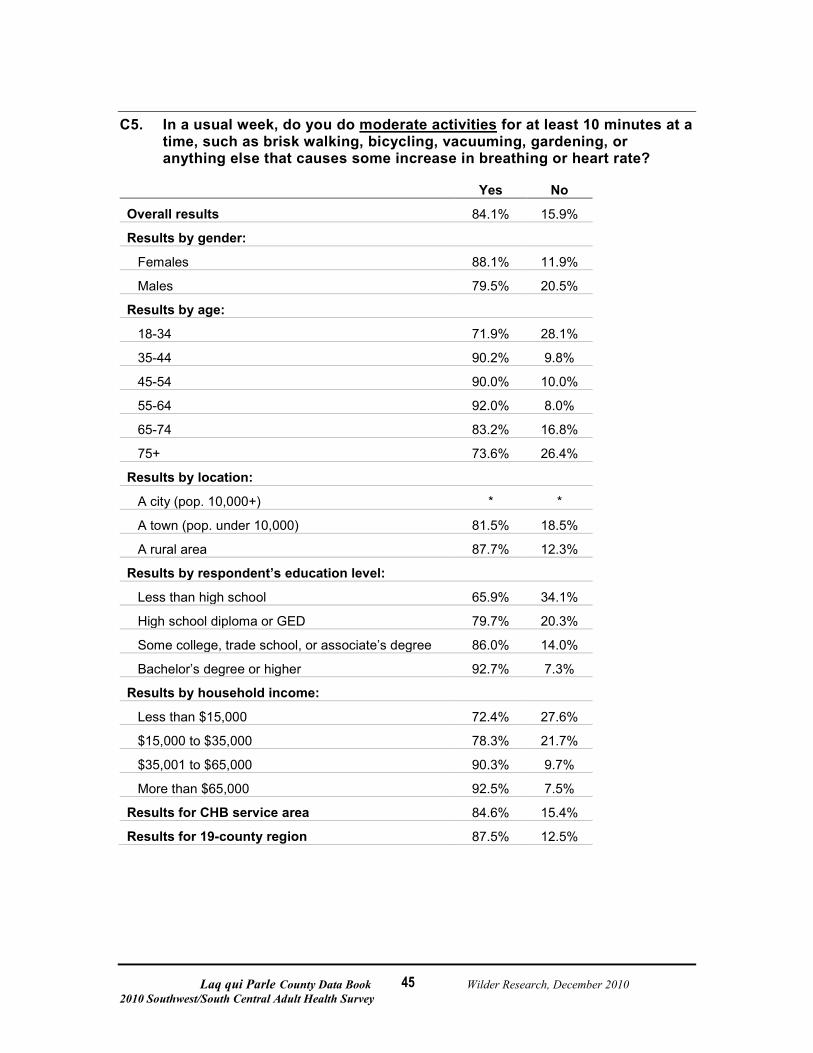
C5. In a usual week, do you do moderate activities
for at least 10 minutes at a time, such as brisk walking, bicycling, vacuuming, gardening, or anything else that causes some increase in breathing or heart rate?
Yes No
Overall results 84.1% 15.9%
Results by gender:
Females 88.1% 11.9%
Males 79.5% 20.5%
Results by age:
18-34 71.9% 28.1%
35-44 90.2% 9.8%
45-54 90.0% 10.0%
55-64 92.0% 8.0%
65-74 83.2% 16.8%
75+ 73.6% 26.4%
Results by location:
A city (pop. 10,000+) * *
A town (pop. under 10,000) 81.5% 18.5%
A rural area 87.7% 12.3%
Results by respondent’s education level:
Less than high school 65.9% 34.1%
High school diploma or GED 79.7% 20.3%
Some college, trade school, or associate’s degree 86.0% 14.0%
Bachelor’s degree or higher 92.7% 7.3%
Results by household income:
Less than $15,000 72.4% 27.6%
$15,000 to $35,000 78.3% 21.7%
$35,001 to $65,000 90.3% 9.7%
More than $65,000 92.5% 7.5%
Results for CHB service area 84.6% 15.4%
Results for 19-county region 87.5% 12.5%

Lac qui Parle County Data Book Wilder Research, December 2010 2010 Southwest/South Central Adult Health Survey
46
C6. (Of those who answered “yes” to question C5) How many days per week do you do these moderate activities
for at least 10 minutes at a time?
1 2 3 4 5 6 7
Overall results 1.8% 9.5% 17.5% 21.9% 17.7% 9.9% 21.7%
Results by gender:
Females 2.0% 10.2% 14.4% 20.1% 18.5% 11.1% 23.6%
Males 1.6% 8.6% 21.3% 24.1% 16.7% 8.4% 19.3%
Results by age:
18-34 3.1% 16.7% 6.6% 39.8% 9.0% 7.6% 17.2%
35-44 .0% 5.2% 23.0% 14.9% 14.9% 8.4% 33.6%
45-54 .7% 12.1% 24.5% 21.1% 22.1% 7.0% 12.5%
55-64 3.6% 5.5% 19.0% 20.9% 19.3% 9.3% 22.4%
65-74 3.7% 10.4% 10.1% 16.2% 20.7% 14.4% 24.4%
75+ .0% 7.3% 14.1% 20.4% 14.6% 16.3% 27.3%
Results by location:
A city (pop. 10,000+) * * * * * * *
A town (pop. under 10,000) 1.2% 9.0% 18.9% 22.3% 19.6% 6.4% 22.6%
A rural area 2.7% 8.8% 16.3% 22.2% 15.6% 14.7% 19.7%
Results by respondent’s education level:
Less than high school * * * * * * *
High school diploma or GED .6% 11.1% 12.6% 25.0% 16.3% 12.2% 22.2%
Some college, trade school, or associate’s degree 2.3% 9.3% 22.0% 21.7% 19.7% 7.7% 17.3%
Bachelor’s degree or higher 2.9% 9.8% 15.8% 18.6% 10.9% 12.4% 29.6%
Results by household income:
Less than $15,000 3.1% 3.5% 5.2% 35.8% 11.9% 16.0% 24.4%
$15,000 to $35,000 2.4% 9.6% 19.3% 25.3% 17.7% 10.1% 15.7%
$35,001 to $65,000 .7% 13.2% 21.2% 17.6% 24.5% 7.4% 15.4%
More than $65,000 2.7% 8.5% 19.4% 17.5% 12.7% 10.1% 29.2%
Results for CHB service area 3.6% 7.7% 18.1% 17.2% 20.1% 10.0% 23.3%
Results for 19-county region 2.7% 9.0% 18.5% 17.1% 20.0% 10.0% 22.5%
Lac qui Parle County Data Book Wilder Research, December 2010 2010 Southwest/South Central Adult Health Survey
47
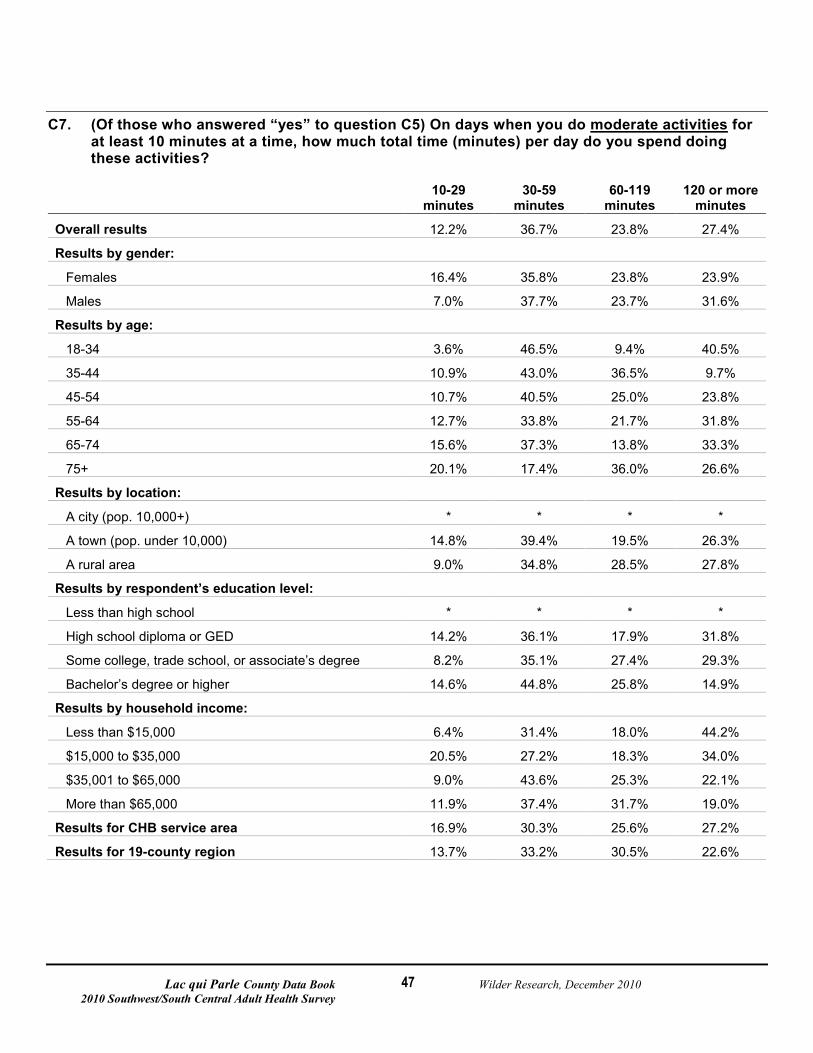
C7. (Of those who answered “yes” to question C5) On days when you do moderate activities
for at least 10 minutes at a time, how much total time (minutes) per day do you spend doing these activities?
10-29 minutes
30-59 minutes
60-119 minutes
120 or more minutes
Overall results 12.2% 36.7% 23.8% 27.4%
Results by gender:
Females 16.4% 35.8% 23.8% 23.9%
Males 7.0% 37.7% 23.7% 31.6%
Results by age:
18-34 3.6% 46.5% 9.4% 40.5%
35-44 10.9% 43.0% 36.5% 9.7%
45-54 10.7% 40.5% 25.0% 23.8%
55-64 12.7% 33.8% 21.7% 31.8%
65-74 15.6% 37.3% 13.8% 33.3%
75+ 20.1% 17.4% 36.0% 26.6%
Results by location:
A city (pop. 10,000+) * * * *
A town (pop. under 10,000) 14.8% 39.4% 19.5% 26.3%
A rural area 9.0% 34.8% 28.5% 27.8%
Results by respondent’s education level:
Less than high school * * * *
High school diploma or GED 14.2% 36.1% 17.9% 31.8%
Some college, trade school, or associate’s degree 8.2% 35.1% 27.4% 29.3%
Bachelor’s degree or higher 14.6% 44.8% 25.8% 14.9%
Results by household income:
Less than $15,000 6.4% 31.4% 18.0% 44.2%
$15,000 to $35,000 20.5% 27.2% 18.3% 34.0%
$35,001 to $65,000 9.0% 43.6% 25.3% 22.1%
More than $65,000 11.9% 37.4% 31.7% 19.0%
Results for CHB service area 16.9% 30.3% 25.6% 27.2%
Results for 19-county region 13.7% 33.2% 30.5% 22.6%
Lac qui Parle County Data Book Wilder Research, December 2010 2010 Southwest/South Central Adult Health Survey
48
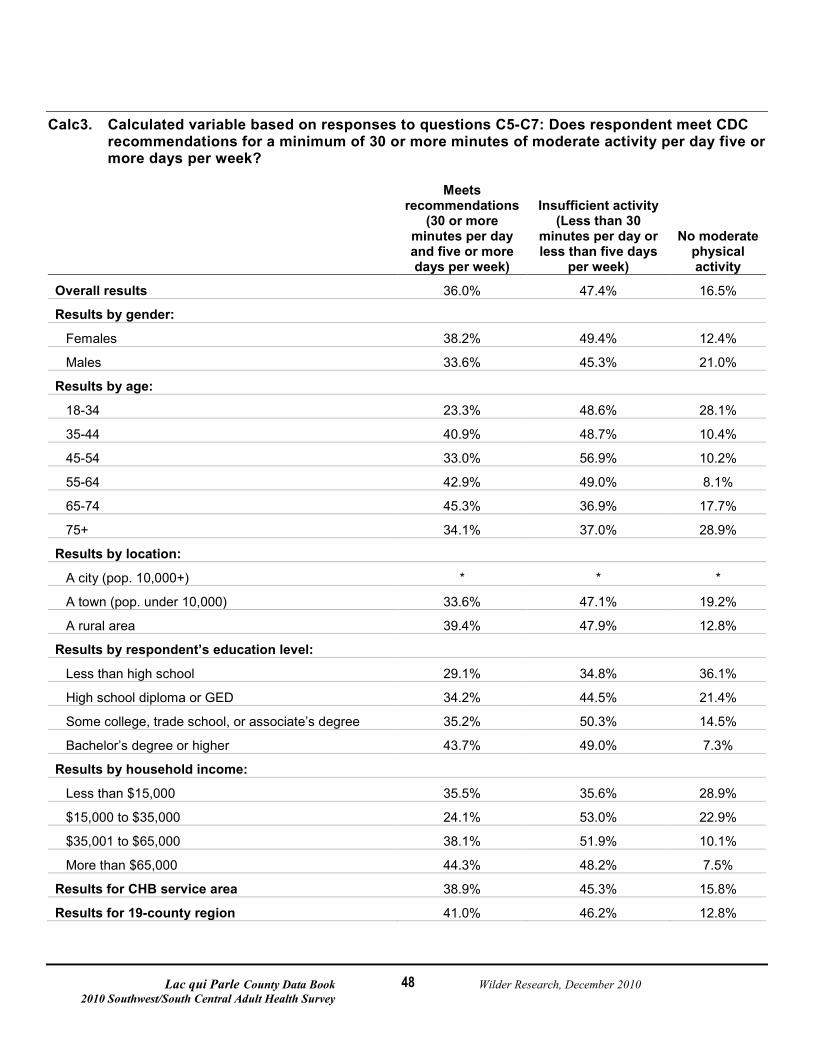
Calc3. Calculated variable based on responses to questions C5-C7: Does respondent meet CDC recommendations for a minimum of 30 or more minutes of moderate activity per day five or more days per week?
Meets recommendations
(30 or more minutes per day and five or more days per week)
Insufficient activity (Less than 30
minutes per day or less than five days
per week)
No moderate physical activity
Overall results 36.0% 47.4% 16.5%
Results by gender:
Females 38.2% 49.4% 12.4%
Males 33.6% 45.3% 21.0%
Results by age:
18-34 23.3% 48.6% 28.1%
35-44 40.9% 48.7% 10.4%
45-54 33.0% 56.9% 10.2%
55-64 42.9% 49.0% 8.1%
65-74 45.3% 36.9% 17.7%
75+ 34.1% 37.0% 28.9%
Results by location:
A city (pop. 10,000+) * * *
A town (pop. under 10,000) 33.6% 47.1% 19.2%
A rural area 39.4% 47.9% 12.8%
Results by respondent’s education level:
Less than high school 29.1% 34.8% 36.1%
High school diploma or GED 34.2% 44.5% 21.4%
Some college, trade school, or associate’s degree 35.2% 50.3% 14.5%
Bachelor’s degree or higher 43.7% 49.0% 7.3%
Results by household income:
Less than $15,000 35.5% 35.6% 28.9%
$15,000 to $35,000 24.1% 53.0% 22.9%
$35,001 to $65,000 38.1% 51.9% 10.1%
More than $65,000 44.3% 48.2% 7.5%
Results for CHB service area 38.9% 45.3% 15.8%
Results for 19-county region 41.0% 46.2% 12.8%

Laq qui Parle County Data Book Wilder Research, December 2010 2010 Southwest/South Central Adult Health Survey
49
C8. In a usual week, do you do vigorous activities for at least 10 minutes at a time, such as running, aerobics, heavy yard work, or anything else that causes large increases in breathing or heart rate?
Yes No
Overall results 43.6% 56.4%
Results by gender:
Females 41.7% 58.3%
Males 45.7% 54.3%
Results by age:
18-34 48.0% 52.0%
35-44 54.2% 45.8%
45-54 52.9% 47.1%
55-64 45.5% 54.5%
65-74 34.3% 65.7%
75+ 23.0% 77.0%
Results by location:
A city (pop. 10,000+) * *
A town (pop. under 10,000) 40.0% 60.0%
A rural area 49.3% 50.7%
Results by respondent’s education level:
Less than high school 28.3% 71.7%
High school diploma or GED 45.8% 54.2%
Some college, trade school, or associate’s degree 42.2% 57.8%
Bachelor’s degree or higher 48.4% 51.6%
Results by household income:
Less than $15,000 51.9% 48.1%
$15,000 to $35,000 28.2% 71.8%
$35,001 to $65,000 44.4% 55.6%
More than $65,000 56.4% 43.6%
Results for CHB service area 50.3% 49.7%
Results for 19-county region 54.4% 45.6%
Laq qui Parle County Data Book Wilder Research, December 2010 2010 Southwest/South Central Adult Health Survey
50
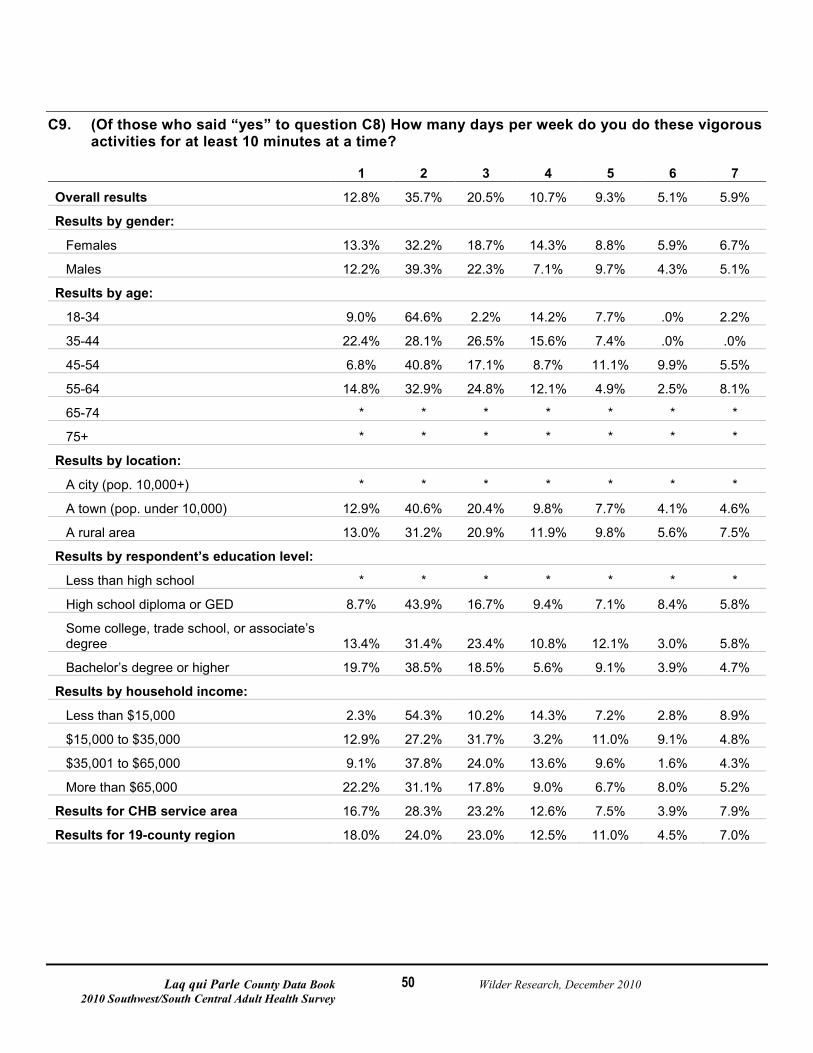
C9. (Of those who said “yes” to question C8) How many days per week do you do these vigorous activities for at least 10 minutes at a time?
1 2 3 4 5 6 7
Overall results 12.8% 35.7% 20.5% 10.7% 9.3% 5.1% 5.9%
Results by gender:
Females 13.3% 32.2% 18.7% 14.3% 8.8% 5.9% 6.7%
Males 12.2% 39.3% 22.3% 7.1% 9.7% 4.3% 5.1%
Results by age:
18-34 9.0% 64.6% 2.2% 14.2% 7.7% .0% 2.2%
35-44 22.4% 28.1% 26.5% 15.6% 7.4% .0% .0%
45-54 6.8% 40.8% 17.1% 8.7% 11.1% 9.9% 5.5%
55-64 14.8% 32.9% 24.8% 12.1% 4.9% 2.5% 8.1%
65-74 * * * * * * *
75+ * * * * * * *
Results by location:
A city (pop. 10,000+) * * * * * * *
A town (pop. under 10,000) 12.9% 40.6% 20.4% 9.8% 7.7% 4.1% 4.6%
A rural area 13.0% 31.2% 20.9% 11.9% 9.8% 5.6% 7.5%
Results by respondent’s education level:
Less than high school * * * * * * *
High school diploma or GED 8.7% 43.9% 16.7% 9.4% 7.1% 8.4% 5.8%
Some college, trade school, or associate’s degree 13.4% 31.4% 23.4% 10.8% 12.1% 3.0% 5.8%
Bachelor’s degree or higher 19.7% 38.5% 18.5% 5.6% 9.1% 3.9% 4.7%
Results by household income:
Less than $15,000 2.3% 54.3% 10.2% 14.3% 7.2% 2.8% 8.9%
$15,000 to $35,000 12.9% 27.2% 31.7% 3.2% 11.0% 9.1% 4.8%
$35,001 to $65,000 9.1% 37.8% 24.0% 13.6% 9.6% 1.6% 4.3%
More than $65,000 22.2% 31.1% 17.8% 9.0% 6.7% 8.0% 5.2%
Results for CHB service area 16.7% 28.3% 23.2% 12.6% 7.5% 3.9% 7.9%
Results for 19-county region 18.0% 24.0% 23.0% 12.5% 11.0% 4.5% 7.0%
Laq qui Parle County Data Book Wilder Research, December 2010 2010 Southwest/South Central Adult Health Survey
51
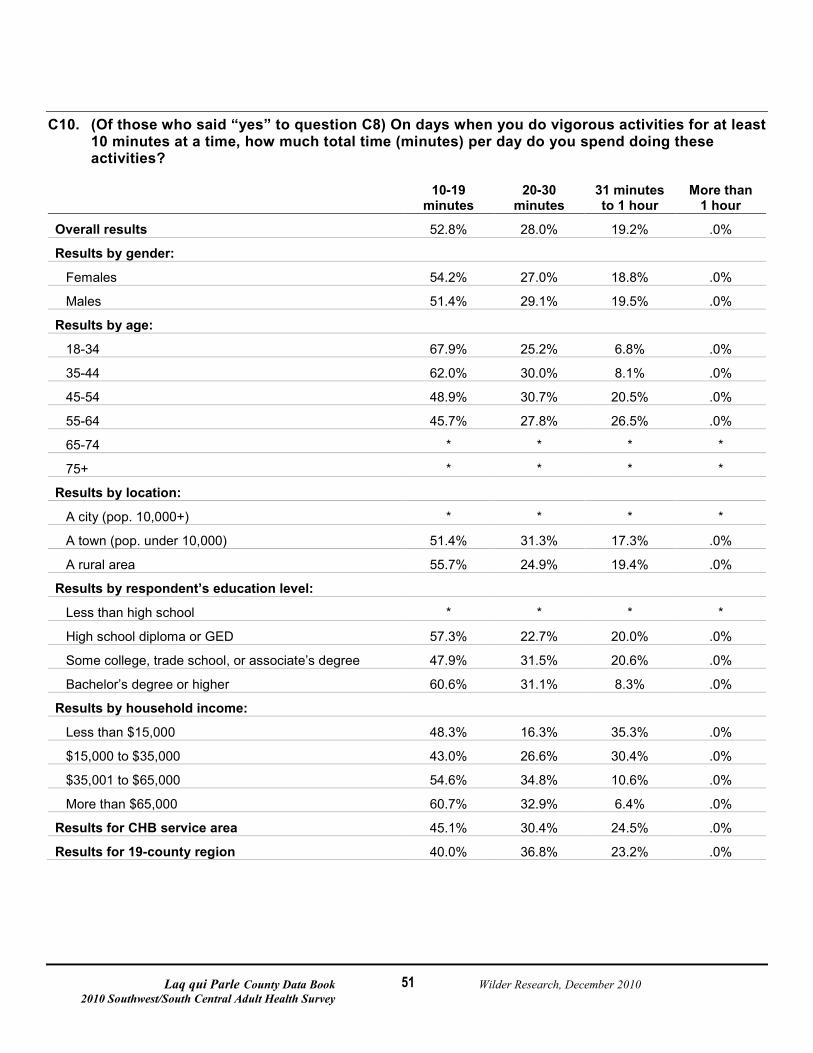
C10. (Of those who said “yes” to question C8) On days when you do vigorous activities for at least 10 minutes at a time, how much total time (minutes) per day do you spend doing these activities?
10-19
minutes 20-30
minutes 31 minutes to 1 hour
More than 1 hour
Overall results 52.8% 28.0% 19.2% .0%
Results by gender:
Females 54.2% 27.0% 18.8% .0%
Males 51.4% 29.1% 19.5% .0%
Results by age:
18-34 67.9% 25.2% 6.8% .0%
35-44 62.0% 30.0% 8.1% .0%
45-54 48.9% 30.7% 20.5% .0%
55-64 45.7% 27.8% 26.5% .0%
65-74 * * * *
75+ * * * *
Results by location:
A city (pop. 10,000+) * * * *
A town (pop. under 10,000) 51.4% 31.3% 17.3% .0%
A rural area 55.7% 24.9% 19.4% .0%
Results by respondent’s education level:
Less than high school * * * *
High school diploma or GED 57.3% 22.7% 20.0% .0%
Some college, trade school, or associate’s degree 47.9% 31.5% 20.6% .0%
Bachelor’s degree or higher 60.6% 31.1% 8.3% .0%
Results by household income:
Less than $15,000 48.3% 16.3% 35.3% .0%
$15,000 to $35,000 43.0% 26.6% 30.4% .0%
$35,001 to $65,000 54.6% 34.8% 10.6% .0%
More than $65,000 60.7% 32.9% 6.4% .0%
Results for CHB service area 45.1% 30.4% 24.5% .0%
Results for 19-county region 40.0% 36.8% 23.2% .0%
Laq qui Parle County Data Book Wilder Research, December 2010 2010 Southwest/South Central Adult Health Survey
52
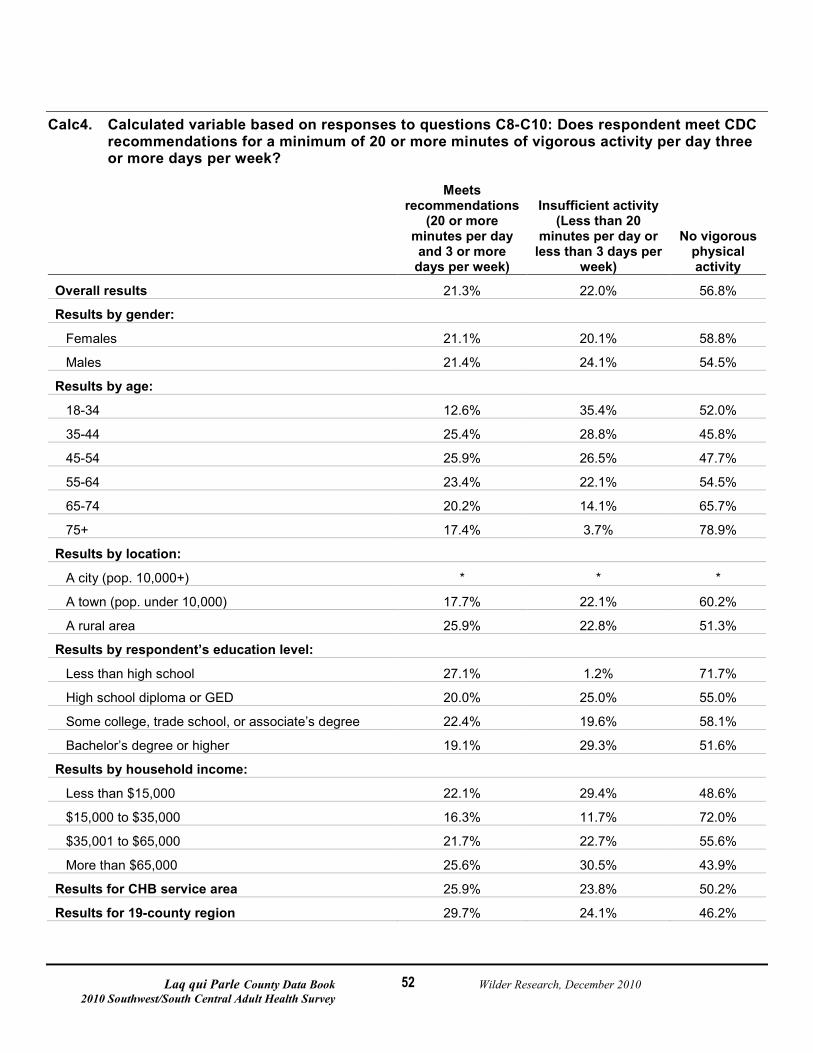
Calc4. Calculated variable based on responses to questions C8-C10: Does respondent meet CDC recommendations for a minimum of 20 or more minutes of vigorous activity per day three or more days per week?
Meets recommendations
(20 or more minutes per day and 3 or more
days per week)
Insufficient activity (Less than 20
minutes per day or less than 3 days per
week)
No vigorous physical activity
Overall results 21.3% 22.0% 56.8%
Results by gender:
Females 21.1% 20.1% 58.8%
Males 21.4% 24.1% 54.5%
Results by age:
18-34 12.6% 35.4% 52.0%
35-44 25.4% 28.8% 45.8%
45-54 25.9% 26.5% 47.7%
55-64 23.4% 22.1% 54.5%
65-74 20.2% 14.1% 65.7%
75+ 17.4% 3.7% 78.9%
Results by location:
A city (pop. 10,000+) * * *
A town (pop. under 10,000) 17.7% 22.1% 60.2%
A rural area 25.9% 22.8% 51.3%
Results by respondent’s education level:
Less than high school 27.1% 1.2% 71.7%
High school diploma or GED 20.0% 25.0% 55.0%
Some college, trade school, or associate’s degree 22.4% 19.6% 58.1%
Bachelor’s degree or higher 19.1% 29.3% 51.6%
Results by household income:
Less than $15,000 22.1% 29.4% 48.6%
$15,000 to $35,000 16.3% 11.7% 72.0%
$35,001 to $65,000 21.7% 22.7% 55.6%
More than $65,000 25.6% 30.5% 43.9%
Results for CHB service area 25.9% 23.8% 50.2%
Results for 19-county region 29.7% 24.1% 46.2%
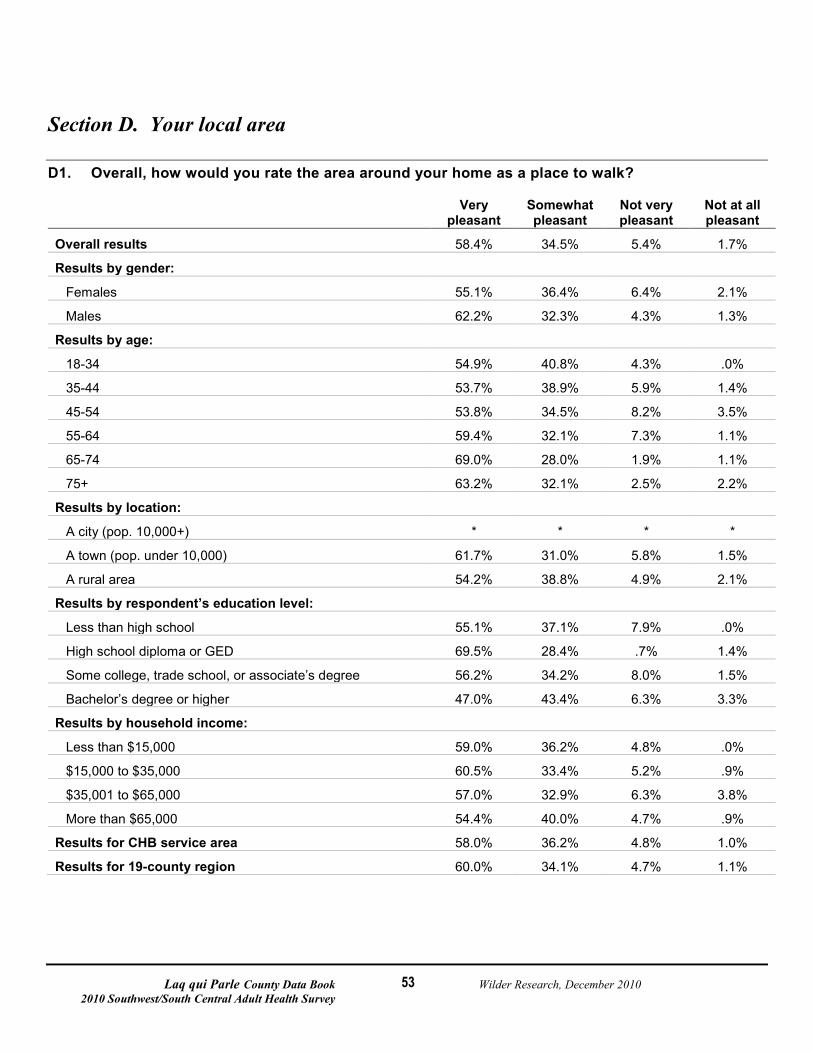
Laq qui Parle County Data Book Wilder Research, December 2010 2010 Southwest/South Central Adult Health Survey
53
Section D. Your local area
D1. Overall, how would you rate the area around your home as a place to walk?
Very
pleasant Somewhat pleasant
Not very pleasant
Not at all pleasant
Overall results 58.4% 34.5% 5.4% 1.7%
Results by gender:
Females 55.1% 36.4% 6.4% 2.1%
Males 62.2% 32.3% 4.3% 1.3%
Results by age:
18-34 54.9% 40.8% 4.3% .0%
35-44 53.7% 38.9% 5.9% 1.4%
45-54 53.8% 34.5% 8.2% 3.5%
55-64 59.4% 32.1% 7.3% 1.1%
65-74 69.0% 28.0% 1.9% 1.1%
75+ 63.2% 32.1% 2.5% 2.2%
Results by location:
A city (pop. 10,000+) * * * *
A town (pop. under 10,000) 61.7% 31.0% 5.8% 1.5%
A rural area 54.2% 38.8% 4.9% 2.1%
Results by respondent’s education level:
Less than high school 55.1% 37.1% 7.9% .0%
High school diploma or GED 69.5% 28.4% .7% 1.4%
Some college, trade school, or associate’s degree 56.2% 34.2% 8.0% 1.5%
Bachelor’s degree or higher 47.0% 43.4% 6.3% 3.3%
Results by household income:
Less than $15,000 59.0% 36.2% 4.8% .0%
$15,000 to $35,000 60.5% 33.4% 5.2% .9%
$35,001 to $65,000 57.0% 32.9% 6.3% 3.8%
More than $65,000 54.4% 40.0% 4.7% .9%
Results for CHB service area 58.0% 36.2% 4.8% 1.0%
Results for 19-county region 60.0% 34.1% 4.7% 1.1%
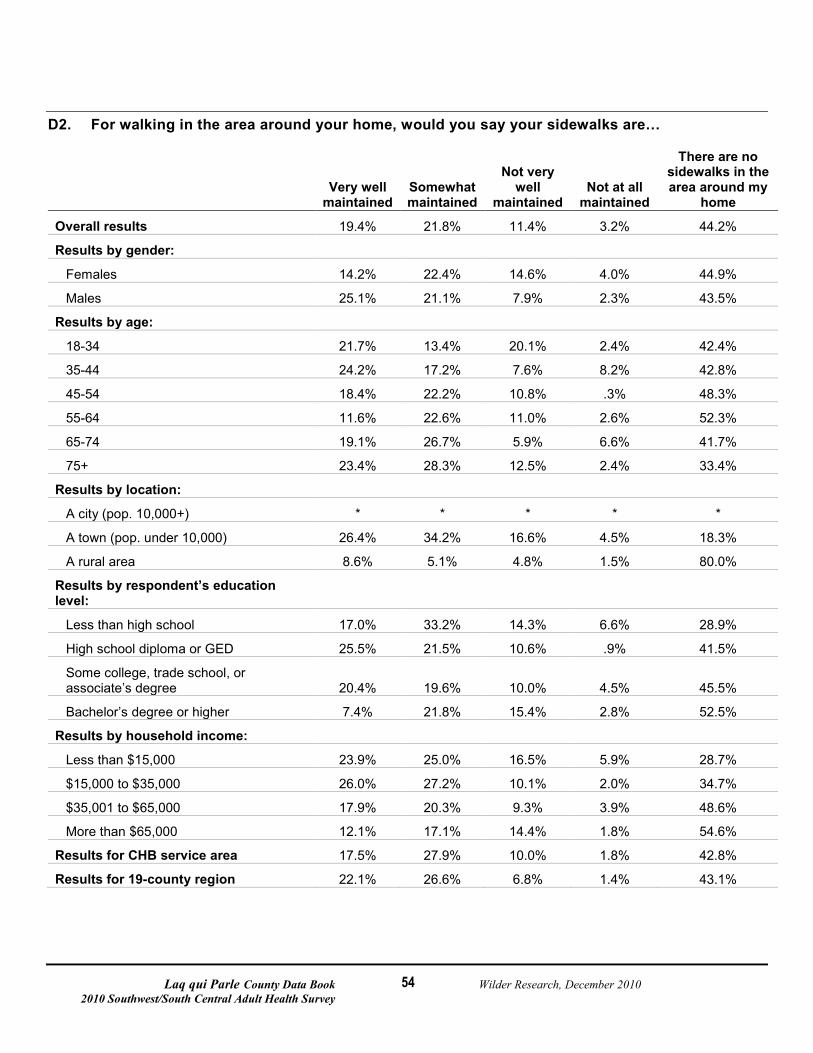
Laq qui Parle County Data Book Wilder Research, December 2010 2010 Southwest/South Central Adult Health Survey
54
D2. For walking in the area around your home, would you say your sidewalks are…
Very well
maintained Somewhat maintained
Not very well
maintained Not at all
maintained
There are no sidewalks in the area around my
home
Overall results 19.4% 21.8% 11.4% 3.2% 44.2%
Results by gender:
Females 14.2% 22.4% 14.6% 4.0% 44.9%
Males 25.1% 21.1% 7.9% 2.3% 43.5%
Results by age:
18-34 21.7% 13.4% 20.1% 2.4% 42.4%
35-44 24.2% 17.2% 7.6% 8.2% 42.8%
45-54 18.4% 22.2% 10.8% .3% 48.3%
55-64 11.6% 22.6% 11.0% 2.6% 52.3%
65-74 19.1% 26.7% 5.9% 6.6% 41.7%
75+ 23.4% 28.3% 12.5% 2.4% 33.4%
Results by location:
A city (pop. 10,000+) * * * * *
A town (pop. under 10,000) 26.4% 34.2% 16.6% 4.5% 18.3%
A rural area 8.6% 5.1% 4.8% 1.5% 80.0%
Results by respondent’s education level:
Less than high school 17.0% 33.2% 14.3% 6.6% 28.9%
High school diploma or GED 25.5% 21.5% 10.6% .9% 41.5%
Some college, trade school, or associate’s degree 20.4% 19.6% 10.0% 4.5% 45.5%
Bachelor’s degree or higher 7.4% 21.8% 15.4% 2.8% 52.5%
Results by household income:
Less than $15,000 23.9% 25.0% 16.5% 5.9% 28.7%
$15,000 to $35,000 26.0% 27.2% 10.1% 2.0% 34.7%
$35,001 to $65,000 17.9% 20.3% 9.3% 3.9% 48.6%
More than $65,000 12.1% 17.1% 14.4% 1.8% 54.6%
Results for CHB service area 17.5% 27.9% 10.0% 1.8% 42.8%
Results for 19-county region 22.1% 26.6% 6.8% 1.4% 43.1%
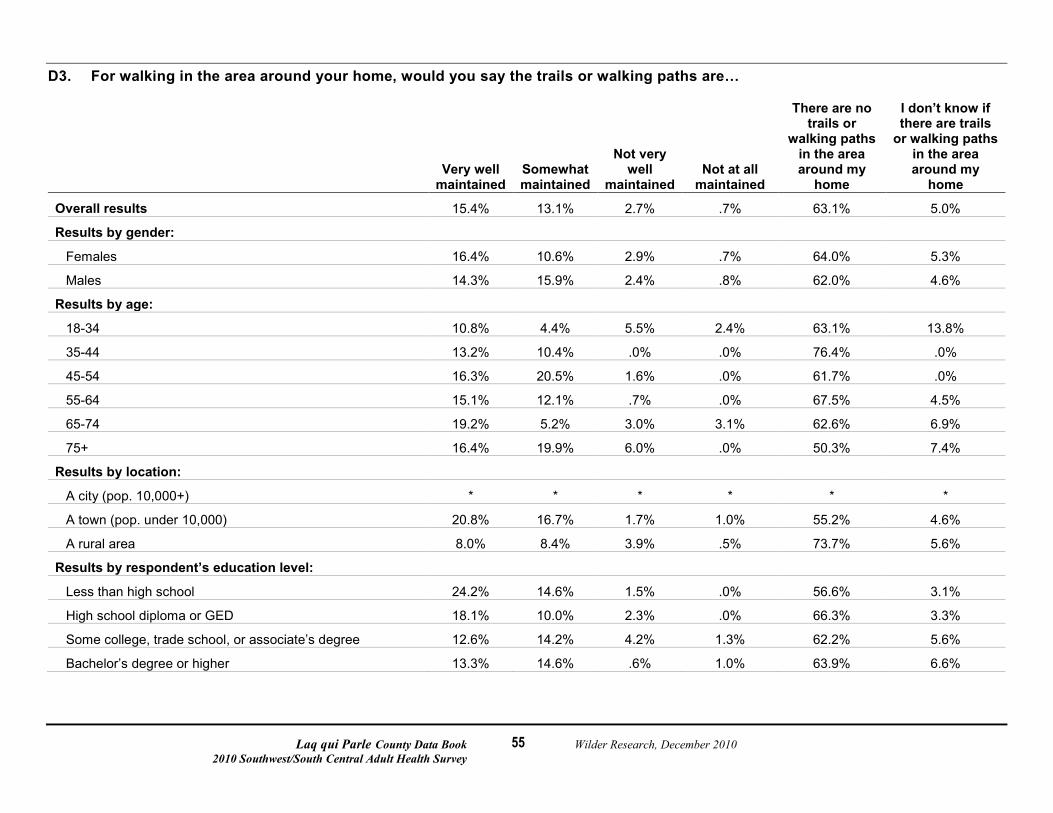
Laq qui Parle County Data Book Wilder Research, December 2010 2010 Southwest/South Central Adult Health Survey
55
D3. For walking in the area around your home, would you say the trails or walking paths are…
Very well
maintained Somewhat maintained
Not very well
maintained Not at all
maintained
There are no trails or
walking paths in the area around my
home
I don’t know if there are trails
or walking paths in the area around my
home
Overall results 15.4% 13.1% 2.7% .7% 63.1% 5.0%
Results by gender:
Females 16.4% 10.6% 2.9% .7% 64.0% 5.3%
Males 14.3% 15.9% 2.4% .8% 62.0% 4.6%
Results by age:
18-34 10.8% 4.4% 5.5% 2.4% 63.1% 13.8%
35-44 13.2% 10.4% .0% .0% 76.4% .0%
45-54 16.3% 20.5% 1.6% .0% 61.7% .0%
55-64 15.1% 12.1% .7% .0% 67.5% 4.5%
65-74 19.2% 5.2% 3.0% 3.1% 62.6% 6.9%
75+ 16.4% 19.9% 6.0% .0% 50.3% 7.4%
Results by location:
A city (pop. 10,000+) * * * * * *
A town (pop. under 10,000) 20.8% 16.7% 1.7% 1.0% 55.2% 4.6%
A rural area 8.0% 8.4% 3.9% .5% 73.7% 5.6%
Results by respondent’s education level:
Less than high school 24.2% 14.6% 1.5% .0% 56.6% 3.1%
High school diploma or GED 18.1% 10.0% 2.3% .0% 66.3% 3.3%
Some college, trade school, or associate’s degree 12.6% 14.2% 4.2% 1.3% 62.2% 5.6%
Bachelor’s degree or higher 13.3% 14.6% .6% 1.0% 63.9% 6.6%
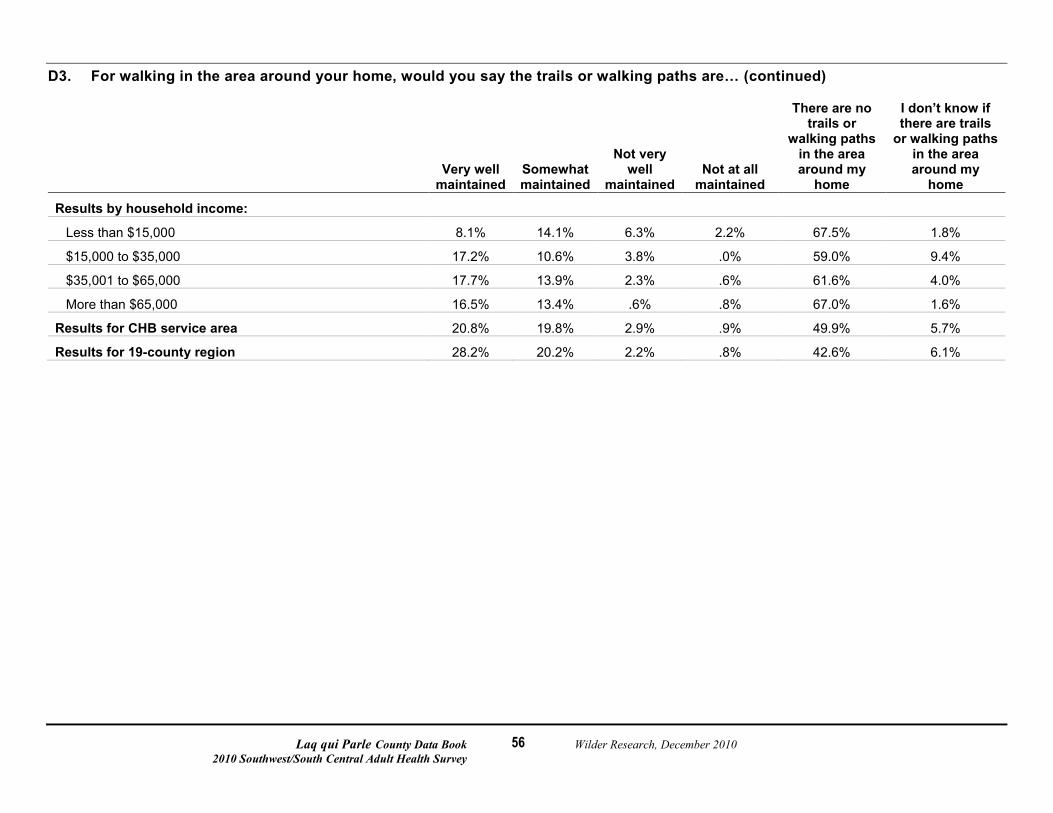
Laq qui Parle County Data Book Wilder Research, December 2010 2010 Southwest/South Central Adult Health Survey
56
D3. For walking in the area around your home, would you say the trails or walking paths are… (continued)
Very well
maintained Somewhat maintained
Not very well
maintained Not at all
maintained
There are no trails or
walking paths in the area around my
home
I don’t know if there are trails
or walking paths in the area around my
home
Results by household income:
Less than $15,000 8.1% 14.1% 6.3% 2.2% 67.5% 1.8%
$15,000 to $35,000 17.2% 10.6% 3.8% .0% 59.0% 9.4%
$35,001 to $65,000 17.7% 13.9% 2.3% .6% 61.6% 4.0%
More than $65,000 16.5% 13.4% .6% .8% 67.0% 1.6%
Results for CHB service area 20.8% 19.8% 2.9% .9% 49.9% 5.7%
Results for 19-county region 28.2% 20.2% 2.2% .8% 42.6% 6.1%
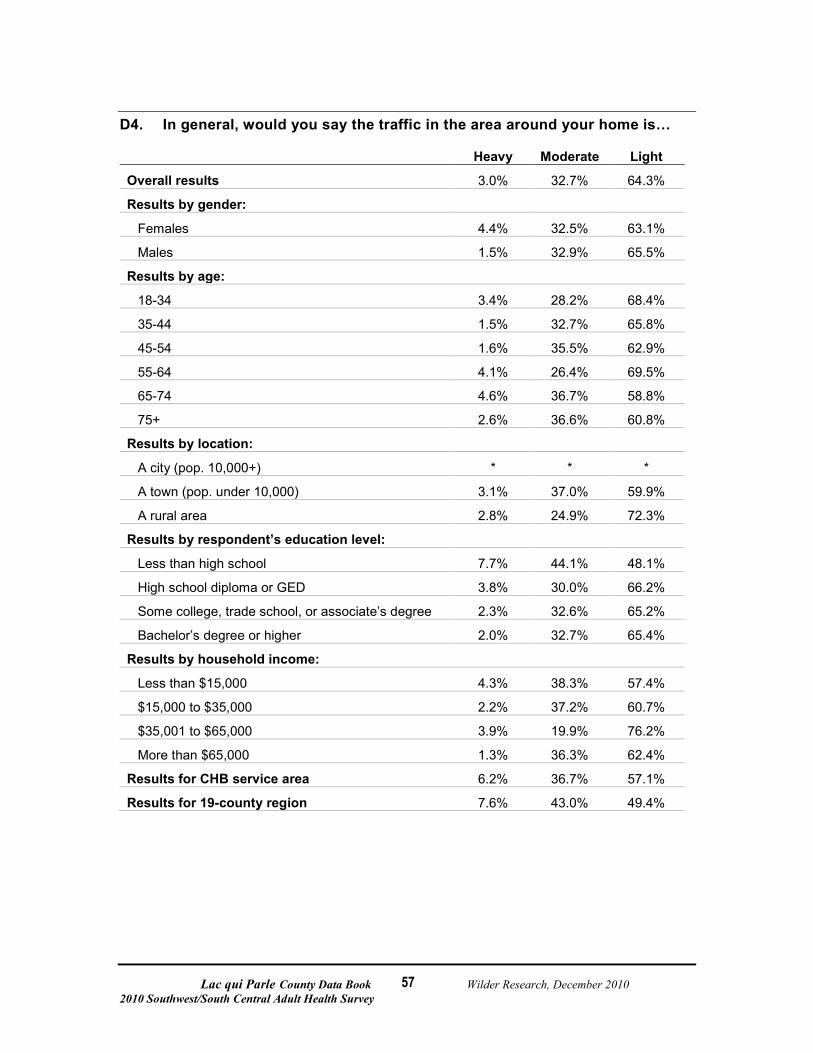
Lac qui Parle County Data Book Wilder Research, December 2010 2010 Southwest/South Central Adult Health Survey
57
D4. In general, would you say the traffic in the area around your home is…
Heavy Moderate Light
Overall results 3.0% 32.7% 64.3%
Results by gender:
Females 4.4% 32.5% 63.1%
Males 1.5% 32.9% 65.5%
Results by age:
18-34 3.4% 28.2% 68.4%
35-44 1.5% 32.7% 65.8%
45-54 1.6% 35.5% 62.9%
55-64 4.1% 26.4% 69.5%
65-74 4.6% 36.7% 58.8%
75+ 2.6% 36.6% 60.8%
Results by location:
A city (pop. 10,000+) * * *
A town (pop. under 10,000) 3.1% 37.0% 59.9%
A rural area 2.8% 24.9% 72.3%
Results by respondent’s education level:
Less than high school 7.7% 44.1% 48.1%
High school diploma or GED 3.8% 30.0% 66.2%
Some college, trade school, or associate’s degree 2.3% 32.6% 65.2%
Bachelor’s degree or higher 2.0% 32.7% 65.4%
Results by household income:
Less than $15,000 4.3% 38.3% 57.4%
$15,000 to $35,000 2.2% 37.2% 60.7%
$35,001 to $65,000 3.9% 19.9% 76.2%
More than $65,000 1.3% 36.3% 62.4%
Results for CHB service area 6.2% 36.7% 57.1%
Results for 19-county region 7.6% 43.0% 49.4%

Lac qui Parle County Data Book Wilder Research, December 2010 2010 Southwest/South Central Adult Health Survey
58
D5. In general, is the speed of the vehicles traveling on the streets or roads in the area around your home so fast that makes it difficult or unsafe to walk?
Yes No
Overall results 18.4% 81.6%
Results by gender:
Females 15.8% 84.2%
Males 21.4% 78.6%
Results by age:
18-34 23.5% 76.5%
35-44 24.1% 75.9%
45-54 18.3% 81.7%
55-64 17.5% 82.5%
65-74 18.9% 81.1%
75+ 10.3% 89.7%
Results by location:
A city (pop. 10,000+) * *
A town (pop. under 10,000) 9.0% 91.0%
A rural area 30.3% 69.7%
Results by respondent’s education level:
Less than high school 8.9% 91.1%
High school diploma or GED 13.3% 86.7%
Some college, trade school, or associate’s degree 21.5% 78.5%
Bachelor’s degree or higher 23.0% 77.0%
Results by household income:
Less than $15,000 8.2% 91.8%
$15,000 to $35,000 17.9% 82.1%
$35,001 to $65,000 16.1% 83.9%
More than $65,000 22.0% 78.0%
Results for CHB service area 15.7% 84.3%
Results for 19-county region 17.8% 82.2%
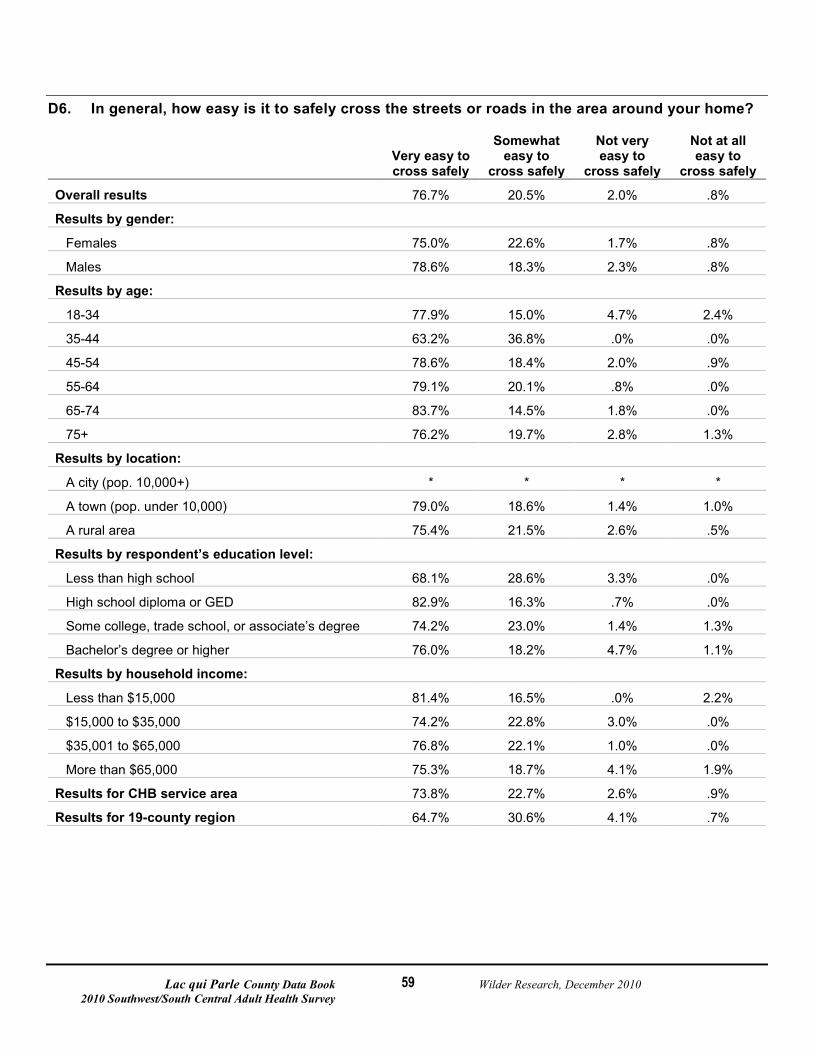
Lac qui Parle County Data Book Wilder Research, December 2010 2010 Southwest/South Central Adult Health Survey
59
D6. In general, how easy is it to safely cross the streets or roads in the area around your home?
Very easy to cross safely
Somewhat easy to
cross safely
Not very easy to
cross safely
Not at all easy to
cross safely
Overall results 76.7% 20.5% 2.0% .8%
Results by gender:
Females 75.0% 22.6% 1.7% .8%
Males 78.6% 18.3% 2.3% .8%
Results by age:
18-34 77.9% 15.0% 4.7% 2.4%
35-44 63.2% 36.8% .0% .0%
45-54 78.6% 18.4% 2.0% .9%
55-64 79.1% 20.1% .8% .0%
65-74 83.7% 14.5% 1.8% .0%
75+ 76.2% 19.7% 2.8% 1.3%
Results by location:
A city (pop. 10,000+) * * * *
A town (pop. under 10,000) 79.0% 18.6% 1.4% 1.0%
A rural area 75.4% 21.5% 2.6% .5%
Results by respondent’s education level:
Less than high school 68.1% 28.6% 3.3% .0%
High school diploma or GED 82.9% 16.3% .7% .0%
Some college, trade school, or associate’s degree 74.2% 23.0% 1.4% 1.3%
Bachelor’s degree or higher 76.0% 18.2% 4.7% 1.1%
Results by household income:
Less than $15,000 81.4% 16.5% .0% 2.2%
$15,000 to $35,000 74.2% 22.8% 3.0% .0%
$35,001 to $65,000 76.8% 22.1% 1.0% .0%
More than $65,000 75.3% 18.7% 4.1% 1.9%
Results for CHB service area 73.8% 22.7% 2.6% .9%
Results for 19-county region 64.7% 30.6% 4.1% .7%

Lac qui Parle County Data Book Wilder Research, December 2010 2010 Southwest/South Central Adult Health Survey
60
D7a. There is a large selection of fresh fruits and vegetables where I usually shop.
Strongly
agree Agree Disagree Strongly disagree
Overall results 22.6% 55.5% 18.5% 3.3%
Results by gender:
Females 21.2% 51.5% 22.9% 4.3%
Males 24.1% 60.0% 13.7% 2.2%
Results by age:
18-34 23.5% 47.7% 24.2% 4.6%
35-44 20.4% 35.4% 33.8% 10.4%
45-54 16.9% 60.2% 18.1% 4.8%
55-64 20.3% 57.6% 21.4% .7%
65-74 29.9% 58.1% 11.4% .6%
75+ 28.4% 67.3% 4.3% .0%
Results by location:
A city (pop. 10,000+) * * * *
A town (pop. under 10,000) 21.9% 56.8% 18.6% 2.7%
A rural area 22.5% 54.2% 19.0% 4.3%
Results by respondent’s education level:
Less than high school 28.8% 59.0% 4.2% 8.1%
High school diploma or GED 26.3% 56.4% 16.6% .8%
Some college, trade school, or associate’s degree 21.0% 52.0% 23.2% 3.9%
Bachelor’s degree or higher 17.4% 61.5% 16.7% 4.4%
Results by household income:
Less than $15,000 23.4% 45.0% 29.0% 2.6%
$15,000 to $35,000 33.2% 53.9% 8.3% 4.5%
$35,001 to $65,000 21.1% 53.1% 22.4% 3.4%
More than $65,000 17.8% 61.8% 16.6% 3.8%
Results for CHB service area 30.4% 56.2% 12.1% 1.3%
Results for 19-county region 46.8% 47.1% 5.4% .7%
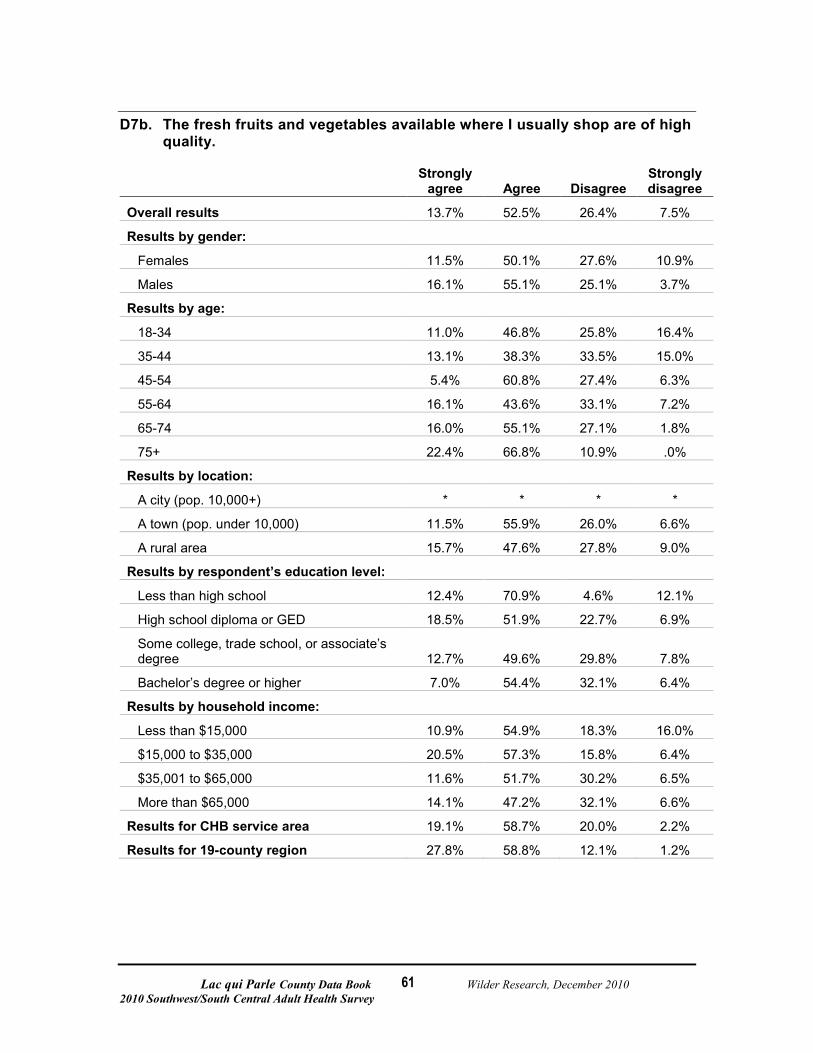
Lac qui Parle County Data Book Wilder Research, December 2010 2010 Southwest/South Central Adult Health Survey
61
D7b. The fresh fruits and vegetables available where I usually shop are of high quality.
Strongly
agree Agree Disagree Strongly disagree
Overall results 13.7% 52.5% 26.4% 7.5%
Results by gender:
Females 11.5% 50.1% 27.6% 10.9%
Males 16.1% 55.1% 25.1% 3.7%
Results by age:
18-34 11.0% 46.8% 25.8% 16.4%
35-44 13.1% 38.3% 33.5% 15.0%
45-54 5.4% 60.8% 27.4% 6.3%
55-64 16.1% 43.6% 33.1% 7.2%
65-74 16.0% 55.1% 27.1% 1.8%
75+ 22.4% 66.8% 10.9% .0%
Results by location:
A city (pop. 10,000+) * * * *
A town (pop. under 10,000) 11.5% 55.9% 26.0% 6.6%
A rural area 15.7% 47.6% 27.8% 9.0%
Results by respondent’s education level:
Less than high school 12.4% 70.9% 4.6% 12.1%
High school diploma or GED 18.5% 51.9% 22.7% 6.9%
Some college, trade school, or associate’s degree 12.7% 49.6% 29.8% 7.8%
Bachelor’s degree or higher 7.0% 54.4% 32.1% 6.4%
Results by household income:
Less than $15,000 10.9% 54.9% 18.3% 16.0%
$15,000 to $35,000 20.5% 57.3% 15.8% 6.4%
$35,001 to $65,000 11.6% 51.7% 30.2% 6.5%
More than $65,000 14.1% 47.2% 32.1% 6.6%
Results for CHB service area 19.1% 58.7% 20.0% 2.2%
Results for 19-county region 27.8% 58.8% 12.1% 1.2%
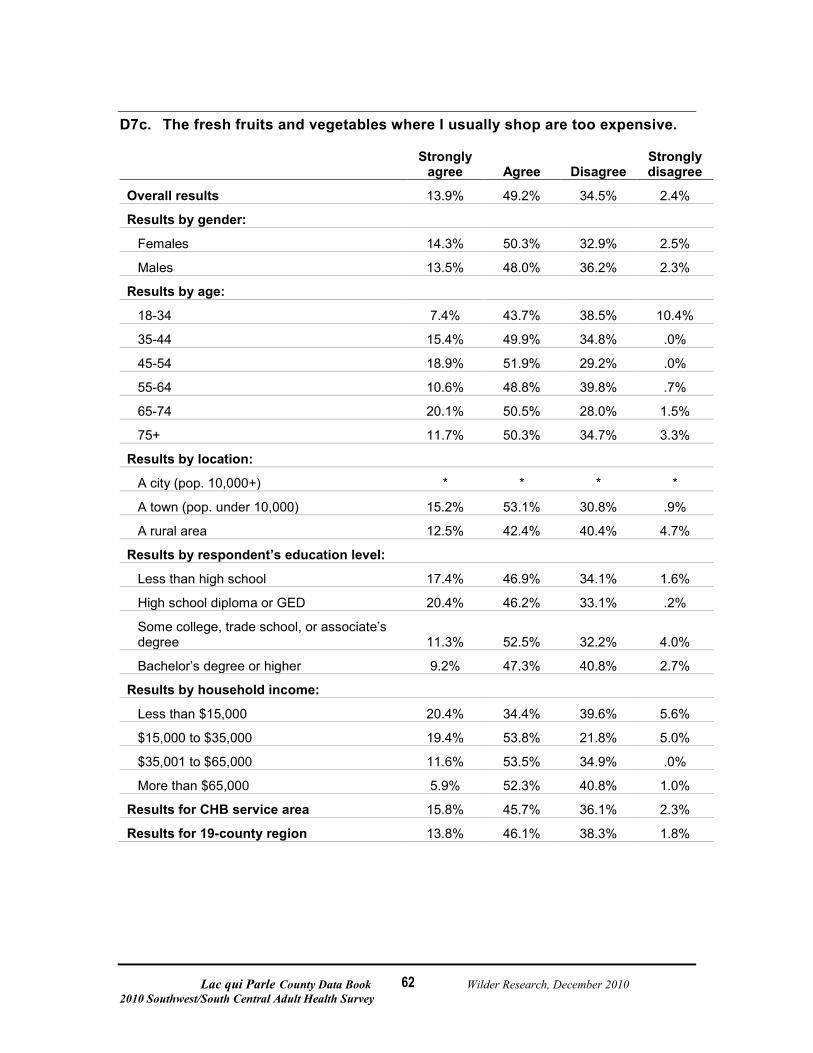
Lac qui Parle County Data Book Wilder Research, December 2010 2010 Southwest/South Central Adult Health Survey
62
D7c. The fresh fruits and vegetables where I usually shop are too expensive.
Strongly
agree Agree Disagree Strongly disagree
Overall results 13.9% 49.2% 34.5% 2.4%
Results by gender:
Females 14.3% 50.3% 32.9% 2.5%
Males 13.5% 48.0% 36.2% 2.3%
Results by age:
18-34 7.4% 43.7% 38.5% 10.4%
35-44 15.4% 49.9% 34.8% .0%
45-54 18.9% 51.9% 29.2% .0%
55-64 10.6% 48.8% 39.8% .7%
65-74 20.1% 50.5% 28.0% 1.5%
75+ 11.7% 50.3% 34.7% 3.3%
Results by location:
A city (pop. 10,000+) * * * *
A town (pop. under 10,000) 15.2% 53.1% 30.8% .9%
A rural area 12.5% 42.4% 40.4% 4.7%
Results by respondent’s education level:
Less than high school 17.4% 46.9% 34.1% 1.6%
High school diploma or GED 20.4% 46.2% 33.1% .2%
Some college, trade school, or associate’s degree 11.3% 52.5% 32.2% 4.0%
Bachelor’s degree or higher 9.2% 47.3% 40.8% 2.7%
Results by household income:
Less than $15,000 20.4% 34.4% 39.6% 5.6%
$15,000 to $35,000 19.4% 53.8% 21.8% 5.0%
$35,001 to $65,000 11.6% 53.5% 34.9% .0%
More than $65,000 5.9% 52.3% 40.8% 1.0%
Results for CHB service area 15.8% 45.7% 36.1% 2.3%
Results for 19-county region 13.8% 46.1% 38.3% 1.8%
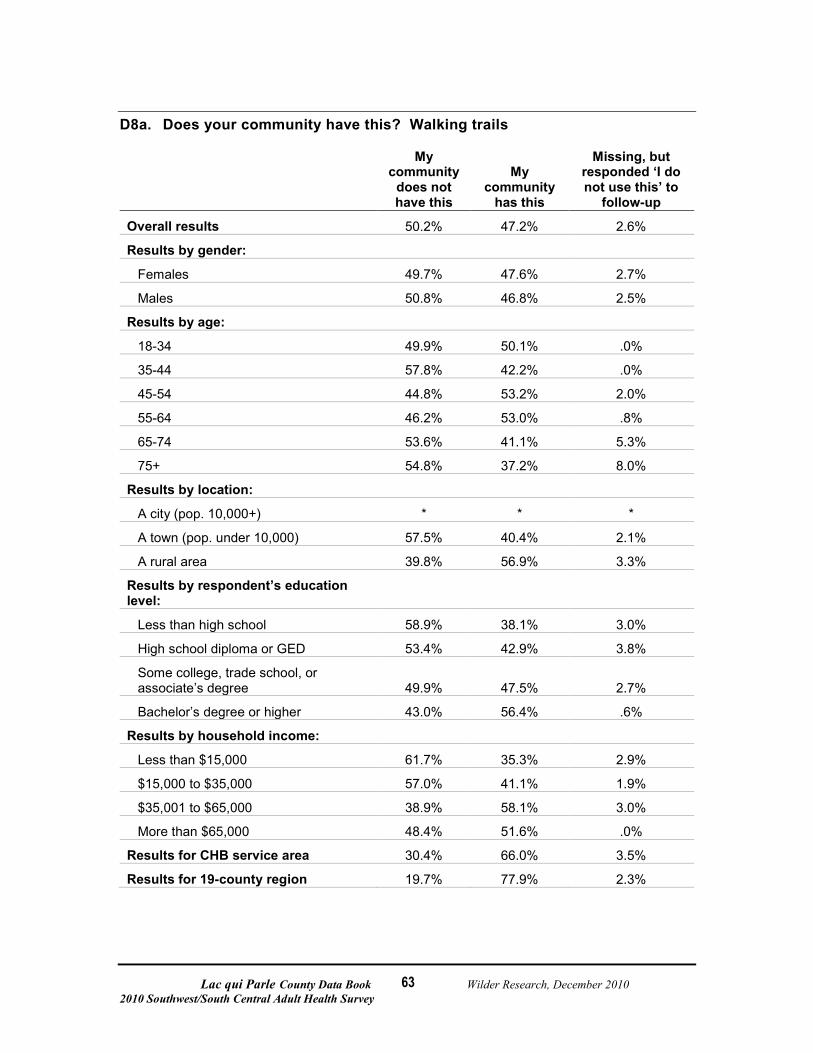
Lac qui Parle County Data Book Wilder Research, December 2010 2010 Southwest/South Central Adult Health Survey
63
D8a. Does your community have this? Walking trails
My community
does not have this
My community
has this
Missing, but responded ‘I do not use this’ to
follow-up
Overall results 50.2% 47.2% 2.6%
Results by gender:
Females 49.7% 47.6% 2.7%
Males 50.8% 46.8% 2.5%
Results by age:
18-34 49.9% 50.1% .0%
35-44 57.8% 42.2% .0%
45-54 44.8% 53.2% 2.0%
55-64 46.2% 53.0% .8%
65-74 53.6% 41.1% 5.3%
75+ 54.8% 37.2% 8.0%
Results by location:
A city (pop. 10,000+) * * *
A town (pop. under 10,000) 57.5% 40.4% 2.1%
A rural area 39.8% 56.9% 3.3%
Results by respondent’s education level:
Less than high school 58.9% 38.1% 3.0%
High school diploma or GED 53.4% 42.9% 3.8%
Some college, trade school, or associate’s degree 49.9% 47.5% 2.7%
Bachelor’s degree or higher 43.0% 56.4% .6%
Results by household income:
Less than $15,000 61.7% 35.3% 2.9%
$15,000 to $35,000 57.0% 41.1% 1.9%
$35,001 to $65,000 38.9% 58.1% 3.0%
More than $65,000 48.4% 51.6% .0%
Results for CHB service area 30.4% 66.0% 3.5%
Results for 19-county region 19.7% 77.9% 2.3%
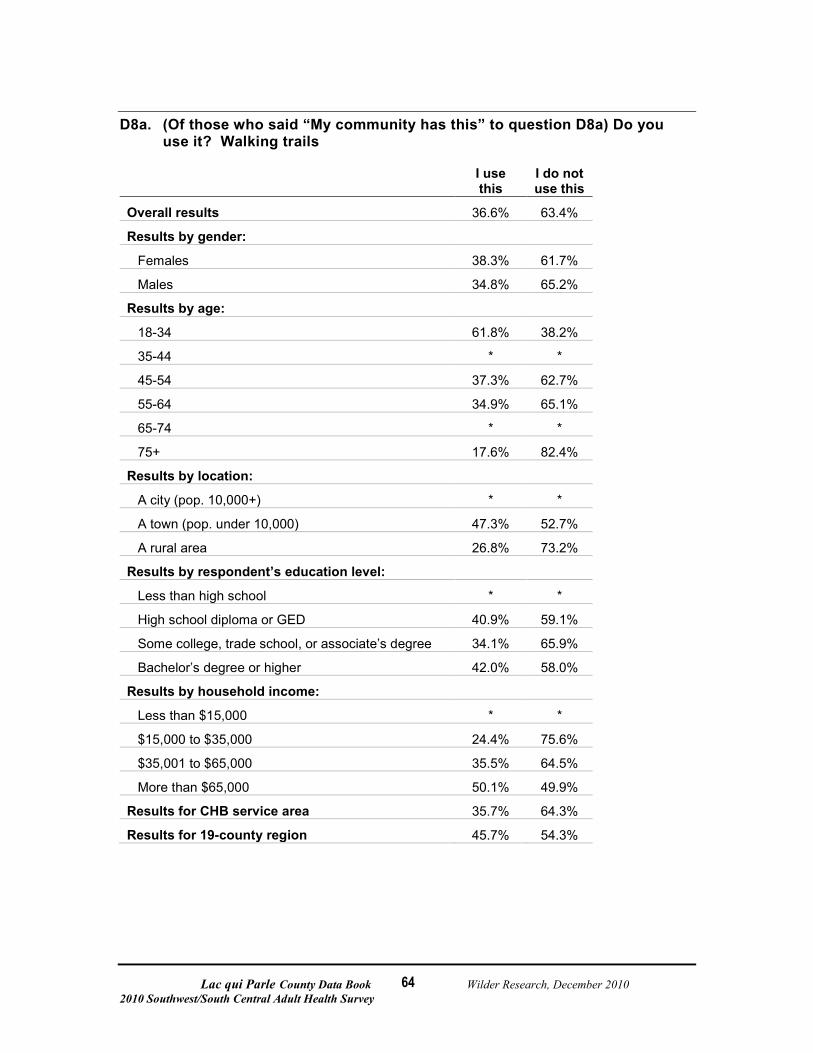
Lac qui Parle County Data Book Wilder Research, December 2010 2010 Southwest/South Central Adult Health Survey
64
D8a. (Of those who said “My community has this” to question D8a) Do you use it? Walking trails
I use this
I do not use this
Overall results 36.6% 63.4%
Results by gender:
Females 38.3% 61.7%
Males 34.8% 65.2%
Results by age:
18-34 61.8% 38.2%
35-44 * *
45-54 37.3% 62.7%
55-64 34.9% 65.1%
65-74 * *
75+ 17.6% 82.4%
Results by location:
A city (pop. 10,000+) * *
A town (pop. under 10,000) 47.3% 52.7%
A rural area 26.8% 73.2%
Results by respondent’s education level:
Less than high school * *
High school diploma or GED 40.9% 59.1%
Some college, trade school, or associate’s degree 34.1% 65.9%
Bachelor’s degree or higher 42.0% 58.0%
Results by household income:
Less than $15,000 * *
$15,000 to $35,000 24.4% 75.6%
$35,001 to $65,000 35.5% 64.5%
More than $65,000 50.1% 49.9%
Results for CHB service area 35.7% 64.3%
Results for 19-county region 45.7% 54.3%
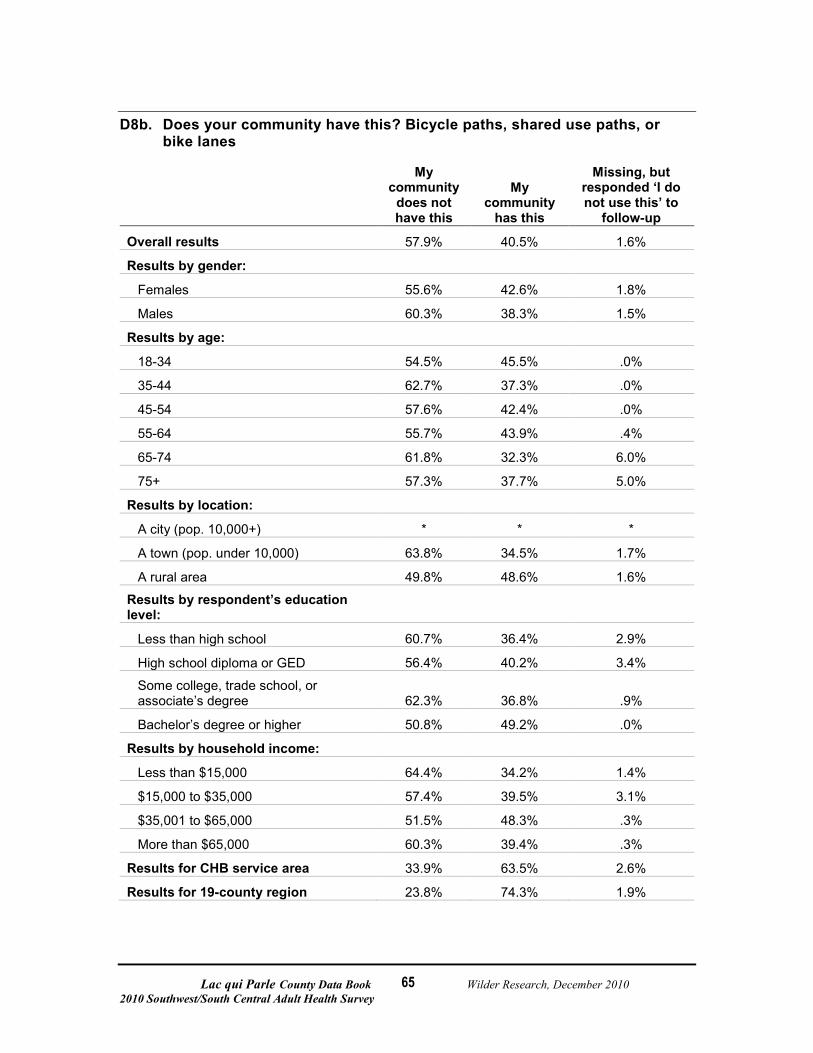
Lac qui Parle County Data Book Wilder Research, December 2010 2010 Southwest/South Central Adult Health Survey
65
D8b. Does your community have this? Bicycle paths, shared use paths, or bike lanes
My community
does not have this
My community
has this
Missing, but responded ‘I do not use this’ to
follow-up
Overall results 57.9% 40.5% 1.6%
Results by gender:
Females 55.6% 42.6% 1.8%
Males 60.3% 38.3% 1.5%
Results by age:
18-34 54.5% 45.5% .0%
35-44 62.7% 37.3% .0%
45-54 57.6% 42.4% .0%
55-64 55.7% 43.9% .4%
65-74 61.8% 32.3% 6.0%
75+ 57.3% 37.7% 5.0%
Results by location:
A city (pop. 10,000+) * * *
A town (pop. under 10,000) 63.8% 34.5% 1.7%
A rural area 49.8% 48.6% 1.6%
Results by respondent’s education level:
Less than high school 60.7% 36.4% 2.9%
High school diploma or GED 56.4% 40.2% 3.4%
Some college, trade school, or associate’s degree 62.3% 36.8% .9%
Bachelor’s degree or higher 50.8% 49.2% .0%
Results by household income:
Less than $15,000 64.4% 34.2% 1.4%
$15,000 to $35,000 57.4% 39.5% 3.1%
$35,001 to $65,000 51.5% 48.3% .3%
More than $65,000 60.3% 39.4% .3%
Results for CHB service area 33.9% 63.5% 2.6%
Results for 19-county region 23.8% 74.3% 1.9%
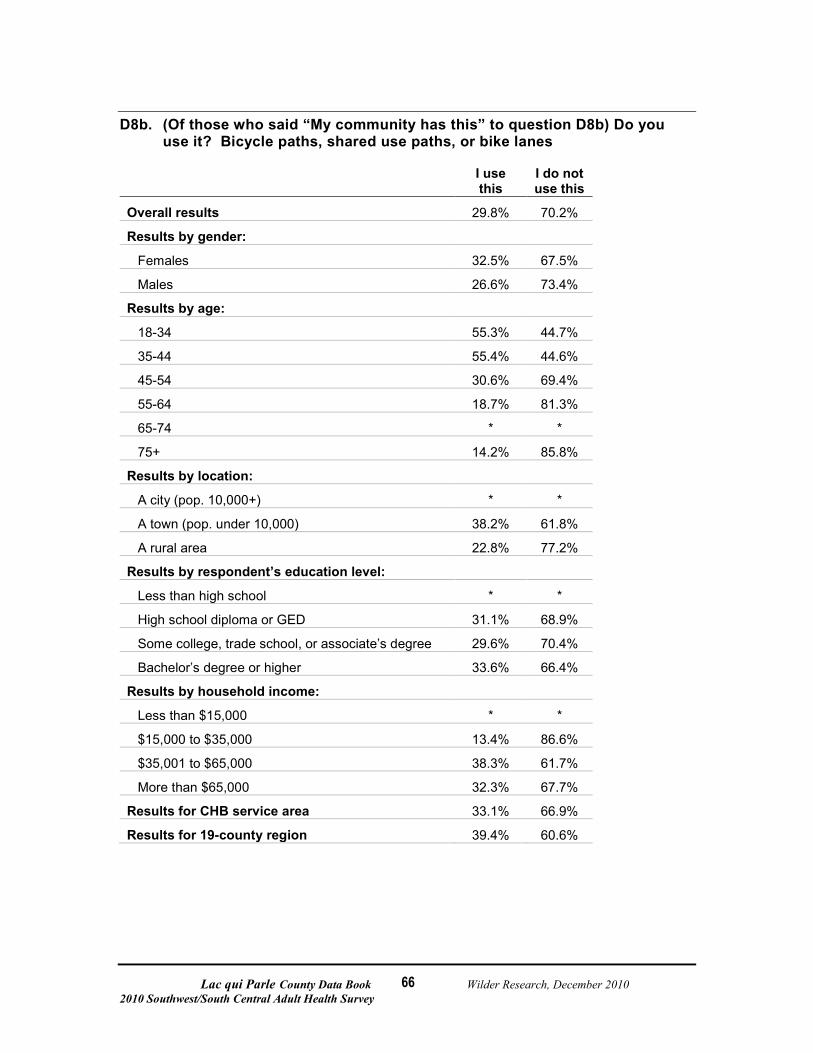
Lac qui Parle County Data Book Wilder Research, December 2010 2010 Southwest/South Central Adult Health Survey
66
D8b. (Of those who said “My community has this” to question D8b) Do you use it? Bicycle paths, shared use paths, or bike lanes
I use this
I do not use this
Overall results 29.8% 70.2%
Results by gender:
Females 32.5% 67.5%
Males 26.6% 73.4%
Results by age:
18-34 55.3% 44.7%
35-44 55.4% 44.6%
45-54 30.6% 69.4%
55-64 18.7% 81.3%
65-74 * *
75+ 14.2% 85.8%
Results by location:
A city (pop. 10,000+) * *
A town (pop. under 10,000) 38.2% 61.8%
A rural area 22.8% 77.2%
Results by respondent’s education level:
Less than high school * *
High school diploma or GED 31.1% 68.9%
Some college, trade school, or associate’s degree 29.6% 70.4%
Bachelor’s degree or higher 33.6% 66.4%
Results by household income:
Less than $15,000 * *
$15,000 to $35,000 13.4% 86.6%
$35,001 to $65,000 38.3% 61.7%
More than $65,000 32.3% 67.7%
Results for CHB service area 33.1% 66.9%
Results for 19-county region 39.4% 60.6%
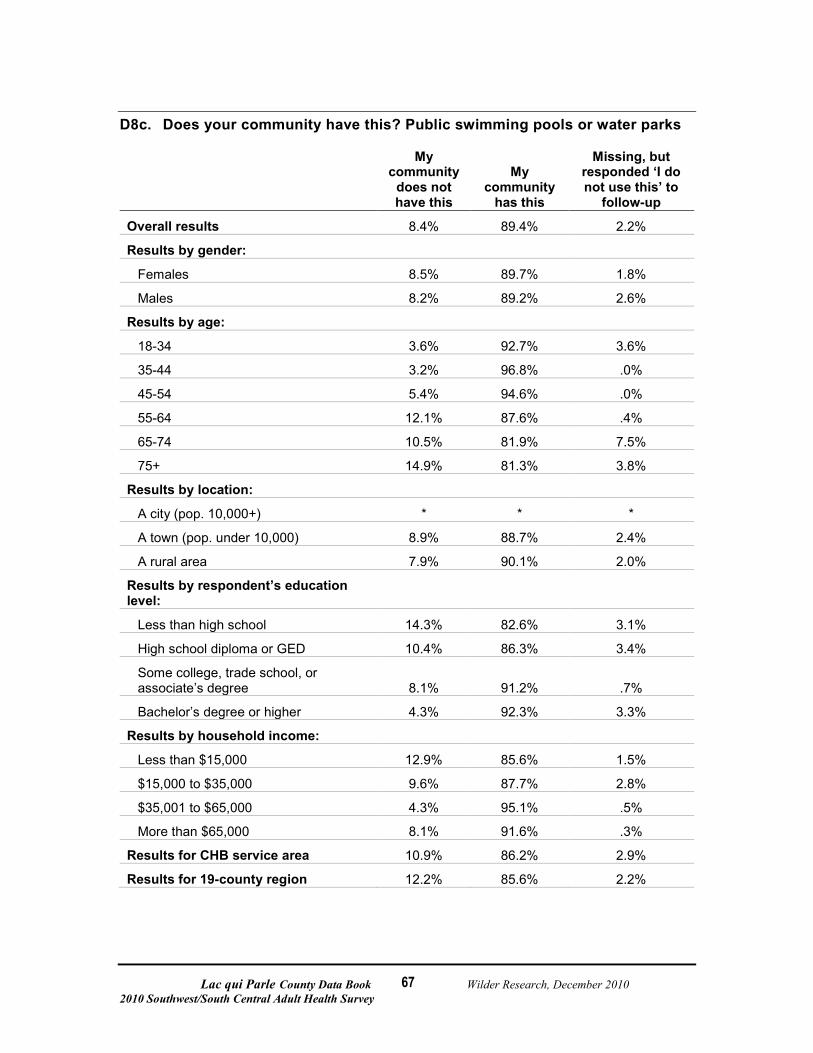
Lac qui Parle County Data Book Wilder Research, December 2010 2010 Southwest/South Central Adult Health Survey
67
D8c. Does your community have this? Public swimming pools or water parks
My community
does not have this
My community
has this
Missing, but responded ‘I do not use this’ to
follow-up
Overall results 8.4% 89.4% 2.2%
Results by gender:
Females 8.5% 89.7% 1.8%
Males 8.2% 89.2% 2.6%
Results by age:
18-34 3.6% 92.7% 3.6%
35-44 3.2% 96.8% .0%
45-54 5.4% 94.6% .0%
55-64 12.1% 87.6% .4%
65-74 10.5% 81.9% 7.5%
75+ 14.9% 81.3% 3.8%
Results by location:
A city (pop. 10,000+) * * *
A town (pop. under 10,000) 8.9% 88.7% 2.4%
A rural area 7.9% 90.1% 2.0%
Results by respondent’s education level:
Less than high school 14.3% 82.6% 3.1%
High school diploma or GED 10.4% 86.3% 3.4%
Some college, trade school, or associate’s degree 8.1% 91.2% .7%
Bachelor’s degree or higher 4.3% 92.3% 3.3%
Results by household income:
Less than $15,000 12.9% 85.6% 1.5%
$15,000 to $35,000 9.6% 87.7% 2.8%
$35,001 to $65,000 4.3% 95.1% .5%
More than $65,000 8.1% 91.6% .3%
Results for CHB service area 10.9% 86.2% 2.9%
Results for 19-county region 12.2% 85.6% 2.2%
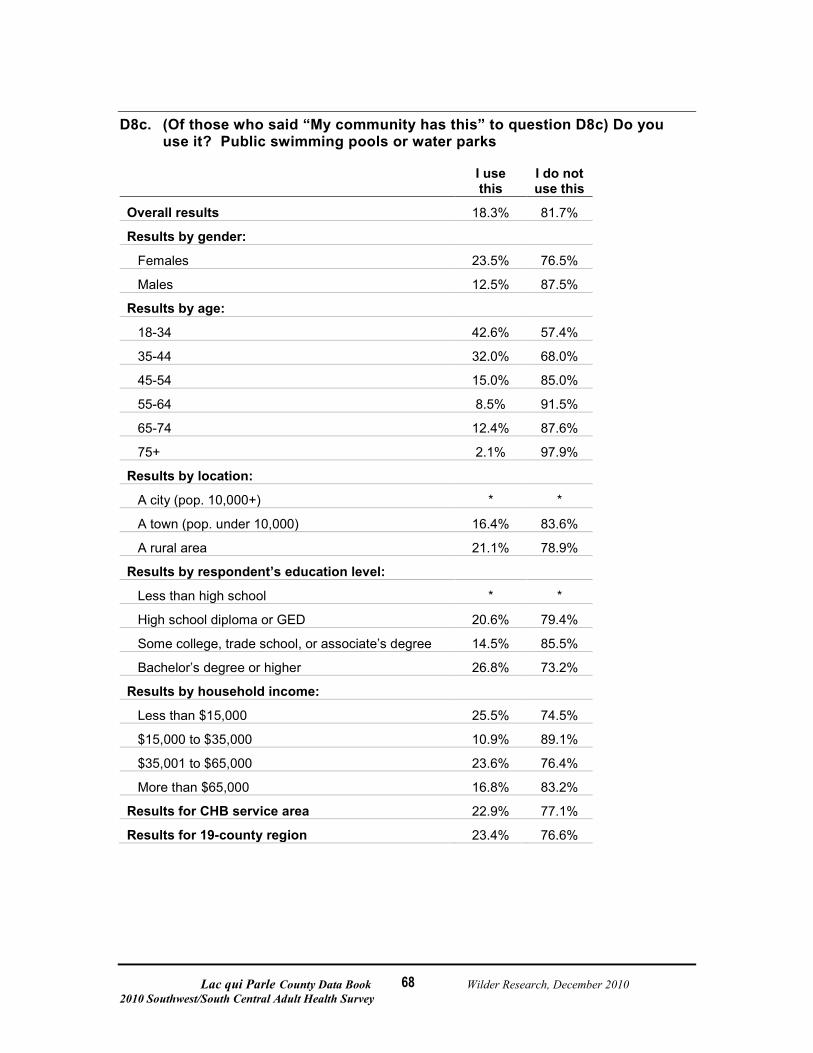
Lac qui Parle County Data Book Wilder Research, December 2010 2010 Southwest/South Central Adult Health Survey
68
D8c. (Of those who said “My community has this” to question D8c) Do you use it? Public swimming pools or water parks
I use this
I do not use this
Overall results 18.3% 81.7%
Results by gender:
Females 23.5% 76.5%
Males 12.5% 87.5%
Results by age:
18-34 42.6% 57.4%
35-44 32.0% 68.0%
45-54 15.0% 85.0%
55-64 8.5% 91.5%
65-74 12.4% 87.6%
75+ 2.1% 97.9%
Results by location:
A city (pop. 10,000+) * *
A town (pop. under 10,000) 16.4% 83.6%
A rural area 21.1% 78.9%
Results by respondent’s education level:
Less than high school * *
High school diploma or GED 20.6% 79.4%
Some college, trade school, or associate’s degree 14.5% 85.5%
Bachelor’s degree or higher 26.8% 73.2%
Results by household income:
Less than $15,000 25.5% 74.5%
$15,000 to $35,000 10.9% 89.1%
$35,001 to $65,000 23.6% 76.4%
More than $65,000 16.8% 83.2%
Results for CHB service area 22.9% 77.1%
Results for 19-county region 23.4% 76.6%
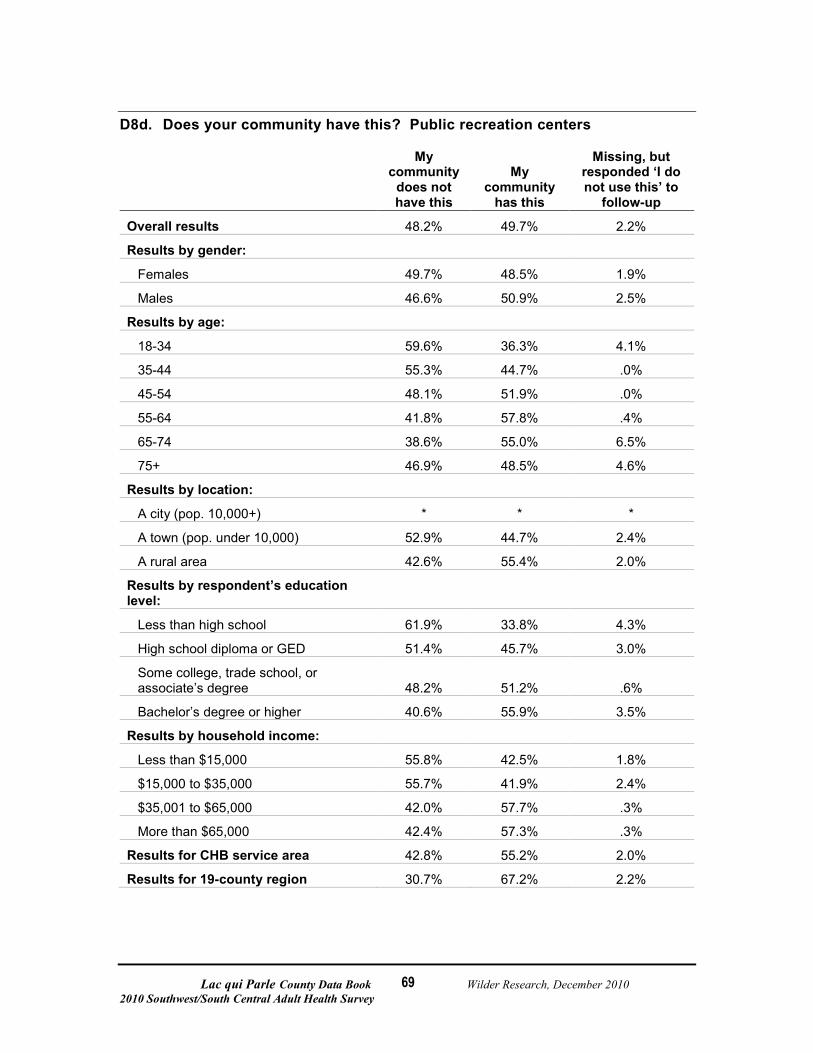
Lac qui Parle County Data Book Wilder Research, December 2010 2010 Southwest/South Central Adult Health Survey
69
D8d. Does your community have this? Public recreation centers
My community
does not have this
My community
has this
Missing, but responded ‘I do not use this’ to
follow-up
Overall results 48.2% 49.7% 2.2%
Results by gender:
Females 49.7% 48.5% 1.9%
Males 46.6% 50.9% 2.5%
Results by age:
18-34 59.6% 36.3% 4.1%
35-44 55.3% 44.7% .0%
45-54 48.1% 51.9% .0%
55-64 41.8% 57.8% .4%
65-74 38.6% 55.0% 6.5%
75+ 46.9% 48.5% 4.6%
Results by location:
A city (pop. 10,000+) * * *
A town (pop. under 10,000) 52.9% 44.7% 2.4%
A rural area 42.6% 55.4% 2.0%
Results by respondent’s education level:
Less than high school 61.9% 33.8% 4.3%
High school diploma or GED 51.4% 45.7% 3.0%
Some college, trade school, or associate’s degree 48.2% 51.2% .6%
Bachelor’s degree or higher 40.6% 55.9% 3.5%
Results by household income:
Less than $15,000 55.8% 42.5% 1.8%
$15,000 to $35,000 55.7% 41.9% 2.4%
$35,001 to $65,000 42.0% 57.7% .3%
More than $65,000 42.4% 57.3% .3%
Results for CHB service area 42.8% 55.2% 2.0%
Results for 19-county region 30.7% 67.2% 2.2%
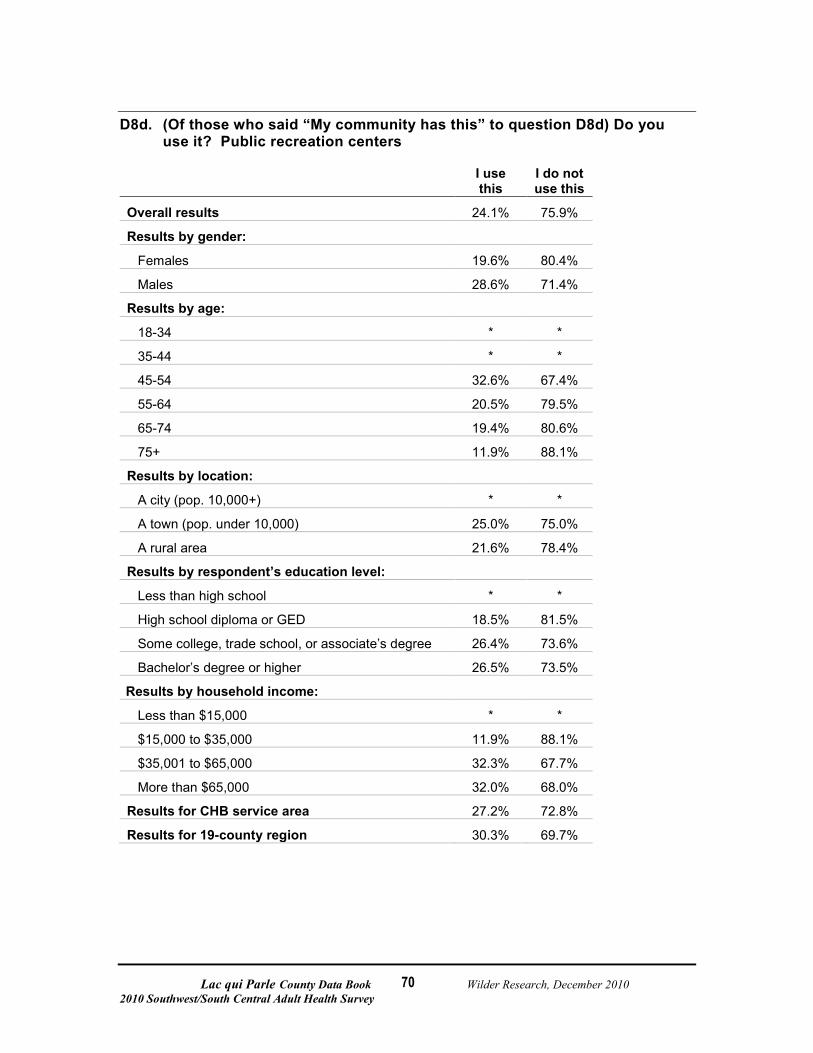
Lac qui Parle County Data Book Wilder Research, December 2010 2010 Southwest/South Central Adult Health Survey
70
D8d. (Of those who said “My community has this” to question D8d) Do you use it? Public recreation centers
I use this
I do not use this
Overall results 24.1% 75.9%
Results by gender:
Females 19.6% 80.4%
Males 28.6% 71.4%
Results by age:
18-34 * *
35-44 * *
45-54 32.6% 67.4%
55-64 20.5% 79.5%
65-74 19.4% 80.6%
75+ 11.9% 88.1%
Results by location:
A city (pop. 10,000+) * *
A town (pop. under 10,000) 25.0% 75.0%
A rural area 21.6% 78.4%
Results by respondent’s education level:
Less than high school * *
High school diploma or GED 18.5% 81.5%
Some college, trade school, or associate’s degree 26.4% 73.6%
Bachelor’s degree or higher 26.5% 73.5%
Results by household income:
Less than $15,000 * *
$15,000 to $35,000 11.9% 88.1%
$35,001 to $65,000 32.3% 67.7%
More than $65,000 32.0% 68.0%
Results for CHB service area 27.2% 72.8%
Results for 19-county region 30.3% 69.7%
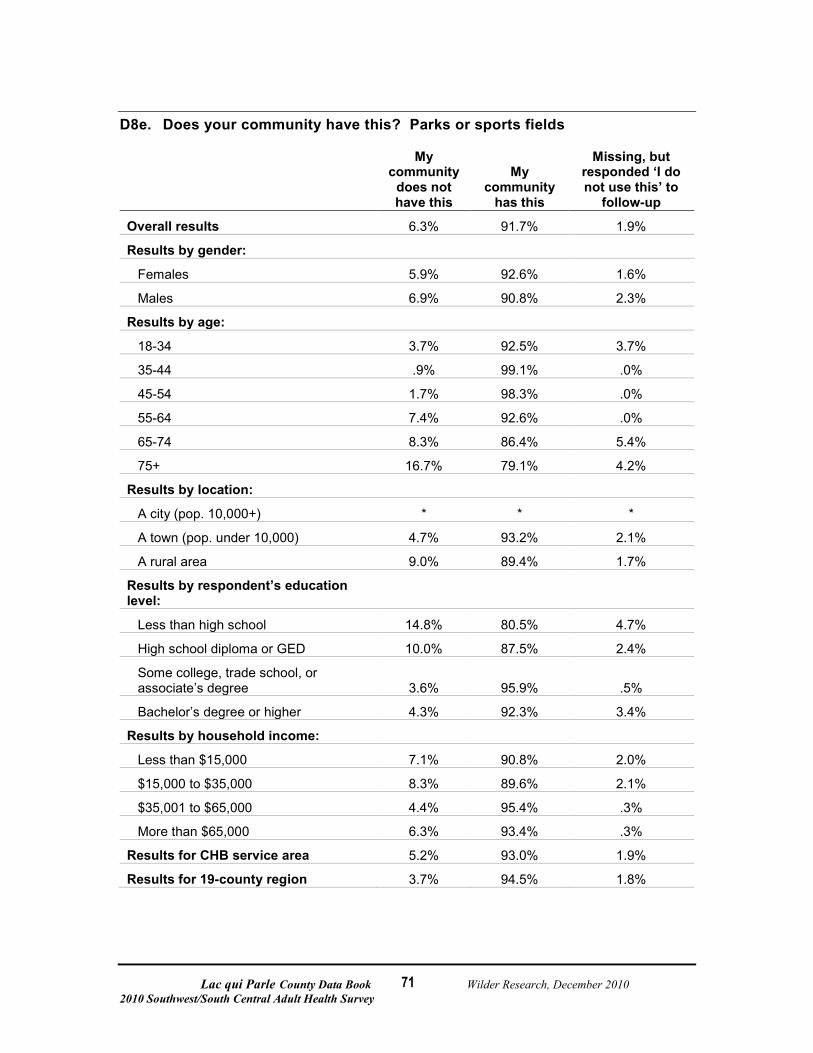
Lac qui Parle County Data Book Wilder Research, December 2010 2010 Southwest/South Central Adult Health Survey
71
D8e. Does your community have this? Parks or sports fields
My community
does not have this
My community
has this
Missing, but responded ‘I do not use this’ to
follow-up
Overall results 6.3% 91.7% 1.9%
Results by gender:
Females 5.9% 92.6% 1.6%
Males 6.9% 90.8% 2.3%
Results by age:
18-34 3.7% 92.5% 3.7%
35-44 .9% 99.1% .0%
45-54 1.7% 98.3% .0%
55-64 7.4% 92.6% .0%
65-74 8.3% 86.4% 5.4%
75+ 16.7% 79.1% 4.2%
Results by location:
A city (pop. 10,000+) * * *
A town (pop. under 10,000) 4.7% 93.2% 2.1%
A rural area 9.0% 89.4% 1.7%
Results by respondent’s education level:
Less than high school 14.8% 80.5% 4.7%
High school diploma or GED 10.0% 87.5% 2.4%
Some college, trade school, or associate’s degree 3.6% 95.9% .5%
Bachelor’s degree or higher 4.3% 92.3% 3.4%
Results by household income:
Less than $15,000 7.1% 90.8% 2.0%
$15,000 to $35,000 8.3% 89.6% 2.1%
$35,001 to $65,000 4.4% 95.4% .3%
More than $65,000 6.3% 93.4% .3%
Results for CHB service area 5.2% 93.0% 1.9%
Results for 19-county region 3.7% 94.5% 1.8%
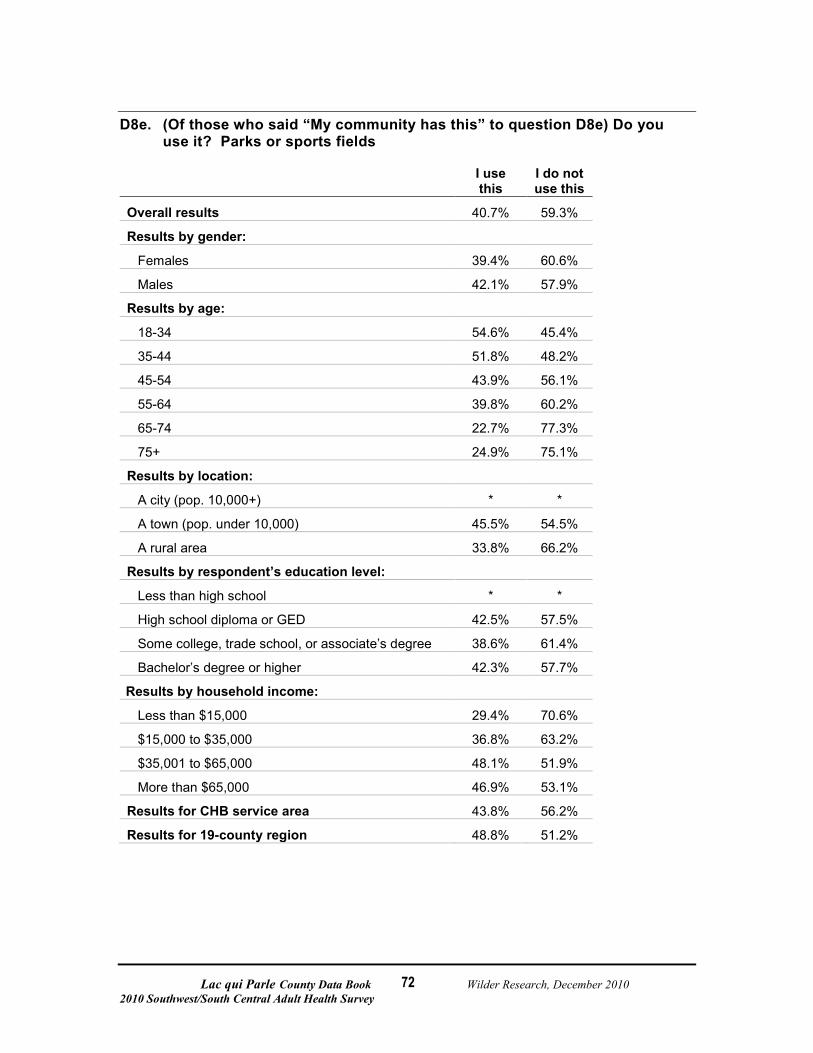
Lac qui Parle County Data Book Wilder Research, December 2010 2010 Southwest/South Central Adult Health Survey
72
D8e. (Of those who said “My community has this” to question D8e) Do you use it? Parks or sports fields
I use this
I do not use this
Overall results 40.7% 59.3%
Results by gender:
Females 39.4% 60.6%
Males 42.1% 57.9%
Results by age:
18-34 54.6% 45.4%
35-44 51.8% 48.2%
45-54 43.9% 56.1%
55-64 39.8% 60.2%
65-74 22.7% 77.3%
75+ 24.9% 75.1%
Results by location:
A city (pop. 10,000+) * *
A town (pop. under 10,000) 45.5% 54.5%
A rural area 33.8% 66.2%
Results by respondent’s education level:
Less than high school * *
High school diploma or GED 42.5% 57.5%
Some college, trade school, or associate’s degree 38.6% 61.4%
Bachelor’s degree or higher 42.3% 57.7%
Results by household income:
Less than $15,000 29.4% 70.6%
$15,000 to $35,000 36.8% 63.2%
$35,001 to $65,000 48.1% 51.9%
More than $65,000 46.9% 53.1%
Results for CHB service area 43.8% 56.2%
Results for 19-county region 48.8% 51.2%
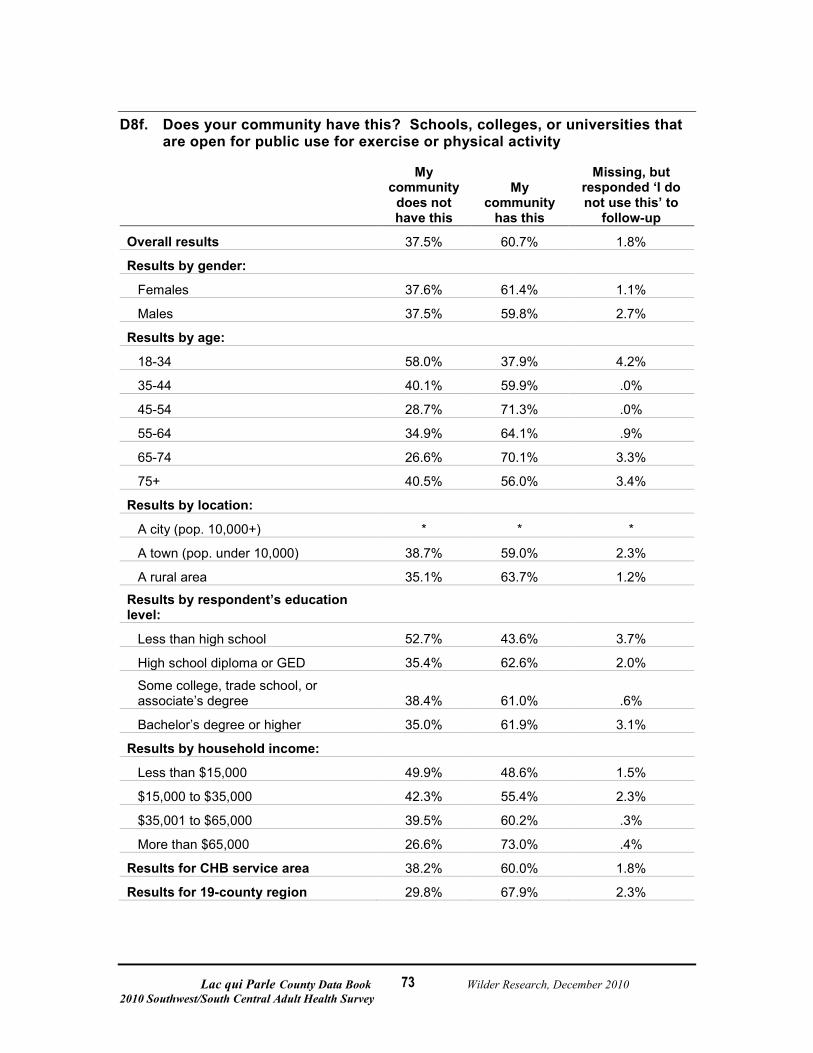
Lac qui Parle County Data Book Wilder Research, December 2010 2010 Southwest/South Central Adult Health Survey
73
D8f. Does your community have this? Schools, colleges, or universities that are open for public use for exercise or physical activity
My community
does not have this
My community
has this
Missing, but responded ‘I do not use this’ to
follow-up
Overall results 37.5% 60.7% 1.8%
Results by gender:
Females 37.6% 61.4% 1.1%
Males 37.5% 59.8% 2.7%
Results by age:
18-34 58.0% 37.9% 4.2%
35-44 40.1% 59.9% .0%
45-54 28.7% 71.3% .0%
55-64 34.9% 64.1% .9%
65-74 26.6% 70.1% 3.3%
75+ 40.5% 56.0% 3.4%
Results by location:
A city (pop. 10,000+) * * *
A town (pop. under 10,000) 38.7% 59.0% 2.3%
A rural area 35.1% 63.7% 1.2%
Results by respondent’s education level:
Less than high school 52.7% 43.6% 3.7%
High school diploma or GED 35.4% 62.6% 2.0%
Some college, trade school, or associate’s degree 38.4% 61.0% .6%
Bachelor’s degree or higher 35.0% 61.9% 3.1%
Results by household income:
Less than $15,000 49.9% 48.6% 1.5%
$15,000 to $35,000 42.3% 55.4% 2.3%
$35,001 to $65,000 39.5% 60.2% .3%
More than $65,000 26.6% 73.0% .4%
Results for CHB service area 38.2% 60.0% 1.8%
Results for 19-county region 29.8% 67.9% 2.3%
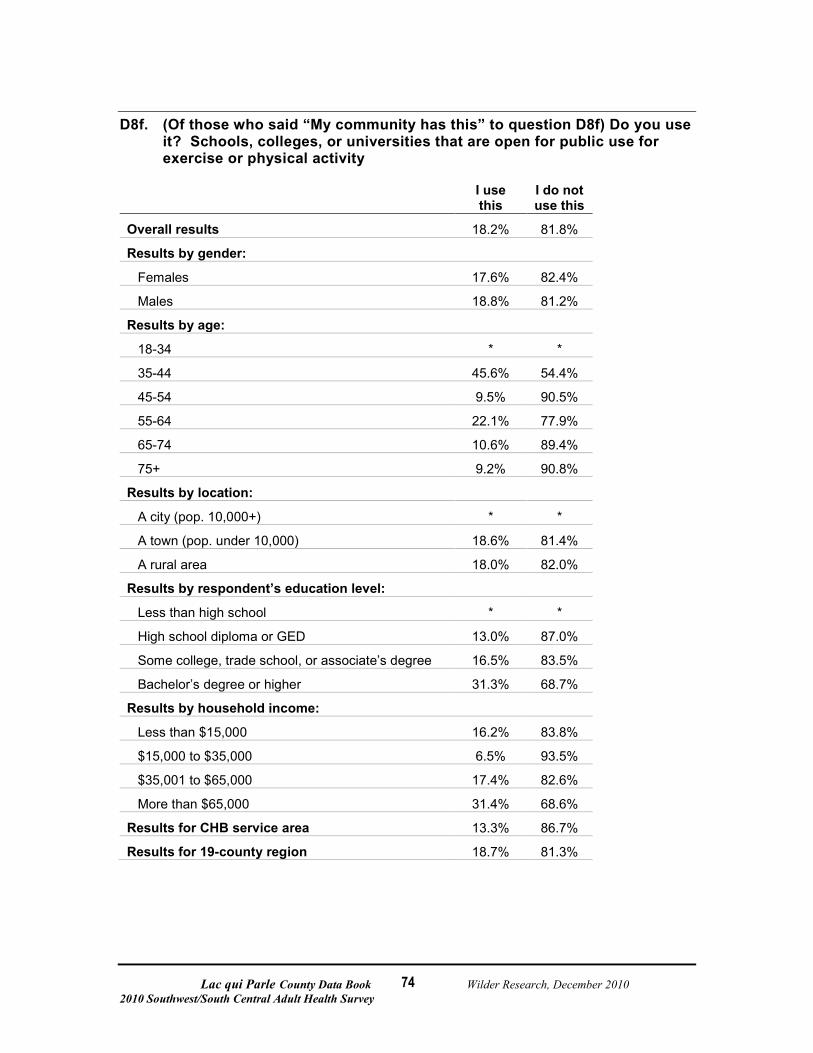
Lac qui Parle County Data Book Wilder Research, December 2010 2010 Southwest/South Central Adult Health Survey
74
D8f. (Of those who said “My community has this” to question D8f) Do you use it? Schools, colleges, or universities that are open for public use for exercise or physical activity
I use this
I do not use this
Overall results 18.2% 81.8%
Results by gender:
Females 17.6% 82.4%
Males 18.8% 81.2%
Results by age:
18-34 * *
35-44 45.6% 54.4%
45-54 9.5% 90.5%
55-64 22.1% 77.9%
65-74 10.6% 89.4%
75+ 9.2% 90.8%
Results by location:
A city (pop. 10,000+) * *
A town (pop. under 10,000) 18.6% 81.4%
A rural area 18.0% 82.0%
Results by respondent’s education level:
Less than high school * *
High school diploma or GED 13.0% 87.0%
Some college, trade school, or associate’s degree 16.5% 83.5%
Bachelor’s degree or higher 31.3% 68.7%
Results by household income:
Less than $15,000 16.2% 83.8%
$15,000 to $35,000 6.5% 93.5%
$35,001 to $65,000 17.4% 82.6%
More than $65,000 31.4% 68.6%
Results for CHB service area 13.3% 86.7%
Results for 19-county region 18.7% 81.3%
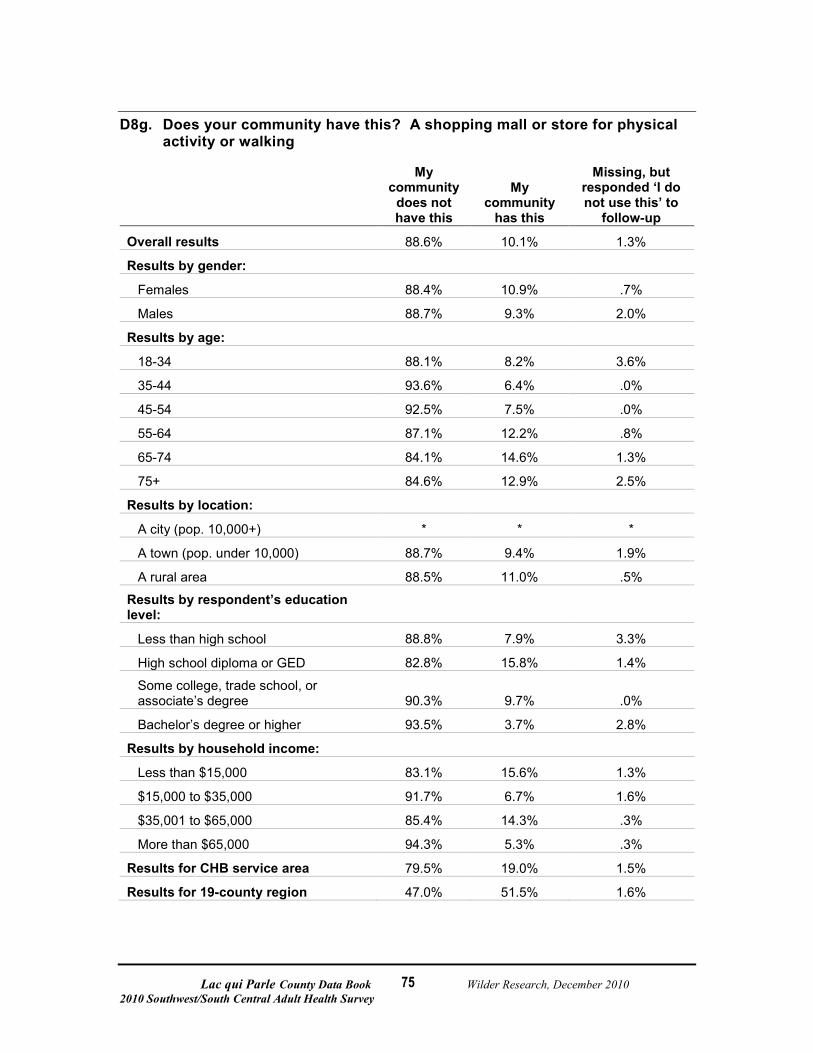
Lac qui Parle County Data Book Wilder Research, December 2010 2010 Southwest/South Central Adult Health Survey
75
D8g. Does your community have this? A shopping mall or store for physical activity or walking
My community
does not have this
My community
has this
Missing, but responded ‘I do not use this’ to
follow-up
Overall results 88.6% 10.1% 1.3%
Results by gender:
Females 88.4% 10.9% .7%
Males 88.7% 9.3% 2.0%
Results by age:
18-34 88.1% 8.2% 3.6%
35-44 93.6% 6.4% .0%
45-54 92.5% 7.5% .0%
55-64 87.1% 12.2% .8%
65-74 84.1% 14.6% 1.3%
75+ 84.6% 12.9% 2.5%
Results by location:
A city (pop. 10,000+) * * *
A town (pop. under 10,000) 88.7% 9.4% 1.9%
A rural area 88.5% 11.0% .5%
Results by respondent’s education level:
Less than high school 88.8% 7.9% 3.3%
High school diploma or GED 82.8% 15.8% 1.4%
Some college, trade school, or associate’s degree 90.3% 9.7% .0%
Bachelor’s degree or higher 93.5% 3.7% 2.8%
Results by household income:
Less than $15,000 83.1% 15.6% 1.3%
$15,000 to $35,000 91.7% 6.7% 1.6%
$35,001 to $65,000 85.4% 14.3% .3%
More than $65,000 94.3% 5.3% .3%
Results for CHB service area 79.5% 19.0% 1.5%
Results for 19-county region 47.0% 51.5% 1.6%
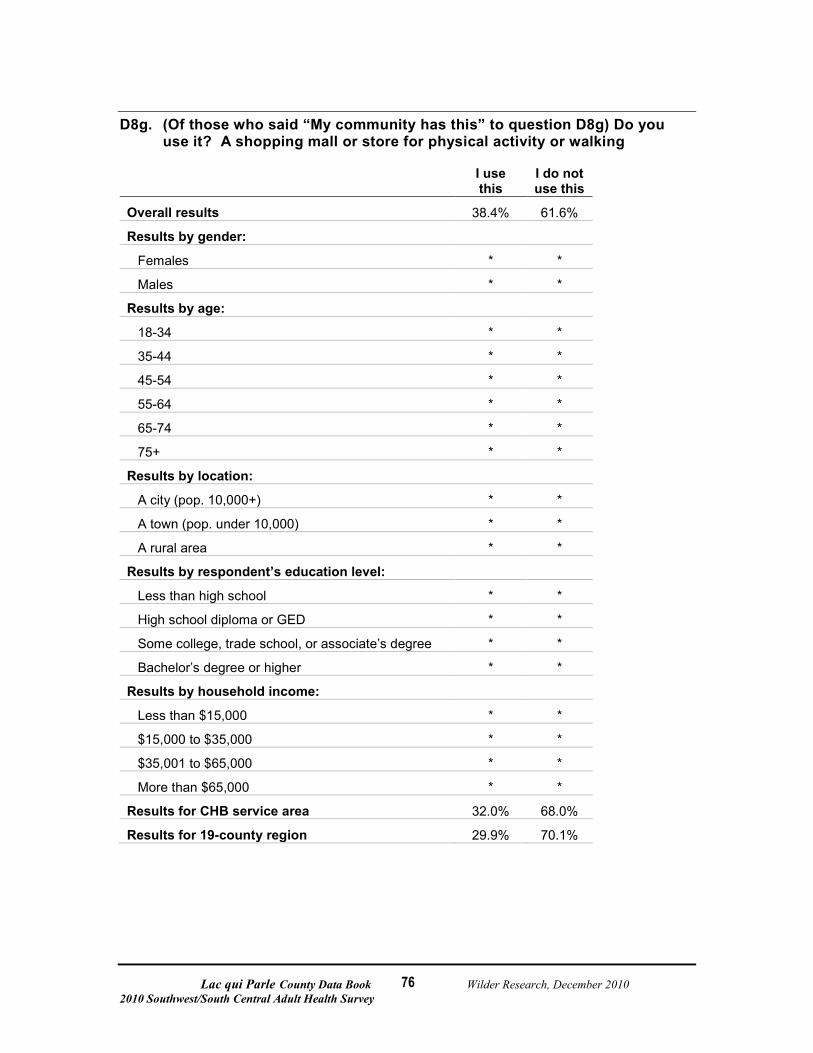
Lac qui Parle County Data Book Wilder Research, December 2010 2010 Southwest/South Central Adult Health Survey
76
D8g. (Of those who said “My community has this” to question D8g) Do you use it? A shopping mall or store for physical activity or walking
I use this
I do not use this
Overall results 38.4% 61.6%
Results by gender:
Females * *
Males * *
Results by age:
18-34 * *
35-44 * *
45-54 * *
55-64 * *
65-74 * *
75+ * *
Results by location:
A city (pop. 10,000+) * *
A town (pop. under 10,000) * *
A rural area * *
Results by respondent’s education level:
Less than high school * *
High school diploma or GED * *
Some college, trade school, or associate’s degree * *
Bachelor’s degree or higher * *
Results by household income:
Less than $15,000 * *
$15,000 to $35,000 * *
$35,001 to $65,000 * *
More than $65,000 * *
Results for CHB service area 32.0% 68.0%
Results for 19-county region 29.9% 70.1%
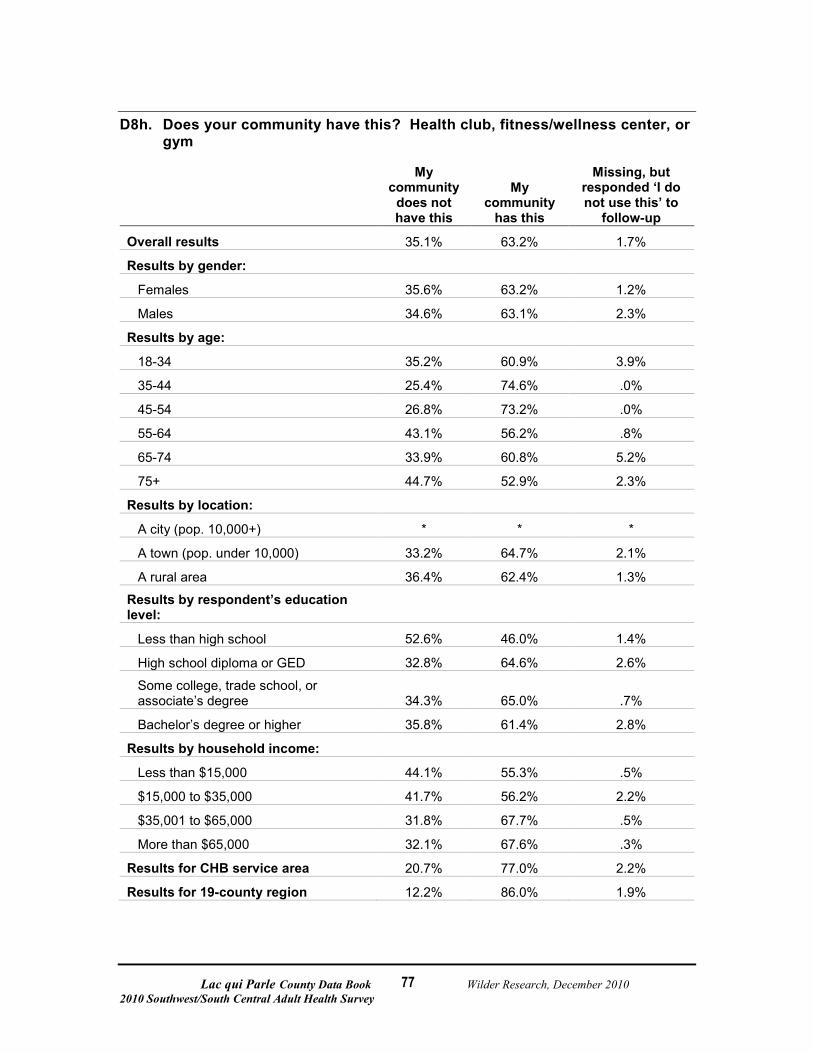
Lac qui Parle County Data Book Wilder Research, December 2010 2010 Southwest/South Central Adult Health Survey
77
D8h. Does your community have this? Health club, fitness/wellness center, or gym
My community
does not have this
My community
has this
Missing, but responded ‘I do not use this’ to
follow-up
Overall results 35.1% 63.2% 1.7%
Results by gender:
Females 35.6% 63.2% 1.2%
Males 34.6% 63.1% 2.3%
Results by age:
18-34 35.2% 60.9% 3.9%
35-44 25.4% 74.6% .0%
45-54 26.8% 73.2% .0%
55-64 43.1% 56.2% .8%
65-74 33.9% 60.8% 5.2%
75+ 44.7% 52.9% 2.3%
Results by location:
A city (pop. 10,000+) * * *
A town (pop. under 10,000) 33.2% 64.7% 2.1%
A rural area 36.4% 62.4% 1.3%
Results by respondent’s education level:
Less than high school 52.6% 46.0% 1.4%
High school diploma or GED 32.8% 64.6% 2.6%
Some college, trade school, or associate’s degree 34.3% 65.0% .7%
Bachelor’s degree or higher 35.8% 61.4% 2.8%
Results by household income:
Less than $15,000 44.1% 55.3% .5%
$15,000 to $35,000 41.7% 56.2% 2.2%
$35,001 to $65,000 31.8% 67.7% .5%
More than $65,000 32.1% 67.6% .3%
Results for CHB service area 20.7% 77.0% 2.2%
Results for 19-county region 12.2% 86.0% 1.9%
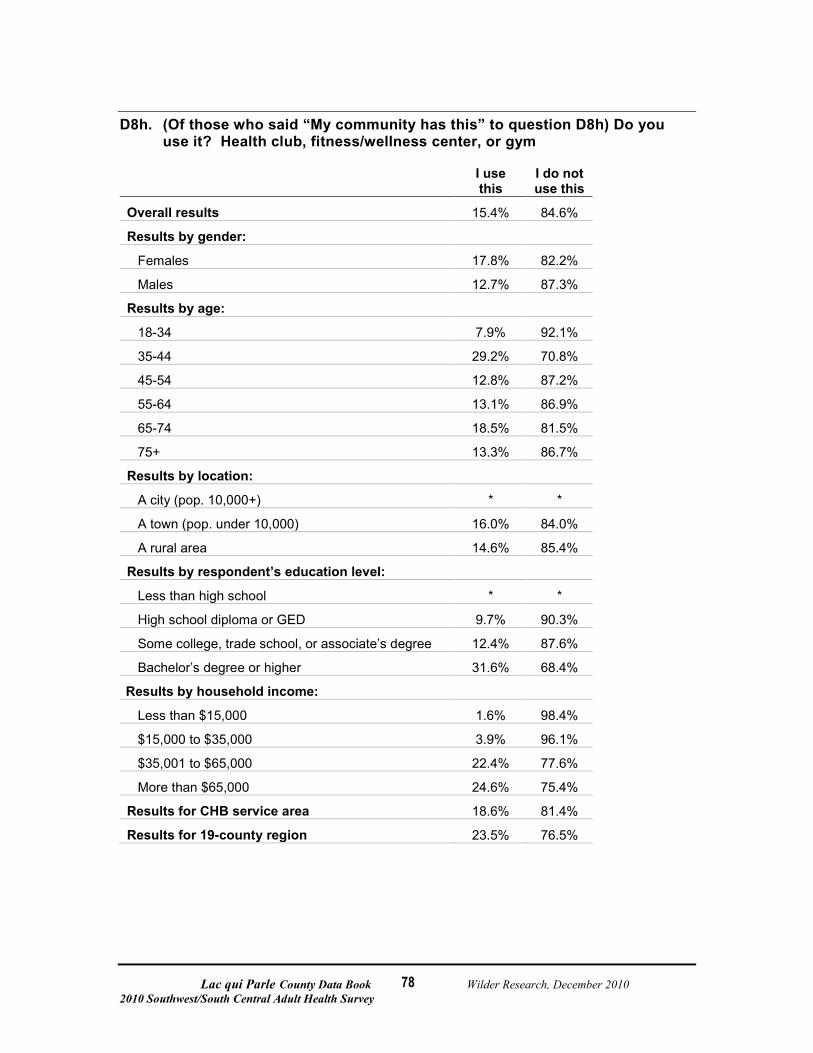
Lac qui Parle County Data Book Wilder Research, December 2010 2010 Southwest/South Central Adult Health Survey
78
D8h. (Of those who said “My community has this” to question D8h) Do you use it? Health club, fitness/wellness center, or gym
I use this
I do not use this
Overall results 15.4% 84.6%
Results by gender:
Females 17.8% 82.2%
Males 12.7% 87.3%
Results by age:
18-34 7.9% 92.1%
35-44 29.2% 70.8%
45-54 12.8% 87.2%
55-64 13.1% 86.9%
65-74 18.5% 81.5%
75+ 13.3% 86.7%
Results by location:
A city (pop. 10,000+) * *
A town (pop. under 10,000) 16.0% 84.0%
A rural area 14.6% 85.4%
Results by respondent’s education level:
Less than high school * *
High school diploma or GED 9.7% 90.3%
Some college, trade school, or associate’s degree 12.4% 87.6%
Bachelor’s degree or higher 31.6% 68.4%
Results by household income:
Less than $15,000 1.6% 98.4%
$15,000 to $35,000 3.9% 96.1%
$35,001 to $65,000 22.4% 77.6%
More than $65,000 24.6% 75.4%
Results for CHB service area 18.6% 81.4%
Results for 19-county region 23.5% 76.5%
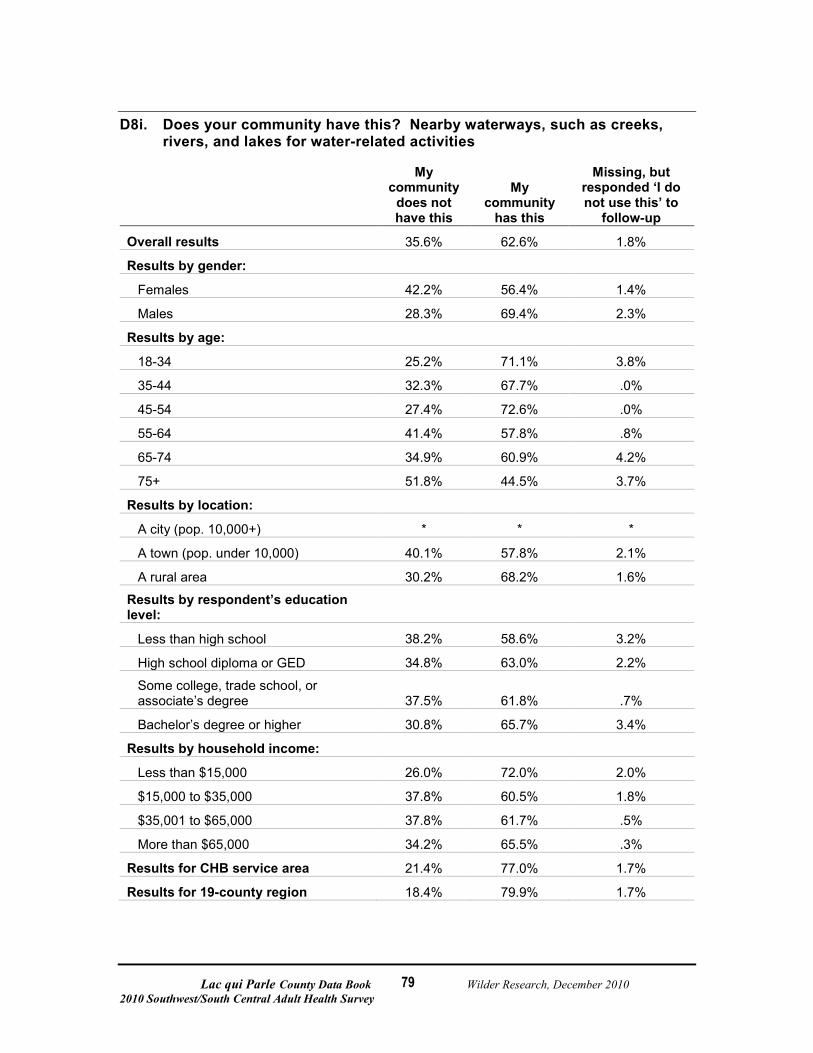
Lac qui Parle County Data Book Wilder Research, December 2010 2010 Southwest/South Central Adult Health Survey
79
D8i. Does your community have this? Nearby waterways, such as creeks, rivers, and lakes for water-related activities
My community
does not have this
My community
has this
Missing, but responded ‘I do not use this’ to
follow-up
Overall results 35.6% 62.6% 1.8%
Results by gender:
Females 42.2% 56.4% 1.4%
Males 28.3% 69.4% 2.3%
Results by age:
18-34 25.2% 71.1% 3.8%
35-44 32.3% 67.7% .0%
45-54 27.4% 72.6% .0%
55-64 41.4% 57.8% .8%
65-74 34.9% 60.9% 4.2%
75+ 51.8% 44.5% 3.7%
Results by location:
A city (pop. 10,000+) * * *
A town (pop. under 10,000) 40.1% 57.8% 2.1%
A rural area 30.2% 68.2% 1.6%
Results by respondent’s education level:
Less than high school 38.2% 58.6% 3.2%
High school diploma or GED 34.8% 63.0% 2.2%
Some college, trade school, or associate’s degree 37.5% 61.8% .7%
Bachelor’s degree or higher 30.8% 65.7% 3.4%
Results by household income:
Less than $15,000 26.0% 72.0% 2.0%
$15,000 to $35,000 37.8% 60.5% 1.8%
$35,001 to $65,000 37.8% 61.7% .5%
More than $65,000 34.2% 65.5% .3%
Results for CHB service area 21.4% 77.0% 1.7%
Results for 19-county region 18.4% 79.9% 1.7%

Lac qui Parle County Data Book Wilder Research, December 2010 2010 Southwest/South Central Adult Health Survey
80
D8i. (Of those who said “My community has this” to question D8i) Do you use it? Nearby waterways, such as creeks, rivers, and lakes for water-related activities
I use this
I do not use this
Overall results 34.6% 65.4%
Results by gender:
Females 31.8% 68.2%
Males 37.1% 62.9%
Results by age:
18-34 57.1% 42.9%
35-44 58.9% 41.1%
45-54 33.1% 66.9%
55-64 24.6% 75.4%
65-74 15.1% 84.9%
75+ 10.5% 89.5%
Results by location:
A city (pop. 10,000+) * *
A town (pop. under 10,000) 31.5% 68.5%
A rural area 38.3% 61.7%
Results by respondent’s education level:
Less than high school * *
High school diploma or GED 40.5% 59.5%
Some college, trade school, or associate’s degree 26.2% 73.8%
Bachelor’s degree or higher 40.7% 59.3%
Results by household income:
Less than $15,000 57.6% 42.4%
$15,000 to $35,000 25.0% 75.0%
$35,001 to $65,000 32.5% 67.5%
More than $65,000 33.0% 67.0%
Results for CHB service area 36.2% 63.8%
Results for 19-county region 37.4% 62.6%
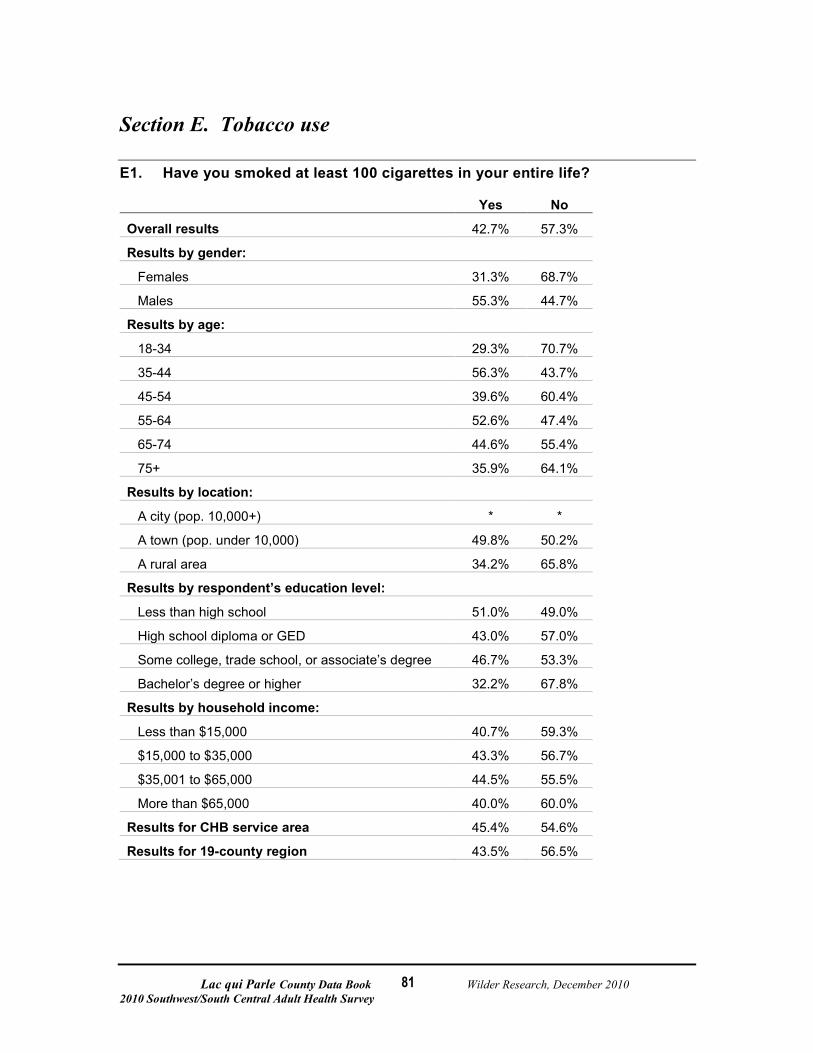
Lac qui Parle County Data Book Wilder Research, December 2010 2010 Southwest/South Central Adult Health Survey
81
Section E. Tobacco use
E1. Have you smoked at least 100 cigarettes in your entire life?
Yes No
Overall results 42.7% 57.3%
Results by gender:
Females 31.3% 68.7%
Males 55.3% 44.7%
Results by age:
18-34 29.3% 70.7%
35-44 56.3% 43.7%
45-54 39.6% 60.4%
55-64 52.6% 47.4%
65-74 44.6% 55.4%
75+ 35.9% 64.1%
Results by location:
A city (pop. 10,000+) * *
A town (pop. under 10,000) 49.8% 50.2%
A rural area 34.2% 65.8%
Results by respondent’s education level:
Less than high school 51.0% 49.0%
High school diploma or GED 43.0% 57.0%
Some college, trade school, or associate’s degree 46.7% 53.3%
Bachelor’s degree or higher 32.2% 67.8%
Results by household income:
Less than $15,000 40.7% 59.3%
$15,000 to $35,000 43.3% 56.7%
$35,001 to $65,000 44.5% 55.5%
More than $65,000 40.0% 60.0%
Results for CHB service area 45.4% 54.6%
Results for 19-county region 43.5% 56.5%
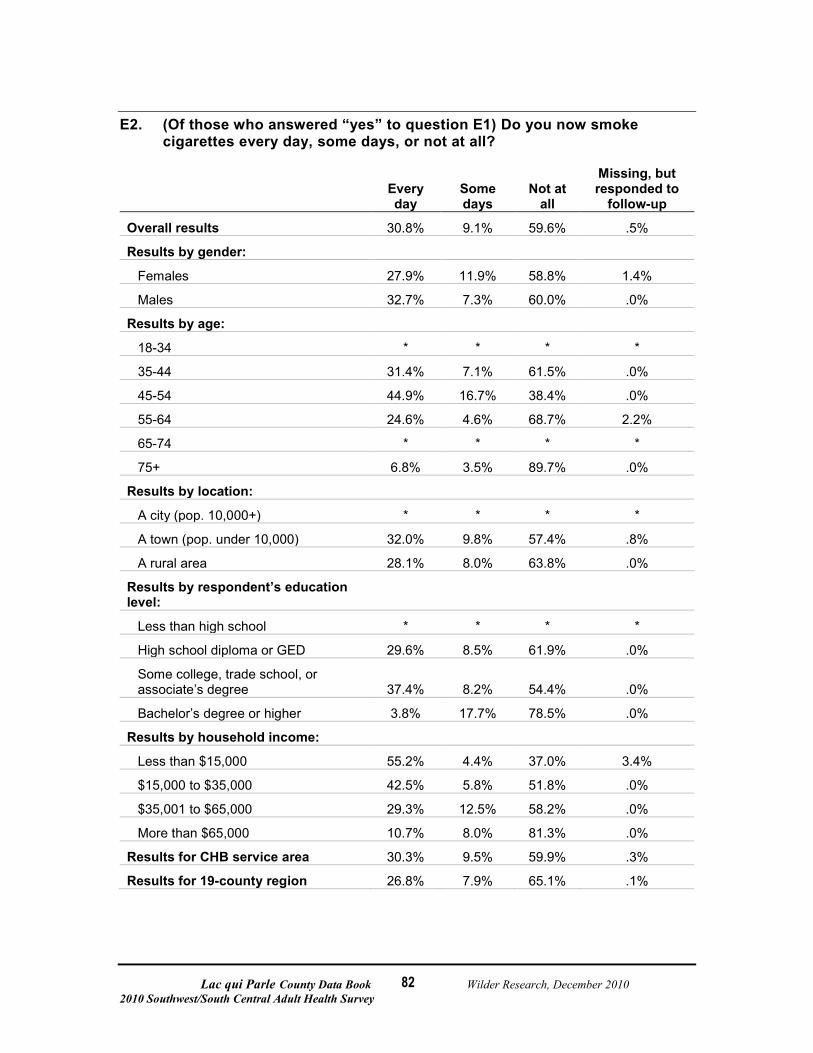
Lac qui Parle County Data Book Wilder Research, December 2010 2010 Southwest/South Central Adult Health Survey
82
E2. (Of those who answered “yes” to question E1) Do you now smoke cigarettes every day, some days, or not at all?
Every day
Some days
Not at all
Missing, but responded to
follow-up
Overall results 30.8% 9.1% 59.6% .5%
Results by gender:
Females 27.9% 11.9% 58.8% 1.4%
Males 32.7% 7.3% 60.0% .0%
Results by age:
18-34 * * * *
35-44 31.4% 7.1% 61.5% .0%
45-54 44.9% 16.7% 38.4% .0%
55-64 24.6% 4.6% 68.7% 2.2%
65-74 * * * *
75+ 6.8% 3.5% 89.7% .0%
Results by location:
A city (pop. 10,000+) * * * *
A town (pop. under 10,000) 32.0% 9.8% 57.4% .8%
A rural area 28.1% 8.0% 63.8% .0%
Results by respondent’s education level:
Less than high school * * * *
High school diploma or GED 29.6% 8.5% 61.9% .0%
Some college, trade school, or associate’s degree 37.4% 8.2% 54.4% .0%
Bachelor’s degree or higher 3.8% 17.7% 78.5% .0%
Results by household income:
Less than $15,000 55.2% 4.4% 37.0% 3.4%
$15,000 to $35,000 42.5% 5.8% 51.8% .0%
$35,001 to $65,000 29.3% 12.5% 58.2% .0%
More than $65,000 10.7% 8.0% 81.3% .0%
Results for CHB service area 30.3% 9.5% 59.9% .3%
Results for 19-county region 26.8% 7.9% 65.1% .1%

Lac qui Parle County Data Book Wilder Research, December 2010 2010 Southwest/South Central Adult Health Survey
83
Calc5. Calculated smoking status based on response to questions E1 and E2
Current smoker
Former smoker
Never smoked
Overall results 17.0% 25.3% 57.7%
Results by gender:
Females 12.5% 18.5% 69.0%
Males 21.9% 32.9% 45.2%
Results by age:
18-34 24.6% 4.7% 70.7%
35-44 21.7% 34.6% 43.7%
45-54 23.8% 14.8% 61.4%
55-64 15.5% 36.5% 48.0%
65-74 10.6% 34.0% 55.4%
75+ 3.7% 31.8% 64.6%
Results by location:
A city (pop. 10,000+) * * *
A town (pop. under 10,000) 20.7% 28.5% 50.8%
A rural area 12.4% 21.8% 65.8%
Results by respondent’s education level:
Less than high school 24.1% 21.4% 54.5%
High school diploma or GED 16.4% 26.6% 57.0%
Some college, trade school, or associate’s degree 21.3% 25.4% 53.3%
Bachelor’s degree or higher 6.9% 25.3% 67.8%
Results by household income:
Less than $15,000 24.6% 15.3% 60.1%
$15,000 to $35,000 20.4% 21.9% 57.6%
$35,001 to $65,000 18.5% 25.8% 55.8%
More than $65,000 7.5% 32.5% 60.0%
Results for CHB service area 18.1% 27.2% 54.7%
Results for 19-county region 15.1% 28.3% 56.6%
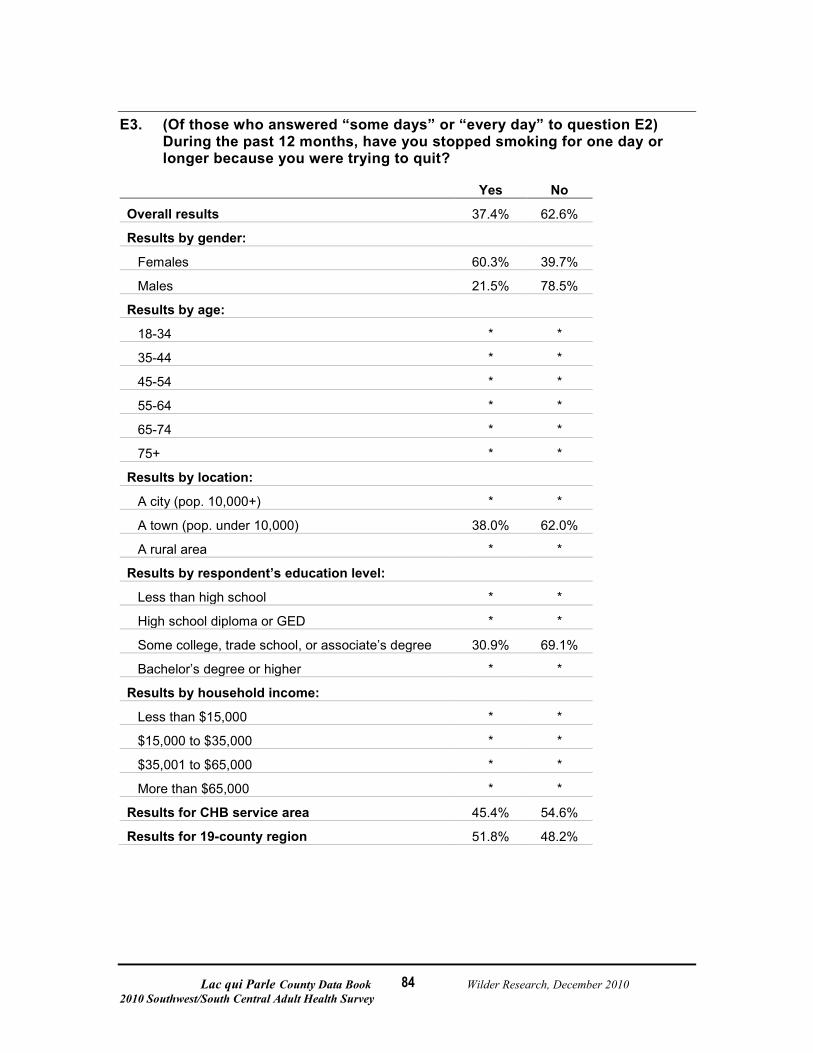
Lac qui Parle County Data Book Wilder Research, December 2010 2010 Southwest/South Central Adult Health Survey
84
E3. (Of those who answered “some days” or “every day” to question E2) During the past 12 months, have you stopped smoking for one day or longer because you were trying to quit?
Yes No
Overall results 37.4% 62.6%
Results by gender:
Females 60.3% 39.7%
Males 21.5% 78.5%
Results by age:
18-34 * *
35-44 * *
45-54 * *
55-64 * *
65-74 * *
75+ * *
Results by location:
A city (pop. 10,000+) * *
A town (pop. under 10,000) 38.0% 62.0%
A rural area * *
Results by respondent’s education level:
Less than high school * *
High school diploma or GED * *
Some college, trade school, or associate’s degree 30.9% 69.1%
Bachelor’s degree or higher * *
Results by household income:
Less than $15,000 * *
$15,000 to $35,000 * *
$35,001 to $65,000 * *
More than $65,000 * *
Results for CHB service area 45.4% 54.6%
Results for 19-county region 51.8% 48.2%
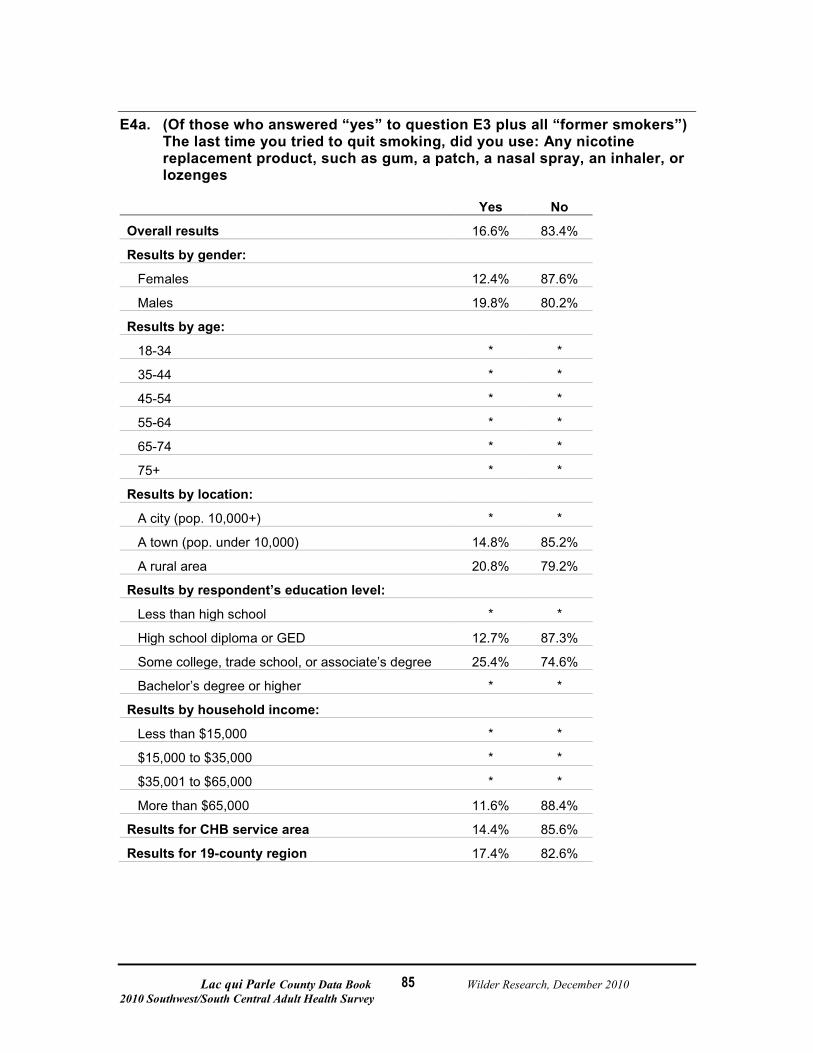
Lac qui Parle County Data Book Wilder Research, December 2010 2010 Southwest/South Central Adult Health Survey
85
E4a. (Of those who answered “yes” to question E3 plus all “former smokers”) The last time you tried to quit smoking, did you use: Any nicotine replacement product, such as gum, a patch, a nasal spray, an inhaler, or lozenges
Yes No
Overall results 16.6% 83.4%
Results by gender:
Females 12.4% 87.6%
Males 19.8% 80.2%
Results by age:
18-34 * *
35-44 * *
45-54 * *
55-64 * *
65-74 * *
75+ * *
Results by location:
A city (pop. 10,000+) * *
A town (pop. under 10,000) 14.8% 85.2%
A rural area 20.8% 79.2%
Results by respondent’s education level:
Less than high school * *
High school diploma or GED 12.7% 87.3%
Some college, trade school, or associate’s degree 25.4% 74.6%
Bachelor’s degree or higher * *
Results by household income:
Less than $15,000 * *
$15,000 to $35,000 * *
$35,001 to $65,000 * *
More than $65,000 11.6% 88.4%
Results for CHB service area 14.4% 85.6%
Results for 19-county region 17.4% 82.6%
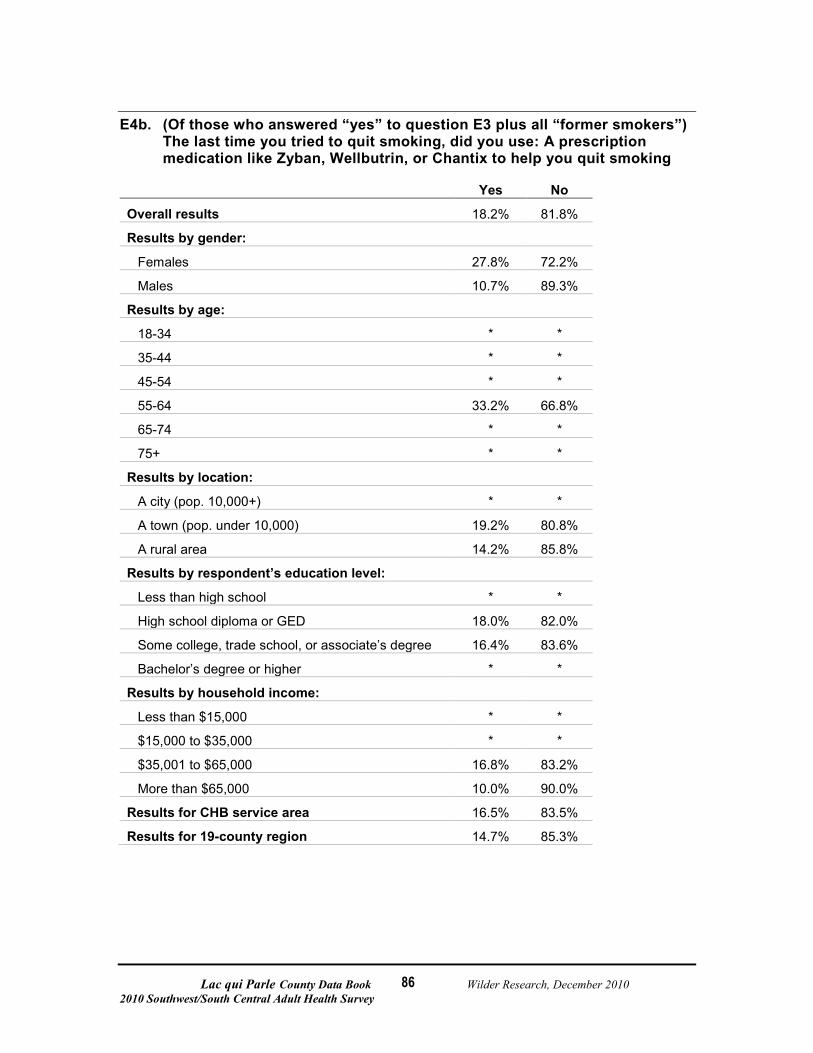
Lac qui Parle County Data Book Wilder Research, December 2010 2010 Southwest/South Central Adult Health Survey
86
E4b. (Of those who answered “yes” to question E3 plus all “former smokers”) The last time you tried to quit smoking, did you use: A prescription medication like Zyban, Wellbutrin, or Chantix to help you quit smoking
Yes No
Overall results 18.2% 81.8%
Results by gender:
Females 27.8% 72.2%
Males 10.7% 89.3%
Results by age:
18-34 * *
35-44 * *
45-54 * *
55-64 33.2% 66.8%
65-74 * *
75+ * *
Results by location:
A city (pop. 10,000+) * *
A town (pop. under 10,000) 19.2% 80.8%
A rural area 14.2% 85.8%
Results by respondent’s education level:
Less than high school * *
High school diploma or GED 18.0% 82.0%
Some college, trade school, or associate’s degree 16.4% 83.6%
Bachelor’s degree or higher * *
Results by household income:
Less than $15,000 * *
$15,000 to $35,000 * *
$35,001 to $65,000 16.8% 83.2%
More than $65,000 10.0% 90.0%
Results for CHB service area 16.5% 83.5%
Results for 19-county region 14.7% 85.3%
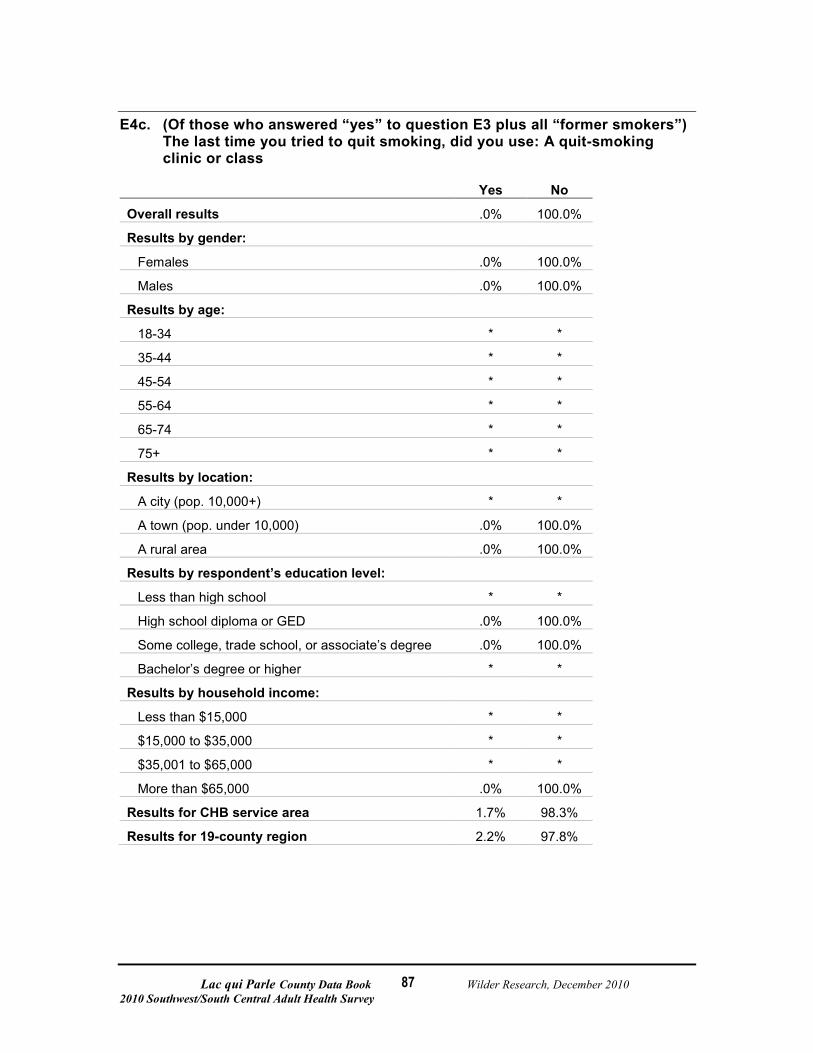
Lac qui Parle County Data Book Wilder Research, December 2010 2010 Southwest/South Central Adult Health Survey
87
E4c. (Of those who answered “yes” to question E3 plus all “former smokers”) The last time you tried to quit smoking, did you use: A quit-smoking clinic or class
Yes No
Overall results .0% 100.0%
Results by gender:
Females .0% 100.0%
Males .0% 100.0%
Results by age:
18-34 * *
35-44 * *
45-54 * *
55-64 * *
65-74 * *
75+ * *
Results by location:
A city (pop. 10,000+) * *
A town (pop. under 10,000) .0% 100.0%
A rural area .0% 100.0%
Results by respondent’s education level:
Less than high school * *
High school diploma or GED .0% 100.0%
Some college, trade school, or associate’s degree .0% 100.0%
Bachelor’s degree or higher * *
Results by household income:
Less than $15,000 * *
$15,000 to $35,000 * *
$35,001 to $65,000 * *
More than $65,000 .0% 100.0%
Results for CHB service area 1.7% 98.3%
Results for 19-county region 2.2% 97.8%

Lac qui Parle County Data Book Wilder Research, December 2010 2010 Southwest/South Central Adult Health Survey
88
E4d. (Of those who answered “yes” to question E3 plus all “former smokers”) The last time you tried to quit smoking, did you use: A quit-smoking telephone help line
Yes No
Overall results .4% 99.6%
Results by gender:
Females .8% 99.2%
Males .0% 100.0%
Results by age:
18-34 * *
35-44 * *
45-54 * *
55-64 * *
65-74 * *
75+ * *
Results by location:
A city (pop. 10,000+) * *
A town (pop. under 10,000) .5% 99.5%
A rural area .0% 100.0%
Results by respondent’s education level:
Less than high school * *
High school diploma or GED 1.1% 98.9%
Some college, trade school, or associate’s degree .0% 100.0%
Bachelor’s degree or higher * *
Results by household income:
Less than $15,000 * *
$15,000 to $35,000 * *
$35,001 to $65,000 * *
More than $65,000 .4% 99.6%
Results for CHB service area 1.9% 98.1%
Results for 19-county region 2.3% 97.7%
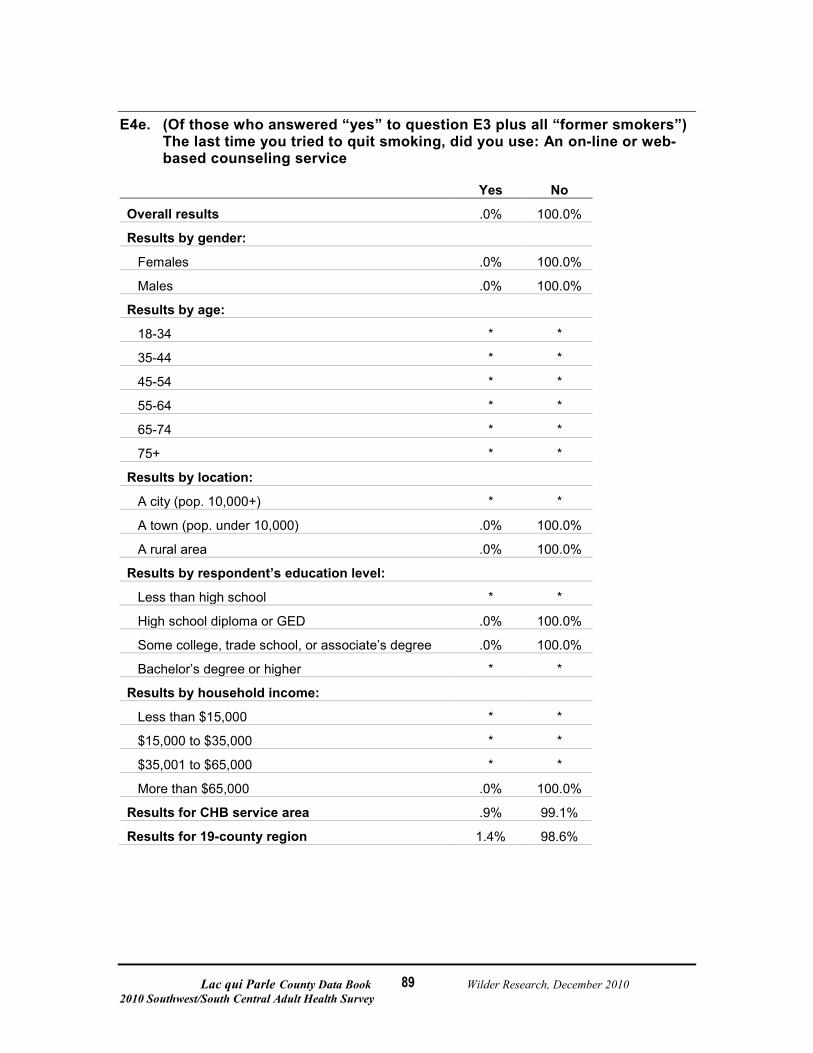
Lac qui Parle County Data Book Wilder Research, December 2010 2010 Southwest/South Central Adult Health Survey
89
E4e. (Of those who answered “yes” to question E3 plus all “former smokers”) The last time you tried to quit smoking, did you use: An on-line or web-based counseling service
Yes No
Overall results .0% 100.0%
Results by gender:
Females .0% 100.0%
Males .0% 100.0%
Results by age:
18-34 * *
35-44 * *
45-54 * *
55-64 * *
65-74 * *
75+ * *
Results by location:
A city (pop. 10,000+) * *
A town (pop. under 10,000) .0% 100.0%
A rural area .0% 100.0%
Results by respondent’s education level:
Less than high school * *
High school diploma or GED .0% 100.0%
Some college, trade school, or associate’s degree .0% 100.0%
Bachelor’s degree or higher * *
Results by household income:
Less than $15,000 * *
$15,000 to $35,000 * *
$35,001 to $65,000 * *
More than $65,000 .0% 100.0%
Results for CHB service area .9% 99.1%
Results for 19-county region 1.4% 98.6%
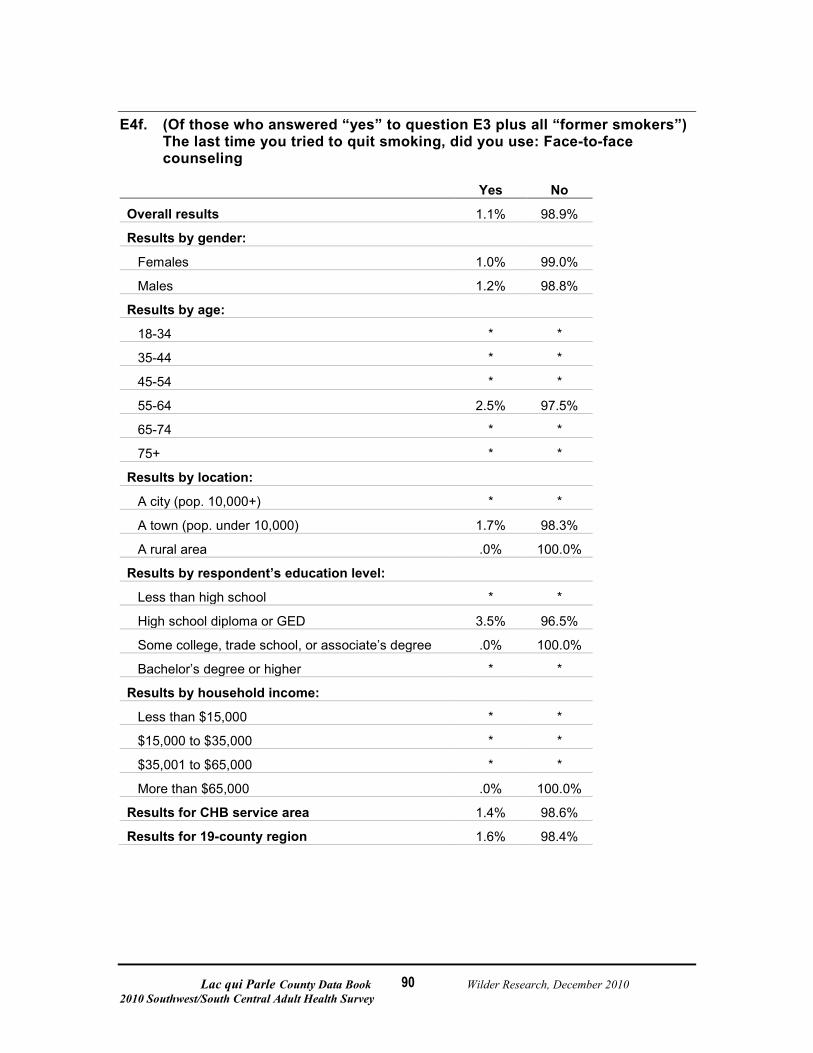
Lac qui Parle County Data Book Wilder Research, December 2010 2010 Southwest/South Central Adult Health Survey
90
E4f. (Of those who answered “yes” to question E3 plus all “former smokers”) The last time you tried to quit smoking, did you use: Face-to-face counseling
Yes No
Overall results 1.1% 98.9%
Results by gender:
Females 1.0% 99.0%
Males 1.2% 98.8%
Results by age:
18-34 * *
35-44 * *
45-54 * *
55-64 2.5% 97.5%
65-74 * *
75+ * *
Results by location:
A city (pop. 10,000+) * *
A town (pop. under 10,000) 1.7% 98.3%
A rural area .0% 100.0%
Results by respondent’s education level:
Less than high school * *
High school diploma or GED 3.5% 96.5%
Some college, trade school, or associate’s degree .0% 100.0%
Bachelor’s degree or higher * *
Results by household income:
Less than $15,000 * *
$15,000 to $35,000 * *
$35,001 to $65,000 * *
More than $65,000 .0% 100.0%
Results for CHB service area 1.4% 98.6%
Results for 19-county region 1.6% 98.4%
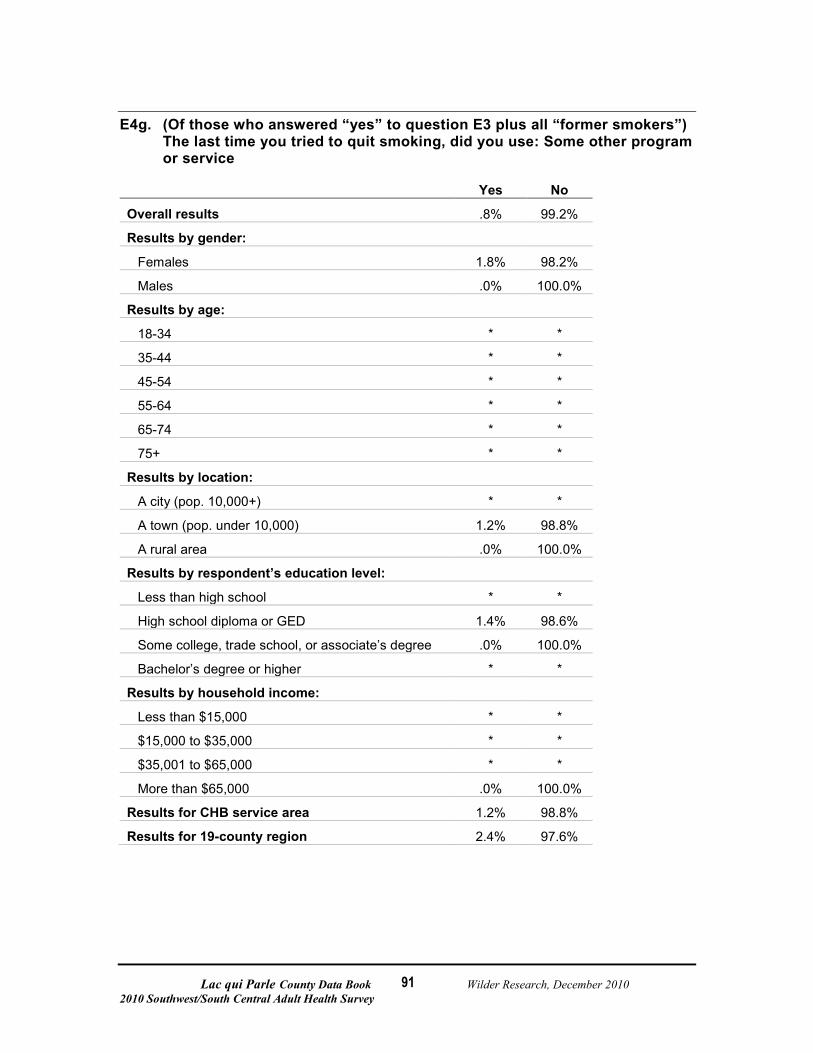
Lac qui Parle County Data Book Wilder Research, December 2010 2010 Southwest/South Central Adult Health Survey
91
E4g. (Of those who answered “yes” to question E3 plus all “former smokers”) The last time you tried to quit smoking, did you use: Some other program or service
Yes No
Overall results .8% 99.2%
Results by gender:
Females 1.8% 98.2%
Males .0% 100.0%
Results by age:
18-34 * *
35-44 * *
45-54 * *
55-64 * *
65-74 * *
75+ * *
Results by location:
A city (pop. 10,000+) * *
A town (pop. under 10,000) 1.2% 98.8%
A rural area .0% 100.0%
Results by respondent’s education level:
Less than high school * *
High school diploma or GED 1.4% 98.6%
Some college, trade school, or associate’s degree .0% 100.0%
Bachelor’s degree or higher * *
Results by household income:
Less than $15,000 * *
$15,000 to $35,000 * *
$35,001 to $65,000 * *
More than $65,000 .0% 100.0%
Results for CHB service area 1.2% 98.8%
Results for 19-county region 2.4% 97.6%
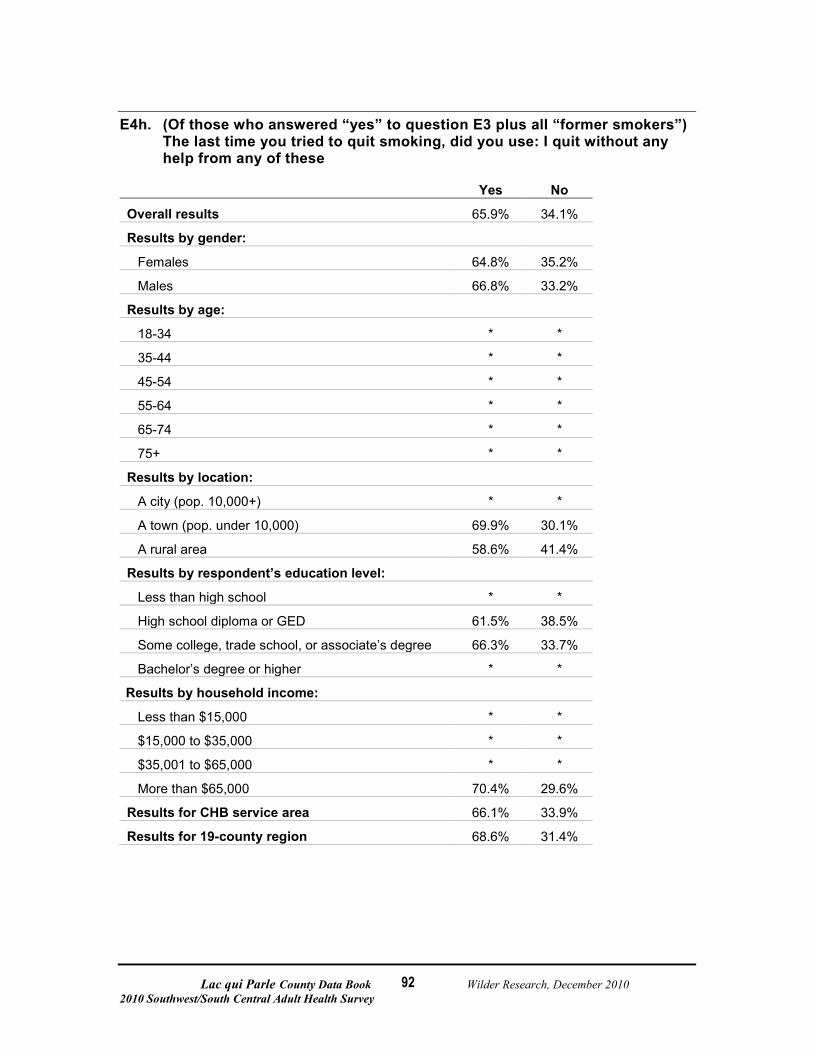
Lac qui Parle County Data Book Wilder Research, December 2010 2010 Southwest/South Central Adult Health Survey
92
E4h. (Of those who answered “yes” to question E3 plus all “former smokers”) The last time you tried to quit smoking, did you use: I quit without any help from any of these
Yes No
Overall results 65.9% 34.1%
Results by gender:
Females 64.8% 35.2%
Males 66.8% 33.2%
Results by age:
18-34 * *
35-44 * *
45-54 * *
55-64 * *
65-74 * *
75+ * *
Results by location:
A city (pop. 10,000+) * *
A town (pop. under 10,000) 69.9% 30.1%
A rural area 58.6% 41.4%
Results by respondent’s education level:
Less than high school * *
High school diploma or GED 61.5% 38.5%
Some college, trade school, or associate’s degree 66.3% 33.7%
Bachelor’s degree or higher * *
Results by household income:
Less than $15,000 * *
$15,000 to $35,000 * *
$35,001 to $65,000 * *
More than $65,000 70.4% 29.6%
Results for CHB service area 66.1% 33.9%
Results for 19-county region 68.6% 31.4%
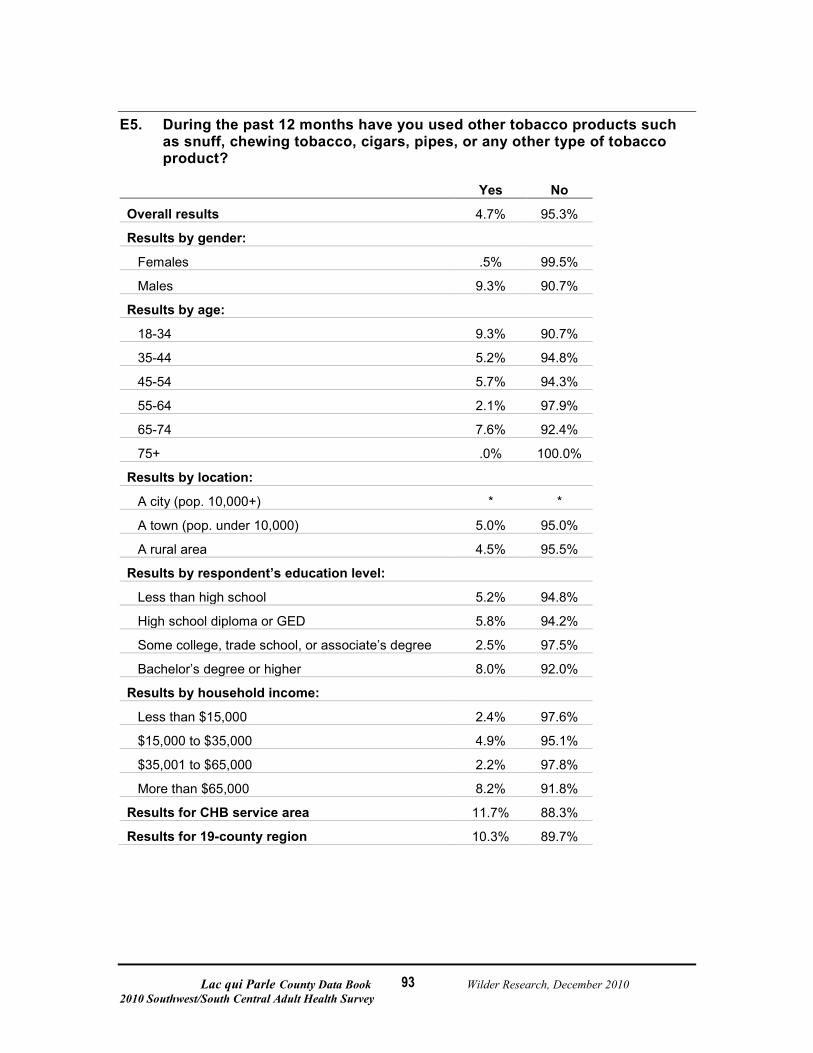
Lac qui Parle County Data Book Wilder Research, December 2010 2010 Southwest/South Central Adult Health Survey
93
E5. During the past 12 months have you used other tobacco products such as snuff, chewing tobacco, cigars, pipes, or any other type of tobacco product?
Yes No
Overall results 4.7% 95.3%
Results by gender:
Females .5% 99.5%
Males 9.3% 90.7%
Results by age:
18-34 9.3% 90.7%
35-44 5.2% 94.8%
45-54 5.7% 94.3%
55-64 2.1% 97.9%
65-74 7.6% 92.4%
75+ .0% 100.0%
Results by location:
A city (pop. 10,000+) * *
A town (pop. under 10,000) 5.0% 95.0%
A rural area 4.5% 95.5%
Results by respondent’s education level:
Less than high school 5.2% 94.8%
High school diploma or GED 5.8% 94.2%
Some college, trade school, or associate’s degree 2.5% 97.5%
Bachelor’s degree or higher 8.0% 92.0%
Results by household income:
Less than $15,000 2.4% 97.6%
$15,000 to $35,000 4.9% 95.1%
$35,001 to $65,000 2.2% 97.8%
More than $65,000 8.2% 91.8%
Results for CHB service area 11.7% 88.3%
Results for 19-county region 10.3% 89.7%
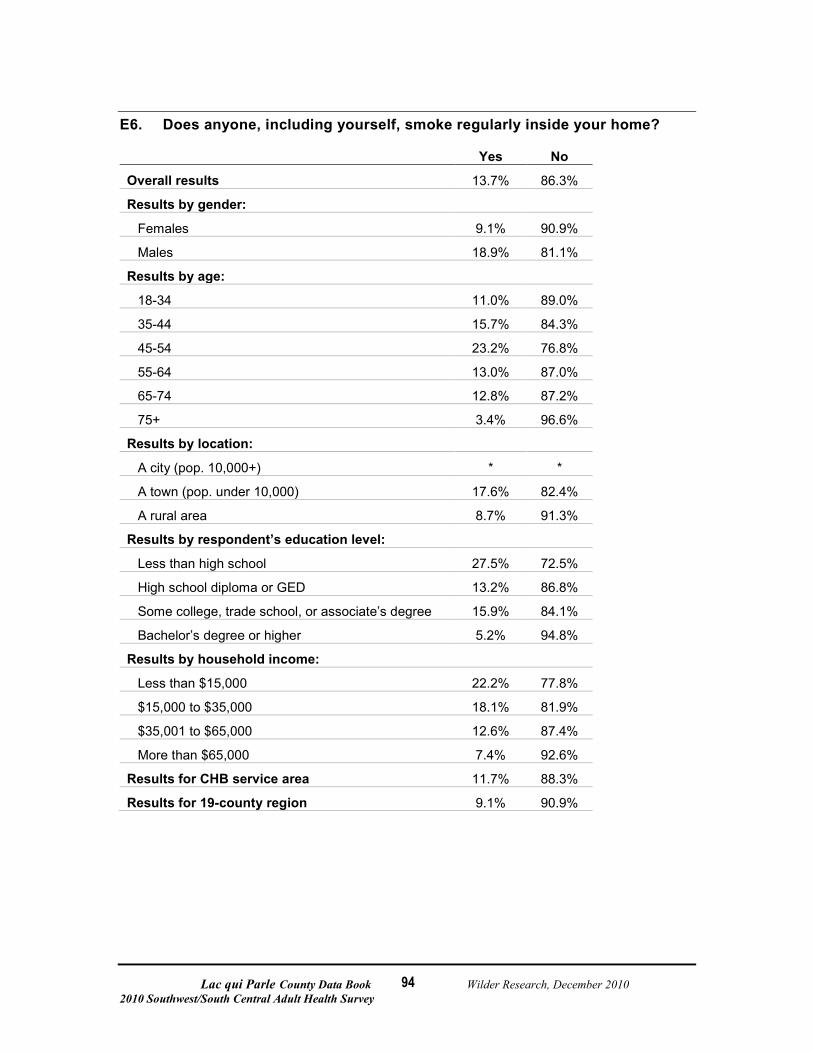
Lac qui Parle County Data Book Wilder Research, December 2010 2010 Southwest/South Central Adult Health Survey
94
E6. Does anyone, including yourself, smoke regularly inside your home?
Yes No
Overall results 13.7% 86.3%
Results by gender:
Females 9.1% 90.9%
Males 18.9% 81.1%
Results by age:
18-34 11.0% 89.0%
35-44 15.7% 84.3%
45-54 23.2% 76.8%
55-64 13.0% 87.0%
65-74 12.8% 87.2%
75+ 3.4% 96.6%
Results by location:
A city (pop. 10,000+) * *
A town (pop. under 10,000) 17.6% 82.4%
A rural area 8.7% 91.3%
Results by respondent’s education level:
Less than high school 27.5% 72.5%
High school diploma or GED 13.2% 86.8%
Some college, trade school, or associate’s degree 15.9% 84.1%
Bachelor’s degree or higher 5.2% 94.8%
Results by household income:
Less than $15,000 22.2% 77.8%
$15,000 to $35,000 18.1% 81.9%
$35,001 to $65,000 12.6% 87.4%
More than $65,000 7.4% 92.6%
Results for CHB service area 11.7% 88.3%
Results for 19-county region 9.1% 90.9%
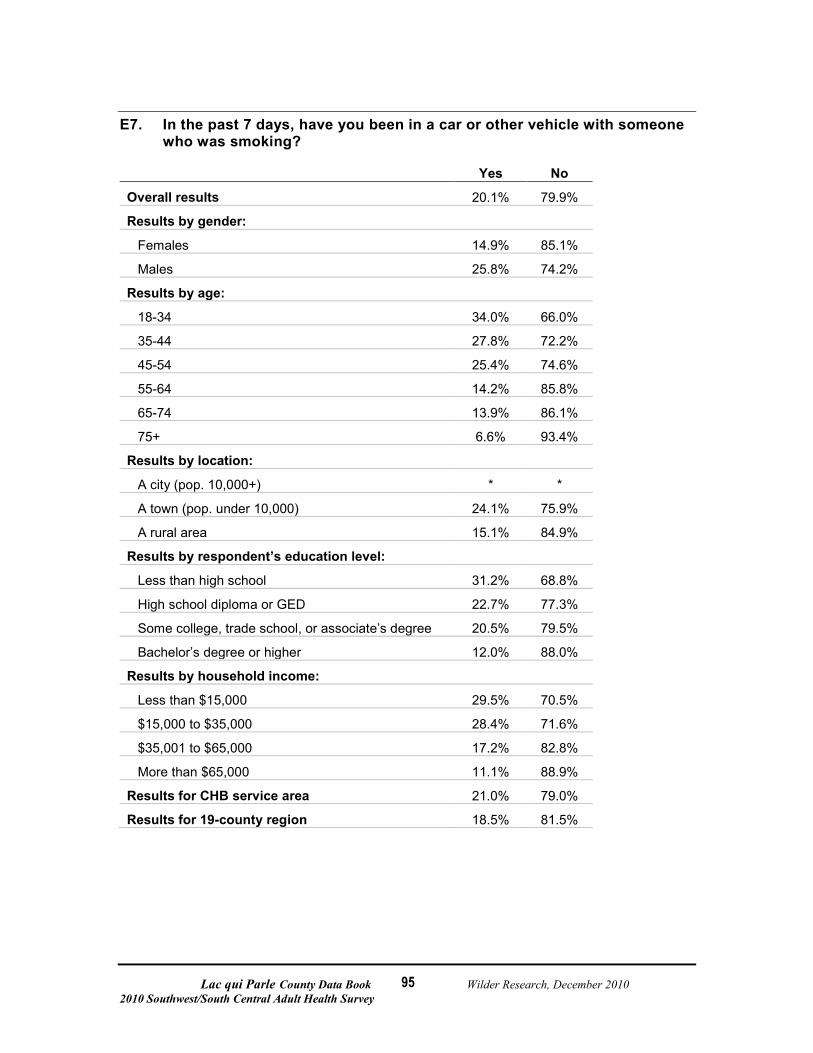
Lac qui Parle County Data Book Wilder Research, December 2010 2010 Southwest/South Central Adult Health Survey
95
E7. In the past 7 days, have you been in a car or other vehicle with someone who was smoking?
Yes No
Overall results 20.1% 79.9%
Results by gender:
Females 14.9% 85.1%
Males 25.8% 74.2%
Results by age:
18-34 34.0% 66.0%
35-44 27.8% 72.2%
45-54 25.4% 74.6%
55-64 14.2% 85.8%
65-74 13.9% 86.1%
75+ 6.6% 93.4%
Results by location:
A city (pop. 10,000+) * *
A town (pop. under 10,000) 24.1% 75.9%
A rural area 15.1% 84.9%
Results by respondent’s education level:
Less than high school 31.2% 68.8%
High school diploma or GED 22.7% 77.3%
Some college, trade school, or associate’s degree 20.5% 79.5%
Bachelor’s degree or higher 12.0% 88.0%
Results by household income:
Less than $15,000 29.5% 70.5%
$15,000 to $35,000 28.4% 71.6%
$35,001 to $65,000 17.2% 82.8%
More than $65,000 11.1% 88.9%
Results for CHB service area 21.0% 79.0%
Results for 19-county region 18.5% 81.5%
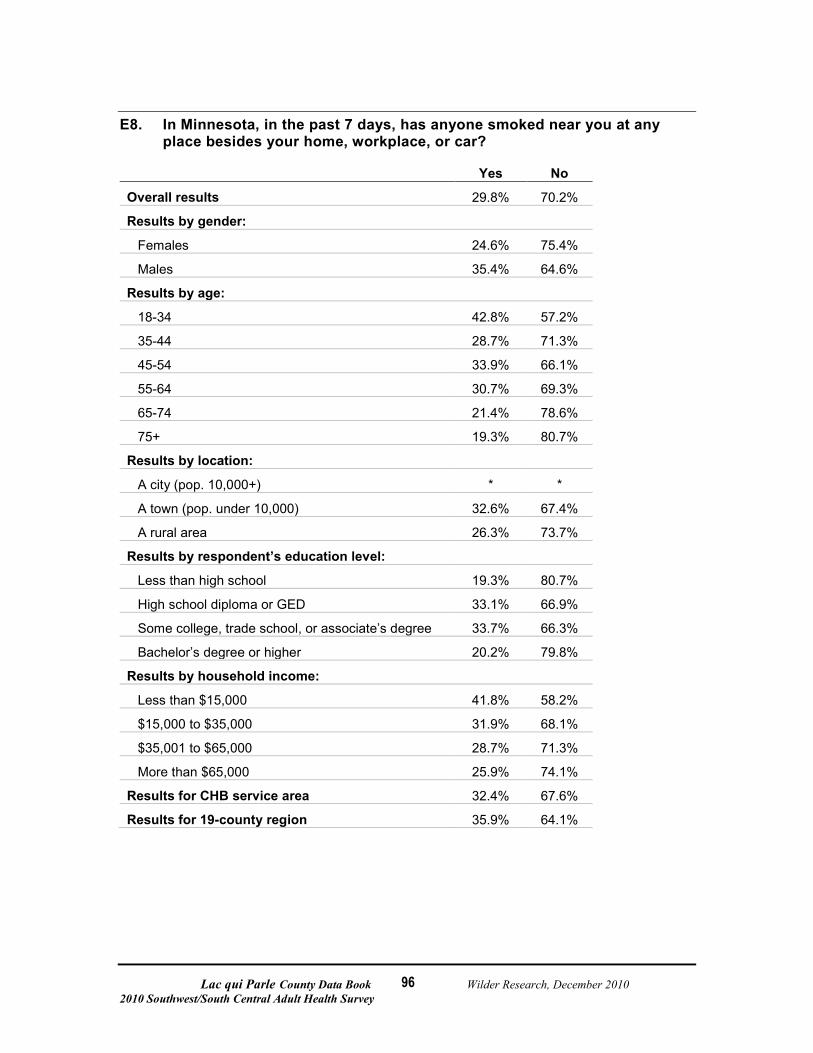
Lac qui Parle County Data Book Wilder Research, December 2010 2010 Southwest/South Central Adult Health Survey
96
E8. In Minnesota, in the past 7 days, has anyone smoked near you at any place besides your home, workplace, or car?
Yes No
Overall results 29.8% 70.2%
Results by gender:
Females 24.6% 75.4%
Males 35.4% 64.6%
Results by age:
18-34 42.8% 57.2%
35-44 28.7% 71.3%
45-54 33.9% 66.1%
55-64 30.7% 69.3%
65-74 21.4% 78.6%
75+ 19.3% 80.7%
Results by location:
A city (pop. 10,000+) * *
A town (pop. under 10,000) 32.6% 67.4%
A rural area 26.3% 73.7%
Results by respondent’s education level:
Less than high school 19.3% 80.7%
High school diploma or GED 33.1% 66.9%
Some college, trade school, or associate’s degree 33.7% 66.3%
Bachelor’s degree or higher 20.2% 79.8%
Results by household income:
Less than $15,000 41.8% 58.2%
$15,000 to $35,000 31.9% 68.1%
$35,001 to $65,000 28.7% 71.3%
More than $65,000 25.9% 74.1%
Results for CHB service area 32.4% 67.6%
Results for 19-county region 35.9% 64.1%
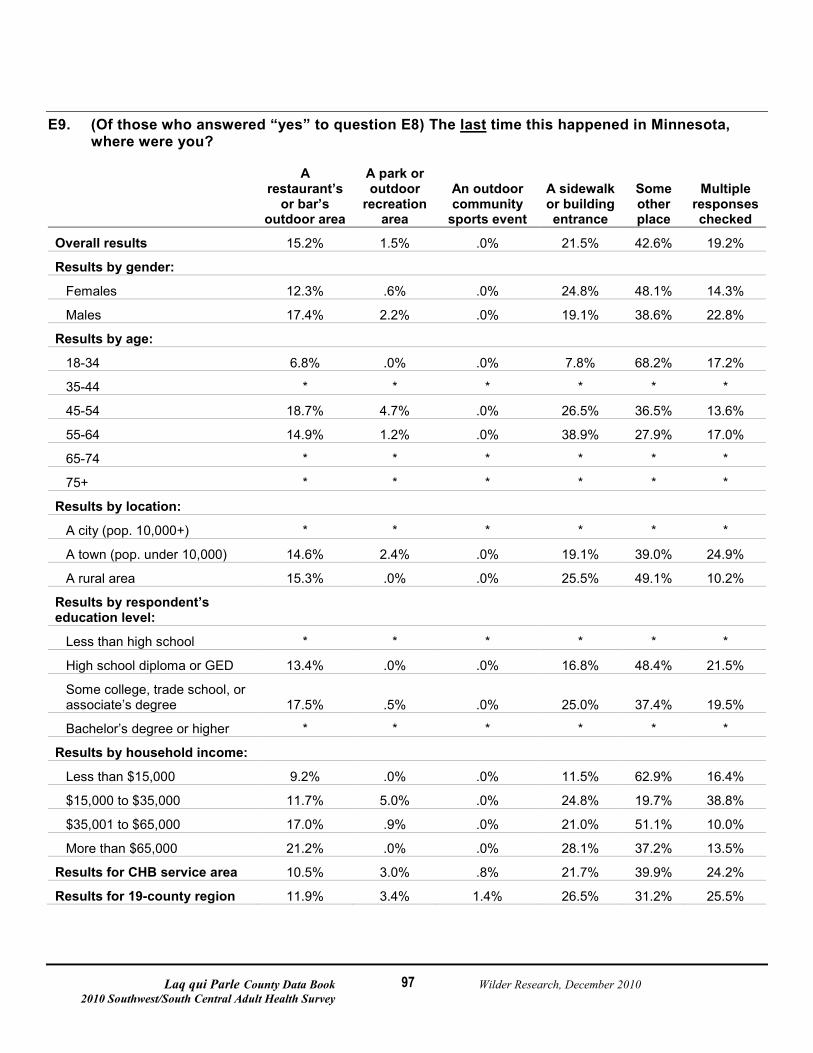
Laq qui Parle County Data Book Wilder Research, December 2010 2010 Southwest/South Central Adult Health Survey
97
E9. (Of those who answered “yes” to question E8) The last
time this happened in Minnesota, where were you?
A restaurant’s
or bar’s outdoor area
A park or outdoor
recreation area
An outdoor community
sports event
A sidewalk or building entrance
Some other place
Multiple responses checked
Overall results 15.2% 1.5% .0% 21.5% 42.6% 19.2%
Results by gender:
Females 12.3% .6% .0% 24.8% 48.1% 14.3%
Males 17.4% 2.2% .0% 19.1% 38.6% 22.8%
Results by age:
18-34 6.8% .0% .0% 7.8% 68.2% 17.2%
35-44 * * * * * *
45-54 18.7% 4.7% .0% 26.5% 36.5% 13.6%
55-64 14.9% 1.2% .0% 38.9% 27.9% 17.0%
65-74 * * * * * *
75+ * * * * * *
Results by location:
A city (pop. 10,000+) * * * * * *
A town (pop. under 10,000) 14.6% 2.4% .0% 19.1% 39.0% 24.9%
A rural area 15.3% .0% .0% 25.5% 49.1% 10.2%
Results by respondent’s education level:
Less than high school * * * * * *
High school diploma or GED 13.4% .0% .0% 16.8% 48.4% 21.5%
Some college, trade school, or associate’s degree 17.5% .5% .0% 25.0% 37.4% 19.5%
Bachelor’s degree or higher * * * * * *
Results by household income:
Less than $15,000 9.2% .0% .0% 11.5% 62.9% 16.4%
$15,000 to $35,000 11.7% 5.0% .0% 24.8% 19.7% 38.8%
$35,001 to $65,000 17.0% .9% .0% 21.0% 51.1% 10.0%
More than $65,000 21.2% .0% .0% 28.1% 37.2% 13.5%
Results for CHB service area 10.5% 3.0% .8% 21.7% 39.9% 24.2%
Results for 19-county region 11.9% 3.4% 1.4% 26.5% 31.2% 25.5%
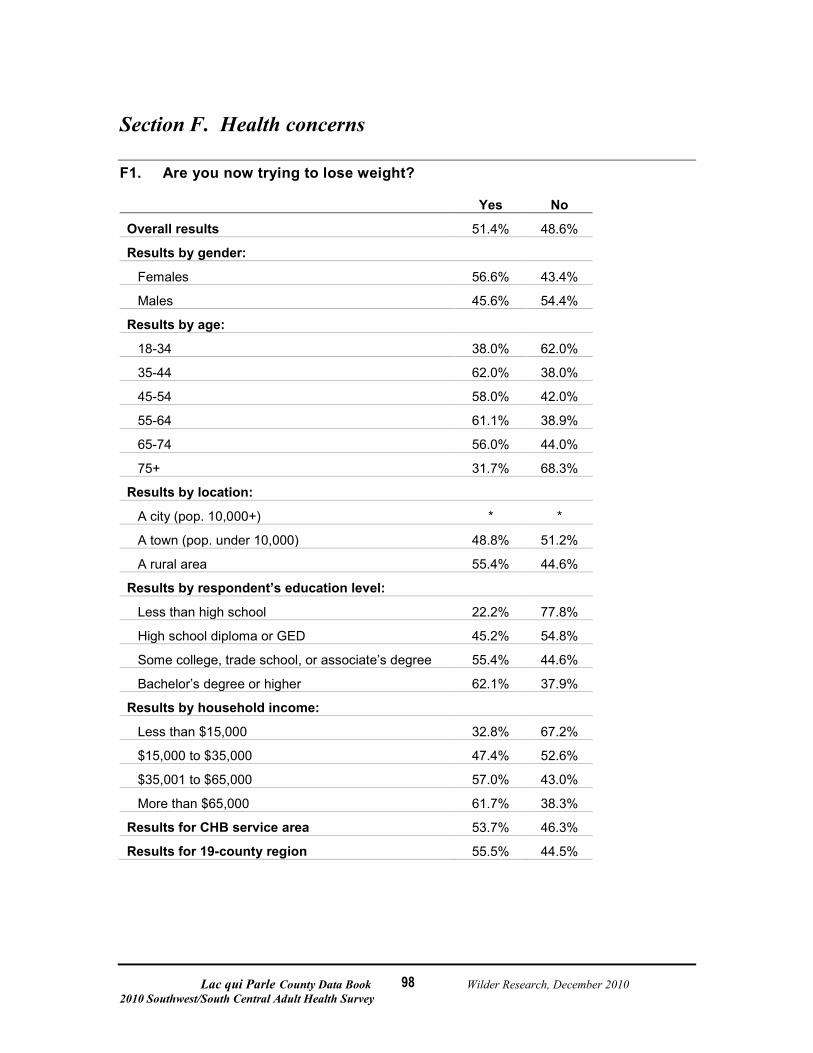
Lac qui Parle County Data Book Wilder Research, December 2010 2010 Southwest/South Central Adult Health Survey
98
Section F. Health concerns
F1. Are you now trying to lose weight?
Yes No
Overall results 51.4% 48.6%
Results by gender:
Females 56.6% 43.4%
Males 45.6% 54.4%
Results by age:
18-34 38.0% 62.0%
35-44 62.0% 38.0%
45-54 58.0% 42.0%
55-64 61.1% 38.9%
65-74 56.0% 44.0%
75+ 31.7% 68.3%
Results by location:
A city (pop. 10,000+) * *
A town (pop. under 10,000) 48.8% 51.2%
A rural area 55.4% 44.6%
Results by respondent’s education level:
Less than high school 22.2% 77.8%
High school diploma or GED 45.2% 54.8%
Some college, trade school, or associate’s degree 55.4% 44.6%
Bachelor’s degree or higher 62.1% 37.9%
Results by household income:
Less than $15,000 32.8% 67.2%
$15,000 to $35,000 47.4% 52.6%
$35,001 to $65,000 57.0% 43.0%
More than $65,000 61.7% 38.3%
Results for CHB service area 53.7% 46.3%
Results for 19-county region 55.5% 44.5%
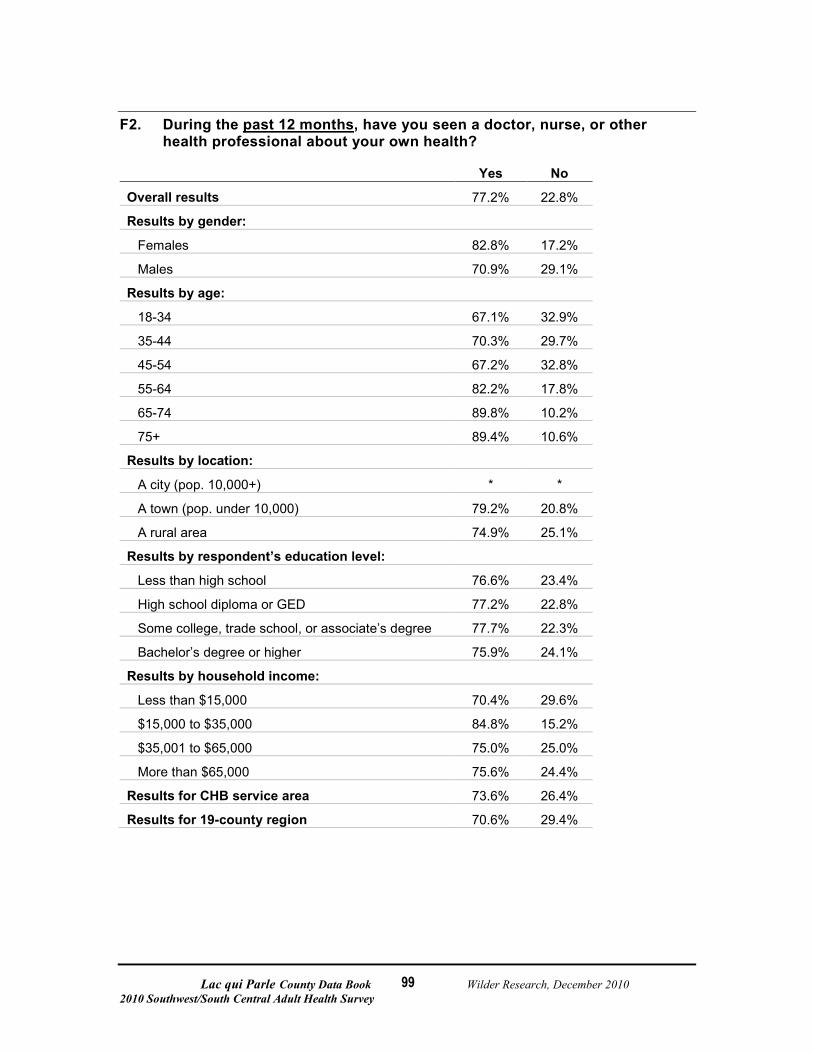
Lac qui Parle County Data Book Wilder Research, December 2010 2010 Southwest/South Central Adult Health Survey
99
F2. During the past 12 months
, have you seen a doctor, nurse, or other health professional about your own health?
Yes No
Overall results 77.2% 22.8%
Results by gender:
Females 82.8% 17.2%
Males 70.9% 29.1%
Results by age:
18-34 67.1% 32.9%
35-44 70.3% 29.7%
45-54 67.2% 32.8%
55-64 82.2% 17.8%
65-74 89.8% 10.2%
75+ 89.4% 10.6%
Results by location:
A city (pop. 10,000+) * *
A town (pop. under 10,000) 79.2% 20.8%
A rural area 74.9% 25.1%
Results by respondent’s education level:
Less than high school 76.6% 23.4%
High school diploma or GED 77.2% 22.8%
Some college, trade school, or associate’s degree 77.7% 22.3%
Bachelor’s degree or higher 75.9% 24.1%
Results by household income:
Less than $15,000 70.4% 29.6%
$15,000 to $35,000 84.8% 15.2%
$35,001 to $65,000 75.0% 25.0%
More than $65,000 75.6% 24.4%
Results for CHB service area 73.6% 26.4%
Results for 19-county region 70.6% 29.4%
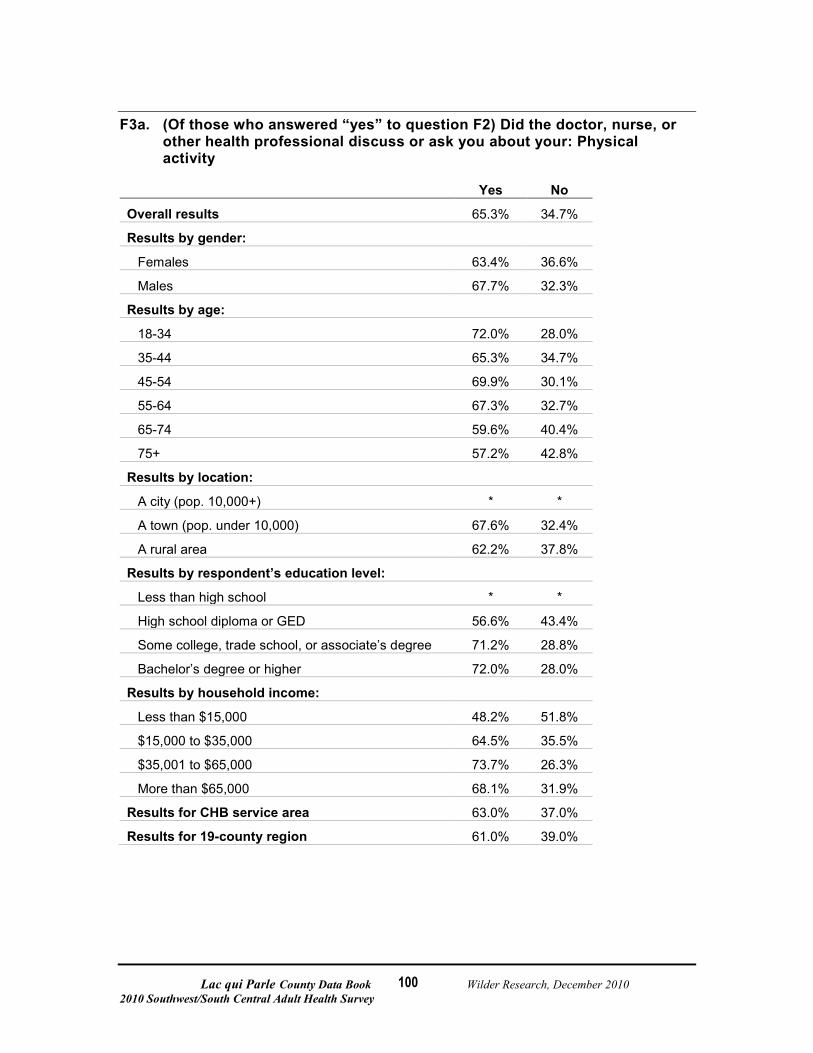
Lac qui Parle County Data Book Wilder Research, December 2010 2010 Southwest/South Central Adult Health Survey
100
F3a. (Of those who answered “yes” to question F2) Did the doctor, nurse, or other health professional discuss or ask you about your: Physical activity
Yes No
Overall results 65.3% 34.7%
Results by gender:
Females 63.4% 36.6%
Males 67.7% 32.3%
Results by age:
18-34 72.0% 28.0%
35-44 65.3% 34.7%
45-54 69.9% 30.1%
55-64 67.3% 32.7%
65-74 59.6% 40.4%
75+ 57.2% 42.8%
Results by location:
A city (pop. 10,000+) * *
A town (pop. under 10,000) 67.6% 32.4%
A rural area 62.2% 37.8%
Results by respondent’s education level:
Less than high school * *
High school diploma or GED 56.6% 43.4%
Some college, trade school, or associate’s degree 71.2% 28.8%
Bachelor’s degree or higher 72.0% 28.0%
Results by household income:
Less than $15,000 48.2% 51.8%
$15,000 to $35,000 64.5% 35.5%
$35,001 to $65,000 73.7% 26.3%
More than $65,000 68.1% 31.9%
Results for CHB service area 63.0% 37.0%
Results for 19-county region 61.0% 39.0%
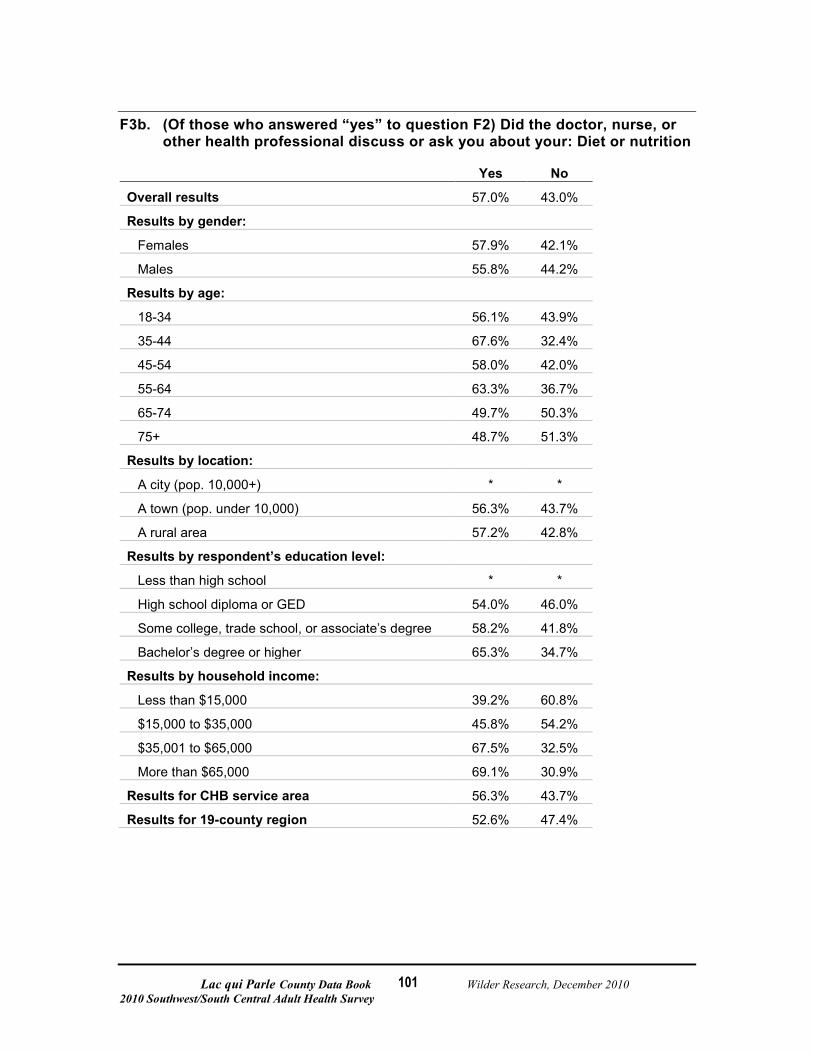
Lac qui Parle County Data Book Wilder Research, December 2010 2010 Southwest/South Central Adult Health Survey
101
F3b. (Of those who answered “yes” to question F2) Did the doctor, nurse, or other health professional discuss or ask you about your: Diet or nutrition
Yes No
Overall results 57.0% 43.0%
Results by gender:
Females 57.9% 42.1%
Males 55.8% 44.2%
Results by age:
18-34 56.1% 43.9%
35-44 67.6% 32.4%
45-54 58.0% 42.0%
55-64 63.3% 36.7%
65-74 49.7% 50.3%
75+ 48.7% 51.3%
Results by location:
A city (pop. 10,000+) * *
A town (pop. under 10,000) 56.3% 43.7%
A rural area 57.2% 42.8%
Results by respondent’s education level:
Less than high school * *
High school diploma or GED 54.0% 46.0%
Some college, trade school, or associate’s degree 58.2% 41.8%
Bachelor’s degree or higher 65.3% 34.7%
Results by household income:
Less than $15,000 39.2% 60.8%
$15,000 to $35,000 45.8% 54.2%
$35,001 to $65,000 67.5% 32.5%
More than $65,000 69.1% 30.9%
Results for CHB service area 56.3% 43.7%
Results for 19-county region 52.6% 47.4%
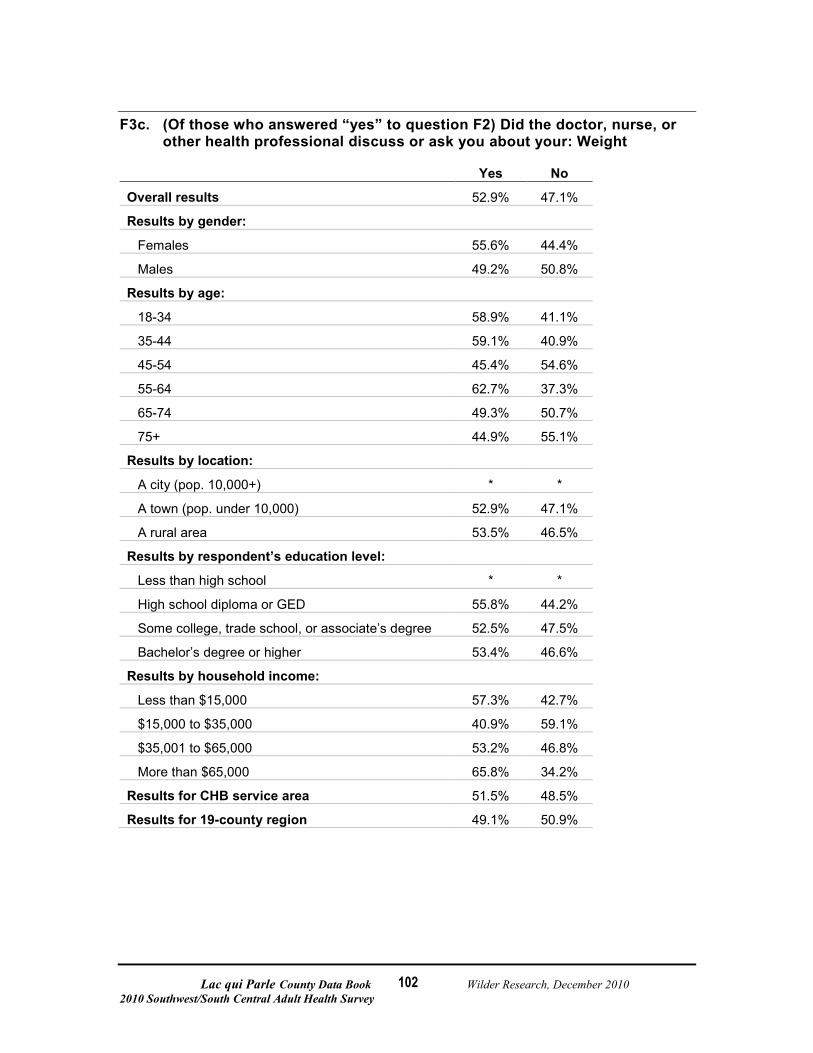
Lac qui Parle County Data Book Wilder Research, December 2010 2010 Southwest/South Central Adult Health Survey
102
F3c. (Of those who answered “yes” to question F2) Did the doctor, nurse, or other health professional discuss or ask you about your: Weight
Yes No
Overall results 52.9% 47.1%
Results by gender:
Females 55.6% 44.4%
Males 49.2% 50.8%
Results by age:
18-34 58.9% 41.1%
35-44 59.1% 40.9%
45-54 45.4% 54.6%
55-64 62.7% 37.3%
65-74 49.3% 50.7%
75+ 44.9% 55.1%
Results by location:
A city (pop. 10,000+) * *
A town (pop. under 10,000) 52.9% 47.1%
A rural area 53.5% 46.5%
Results by respondent’s education level:
Less than high school * *
High school diploma or GED 55.8% 44.2%
Some college, trade school, or associate’s degree 52.5% 47.5%
Bachelor’s degree or higher 53.4% 46.6%
Results by household income:
Less than $15,000 57.3% 42.7%
$15,000 to $35,000 40.9% 59.1%
$35,001 to $65,000 53.2% 46.8%
More than $65,000 65.8% 34.2%
Results for CHB service area 51.5% 48.5%
Results for 19-county region 49.1% 50.9%
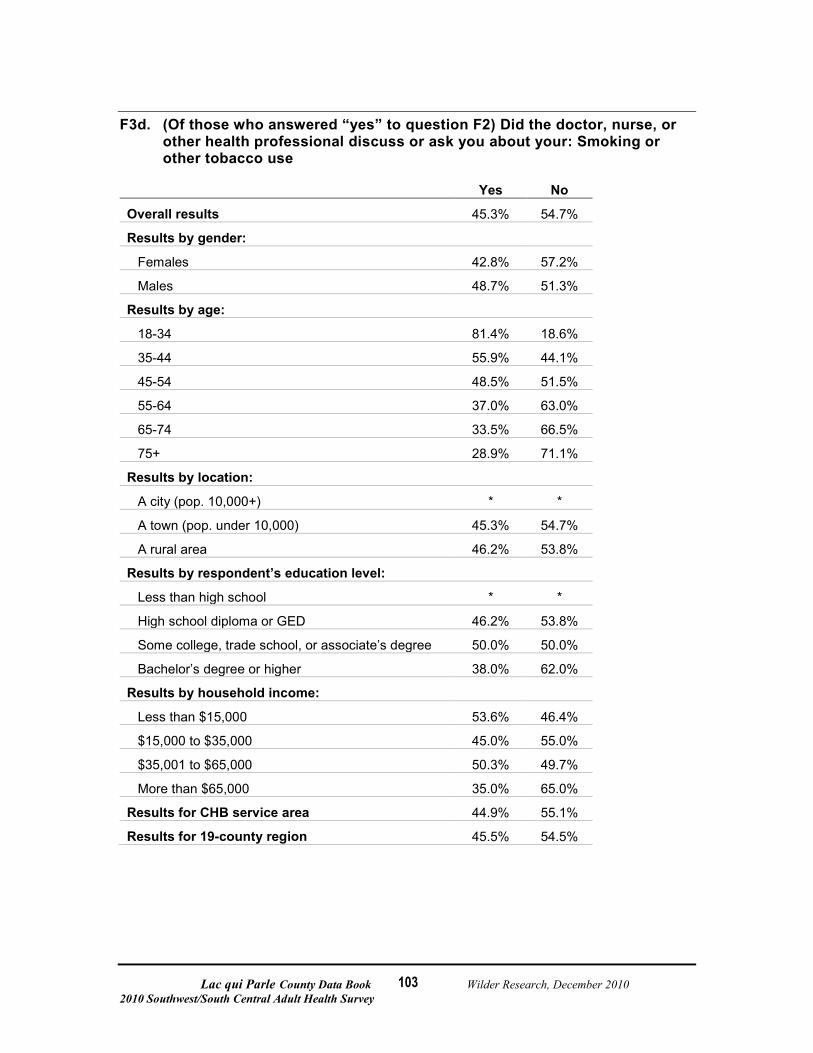
Lac qui Parle County Data Book Wilder Research, December 2010 2010 Southwest/South Central Adult Health Survey
103
F3d. (Of those who answered “yes” to question F2) Did the doctor, nurse, or other health professional discuss or ask you about your: Smoking or other tobacco use
Yes No
Overall results 45.3% 54.7%
Results by gender:
Females 42.8% 57.2%
Males 48.7% 51.3%
Results by age:
18-34 81.4% 18.6%
35-44 55.9% 44.1%
45-54 48.5% 51.5%
55-64 37.0% 63.0%
65-74 33.5% 66.5%
75+ 28.9% 71.1%
Results by location:
A city (pop. 10,000+) * *
A town (pop. under 10,000) 45.3% 54.7%
A rural area 46.2% 53.8%
Results by respondent’s education level:
Less than high school * *
High school diploma or GED 46.2% 53.8%
Some college, trade school, or associate’s degree 50.0% 50.0%
Bachelor’s degree or higher 38.0% 62.0%
Results by household income:
Less than $15,000 53.6% 46.4%
$15,000 to $35,000 45.0% 55.0%
$35,001 to $65,000 50.3% 49.7%
More than $65,000 35.0% 65.0%
Results for CHB service area 44.9% 55.1%
Results for 19-county region 45.5% 54.5%
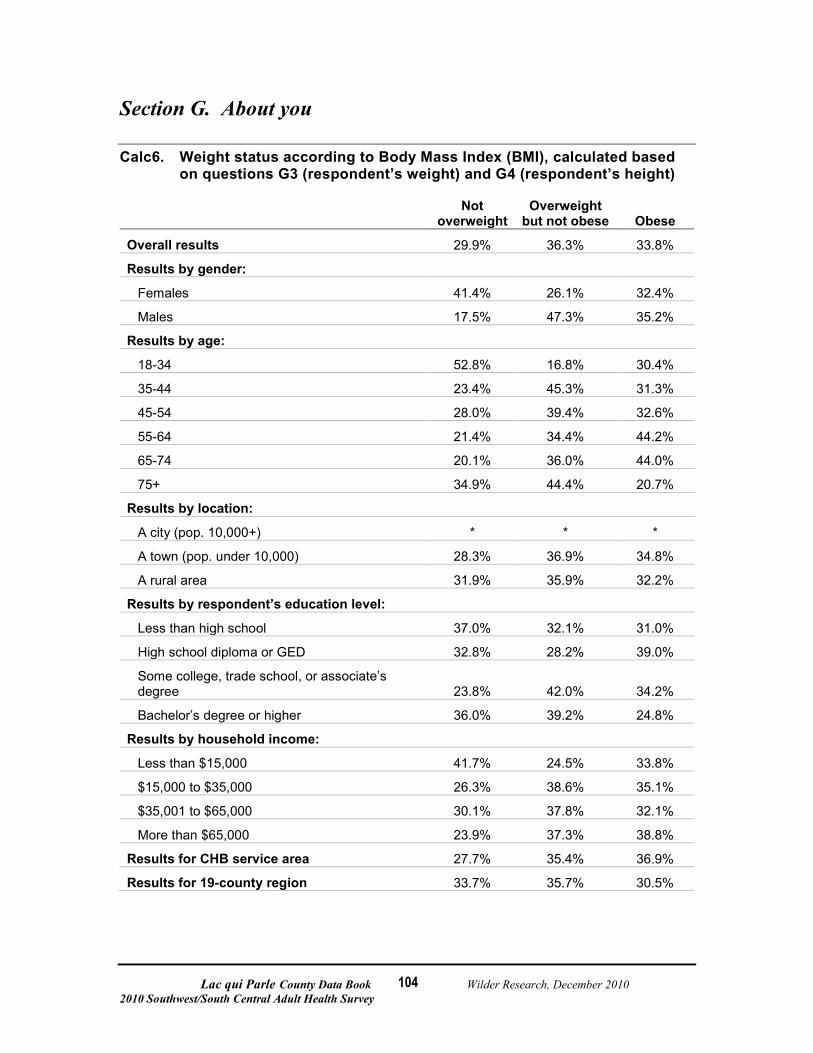
Lac qui Parle County Data Book Wilder Research, December 2010 2010 Southwest/South Central Adult Health Survey
104
Section G. About you
Calc6. Weight status according to Body Mass Index (BMI), calculated based on questions G3 (respondent’s weight) and G4 (respondent’s height)
Not
overweight Overweight
but not obese Obese
Overall results 29.9% 36.3% 33.8%
Results by gender:
Females 41.4% 26.1% 32.4%
Males 17.5% 47.3% 35.2%
Results by age:
18-34 52.8% 16.8% 30.4%
35-44 23.4% 45.3% 31.3%
45-54 28.0% 39.4% 32.6%
55-64 21.4% 34.4% 44.2%
65-74 20.1% 36.0% 44.0%
75+ 34.9% 44.4% 20.7%
Results by location:
A city (pop. 10,000+) * * *
A town (pop. under 10,000) 28.3% 36.9% 34.8%
A rural area 31.9% 35.9% 32.2%
Results by respondent’s education level:
Less than high school 37.0% 32.1% 31.0%
High school diploma or GED 32.8% 28.2% 39.0%
Some college, trade school, or associate’s degree 23.8% 42.0% 34.2%
Bachelor’s degree or higher 36.0% 39.2% 24.8%
Results by household income:
Less than $15,000 41.7% 24.5% 33.8%
$15,000 to $35,000 26.3% 38.6% 35.1%
$35,001 to $65,000 30.1% 37.8% 32.1%
More than $65,000 23.9% 37.3% 38.8%
Results for CHB service area 27.7% 35.4% 36.9%
Results for 19-county region 33.7% 35.7% 30.5%
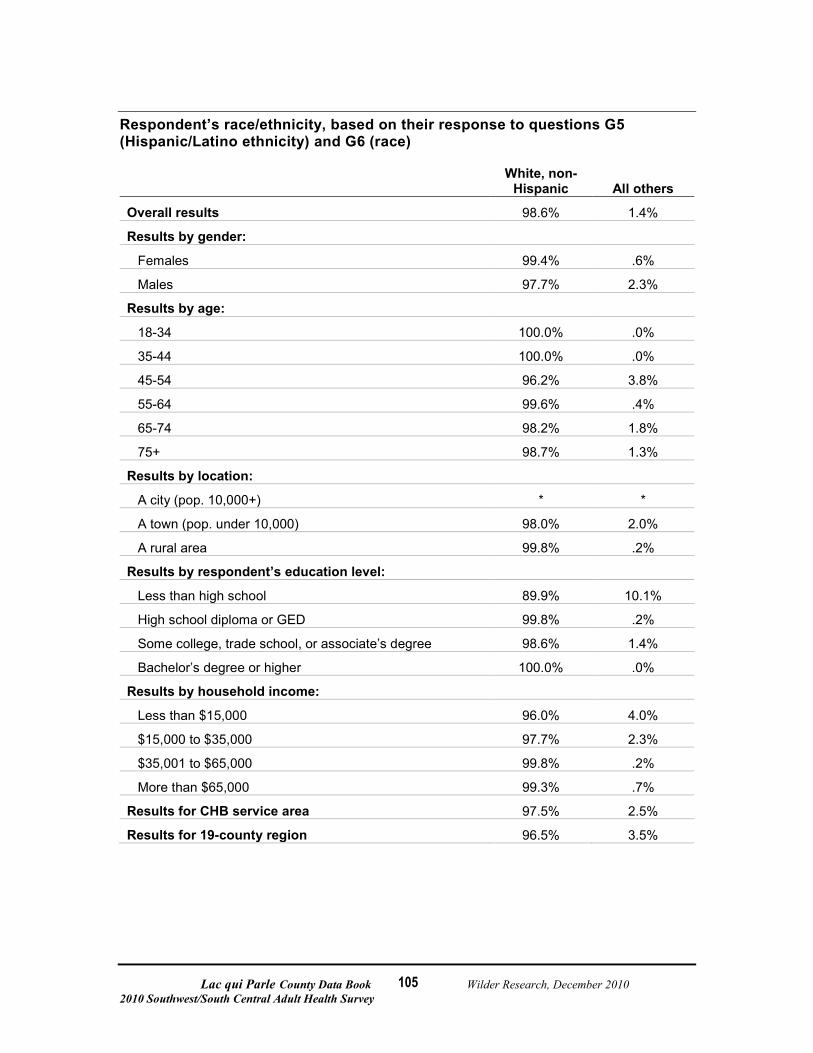
Lac qui Parle County Data Book Wilder Research, December 2010 2010 Southwest/South Central Adult Health Survey
105
Respondent’s race/ethnicity, based on their response to questions G5 (Hispanic/Latino ethnicity) and G6 (race)
White, non-
Hispanic All others
Overall results 98.6% 1.4%
Results by gender:
Females 99.4% .6%
Males 97.7% 2.3%
Results by age:
18-34 100.0% .0%
35-44 100.0% .0%
45-54 96.2% 3.8%
55-64 99.6% .4%
65-74 98.2% 1.8%
75+ 98.7% 1.3%
Results by location:
A city (pop. 10,000+) * *
A town (pop. under 10,000) 98.0% 2.0%
A rural area 99.8% .2%
Results by respondent’s education level:
Less than high school 89.9% 10.1%
High school diploma or GED 99.8% .2%
Some college, trade school, or associate’s degree 98.6% 1.4%
Bachelor’s degree or higher 100.0% .0%
Results by household income:
Less than $15,000 96.0% 4.0%
$15,000 to $35,000 97.7% 2.3%
$35,001 to $65,000 99.8% .2%
More than $65,000 99.3% .7%
Results for CHB service area 97.5% 2.5%
Results for 19-county region 96.5% 3.5%
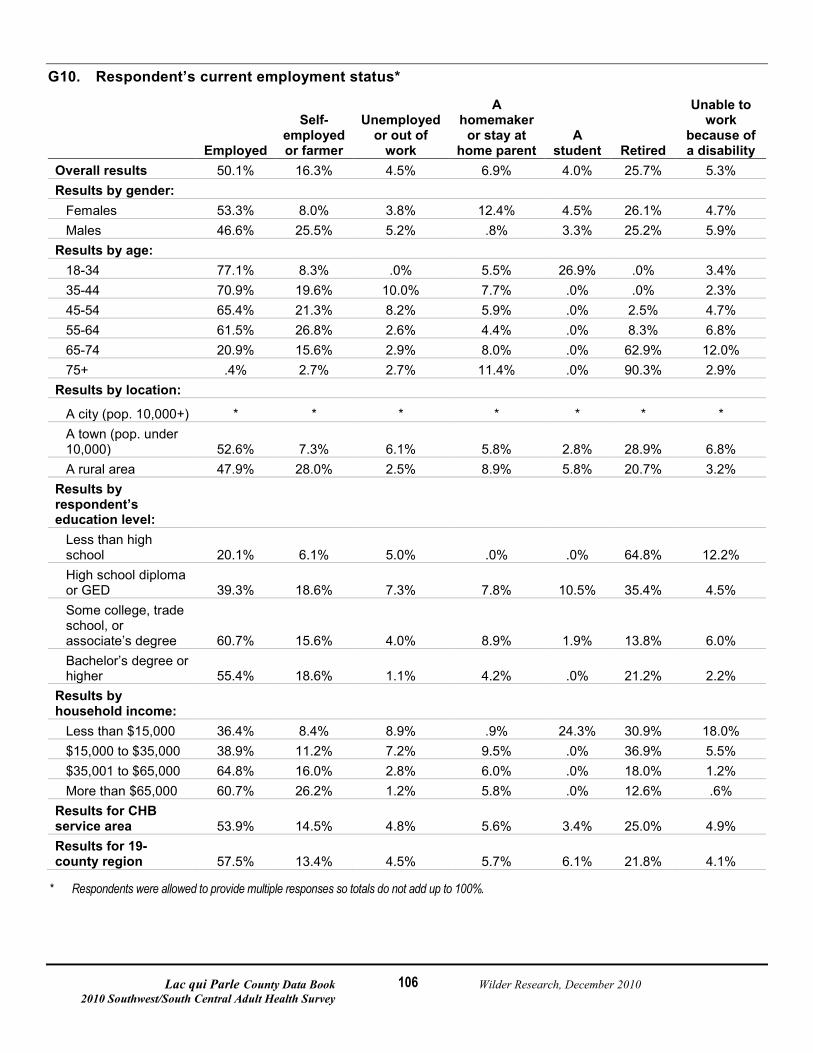
Lac qui Parle County Data Book Wilder Research, December 2010 2010 Southwest/South Central Adult Health Survey
106
G10. Respondent’s current employment status*
Employed
Self-employed or farmer
Unemployed or out of
work
A homemaker
or stay at home parent
A student Retired
Unable to work
because of a disability
Overall results 50.1% 16.3% 4.5% 6.9% 4.0% 25.7% 5.3% Results by gender:
Females 53.3% 8.0% 3.8% 12.4% 4.5% 26.1% 4.7% Males 46.6% 25.5% 5.2% .8% 3.3% 25.2% 5.9%
Results by age: 18-34 77.1% 8.3% .0% 5.5% 26.9% .0% 3.4% 35-44 70.9% 19.6% 10.0% 7.7% .0% .0% 2.3% 45-54 65.4% 21.3% 8.2% 5.9% .0% 2.5% 4.7% 55-64 61.5% 26.8% 2.6% 4.4% .0% 8.3% 6.8% 65-74 20.9% 15.6% 2.9% 8.0% .0% 62.9% 12.0% 75+ .4% 2.7% 2.7% 11.4% .0% 90.3% 2.9%
Results by location:
A city (pop. 10,000+) * * * * * * * A town (pop. under 10,000) 52.6% 7.3% 6.1% 5.8% 2.8% 28.9% 6.8% A rural area 47.9% 28.0% 2.5% 8.9% 5.8% 20.7% 3.2%
Results by respondent’s education level:
Less than high school 20.1% 6.1% 5.0% .0% .0% 64.8% 12.2% High school diploma or GED 39.3% 18.6% 7.3% 7.8% 10.5% 35.4% 4.5% Some college, trade school, or associate’s degree 60.7% 15.6% 4.0% 8.9% 1.9% 13.8% 6.0% Bachelor’s degree or higher 55.4% 18.6% 1.1% 4.2% .0% 21.2% 2.2%
Results by household income:
Less than $15,000 36.4% 8.4% 8.9% .9% 24.3% 30.9% 18.0% $15,000 to $35,000 38.9% 11.2% 7.2% 9.5% .0% 36.9% 5.5% $35,001 to $65,000 64.8% 16.0% 2.8% 6.0% .0% 18.0% 1.2% More than $65,000 60.7% 26.2% 1.2% 5.8% .0% 12.6% .6%
Results for CHB service area 53.9% 14.5% 4.8% 5.6% 3.4% 25.0% 4.9% Results for 19-county region 57.5% 13.4% 4.5% 5.7% 6.1% 21.8% 4.1%
* Respondents were allowed to provide multiple responses so totals do not add up to 100%.
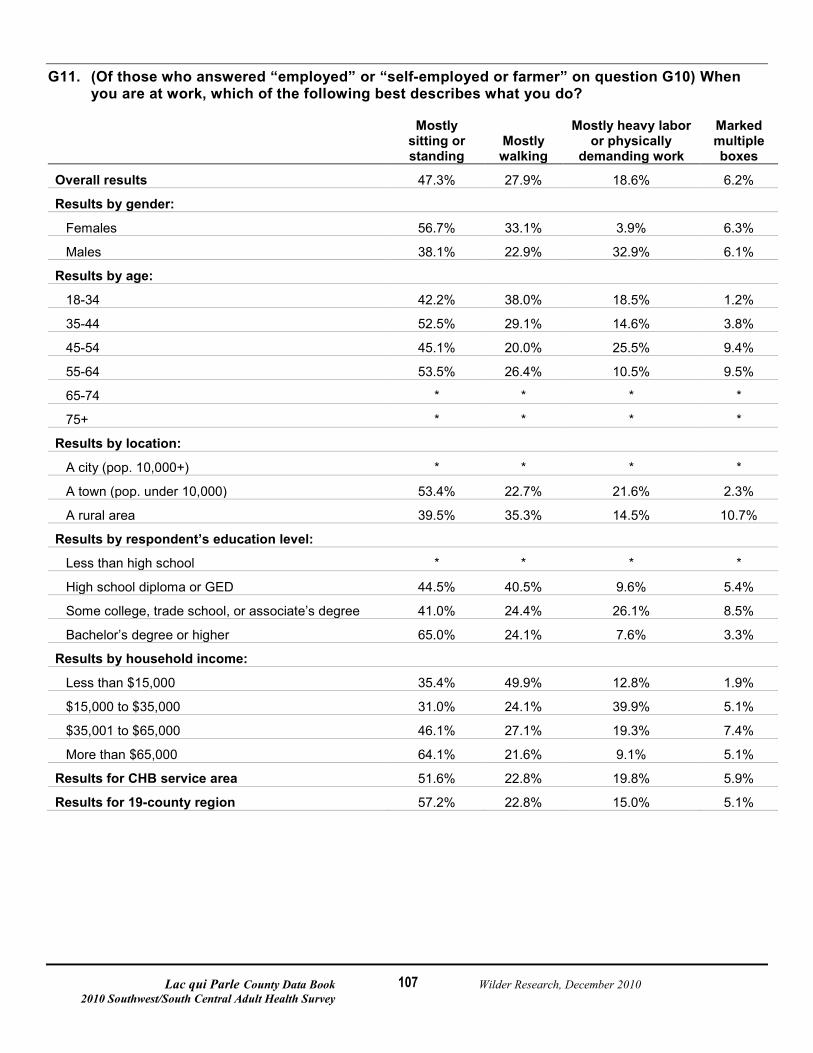
Lac qui Parle County Data Book Wilder Research, December 2010 2010 Southwest/South Central Adult Health Survey
107
G11. (Of those who answered “employed” or “self-employed or farmer” on question G10) When you are at work, which of the following best describes what you do?
Mostly sitting or standing
Mostly walking
Mostly heavy labor or physically
demanding work
Marked multiple boxes
Overall results 47.3% 27.9% 18.6% 6.2%
Results by gender:
Females 56.7% 33.1% 3.9% 6.3%
Males 38.1% 22.9% 32.9% 6.1%
Results by age:
18-34 42.2% 38.0% 18.5% 1.2%
35-44 52.5% 29.1% 14.6% 3.8%
45-54 45.1% 20.0% 25.5% 9.4%
55-64 53.5% 26.4% 10.5% 9.5%
65-74 * * * *
75+ * * * *
Results by location:
A city (pop. 10,000+) * * * *
A town (pop. under 10,000) 53.4% 22.7% 21.6% 2.3%
A rural area 39.5% 35.3% 14.5% 10.7%
Results by respondent’s education level:
Less than high school * * * *
High school diploma or GED 44.5% 40.5% 9.6% 5.4%
Some college, trade school, or associate’s degree 41.0% 24.4% 26.1% 8.5%
Bachelor’s degree or higher 65.0% 24.1% 7.6% 3.3%
Results by household income:
Less than $15,000 35.4% 49.9% 12.8% 1.9%
$15,000 to $35,000 31.0% 24.1% 39.9% 5.1%
$35,001 to $65,000 46.1% 27.1% 19.3% 7.4%
More than $65,000 64.1% 21.6% 9.1% 5.1%
Results for CHB service area 51.6% 22.8% 19.8% 5.9%
Results for 19-county region 57.2% 22.8% 15.0% 5.1%
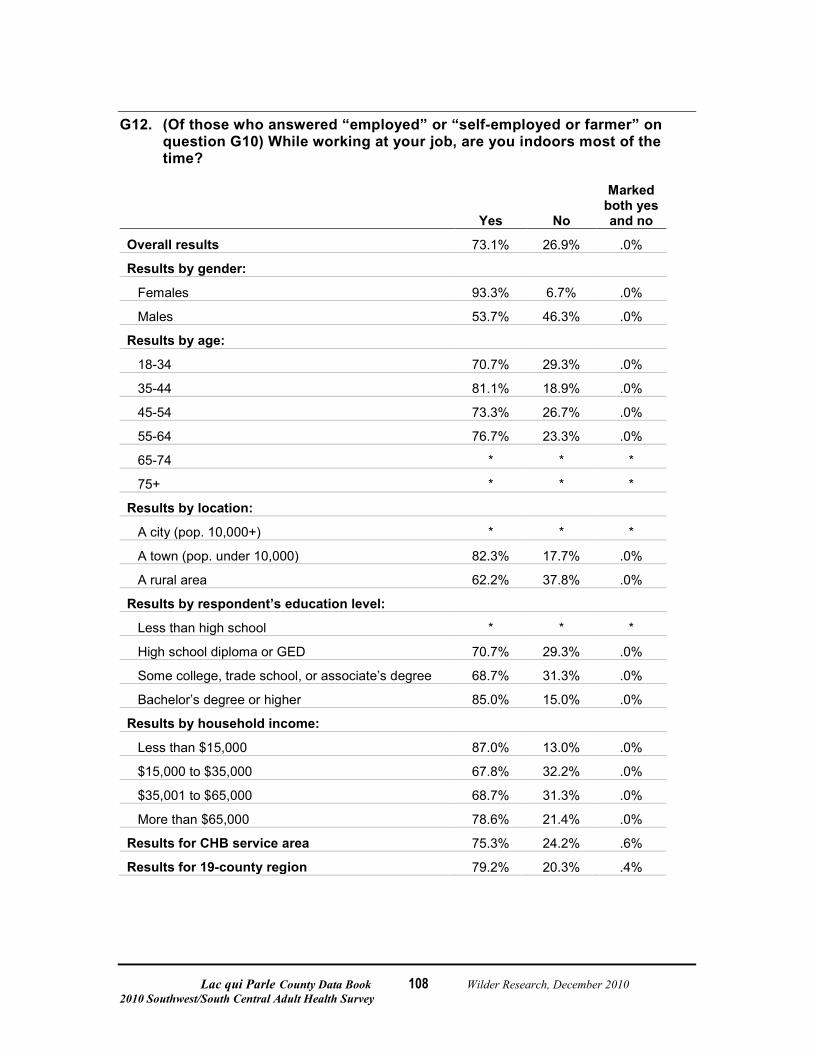
Lac qui Parle County Data Book Wilder Research, December 2010 2010 Southwest/South Central Adult Health Survey
108
G12. (Of those who answered “employed” or “self-employed or farmer” on question G10) While working at your job, are you indoors most of the time?
Yes No
Marked both yes and no
Overall results 73.1% 26.9% .0%
Results by gender:
Females 93.3% 6.7% .0%
Males 53.7% 46.3% .0%
Results by age:
18-34 70.7% 29.3% .0%
35-44 81.1% 18.9% .0%
45-54 73.3% 26.7% .0%
55-64 76.7% 23.3% .0%
65-74 * * *
75+ * * *
Results by location:
A city (pop. 10,000+) * * *
A town (pop. under 10,000) 82.3% 17.7% .0%
A rural area 62.2% 37.8% .0%
Results by respondent’s education level:
Less than high school * * *
High school diploma or GED 70.7% 29.3% .0%
Some college, trade school, or associate’s degree 68.7% 31.3% .0%
Bachelor’s degree or higher 85.0% 15.0% .0%
Results by household income:
Less than $15,000 87.0% 13.0% .0%
$15,000 to $35,000 67.8% 32.2% .0%
$35,001 to $65,000 68.7% 31.3% .0%
More than $65,000 78.6% 21.4% .0%
Results for CHB service area 75.3% 24.2% .6%
Results for 19-county region 79.2% 20.3% .4%
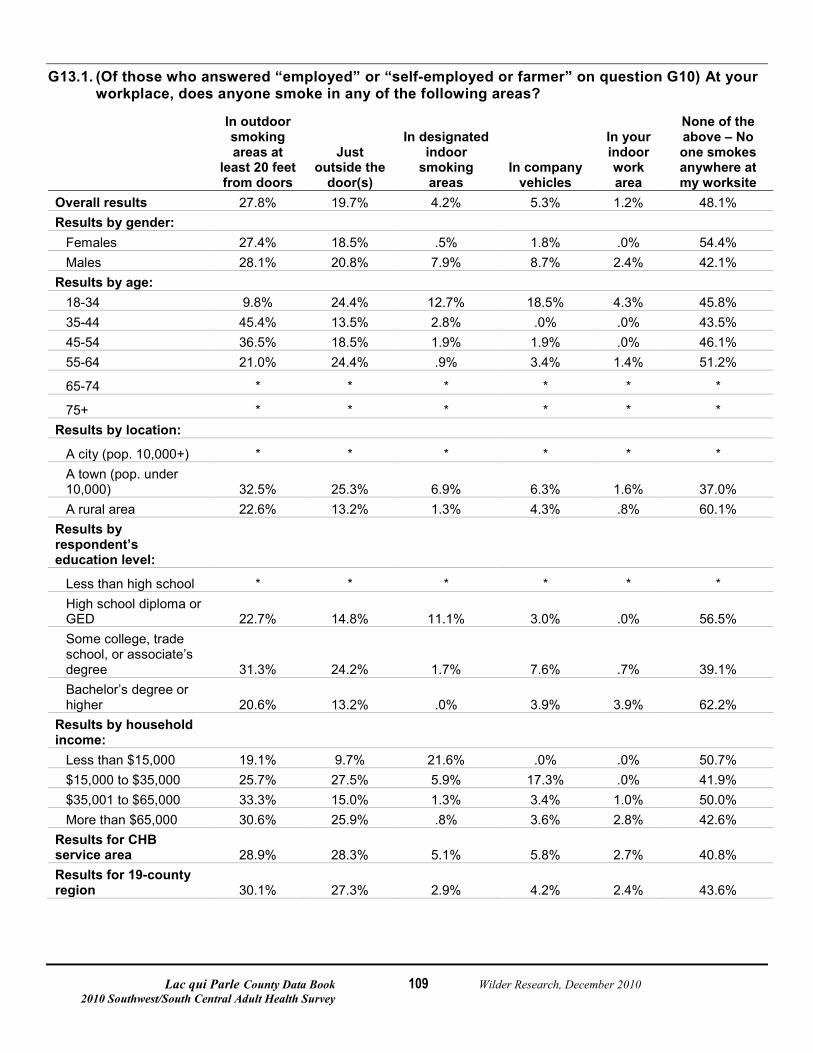
Lac qui Parle County Data Book Wilder Research, December 2010 2010 Southwest/South Central Adult Health Survey
109
G13.1. (Of those who answered “employed” or “self-employed or farmer” on question G10) At your workplace, does anyone smoke in any of the following areas?
In outdoor smoking areas at
least 20 feet from doors
Just outside the
door(s)
In designated indoor
smoking areas
In company vehicles
In your indoor work area
None of the above – No one smokes anywhere at my worksite
Overall results 27.8% 19.7% 4.2% 5.3% 1.2% 48.1% Results by gender:
Females 27.4% 18.5% .5% 1.8% .0% 54.4% Males 28.1% 20.8% 7.9% 8.7% 2.4% 42.1%
Results by age: 18-34 9.8% 24.4% 12.7% 18.5% 4.3% 45.8% 35-44 45.4% 13.5% 2.8% .0% .0% 43.5% 45-54 36.5% 18.5% 1.9% 1.9% .0% 46.1% 55-64 21.0% 24.4% .9% 3.4% 1.4% 51.2%
65-74 * * * * * *
75+ * * * * * * Results by location:
A city (pop. 10,000+) * * * * * * A town (pop. under 10,000) 32.5% 25.3% 6.9% 6.3% 1.6% 37.0% A rural area 22.6% 13.2% 1.3% 4.3% .8% 60.1%
Results by respondent’s education level:
Less than high school * * * * * * High school diploma or GED 22.7% 14.8% 11.1% 3.0% .0% 56.5% Some college, trade school, or associate’s degree 31.3% 24.2% 1.7% 7.6% .7% 39.1% Bachelor’s degree or higher 20.6% 13.2% .0% 3.9% 3.9% 62.2%
Results by household income:
Less than $15,000 19.1% 9.7% 21.6% .0% .0% 50.7% $15,000 to $35,000 25.7% 27.5% 5.9% 17.3% .0% 41.9% $35,001 to $65,000 33.3% 15.0% 1.3% 3.4% 1.0% 50.0% More than $65,000 30.6% 25.9% .8% 3.6% 2.8% 42.6%
Results for CHB service area 28.9% 28.3% 5.1% 5.8% 2.7% 40.8% Results for 19-county region 30.1% 27.3% 2.9% 4.2% 2.4% 43.6%
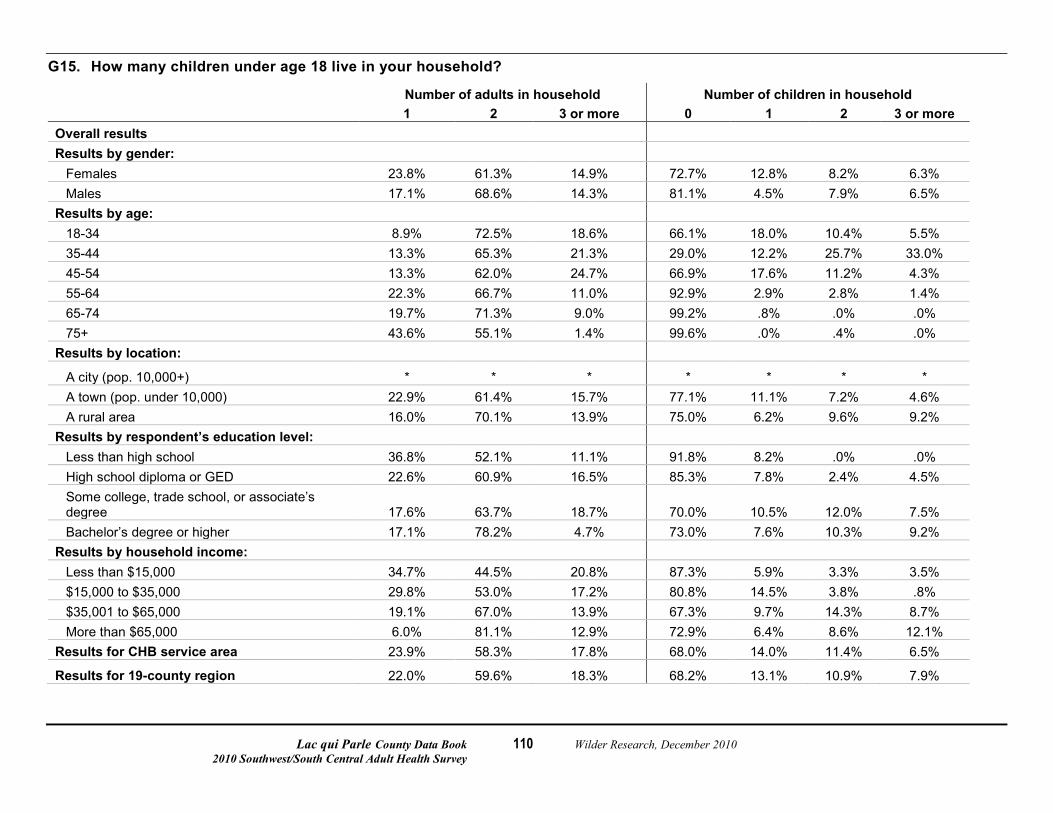
Lac qui Parle County Data Book Wilder Research, December 2010 2010 Southwest/South Central Adult Health Survey
110
G15. How many children under age 18 live in your household?
Number of adults in household Number of children in household 1 2 3 or more 0 1 2 3 or more
Overall results Results by gender:
Females 23.8% 61.3% 14.9% 72.7% 12.8% 8.2% 6.3% Males 17.1% 68.6% 14.3% 81.1% 4.5% 7.9% 6.5%
Results by age: 18-34 8.9% 72.5% 18.6% 66.1% 18.0% 10.4% 5.5% 35-44 13.3% 65.3% 21.3% 29.0% 12.2% 25.7% 33.0% 45-54 13.3% 62.0% 24.7% 66.9% 17.6% 11.2% 4.3% 55-64 22.3% 66.7% 11.0% 92.9% 2.9% 2.8% 1.4% 65-74 19.7% 71.3% 9.0% 99.2% .8% .0% .0% 75+ 43.6% 55.1% 1.4% 99.6% .0% .4% .0%
Results by location:
A city (pop. 10,000+) * * * * * * * A town (pop. under 10,000) 22.9% 61.4% 15.7% 77.1% 11.1% 7.2% 4.6% A rural area 16.0% 70.1% 13.9% 75.0% 6.2% 9.6% 9.2%
Results by respondent’s education level: Less than high school 36.8% 52.1% 11.1% 91.8% 8.2% .0% .0% High school diploma or GED 22.6% 60.9% 16.5% 85.3% 7.8% 2.4% 4.5% Some college, trade school, or associate’s degree 17.6% 63.7% 18.7% 70.0% 10.5% 12.0% 7.5% Bachelor’s degree or higher 17.1% 78.2% 4.7% 73.0% 7.6% 10.3% 9.2%
Results by household income: Less than $15,000 34.7% 44.5% 20.8% 87.3% 5.9% 3.3% 3.5% $15,000 to $35,000 29.8% 53.0% 17.2% 80.8% 14.5% 3.8% .8% $35,001 to $65,000 19.1% 67.0% 13.9% 67.3% 9.7% 14.3% 8.7% More than $65,000 6.0% 81.1% 12.9% 72.9% 6.4% 8.6% 12.1%
Results for CHB service area 23.9% 58.3% 17.8% 68.0% 14.0% 11.4% 6.5%
Results for 19-county region 22.0% 59.6% 18.3% 68.2% 13.1% 10.9% 7.9%
Lac qui Parle County Data Book Wilder Research, December 2010 2010 Southwest/South Central Adult Health Survey
111
Appendix Detailed study methodology
Survey instrument

Lac qui Parle County Data Book Wilder Research, December 2010 2010 Southwest/South Central Adult Health Survey
112
Lac qui Parle County Data Book Wilder Research, December 2010 2010 Southwest/South Central Adult Health Survey
113
Detailed study methodology
Southwest/South Central Adult Health Survey Methodology
Study design
Wilder Research conducted self-administered and telephone surveys with a random sample of adult residents in Big Stone, Blue Earth, Brown, Chippewa, Cottonwood, Jackson, Kandiyohi, Lac qui Parle, Le Sueur, Lincoln, Lyon, Murray, Nicollet, Pipestone, Redwood, Renville, Swift, Waseca, and Yellow Medicine Counties. This study was designed to obtain data on health risk behaviors and the health status of adults in the study area to: help participating agencies set priorities for new initiatives; assess the needs of specific populations; provide evidence to support policies, legislative actions, and environmental and systems changes; provide county-level data to support future grant applications; and increase public awareness of health issues.
Sample
An address-based sample of 38,000 residents (2,000 per county) was purchased from Marketing Systems Group, a national sampling vendor. An address-based sample was chosen so that all households have an equal chance of being sampled for the study regardless of their cell phone or landline phone status. Marketing Systems Group obtained the list of addresses from the U.S. Postal Service. The “most recent birthday” method of within-household respondent selection was used to ensure that every adult in sampled households had an equal chance of being surveyed.
Survey instrument
Representatives of the participating public health agencies developed a survey instrument that addressed the research questions. Technical assistance was provided by a research scientist from the Minnesota Department of Health Center for Health Statistics. Existing items from the Behavior Risk Factor Surveillance System (BRFSS) and other Minnesota statewide surveys were used to design some of the items on this new survey. The survey was formatted as a self-administered questionnaire. The survey was not translated into any other languages. It was only conducted in English.
Data collection protocol
An initial survey packet was sent to all sampled households that included a cover letter, survey instrument, and a postage-paid return envelope. Respondents who were mailed a survey were also given the option to call Wilder Research and complete the survey over

Lac qui Parle County Data Book Wilder Research, December 2010 2010 Southwest/South Central Adult Health Survey
114
the phone. The first 30,400 (1,600 per county) survey packets were mailed on April 19, 2010. We received 4,032 completes within the first two weeks.
Two weeks after the first survey packets went out a reminder postcard was sent to those who had not completed and returned a survey. The reminder postcards were sent to 26,368 households on May 3, 2010. We received 1,706 completes in the following two weeks.
Two weeks after the reminder postcard (and one month after the initial mailing) another full survey packet was sent to all respondents who had not completed and returned the survey. We sent 24,662 full survey packets to households who had still not completed the survey on May 17, 2010. The remaining 3,085 completes were received over the next six weeks with the final cut off date for surveys being June 30, 2010.
Incentives
Respondents who completed the survey were entered into a drawing for a $25 grocery gift card. Four winners from each county were randomly selected to receive a gift card. Information for the winners was provided to the client and they distributed the gift cards.
Completed surveys and other final dispositions
We received completed surveys from 8,823 households. The overall response rate was 29 percent. See Figure 1 for response rate by county.
Data cleaning and analysis
Surveys were coded and scanned electronically by Adapt, Inc., in Minnetonka, Minnesota. The scanned data was transferred to the data analysis staff at Wilder Research for further verification and cleaning. Completed surveys were coded and checked for completion and accuracy. Only project coordinators, research assistants, and interviewers trained by the project manager worked on the proofing and coding for this study.
To ensure that the survey data are representative of the population of adults living in the participating counties, the data were adjusted using post-stratification weighting based on age and gender (i.e., the survey data were corrected so that the gender and age of the survey respondents mirrors the gender and age of the adult population). The data were weighted against U.S. census bureau 3-year estimates (2006-2008) for each county. The number of adults in the household and the total number of households in each county were also accounted for using “design weighting” (i.e., to reflect each individual adult’s chances of being sampled for the survey).
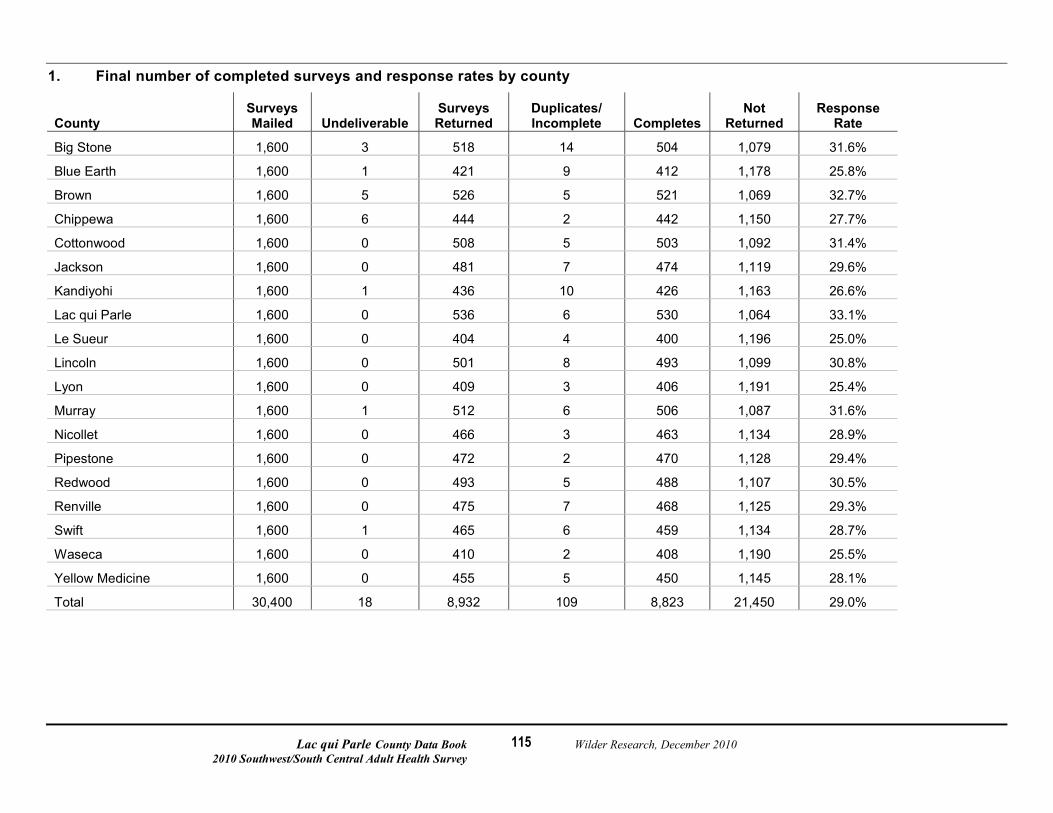
Lac qui Parle County Data Book Wilder Research, December 2010 2010 Southwest/South Central Adult Health Survey
115
1. Final number of completed surveys and response rates by county
County Surveys Mailed Undeliverable
Surveys Returned
Duplicates/ Incomplete Completes
Not Returned
Response Rate
Big Stone 1,600 3 518 14 504 1,079 31.6%
Blue Earth 1,600 1 421 9 412 1,178 25.8%
Brown 1,600 5 526 5 521 1,069 32.7%
Chippewa 1,600 6 444 2 442 1,150 27.7%
Cottonwood 1,600 0 508 5 503 1,092 31.4%
Jackson 1,600 0 481 7 474 1,119 29.6%
Kandiyohi 1,600 1 436 10 426 1,163 26.6%
Lac qui Parle 1,600 0 536 6 530 1,064 33.1%
Le Sueur 1,600 0 404 4 400 1,196 25.0%
Lincoln 1,600 0 501 8 493 1,099 30.8%
Lyon 1,600 0 409 3 406 1,191 25.4%
Murray 1,600 1 512 6 506 1,087 31.6%
Nicollet 1,600 0 466 3 463 1,134 28.9%
Pipestone 1,600 0 472 2 470 1,128 29.4%
Redwood 1,600 0 493 5 488 1,107 30.5%
Renville 1,600 0 475 7 468 1,125 29.3%
Swift 1,600 1 465 6 459 1,134 28.7%
Waseca 1,600 0 410 2 408 1,190 25.5%
Yellow Medicine 1,600 0 455 5 450 1,145 28.1%
Total 30,400 18 8,932 109 8,823 21,450 29.0%
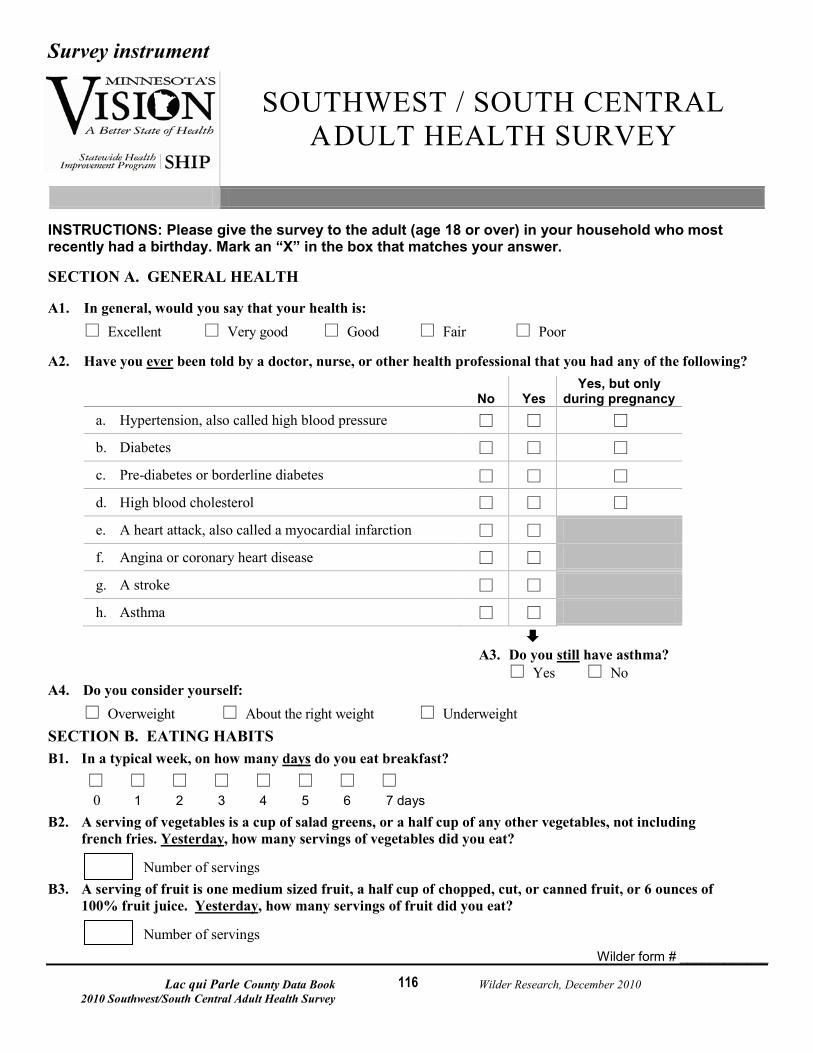
Lac qui Parle County Data Book Wilder Research, December 2010 2010 Southwest/South Central Adult Health Survey
116
Survey instrument
SOUTHWEST / SOUTH CENTRAL ADULT HEALTH SURVEY
INSTRUCTIONS: Please give the survey to the adult (age 18 or over) in your household who most recently had a birthday. Mark an “X” in the box that matches your answer. SECTION A. GENERAL HEALTH A1. In general, would you say that your health is: Excellent Very good Good Fair Poor A2. Have you ever been told by a doctor, nurse, or other health professional that you had any of the following?
No Yes
Yes, but only during pregnancy
a. Hypertension, also called high blood pressure
b. Diabetes
c. Pre-diabetes or borderline diabetes
d. High blood cholesterol
e. A heart attack, also called a myocardial infarction
f. Angina or coronary heart disease
g. A stroke
h. Asthma A3. Do you still have asthma? Yes No A4. Do you consider yourself: Overweight About the right weight Underweight
SECTION B. EATING HABITS
B1. In a typical week, on how many days do you eat breakfast? 0 1 2 3 4 5 6 7 days
B2. A serving of vegetables is a cup of salad greens, or a half cup of any other vegetables, not including french fries. Yesterday, how many servings of vegetables did you eat?
Number of servings
B3. A serving of fruit is one medium sized fruit, a half cup of chopped, cut, or canned fruit, or 6 ounces of 100% fruit juice. Yesterday, how many servings of fruit did you eat?
Number of servings Wilder form # ____________
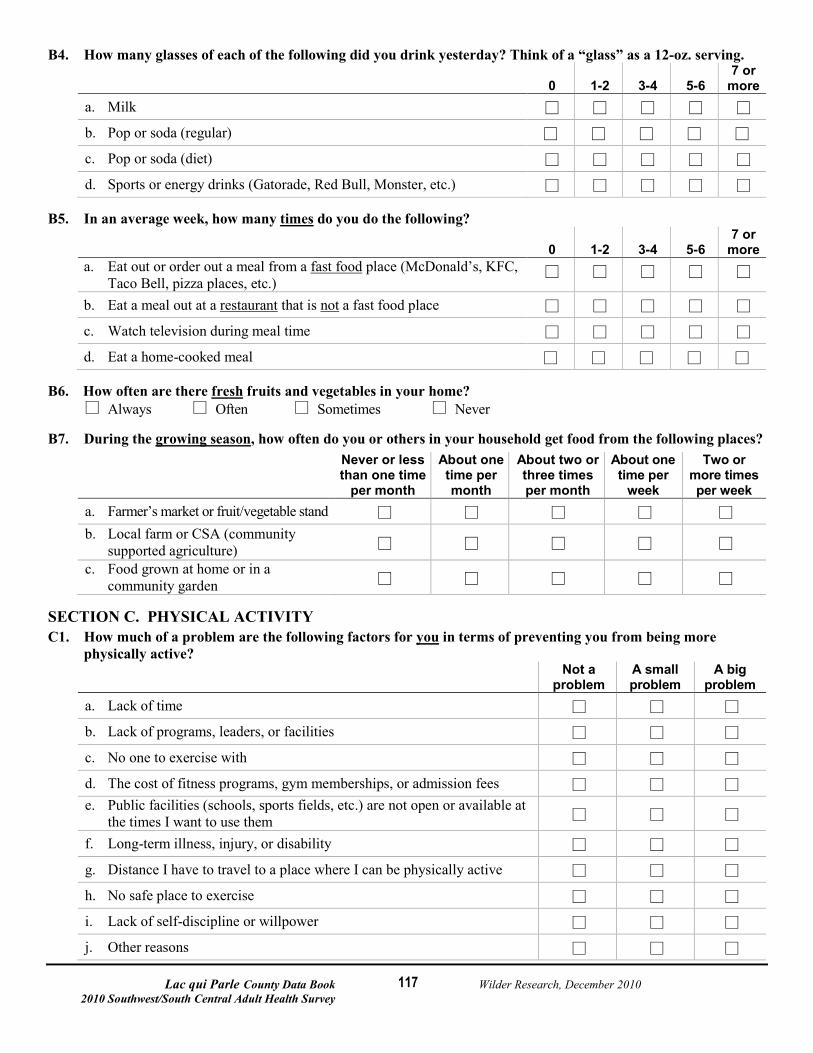
Lac qui Parle County Data Book Wilder Research, December 2010 2010 Southwest/South Central Adult Health Survey
117
B4. How many glasses of each of the following did you drink yesterday? Think of a “glass” as a 12-oz. serving.
0 1-2 3-4 5-6 7 or
more a. Milk b. Pop or soda (regular) c. Pop or soda (diet) d. Sports or energy drinks (Gatorade, Red Bull, Monster, etc.)
B5. In an average week, how many times do you do the following?
0 1-2 3-4 5-6
7 or more
a. Eat out or order out a meal from a fast food place (McDonald’s, KFC, Taco Bell, pizza places, etc.)
b. Eat a meal out at a restaurant that is not a fast food place c. Watch television during meal time d. Eat a home-cooked meal
B6. How often are there fresh fruits and vegetables in your home? Always Often Sometimes Never B7. During the growing season, how often do you or others in your household get food from the following places?
Never or less than one time
per month
About one time per month
About two or three times per month
About one time per
week
Two or more times per week
a. Farmer’s market or fruit/vegetable stand b. Local farm or CSA (community
supported agriculture) c. Food grown at home or in a
community garden SECTION C. PHYSICAL ACTIVITY C1. How much of a problem are the following factors for you in terms of preventing you from being more
physically active? Not a
problem A small problem
A big problem
a. Lack of time b. Lack of programs, leaders, or facilities c. No one to exercise with d. The cost of fitness programs, gym memberships, or admission fees e. Public facilities (schools, sports fields, etc.) are not open or available at
the times I want to use them
f. Long-term illness, injury, or disability g. Distance I have to travel to a place where I can be physically active h. No safe place to exercise i. Lack of self-discipline or willpower j. Other reasons
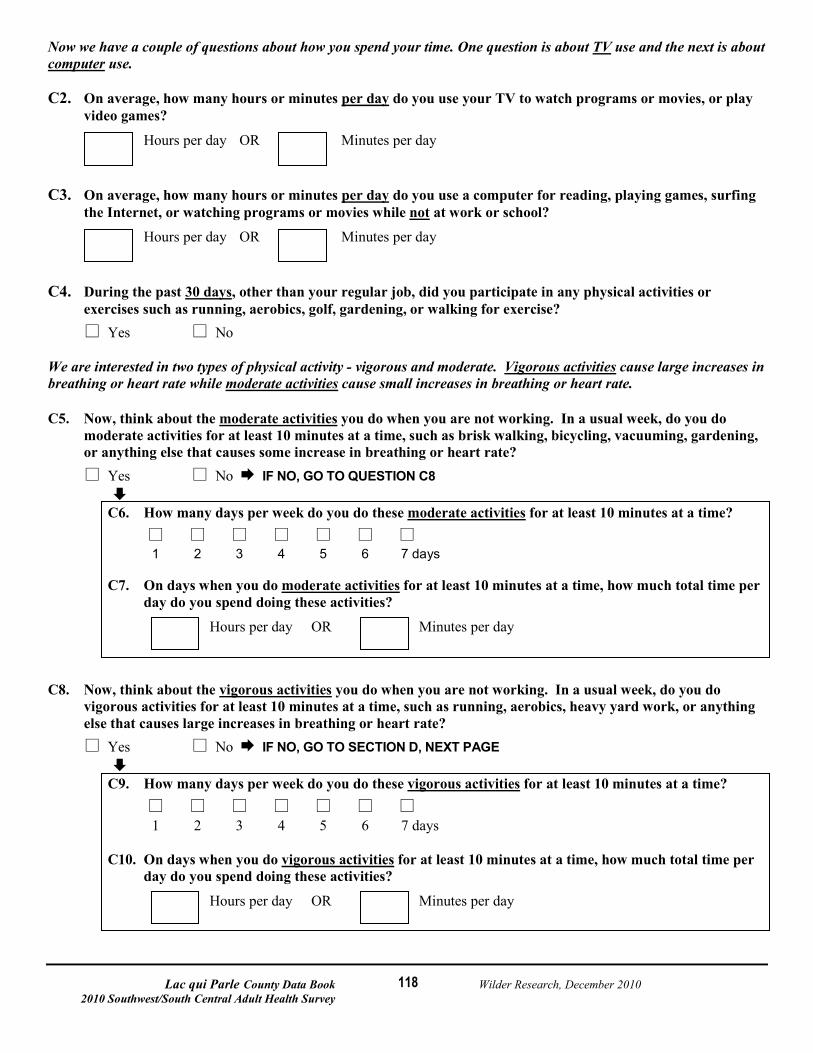
Lac qui Parle County Data Book Wilder Research, December 2010 2010 Southwest/South Central Adult Health Survey
118
Now we have a couple of questions about how you spend your time. One question is about TV use and the next is about computer use. C2. On average, how many hours or minutes per day do you use your TV to watch programs or movies, or play
video games?
Hours per day OR Minutes per day C3. On average, how many hours or minutes per day do you use a computer for reading, playing games, surfing
the Internet, or watching programs or movies while not at work or school?
Hours per day OR Minutes per day C4. During the past 30 days, other than your regular job, did you participate in any physical activities or
exercises such as running, aerobics, golf, gardening, or walking for exercise? Yes No We are interested in two types of physical activity - vigorous and moderate. Vigorous activities cause large increases in breathing or heart rate while moderate activities cause small increases in breathing or heart rate. C5. Now, think about the moderate activities you do when you are not working. In a usual week, do you do
moderate activities for at least 10 minutes at a time, such as brisk walking, bicycling, vacuuming, gardening, or anything else that causes some increase in breathing or heart rate?
Yes No IF NO, GO TO QUESTION C8
C6. How many days per week do you do these moderate activities for at least 10 minutes at a time?
1 2 3 4 5 6 7 days
C7. On days when you do moderate activities for at least 10 minutes at a time, how much total time per day do you spend doing these activities?
Hours per day OR Minutes per day C8. Now, think about the vigorous activities you do when you are not working. In a usual week, do you do
vigorous activities for at least 10 minutes at a time, such as running, aerobics, heavy yard work, or anything else that causes large increases in breathing or heart rate?
Yes No IF NO, GO TO SECTION D, NEXT PAGE
C9. How many days per week do you do these vigorous activities for at least 10 minutes at a time?
1 2 3 4 5 6 7 days
C10. On days when you do vigorous activities for at least 10 minutes at a time, how much total time per day do you spend doing these activities?
Hours per day OR Minutes per day
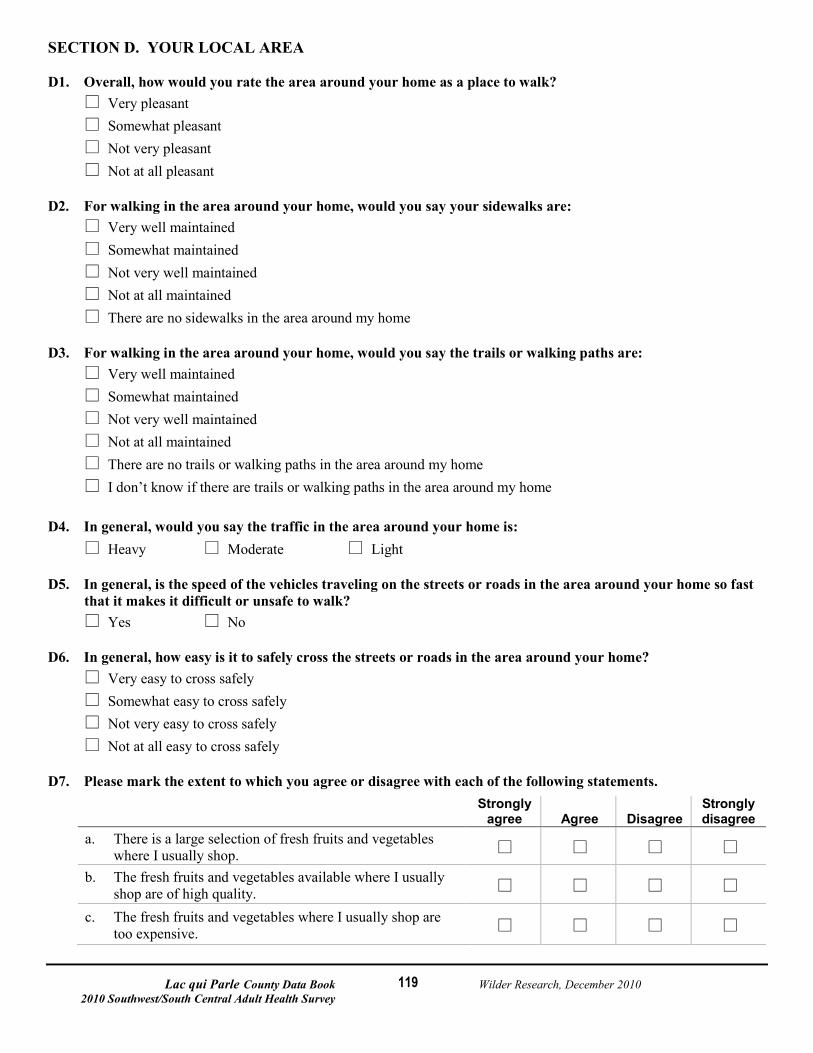
Lac qui Parle County Data Book Wilder Research, December 2010 2010 Southwest/South Central Adult Health Survey
119
SECTION D. YOUR LOCAL AREA D1. Overall, how would you rate the area around your home as a place to walk? Very pleasant Somewhat pleasant Not very pleasant Not at all pleasant D2. For walking in the area around your home, would you say your sidewalks are: Very well maintained Somewhat maintained Not very well maintained Not at all maintained There are no sidewalks in the area around my home D3. For walking in the area around your home, would you say the trails or walking paths are: Very well maintained Somewhat maintained Not very well maintained Not at all maintained There are no trails or walking paths in the area around my home I don’t know if there are trails or walking paths in the area around my home D4. In general, would you say the traffic in the area around your home is: Heavy Moderate Light D5. In general, is the speed of the vehicles traveling on the streets or roads in the area around your home so fast
that it makes it difficult or unsafe to walk? Yes No D6. In general, how easy is it to safely cross the streets or roads in the area around your home? Very easy to cross safely Somewhat easy to cross safely Not very easy to cross safely Not at all easy to cross safely D7. Please mark the extent to which you agree or disagree with each of the following statements.
Strongly agree Agree Disagree
Strongly disagree
a. There is a large selection of fresh fruits and vegetables where I usually shop.
b. The fresh fruits and vegetables available where I usually shop are of high quality.
c. The fresh fruits and vegetables where I usually shop are too expensive.
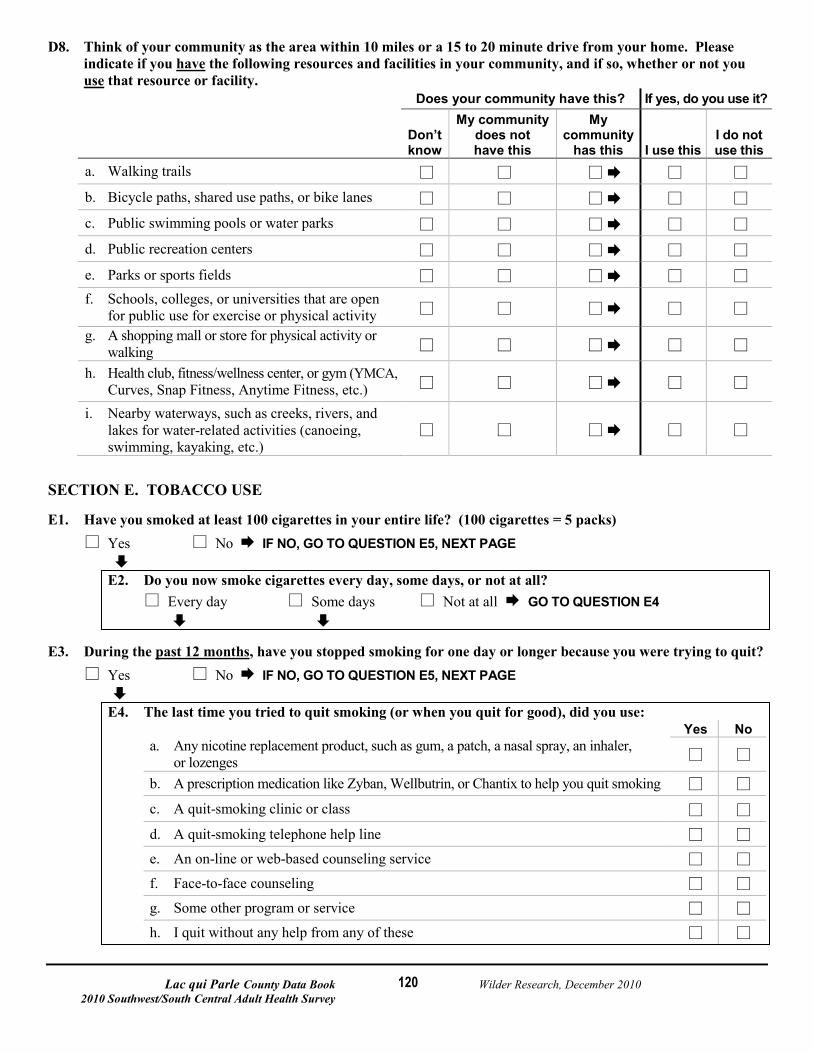
Lac qui Parle County Data Book Wilder Research, December 2010 2010 Southwest/South Central Adult Health Survey
120
D8. Think of your community as the area within 10 miles or a 15 to 20 minute drive from your home. Please indicate if you have the following resources and facilities in your community, and if so, whether or not you use that resource or facility.
Does your community have this? If yes, do you use it?
Don’t know
My community does not have this
My community
has this I use this I do not use this
a. Walking trails b. Bicycle paths, shared use paths, or bike lanes c. Public swimming pools or water parks d. Public recreation centers e. Parks or sports fields f. Schools, colleges, or universities that are open
for public use for exercise or physical activity g. A shopping mall or store for physical activity or
walking
h. Health club, fitness/wellness center, or gym (YMCA, Curves, Snap Fitness, Anytime Fitness, etc.)
i. Nearby waterways, such as creeks, rivers, and lakes for water-related activities (canoeing, swimming, kayaking, etc.)
SECTION E. TOBACCO USE E1. Have you smoked at least 100 cigarettes in your entire life? (100 cigarettes = 5 packs) Yes No IF NO, GO TO QUESTION E5, NEXT PAGE
E2. Do you now smoke cigarettes every day, some days, or not at all? Every day Some days Not at all GO TO QUESTION E4
E3. During the past 12 months, have you stopped smoking for one day or longer because you were trying to quit? Yes No IF NO, GO TO QUESTION E5, NEXT PAGE
E4. The last time you tried to quit smoking (or when you quit for good), did you use: Yes No a. Any nicotine replacement product, such as gum, a patch, a nasal spray, an inhaler,
or lozenges
b. A prescription medication like Zyban, Wellbutrin, or Chantix to help you quit smoking c. A quit-smoking clinic or class d. A quit-smoking telephone help line e. An on-line or web-based counseling service f. Face-to-face counseling g. Some other program or service h. I quit without any help from any of these
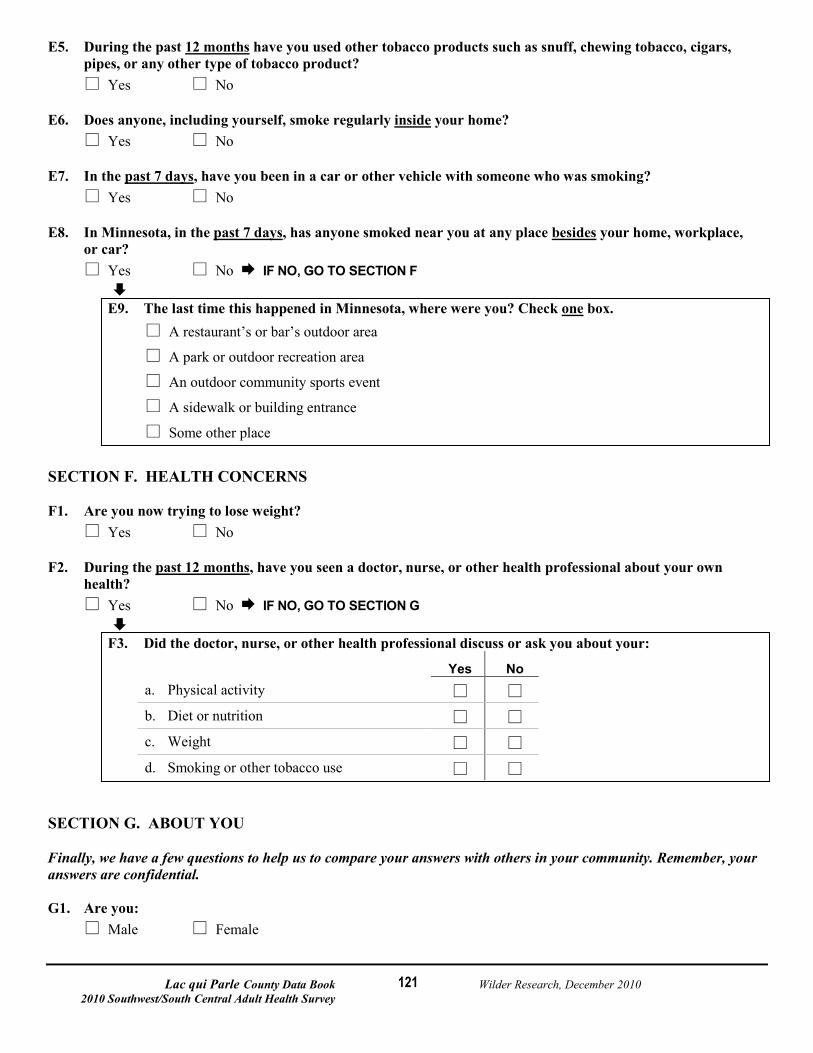
Lac qui Parle County Data Book Wilder Research, December 2010 2010 Southwest/South Central Adult Health Survey
121
E5. During the past 12 months have you used other tobacco products such as snuff, chewing tobacco, cigars, pipes, or any other type of tobacco product?
Yes No E6. Does anyone, including yourself, smoke regularly inside your home? Yes No E7. In the past 7 days, have you been in a car or other vehicle with someone who was smoking? Yes No E8. In Minnesota, in the past 7 days, has anyone smoked near you at any place besides your home, workplace,
or car? Yes No IF NO, GO TO SECTION F E9. The last time this happened in Minnesota, where were you? Check one box.
A restaurant’s or bar’s outdoor area
A park or outdoor recreation area
An outdoor community sports event
A sidewalk or building entrance
Some other place SECTION F. HEALTH CONCERNS F1. Are you now trying to lose weight? Yes No F2. During the past 12 months, have you seen a doctor, nurse, or other health professional about your own
health? Yes No IF NO, GO TO SECTION G F3. Did the doctor, nurse, or other health professional discuss or ask you about your:
Yes No a. Physical activity b. Diet or nutrition c. Weight d. Smoking or other tobacco use
SECTION G. ABOUT YOU Finally, we have a few questions to help us to compare your answers with others in your community. Remember, your answers are confidential. G1. Are you: Male Female
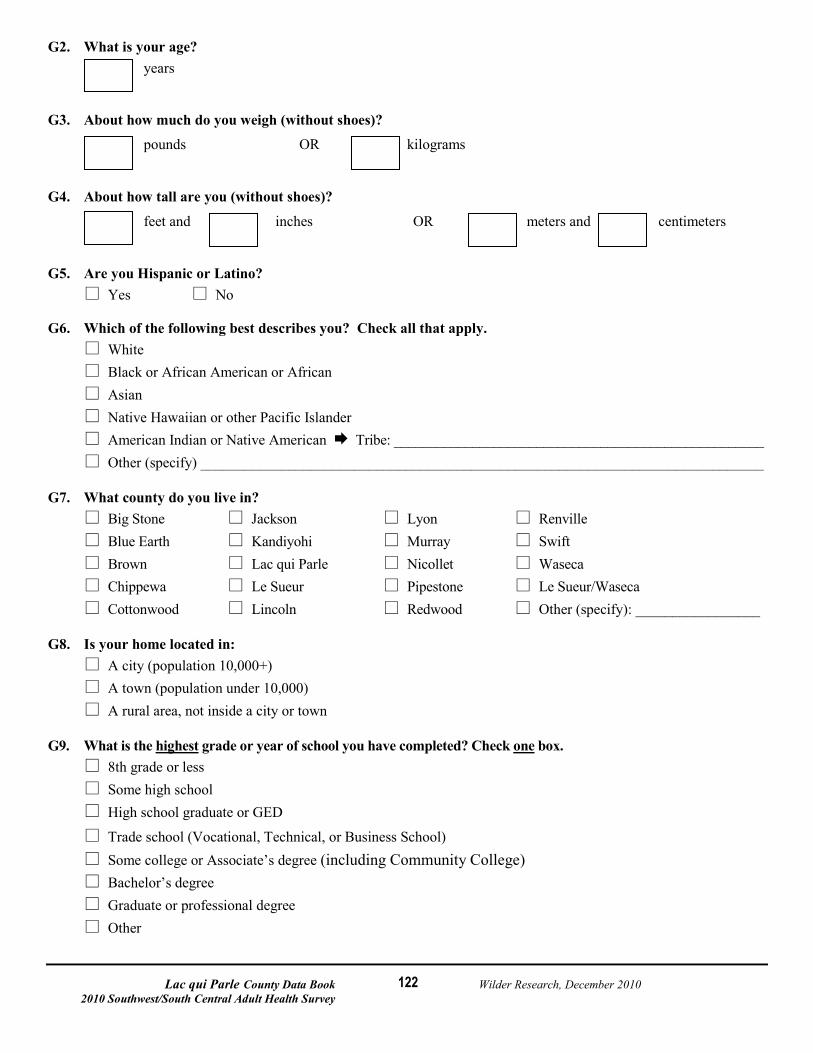
Lac qui Parle County Data Book Wilder Research, December 2010 2010 Southwest/South Central Adult Health Survey
122
G2. What is your age? years G3. About how much do you weigh (without shoes)?
pounds OR kilograms G4. About how tall are you (without shoes)?
feet and inches OR meters and centimeters G5. Are you Hispanic or Latino? Yes No G6. Which of the following best describes you? Check all that apply. White Black or African American or African Asian Native Hawaiian or other Pacific Islander American Indian or Native American Tribe: ____________________________________________________ Other (specify) _____________________________________________________________________________ G7. What county do you live in? Big Stone Jackson Lyon Renville Blue Earth Kandiyohi Murray Swift Brown Lac qui Parle Nicollet Waseca Chippewa Le Sueur Pipestone Le Sueur/Waseca Cottonwood Lincoln Redwood Other (specify): _________________ G8. Is your home located in: A city (population 10,000+) A town (population under 10,000) A rural area, not inside a city or town G9. What is the highest grade or year of school you have completed? Check one box. 8th grade or less Some high school High school graduate or GED
Trade school (Vocational, Technical, or Business School) Some college or Associate’s degree (including Community College) Bachelor’s degree Graduate or professional degree Other
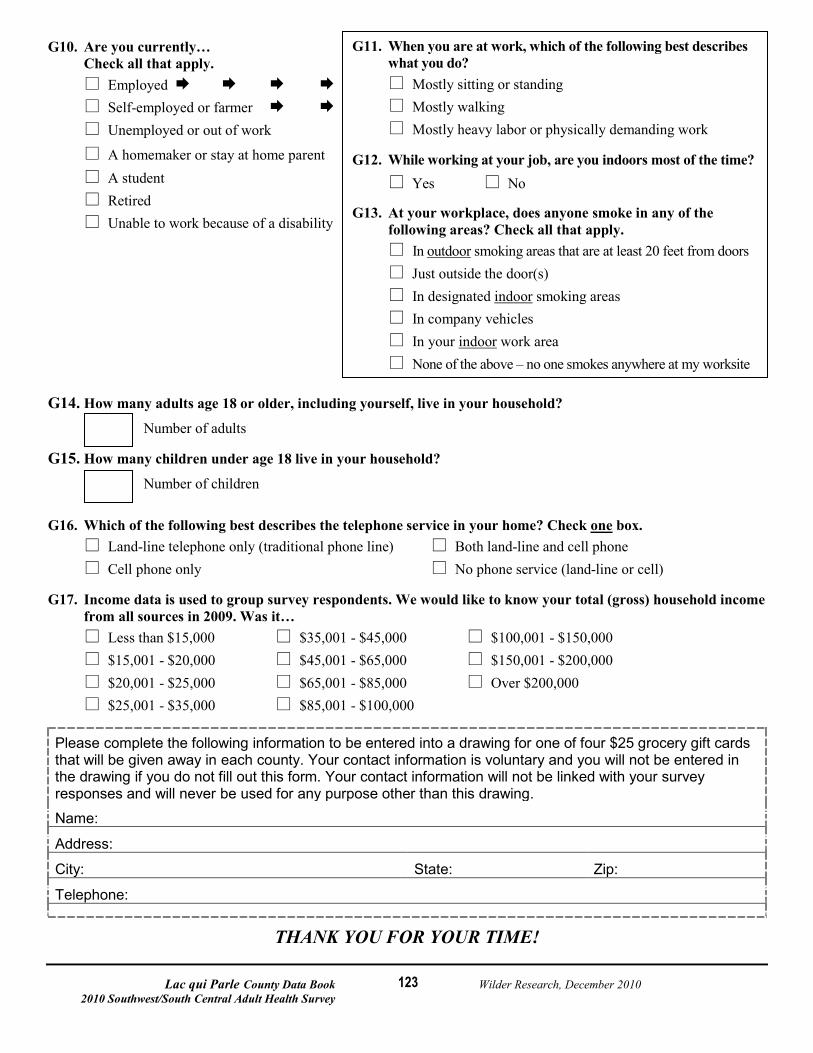
Lac qui Parle County Data Book Wilder Research, December 2010 2010 Southwest/South Central Adult Health Survey
123
G10. Are you currently… Check all that apply. Employed Self-employed or farmer Unemployed or out of work
A homemaker or stay at home parent A student Retired Unable to work because of a disability
G14. How many adults age 18 or older, including yourself, live in your household?
Number of adults G15. How many children under age 18 live in your household?
Number of children G16. Which of the following best describes the telephone service in your home? Check one box. Land-line telephone only (traditional phone line) Both land-line and cell phone Cell phone only No phone service (land-line or cell) G17. Income data is used to group survey respondents. We would like to know your total (gross) household income
from all sources in 2009. Was it… Less than $15,000 $35,001 - $45,000 $100,001 - $150,000 $15,001 - $20,000 $45,001 - $65,000 $150,001 - $200,000 $20,001 - $25,000 $65,001 - $85,000 Over $200,000 $25,001 - $35,000 $85,001 - $100,000
Please complete the following information to be entered into a drawing for one of four $25 grocery gift cards that will be given away in each county. Your contact information is voluntary and you will not be entered in the drawing if you do not fill out this form. Your contact information will not be linked with your survey responses and will never be used for any purpose other than this drawing.
Name:
Address:
City: State: Zip:
Telephone:
THANK YOU FOR YOUR TIME!
G11. When you are at work, which of the following best describes what you do?
Mostly sitting or standing Mostly walking Mostly heavy labor or physically demanding work G12. While working at your job, are you indoors most of the time? Yes No G13. At your workplace, does anyone smoke in any of the
following areas? Check all that apply. In outdoor smoking areas that are at least 20 feet from doors Just outside the door(s) In designated indoor smoking areas In company vehicles In your indoor work area None of the above – no one smokes anywhere at my worksite