Embed Size (px)
Citation preview

adam smith institute – the free-market thinktank23 Great Smith Street, London, SW1P 3DJ+44 (0)20 7222 4995www.adamsmith.org
EXECUTIVE SUMMARY
• Individuals with left-wing and liberal views are overrepresented in British academia. Those with right-wing and conservative views are correspondingly underrepresented. Around 50% of the general public supports right-wing or conservative parties, compared to less than 12% of academics. Conservative and right-wing academics are particularly scarce in the social sciences, the humani-ties and the arts.
• Though relatively little information is available, evidence suggests that the overrepresentation of left-liberal views has increased since the 1960s. The proportion of academics who support the Conservatives may have declined by as much as 25 percentage points since 1964.
• The left-liberal skew of British academia cannot be primarily explained by intel-ligence. The distribution of party support within the top 5% of IQ is relatively similar to the distribution of party support within the general population.
• The left-liberal skew may be partly explained by openness to experience; indi-viduals who score highly on that personality trait tend to pursue intellectually stimulating careers like academia. And within the top 5% of IQ, openness to experience predicts support for left-wing parties.
• Other plausible explanations for left-liberal overrepresentation include: social homophily and political typing; individual conformity; status inconsistency; and discrimination.
• Ideological homogeneity within the academy may have had a number of adverse consequences: systematic biases in scholarship; curtailments of free speech on university campuses; and defunding of academic research by right-wing govern-ments.
• Recommendations include: raising awareness; being alert to double standards; encouraging adversarial collaborations; and emphasizing the benefits of ideo-logical heterogeneity within the academy.
LACKADEMIAWhy Do Academics Lean Left? By Noah Carl
BR
IEFING
PAP
ER

21. INTRODUCTION
It is a strange fact, but it is unquestionably true, that almost any English intellectual would feel more ashamed of standing to attention during ‘God save the King’ than of stealing from a poor box.
-George Orwell, England Your England
As the quote from Orwell indicates, it has been assumed for some time that indi-viduals with left-wing and liberal views are overrepresented in British academia. Indeed, England your England—the source of the quote—was published back in 1941. Seventy-five years on, articles in right-wing newspapers frequently bemoan the academy’s left-liberal skew. James Bartholomew, writing in the Spectator last year, observed the following of former Tanzanian president Julius Nyerere: “it was his country’s misfortune that he read economics and history at Edinburgh… Naturally he was surrounded by leftist academics.” Eleanor Harding, writing in the Daily Mail, noted that “Universities have become breeding grounds for intolerance where anyone challenging left-wing views is ‘shouted down’”. And Allister Heath, writing in The Telegraph, opined as follows: “There was a time when universities set the political agenda; today, too many appear to be mere angry onlookers, giant left-wing content factories with little practical relevance.”
This paper investigates the left-liberal skew of British academia, drawing on evi-dence from polls of academics, the large Understanding Society dataset, and the wider scholarly literature. It begins by defining key terms, and classifying British political parties with respect to a two-axis model of policy positions. It then exam-ines the scale of left-liberal overrepresentation, as well as how it has changed over time. It proceeds to evaluate two prominent explanations for left-liberal overrepre-sentation: first, that academics tend to be left-wing and liberal because of their high intelligence; and second, that they tend to be left-wing and liberal because of their high openness to experience. The paper then reviews other possible explanations for the left-liberal skew. It goes on to discuss various adverse consequences that ideological homogeneity within the academy may have had. The paper concludes by summarising the main points, and offering recommendations to academics and other university gatekeepers.
Before examining the scale of left-liberal overrepresentation, it is necessary to ex-plain what is meant by the terms ‘left-wing’ and ‘right-wing’ and the terms ‘liberal’ and ‘conservative’. While there are no unanimously accepted definitions for these terms, a widely used model of policy positions distinguishes between a left/right economic axis and a liberal/conservative social axis (Carl 2015a)1. The economic axis goes from left-wing or socialist at one end to right-wing or capitalist at the other end, while the social axis goes from liberal and internationalist at one end to con-
1 Kling (2013) has advanced a model of political ideology that demarcates three alternative languages of politics: the progressive language, which frames issues in terms of victimisation versus oppression; the conservative language, which frames issues in terms of civilisation versus barbarism; and the libertarian language, which frames issues in terms of liberty versus coercion. This model, in the author’s opinion, has a large degree of truth to it. However, since it applies to individuals’ underlying justifications rather than to their explicit policy preferences, the conventional two-axis model will be employed here.
3servative and nationalist at the other end. For example, left-wing positions include nationalisation of industry, reduction of income inequality through redistribution, higher taxes, and more regulation over employment; while liberal positions include legal recognition of gay relationships, free speech, higher immigration, and more international cooperation. Note that, according to this model of policy positions, it is possible for someone to be left-wing on economic issues but conservative on social issues, and for someone to be right-wing on economic issues but liberal on social issues. (The latter position, advocated by the Adam Smith Institute itself, is sometimes termed libertarianism, classical liberalism, or neoliberalism).
Of course, in everyday political discourse, people often distinguish simply between the left on the one hand and the right on the other. In such cases, ‘left’ is taken to encompass socially liberal as well as left-wing views, while ‘right’ is taken to encompass socially conservative as well as right-wing views. This broad-brush dis-tinction is somewhat justified, given that the left/right axis and the liberal/con-servative axis independently predict support for the Conservatives (Evans et al. 1996), and that the two axes are associated with one another, at least weakly (Evans & Heath 1995). Indeed, the two main parties in Britain comprise a relatively more left-wing and liberal party, Labour, and a relatively more right-wing and conserva-tive party, the Conservatives. However, there is nothing inevitable about this ar-rangement. For example, the increasingly popular National Front party in France has a platform that combines socially conservative policies on crime and immigra-tion with economically leftist policies on trade and welfare (Shields 2007, Chapter 10). And in China, individuals with socially conservative beliefs are actually more likely to support state control of the economy, and to oppose market-oriented re-forms, than their socially liberal counterparts (Pan & Xu, 2016). In fact, groups that practice internal redistribution are often actively hostile toward outsiders, in order to safeguard their own resources (Weyl 2016). Thus, for the purposes of this paper, the terms ‘left-wing’, ‘right-wing’, ‘liberal’ and ‘conservative’ will be used as outlined above.
It is also necessary, at the outset, to classify the major political parties in Britain with respect to the two-axis model of policy positions. At the last general elec-tion, the six largest parties by vote share were: the Conservatives with 37%, Labour with 30%, UKIP with 13%, the Liberal Democrats (Lib Dems) with 8%, the Scottish National Party (SNP) with 5%, and the Greens with 4%. The Conservatives and UKIP are both right-wing and socially conservative. The Conservatives are prob-ably further right than UKIP, while UKIP are clearly more socially conservative than the Conservatives (Ford & Goodwin 2014). Labour and the Greens are both left-wing and socially liberal. The Greens are typically both more left-wing and more socially liberal than Labour, although this may not be true under Jeremy Cor-byn’s leadership (Dennison 2017). The Lib Dems are a socially liberal, economi-cally centrist party. They are perhaps the most socially liberal party in Britain, with the possible exception of the Greens. Though sometimes classified as centre-left on the economy, from 2007 to 2015 the party was dominated by its classical liberal wing—the so-called Orange Bookers—who advocated market solutions to many societal problems (Marshall & Laws 2004).

4 2. LEFT-LIBERAL OVERREPRESENTATION IN BRITISH ACADEMIA Relatively little good evidence is available on the political views of British academics. Nonetheless, that which are available point to a sizable left-liberal skew2. In April of 2015, the Times Higher Education (THE) ran an online poll open to anyone with a UK university email address, which asked respondents whom they intended to vote for in the upcoming election: 46% said Labour, 22% said Green, 11% said the Conservatives, 9% said the Lib Dems, 6% said the SNP, 1% said Plaid Cymru, and 5% said other or that they did not intend to vote; only 0.4% said UKIP. It should be noted that these figures correspond to all respondents with a university email address, which includes some professional and support staff, as well as academics themselves. Indeed, in an article describing the results of the poll, the THE reported that, among academics, support for Labour was 45% and support for the Conservatives was 8%. However, since it did not give figures for the remaining parties, this paper focuses on the overall percentages, assuming them to be approximately representative of academia as a whole3. If anything, utilising the overall percentages understates the academy’s left-liberal skew. It should also be noted that this poll was self-selecting. For further details about the data and statistics used in this paper, see the Methodological Appendix. Relative to the outcome of the last general election then, British academia shows a considerable left-liberal skew. At least 50% of the general public voted for right-wing or conservative parties in 2015, compared to less than 12% of academics. Since the distribution of party support in the general election reflects the views of only those who turned out to vote, rather than all those eligible to vote, it is not a completely accurate representation of views within the population at large: evidence suggests that Labour supporters were less likely to turnout than Conservative ones (Mellon & Prosser 2015). It is nonetheless accurate enough for a meaningful comparison with the poll of academics (see also Table 3 in the next section). Interestingly, and consistent with evidence from the United States (Carl 2015b), left-liberal overrepresentation varies systematically across subject areas: the percentage of respondents supporting the Conservatives was highest in business and law (though still less than 20%), was low in the social sciences (at less than 10%), and was lowest of all in the humanities and arts (at less than 5%). Furthermore, in June of 2016, the THE ran another online poll of university staff, which asked respondents how they planned to vote in the upcoming EU referendum: 89% of respondents said they planned to vote Remain, while only 10% said they planned to vote Leave. Although Leave was advocated by some prominent self-identified liberals (Hannan 2016), Remain was arguably the more liberal position in the sense that, for the vast majority of people, it connoted higher immigration, more openness and greater international co-operation. Of
2 Note that there is also a large and well-documented left-liberal skew in American academia (Carl 2015b; Solon 2014; Gross 2013).
3 The author emailed the THE in an attempt to obtain figures on academics’ support for the parties other than Labour and the Conservatives, but they were not forthcoming.

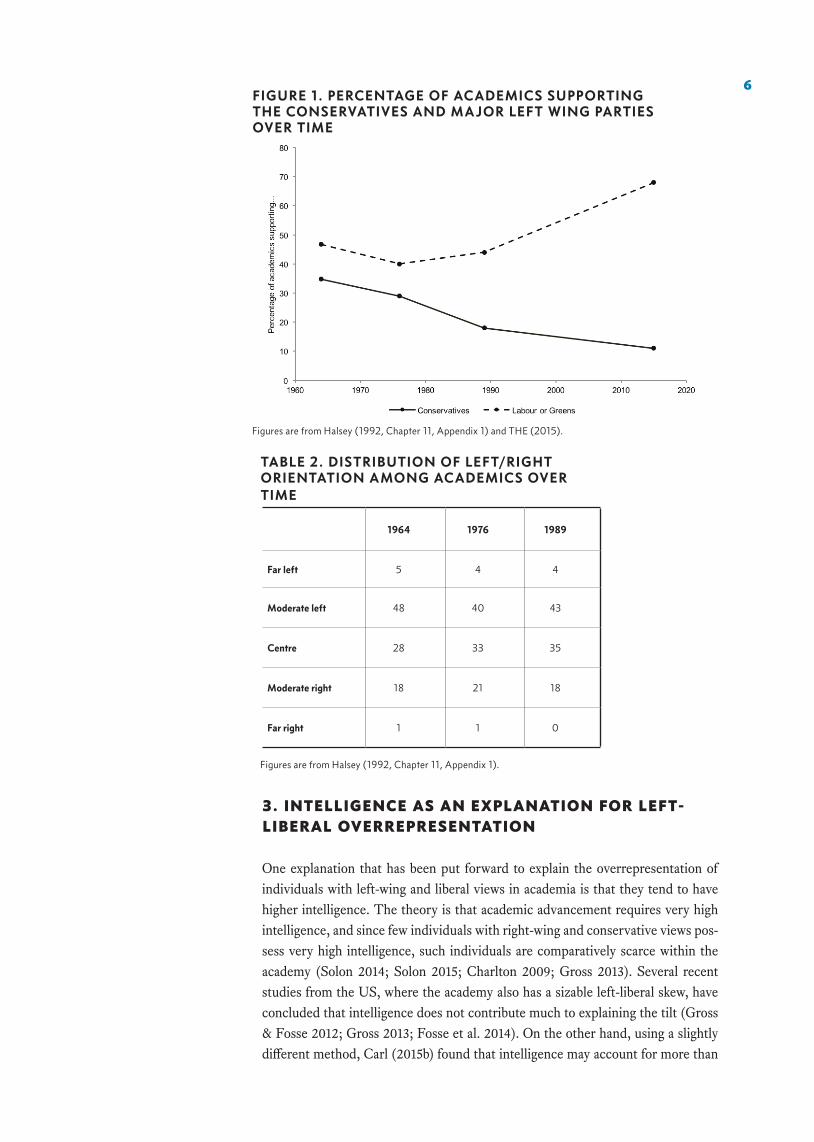
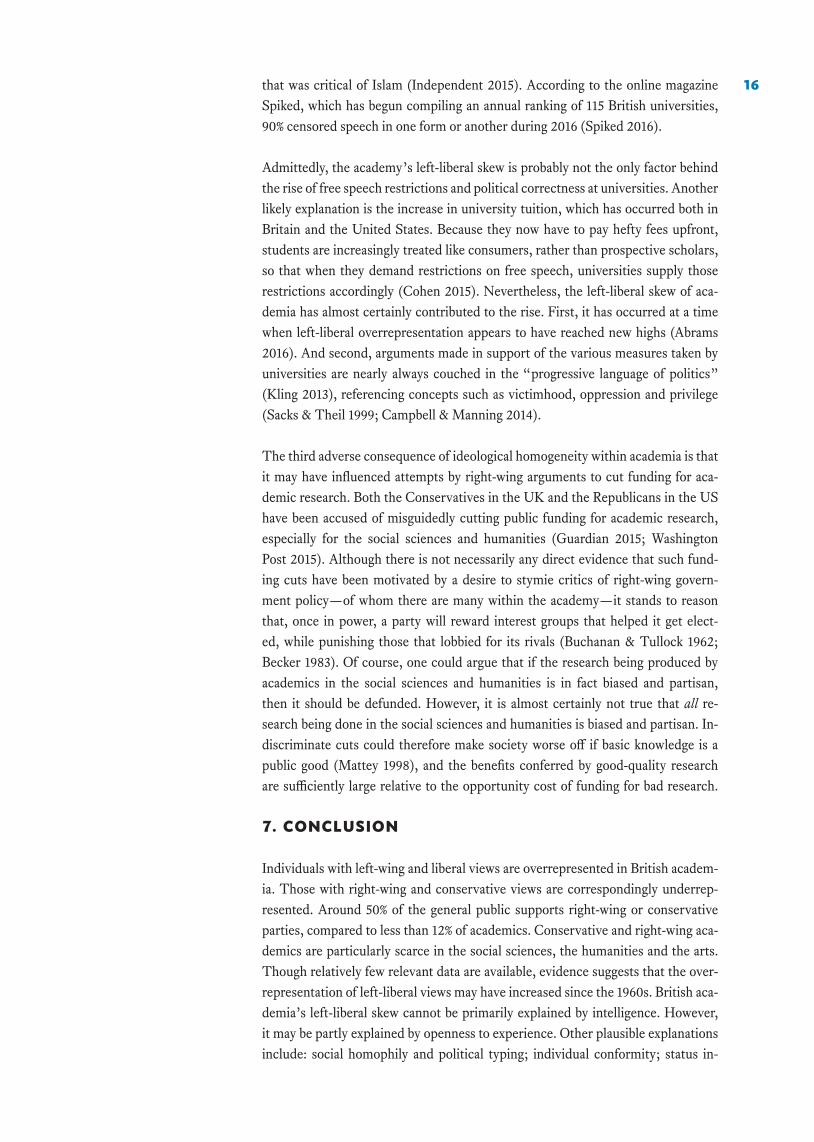
5course, in the referendum itself, 52% of voters opted for the more conservative position, Leave, a difference with academics of nearly 40 percentage points. Is there evidence that the political views of academics have changed over time? The Sociologist A.H. Halsey surveyed British academics in three different time periods, in each case asking about their party preferences. His figures are displayed in Table 1, along with the results of the 2015 THE poll. To the extent that these figures can be meaningfully compared, they show a gradual decline in support for the Conservatives over the last half century, and a concomitant rise in support for the Greens, particularly since 1990. The divergence of academics from the general public along the left/right axis is depicted more clearly in Figure 1. It is important to be aware that Halsey sampled his respondents differently to the THE, and posed a slightly different question, which means the comparison over time should be treated with a certain amount of caution. Furthermore, Halsey also asked academics about left/right self-placement, and in that case observed very little change over time, as shown in Table 2. However, left/right self-placement is a rather unsatisfactory measure, since it conflates the economic and social axes, and likely does so differentially from one time period to the next.
1964 1976 1989 2015
Conservative 35 29 18 11
Labour 47 40 37 46
Lib Dem/ Liberal/ SDP
17 27 35 9
Greens 0 0 7 22
Other 1 4 3 12
Figures for 1964, 1976 and 1989 are from Halsey (1992, Chapter 11, Appendix 1). Note that each figure for 1964 was divided by 92 and multiplied by 100 because for the years 1976 and 1989 Halsey excluded respondents answering ‘None’ when calculating percentages, but did not do so for the year 1964 (when 8 per cent answered ‘None’). The Figures for 2015 are from THE (2015).
TABLE 1. DISTRIBUTION OF PARTY SUPPORT AMONG ACADEMICS OVER TIME
6
1964 1976 1989
Far left 5 4 4
Moderate left 48 40 43
Centre 28 33 35
Moderate right 18 21 18
Far right 1 1 0
3. INTELLIGENCE AS AN EXPLANATION FOR LEFT-LIBERAL OVERREPRESENTATION
One explanation that has been put forward to explain the overrepresentation of individuals with left-wing and liberal views in academia is that they tend to have higher intelligence. The theory is that academic advancement requires very high intelligence, and since few individuals with right-wing and conservative views pos-sess very high intelligence, such individuals are comparatively scarce within the academy (Solon 2014; Solon 2015; Charlton 2009; Gross 2013). Several recent studies from the US, where the academy also has a sizable left-liberal skew, have concluded that intelligence does not contribute much to explaining the tilt (Gross & Fosse 2012; Gross 2013; Fosse et al. 2014). On the other hand, using a slightly different method, Carl (2015b) found that intelligence may account for more than
Figures are from Halsey (1992, Chapter 11, Appendix 1) and THE (2015).
Figures are from Halsey (1992, Chapter 11, Appendix 1).
FIGURE 1. PERCENTAGE OF ACADEMICS SUPPORTING THE CONSERVATIVES AND MAJOR LEFT WING PARTIES OVER TIME
TABLE 2. DISTRIBUTION OF LEFT/RIGHT ORIENTATION AMONG ACADEMICS OVER TIME

7half of the overrepresentation of socially liberal views, but may not account for any of the overrepresentation of economically left-wing views. His finding is consist-ent with evidence that cognitive ability is positively related to both socially liberal beliefs and at least some measures of economically right-wing beliefs (Carl 2015a).
Unfortunately, there do not appear to have been any surveys of British academ-ics asking about specific policy issues, either economic (e.g., nationalisation of in-dustry) or social (e.g., immigration). Only the distribution of party support among academics is available, which as noted above points to an overrepresentation of both left-wing views and liberal views. To see whether intelligence contributes to explaining the left-liberal skew of party support among academics, I calculated the distribution of party support for individuals within the top 5% of IQ4 , using data from the Understanding Society survey. This is shown in Table 3, along with the distribution of party affiliation within the general population and among academ-ics, also calculated from the Understanding Society data. Note that the distribution within the general population differs from the outcome of the general election; this is probably due to the phrasing of the question posed in Understanding Society, to the sample being slightly unrepresentative, to the timing of the data collection, and to differential turnout by party. However, what is of primary interest is the comparison between the figures for the general population and those for the top 5% of IQ, which were both calculated from the same data. Conservative supporters are about as well represented within the top 5% of IQ as they are within the general population, Labour supporters are slightly underrepresented, UKIP supporters are underrepresented, Lib Dem supporters are overrepresented, and Green supporters are overrepresented.
Overall, as Figure 2 illustrates, the distribution of left/right orientation within the top 5% of IQ is relatively similar to the distribution within the general popu-lation. While intelligence may account for some of the underrepresentation of UKIP supporters among academics, and some of the overrepresentation of Green supporters (Deary et al. 2008), it cannot account for the substantial underrepre-sentation of Conservative supporters. To the extent that the Conservatives are a less socially conservative party than UKIP, the figures in Table 3 are consistent with Carl’s (2015b) finding that intelligence may contribute to explaining the underrepresentation of socially conservative views in American academia, but not necessarily the underrepresentation of economically right-wing views. Somewhat surprising is the relative scarcity of Lib Dem supporters among academics, given their overrepresentation within the top 5% of IQ. This may be attributable to the fact that, as noted above, the Lib Dem party was until recently dominated by its classically liberal wing, which espoused comparatively more right-wing policies, which may not have been appealing to academics. On the other hand, it may sim-ply be due to sampling error.
4 The top 5% of IQ equates to a mean IQ of 127. This is 1.8 standard deviations above the population mean, and is in line with estimates of the average IQ of academics that have been reported in the scholarly literature (Carl, 2015b).

8
AcademicsGeneral
populationTop 5% of IQ
Conservatives 11 35 36
Labour 46 40 35
UKIP <1 7 3
Lib Dems 9 8 14
Greens 22 3 7
SNP 6 3 3
Other 6 4 3
FIGURE 2. DISTRIBUTION OF PARTY SUPPORT AMONG ACADEMICS, THE GENERAL POPULATION AND COGNITIVE ELITES
Figures are for 2015. Figures for academics are from THE (2015). Figures for the general population and cognitive elites. were calculated by the author using data from Understanding Society (University of Essex, 2015). For further details, see the Methodological Appendix.
TABLE 3: PERCENTAGES OF ACADEMICS, THE GENERAL POPULATION AND COGNITIVE ELITES SUPPORTING MAJOR RIGHT-WING PARTIES AND LEFT WING PARTIES
Notes: Figures are for 2015. Figures for academics are from THE (2015). Figures for the general population and cognitive elites were calculated by the author using data from Understanding Society (University of Essex, 2015). For further details, see the Methodological Appendix.

94. OPENNESS TO EXPERIENCE AS AN EXPLANATION FOR LEFT-LIBERAL OVERREPRESENTATION
Another explanation that has been put forward to explain the overrepresentation of individuals with left-wing and liberal views in academia is that they tend to score higher on the personality trait openness to experience (Duarte et al. 2014). Open-ness to experience, or just openness, is one of the five traits postulated by the five-factor model of personality. People high on openness are more artistic, creative and intellectually curious, and tend to prefer novelty and variety over familiarity and sameness. As a consequence, they may be predisposed toward intellectually stimulating careers, such as academia (McCrae 1996; Woessner & Kelly-Woessner 2009). At the same time, evidence from a variety of countries indicates that indi-viduals high on openness are more likely to support left-wing and liberal parties (Gerber et al. 2011; Schoen & Schumann 2007; Ackermann et al. 2016). However, to the author’s knowledge, no direct evidence that openness predicts left-liberal views within the right tail of intelligence—i.e., the sub-population from which aca-demics are selected—has been presented in the scholarly literature.
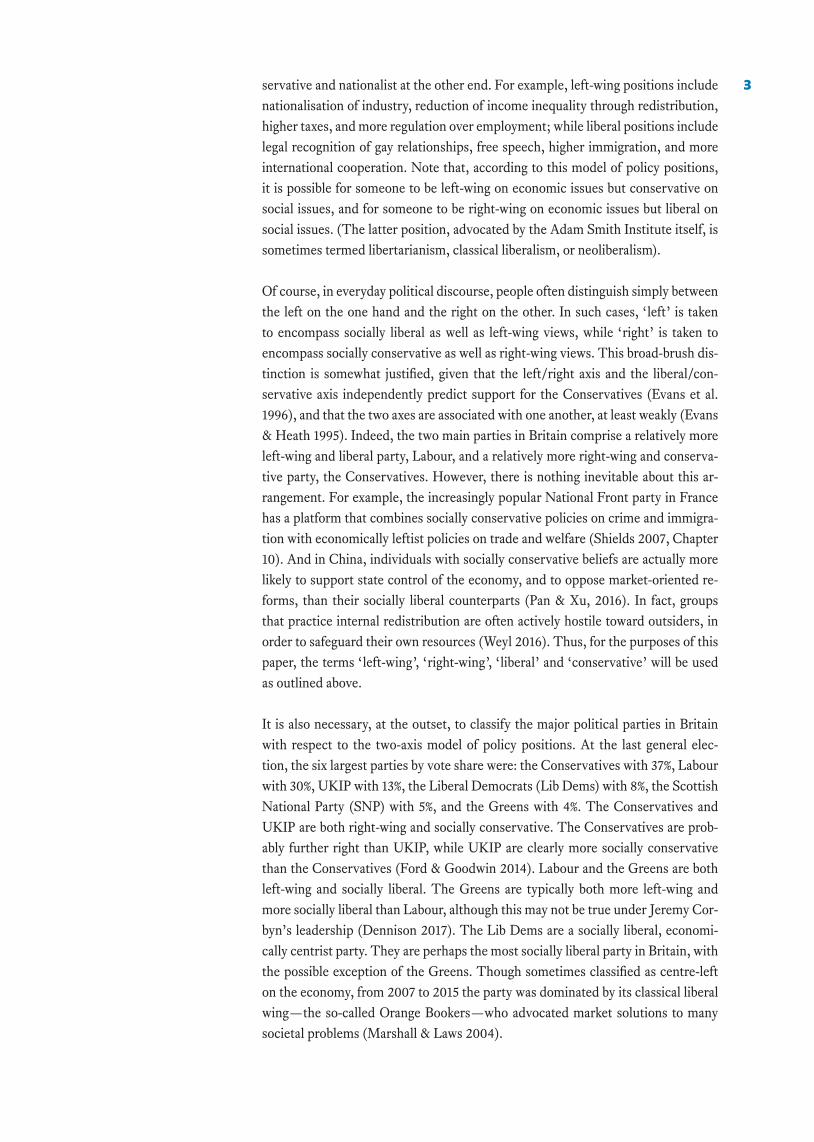
To see whether openness contributes to explaining the left-liberal skew of party support among academics, I calculated the distribution of party support for indi-viduals within the top 5% of IQ and the top 20% of openness, and for those within the top 5% of IQ and the bottom 20% of openness, using data from the Understand-ing Society survey. This is shown in Table 4, along with the distribution of party support among academics. Within the top 5% of IQ, Labour supporters, Lib Dem supporters and Green supporters are all better represented within the top 20% of openness than within the bottom 20% of openness; by contrast, Conservative sup-porters are better represented within the bottom 20% of openness. Unexpectedly, UKIP supporters are better represented within the top 20% of openness, but this is probably attributable to sampling error.
Overall, as Figure 3 illustrates, the distribution of left/right orientation within the top 5% of IQ and the top 20% of openness is much closer to the distribution among academics than is the distribution within the top 5% of IQ and the bottom 20% of openness. Of course, the top and bottom quintiles of openness are somewhat arbitrary categories; they were chosen based on a trade-off between extremity of contrast and availability of observations. To gauge the association between openness and party support more precisely, Table 5 displays estimates from linear probability models of support for major right-wing and left-wing parties within the top 5% of IQ. The estimates in the first and second columns imply that, for each one standard deviation5 increase in openness, the probability that an indi-vidual supports a major right-wing party, rather than any other party, decreases by 8–9 percentage points. The estimates in the third and fourth columns imply that, for each one standard deviation increase in openness, the probability that an individual supports a major left-wing party, rather than any other party, increases
5 The standard deviation is a metric that quantifies how spread out the data are around the mean. A useful rule is that 68% of the data are expected to lie within +/– 1 standard deviation of the mean, and 95% are expected to lie within +/– 2 standard deviations of the mean.

10by 8 percentage points. Statistically controlling for the respondent’s age, gender and race does not appear to affect the estimates.
AcademicsTop 5% of IQ, top 20% of openness
Top 5% of IQ, bottom 20% of openness
Conservatives 11 27 49
Labour 46 39 30
UKIP <1 3 0
Lib Dems 9 17 12
Greens 22 10 4
SNP 6 2 4
Other 6 2 2
TABLE 4. DISTRIBUTION OF PARTY SUPPORT AMONG ACADEMICS, COGNITIVE ELITES WITH HIGH OPENNESS AND COGNITIVE ELITES WITH LOW OPENNESS
Figures are for 2015. Figures for academics are from THE (2015). Figures for the general population and cognitive elites were calculated by the author using data from Understanding Society (University of Essex, 2015). For further details, see the Methodological Appendix.
FIGURE 3. PERCENTAGES OF ACADEMICS, COGNITIVE ELITES WITH HIGH OPENNESS AND COGNITIVE ELITES WITH LOW OPENNESS SUPPORTING MAJOR RIGHT-WING AND LEFT-WING PARTIES
Figures are for 2015. Figures for academics are from Times Higher Education (2015). Figures for the general population and cognitive elites were calculated by the author using data from Understanding Society (University of Essex, 2015). For further details, see the Methodological Appendix.

11
Support Conservatives
or UKIP
Support Conservatives
or UKIP
Support Labour
or Green
Support Labour
or Green
Openness (z-score)
-0.08*** -0.09*** 0.08*** 0.08***
Age, gender, race yes yes
Unweighted n 1070 1062 1070 1062
5. OTHER EXPLANATIONS FOR LEFT-LIBERAL OVER-REPRESENTATION
It seems unlikely that intelligence and openness can by themselves explain all the overrepresentation of left-liberal views in academia.6 And indeed, a number of oth-er explanations have been put forward in the scholarly literature (Gross 2013; Carl 2015b). First, it has been argued that conservatives exhibit a cognitive style that makes them ill-suited for scholarly endeavour, namely an inflexible predilection for certainty and corresponding aversion to novelty and ambiguity (Mooney 2012). Aside from there being considerable evidence that individuals with left-wing and liberal views are no less prone to biases in their analytical reasoning than their right-wing and conservative counterparts (Carl 2015b, p.188), exhibiting a predilection for certainty could be actively beneficial in areas like set theory, epistemology and aeronautical engineering, yet in these areas conservatives are still underrepresent-ed. For example, an experimental study widely reported in the British press found that conservatives were much less likely than liberals to say that an almost circular shape was in fact a circle (Okimoto & Gromet 2015). In mathematics, being able to recognise the subtle distinctions between one object and another object very similar is an essential skill.
Second, self-selection into academia by those with left-liberal views may have been amplified by processes of social homophily and political typing (Gross, 2013). So-cial homophily refers to the tendency for individuals to associate with those who share their characteristics. Political typing refers to the tendency for certain oc-cupations to develop a reputation as being suitable for either liberals or conserva-tives, just as certain occupations have developed a reputation as being suitable for either men or women. The American senior military brass, for example, appears to be overwhelmingly conservative (Carl 2015b, p.188). Logically of course, neither
6 Much of this section is paraphrased or directly quoted from Carl (2015b). Please see that source for more references and additional detail.
TABLE 5. LINEAR PROBABILITY MODELS OF SUPPORT FOR MAJOR RIGHT WING AND LEFT WING PARTIES AMONG COGNITIVE ELITES
The sample comprises individuals in the top 5% of IQ. *** denotes statistical significance at the 0.1% level. Analyses were conducted by the author using data from Understanding Society (University of Essex, 2015). For further details, see the Methodological Appendix.

12social homophily nor political typing can explain the initial left-liberal skew that would have been required for the two processes to get started. One obvious pos-sibility is that the initial skew came about via self-selection on either intelligence or personality.
Third, academics may become more left-wing and liberal as a consequence of ex-posure to prevailing attitudes, values and mores within the academy. Individuals who enter academia as conservatives or rightists may gradually (or even rapidly) reorient their views toward the left-liberal majority viewpoint due to some combi-nation of concerns over funding and promotion, peer pressure from colleagues, or simply a willingness to conform. As in the cases of social homophily and political typing, conformity to the majority viewpoint cannot logically explain the majority viewpoint itself; again, one would have to invoke self-selection on intelligence or personality to account for the initial left-liberal skew.
Fourth, the left-liberal leanings of academics may derive from a peculiarity of their social-class positions, namely that they receive low incomes relative to their ad-vanced educational attainment and rich cultural capital (Gross, 2013). The closer that society gets to laissez-faire capitalism, the more status, power and influence will be tied to individuals’ earnings and commercial achievements, and the less academics will earn relative to those in other occupations vying for social influ-ence (lawyers, doctors, managers etc.). Consequently, academics generally prefer policies that minimise differences in earnings across occupations, the better to safeguard their own influence. According to some versions of this hypothesis, aca-demics embrace non-traditional social attitudes (such as espousing unconventional family arrangements) purely in order to differentiate themselves from members of the bourgeoisie.
Fifth, there is growing evidence from the US that those with right-wing and conservative views are discriminated against in the processes of hiring, funding and promotion. When Inbar and Lammers (2012) conducted a political survey of social psychologists, a considerable number of respondents admitted that they would discriminate against conservative academics in paper and grant reviews, symposium initiations, and hiring decisions. Moreover, 82% of the 17 conservative respondents felt there was a hostile climate towards their political beliefs within the field, compared to just 7% of the 266 liberal respondents. In a replication study, Honeycutt & Freburg (2016) found that conservative and liberal academ-ics were similarly willing to discriminate against their ideological counterparts, but that conservative academics reported experiencing more hostility than liberal ones.7 Similarly, almost a third of the sociologists interviewed by Yancey (2011) stated that they would disfavour hiring a Republican, while a comparable fraction said they would look favorably upon a prospective candidate’s membership of the ACLU (a socially liberally non-profit organization). In addition, Phillips (2016) found that conservative and libertarian law professors, despite being underrepre-sented in the American legal academy, produce more publications and are cited
7 Since 85% of the academics in their sampled identified as liberal, whereas only 6% identified as conservative, the net effect of discriminatory tendencies among academics is a large anti-conservative bias.

13more often than their left-wing and liberal counterparts, which suggests that they are held to a higher standard by university gatekeepers. On the other hand, Fosse et al. (2014) conducted a matched-CV study of graduate study directors, and found little evidence of discrimination against students who mentioned volunteer-ing for the Republican John McCain’s presidential campaign. Yet other scholars have argued that various aspects of Fosse et al. (2014) methodology militated against them detecting any overt, discriminatory behavior (Tetlock & Mitchell, 2015, p.29). 6. ADVERSE CONSEQUENCES OF IDEOLOGICAL HO-MOGENEITY The left-liberal skew of British academia, and consequent ideological homogene-ity, may have had a number of adverse consequences. One, it has arguably led to systematic biases in scholarship (Scruton, 1985). Two main forms of bias are evident. First, in subjects like psychology and sociology, scientific theories have become imbued with left-liberal values. In a long review article titled ‘Political Diversity Will Improve Social Psychological Science’, Duarte et al. (2014) supply several examples of where scholars have equated rejecting left-liberal values to denying objective facts. One study characterised respondents who agreed with statements such as, “the earth has plenty of natural resources if we just learn how to develop them” as “denying environmental realities”. Another study character-ised respondents who disagreed with the statement, “hard work doesn’t generally bring success—it’s more a matter of luck” as “rationalising inequality”. On this point, it is worth quoting Duarte et al. (2014):
Imagine a counterfactual social psychology field in which conservative political views were treated as “scientific facts” and disagreements with conservative views treated as denial or error. In this field, scholars might regularly publish studies on “the denial of the benefits of free market capitalism” or “the denial of the benefits of a strong military” or “the denial of the benefits of church attendance”.
In another review article titled ‘How Ideology Has Hindered Sociological Insight’, Martin (2015) provides some telling examples from sociology. For instance, the term ‘white privilege’ has gained currency within the field as a label for the putative unearned advantages that whites enjoy in virtue of their skin-colour and majority status. However, as Martin (2015) notes, by referring to white privilege in particu-lar, the term erroneously implies that whites are advantaged relative to all other groups. Whereas in actual fact, Asian Americans are more advantaged than whites along a number of important sociological dimensions: they have higher average incomes, better educational outcomes, and a lower likelihood of crime victimisa-tion. In addition, Martin (2015) points out that much of the vocabulary in sociology is not ideologically neutral; terms used to describe features of society that liberals tend to oppose, but which conservatives might support, typically have negative connotations:

14Sociologists speak of constraints, as though people were physically fenced in; they speak of social controls, as though some entity manipulated people; and they speak of social structure, as though people could be located inside a physical edifice. These linguistic devices are useful, but being metaphors, they also have limitations… What if we described society as comprehensible (constrained) rather than overwhelming (un-constrained), as shaped (structured) rather than formless (unstructured), as predict-able (with social control) rather than volatile (without social control), and as ordered (hierarchical) rather than anarchic (equal)?
The second main form of bias is that areas of research deemed politically unpalat-able by left-liberal academics have been ignored, mischaracterised or even angrily expostulated. Textbooks in organisational behaviour devote twice as many para-graphs to emotional intelligence than to general intelligence (i.e., cognitive ability), despite the fact that the latter predicts organisational success far more strongly than the former (Pesta et al., 2015). Introductory economics textbooks give market failure six times as much coverage as government failure, and only half acknowl-edge the presence of government failure at all (Fike & Gwartney, 2015). The field of evolutionary psychology, which postulates that some aspects of human behav-iour (e.g., higher male aggression, greater female empathy) can be understood as evolutionary adaptations, is persistently mischaracterised by sociologists of sex and gender (Winegard et al., 2014; Stern, 2016). In social psychology, preemi-nent researchers frequently assert that people’s everyday stereotypes are wildly inaccurate, despite overwhelming evidence to the contrary ( Jussim, 2012). And in psychometrics, theories relating to group differences in intelligence are often rejected on explicitly moral grounds, for example that they might be misused by racists (Cofnas, 2016).
Furthermore, there is a long history of witch-hunts against scholars seen to be promoting politically incorrect ideas, i.e., those antithetical to left-liberal values (Pinker 2002; Nyborg 2011). Following the publication of his book ‘Sociobiology’, which applied concepts from evolutionary biology to human society and culture, E.O. Wilson was slandered by fellow academics for attempting to justify genocide, and subjected to a campaign of harassment by irate student activists: defamato-ry leaflets were handed out, his lectures were invaded, and one occasion he was doused with a pitcher of water (Pinker 2002). When Napoleon Chagnon published a treatise documenting the high levels of inter-group violence among the Yanoma-mo people of Amazonia, other anthropologists publicly accused him of fabricating data, stirring up violence himself, and even deliberately infecting the Yanomamo with measles (Pinker 2002). After Lawrence Summers entertained the hypothesis that higher male variance in intelligence might help to explain the overrepresenta-tion of men in STEM subjects, he was denounced by colleagues and commentators nationwide as a sexist; the condemnation proved so severe that he was eventually forced to resign as a president of Harvard (Nyborg 2011). When Charles Murray published his book the ‘The Bell Curve’, which, in one chapter discussed studies of race differences in intelligence, he was roundly excoriated for allegedly trying to

15demonstrate that blacks were genetically inferior to whites, an accusation that is still levelled at him 20 years later (Winegard & Winegard 2016).8
As numerous scholars have noted, social settings characterised by too little di-versity of viewpoints are liable to become afflicted by groupthink, a dysfunctional atmosphere where key assumptions go unquestioned, dissenting opinions are neu-tralized, and favored beliefs are held as sacrosanct (Park 1990; Klein & Stern 2009; Haidt 2012). In a working paper titled ‘A social science without sacred values’, Winegard and Winegard (2016) go as far to suggest that a substantial number of academic social scientists have become “paranoid egalitarian meliorists”: indi-viduals who espouse a narrative in which society progresses ever closer toward a state of natural equality (between the genders, classes, races etc.), and who are hypersensitive to any scholarship that might threaten the intellectual foundations of this narrative.
It should be recognised, of course, that all the evidence of bias cited above is from the social sciences; the physical sciences and mathematics do not appear to have been afflicted by ideological homogeneity in the same way. This is perhaps not sur-prising, however, given the objective nature of the physical sciences and mathemat-ics, as well as the obvious fact that the social sciences relate directly to the sphere with which politics itself is concerned, namely human behaviour and society. Hav-ing said that, it is worth reemphasising that the social sciences—especially soci-ology, cultural anthropology and social psychology—are among the subject areas generally found to have the lowest representation of right-wing and conservative academics (Carl 2015b; THE 2015).
The second adverse consequence of ideological homogeneity within academia has been the trend toward increasing curtailments of free speech on university cam-puses (Browne 2006; Hume 2015; Pinker 2015). As numerous commentators have catalogued, over the last few years there has been an explosion of efforts to restrict the ability of individuals within the scholarly community to speak freely and ex-change ideas openly. Many US colleges have adopted full-blown speech codes: doc-uments that outline, sometimes in intricate detail, what sort of statements are and are not permissible on campus. According to the University of California speech code, for example, seemingly innocuous statements such as “America is a land of opportunity” constitute harmful micro-aggressions that should be avoided for fear that they might insult women or ethnic minorities (LA Times 2015). On both sides of the Atlantic, lecturers have begun issuing so-called trigger warnings before they discuss potentially upsetting material. Reportedly, law students at the University of Oxford were warned that they might find the content of lectures about sexual of-fences distressing, and were given the opportunity to leave beforehand (Daily Mail 2016). Another concerning development is the rise of no-platforming, where activ-ists insist that speakers not be given a public platform to make potentially offensive arguments. Maryam Namazie was interrupted, heckled and ultimately prevented from speaking by students at Goldsmiths University when she came to give a talk
8 Other scholars who have been attacked on moralistic grounds include: Cyril Burt, Arthur Jensen, J.P. Rushton, Raymond Cattell, James Watson, Hans Eysenck, Helmuth Nyborg, Michael Bailey, Richard Lynn, Richard Herrnstein, Satoshi Kanazawa, Richard Dawkins, and James Neel.
16that was critical of Islam (Independent 2015). According to the online magazine Spiked, which has begun compiling an annual ranking of 115 British universities, 90% censored speech in one form or another during 2016 (Spiked 2016).
Admittedly, the academy’s left-liberal skew is probably not the only factor behind the rise of free speech restrictions and political correctness at universities. Another likely explanation is the increase in university tuition, which has occurred both in Britain and the United States. Because they now have to pay hefty fees upfront, students are increasingly treated like consumers, rather than prospective scholars, so that when they demand restrictions on free speech, universities supply those restrictions accordingly (Cohen 2015). Nevertheless, the left-liberal skew of aca-demia has almost certainly contributed to the rise. First, it has occurred at a time when left-liberal overrepresentation appears to have reached new highs (Abrams 2016). And second, arguments made in support of the various measures taken by universities are nearly always couched in the “progressive language of politics” (Kling 2013), referencing concepts such as victimhood, oppression and privilege (Sacks & Theil 1999; Campbell & Manning 2014).
The third adverse consequence of ideological homogeneity within academia is that it may have influenced attempts by right-wing arguments to cut funding for aca-demic research. Both the Conservatives in the UK and the Republicans in the US have been accused of misguidedly cutting public funding for academic research, especially for the social sciences and humanities (Guardian 2015; Washington Post 2015). Although there is not necessarily any direct evidence that such fund-ing cuts have been motivated by a desire to stymie critics of right-wing govern-ment policy—of whom there are many within the academy—it stands to reason that, once in power, a party will reward interest groups that helped it get elect-ed, while punishing those that lobbied for its rivals (Buchanan & Tullock 1962; Becker 1983). Of course, one could argue that if the research being produced by academics in the social sciences and humanities is in fact biased and partisan, then it should be defunded. However, it is almost certainly not true that all re-search being done in the social sciences and humanities is biased and partisan. In-discriminate cuts could therefore make society worse off if basic knowledge is a public good (Mattey 1998), and the benefits conferred by good-quality research are sufficiently large relative to the opportunity cost of funding for bad research. 7. CONCLUSION
Individuals with left-wing and liberal views are overrepresented in British academ-ia. Those with right-wing and conservative views are correspondingly underrep-resented. Around 50% of the general public supports right-wing or conservative parties, compared to less than 12% of academics. Conservative and right-wing aca-demics are particularly scarce in the social sciences, the humanities and the arts. Though relatively few relevant data are available, evidence suggests that the over-representation of left-liberal views may have increased since the 1960s. British aca-demia’s left-liberal skew cannot be primarily explained by intelligence. However, it may be partly explained by openness to experience. Other plausible explanations include: social homophily and political typing; individual conformity; status in-
17consistency; and discrimination. Ideological homogeneity within the academy may have had a number of adverse consequences: systematic biases in scholarship, es-pecially in the social sciences; curtailments of free speech on university campuses; and defunding of academic research by right-wing governments.
What, if anything, should be done about the British academy’s left-liberal skew? First, it is important to simply raise awareness about the phenomenon. In social settings where dissenting opinions have been all but weeded out, most individuals may not be cognizant of large disparities of representation, and those that are may not see them as troubling. Second, academics—in their capacities as researchers, reviewers and journal editors—should be alert to double standards. As Duarte et al. (2014) note, “findings that are at odds with liberal values are at risk of being judged more harshly than they deserve; findings that support liberal values are at risk of being waived through without sufficiently critical review”. Third, aca-demics should embrace adversarial collaborations. For example, if one researcher believes the evidence supports a left-wing policy position and another believes it supports a right-wing policy position, the two could co-write a paper in which they sought to resolve their dispute. In the same vein, scholars should encourage one another to take what economist Bryan Caplan calls the Ideological Turing Test: a liberal answers questions posing as a conservative (or vice versa), and if impar-tial judges cannot tell the difference between his answers and those of a genuine conservative, he is said to correctly understand the opposing viewpoint. Fourth, university gatekeepers, along with sympathetic minded academics, should empha-size the benefits of ideological heterogeneity within the academy. These include: greater public trust in scholarly expertise; a bulwark against groupthink; and more alternative perspectives and ways of conceptualizing a problem. Universities often take great pains to point out their commitment to diversity with respect to gender, class and race; going forward, they would be wise not to eschew political diversity. REFERENCES
Abrams, S. (2016). Professors moved left since 1990s, rest of country did not. Het-erodox Academy.
Ackermann, K., Ackermann, M. & Freitag, M. (2016). Opting for an open society? Personality traits and attitudes toward the openness of Switzerland. Comparative European Politics, 0, 1–21.
Becker, G.S. (1983). A Theory of Competition Among Pressure Groups for Politi-cal Influence. The Quarterly Journal of Economics, 98, 371–400.
Browne, A. (2006). The Retreat of Reason: Political Correctness and the Corrup-tion of Public Debate in Modern Britain. Civitas: The Institute for the Study of Civil Society.
Buchanan, J.M. & Tullock, G. (1962). Calculus of Consent: Logical Foundations of Constitutional Democracy. Ann Arbor, MI: University of Michigan Press.

18Campbell, B. & Manning, J. (2014). Microaggression and Moral Cultures. Com-parative Sociology, 13, 692–726.
Carl, N. (2015a). Does intelligence have a U-shaped relationship with leftism? In-telligence, 49, 159–170.
Carl, N. (2015b). Can intelligence explain the overrepresentation of liberals and leftists in American academia? Intelligence, 53, 181–193.
Charlton, B. (2009). Clever sillies: Why high IQ people tend to be deficient in com-mon sense. Medical Hypotheses, 73, 867–870.
Cofnas, N. (2016). Science Is Not Always “Self-Correcting”: Fact–Value Confla-tion and the Study of Intelligence. Foundations of Science, 21, 477–492.
Cohen, N. (2015). Britain’s hypocritical universities are naked before their ene-mies. The Spectator.
Daily Mail. Manning, S., & Wace, C. (2015). Oxford law students too ‘fragile’ to hear about violent crime: Undergraduates given ‘trigger warnings’ before traumat-ic material. The Daily Mail.
Deary, I. J., Batty, G. D., & Gale, C. R. (2008). Childhood intelligence predicts voter turnout, voting preferences, and political involvement in adulthood: the 1970 British cohort study. Intelligence, 36, 548–555.
Dennison, J. (2017). The Greens in British Politics Protest, Anti-Austerity and the Divided Left. London, UK: Palgrave Macmillan.
Duarte, J.L., Crawford, J.T., Stern, C., Haidt, J., Jussim, L. & Tetlock. (2014). Political diversity will improve social psychological science. The Behavioral and Brain Sciences, 18, 1–54.
Evans, G. & Heath, A. (1995). The measurement of left-right and libertarian-authoritarian values: A comparison of balanced and unbalanced scales. Quality & Quantity, 29, 191–206.
Evans, G., Heath, A. & Lalljee, M. (1996). Measuring Left-Right and Libertarian-Authoritarian Values in the British Electorate. The British Journal of Sociology, 47, 93–112.
Fike, R. & Gwartney, J. (2015). Public Choice, Market Failure, and Government Failure in Principles Textbooks. The Journal of Economic Education, 46, 207–218.
Ford, M., & Goodwin, R. (2013). Revolt on the Right: Explaining Support for the Radical Right in Britain. Abingdon-on-Thames, UK: Routledge.
19Fosse, E., Freese, J., & Gross, N. (2014). Political bias in the graduate admissions process: A field experiment. In Gross, N. & Simmons, S. (eds). Professors and Their Politics. Baltimore, MD: Johns Hopkins University Press.
Gerber, A., Huber, G., Doherty, D., Dowling, C. (2011). The Big Five Personality Traits in the Political Arena. Annual Review of Political Science, 14, 265–287.
Gross, N., & Fosse, E. (2012). Why are professors liberal? Theory and Society, 41, 127–168.
Gross, N. (2013). Why Are professors liberal and Why Do conservatives care? Cambridge, MA: Harvard University Press.
Guardian. Preston, A. (2015). The war against humanities at Britain’s universities. The Guardian.
Haidt, J. (2012). The Righteous Mind: Why Good People Are Divided by Politics and Religion. New York City, NY: Pantheon.
Halsey, C.H. (1992). The Decline of Donnish Dominion: The British Academic Professions in the Twentieth Century. Oxford, UK: Oxford University Press.
Hannan, D. (2016). Why Vote Leave. London, UK: Head of Zeus.
Honeycutt, N. & Freburg, L. (2016). The Liberal and Conservative Experience Across Academic Disciplines: An Extension of Inbar and Lammers. Social Psycho-logical and Personality Science, 1–9.
Hume, M. (2015). Trigger Warning: Is the Fear of Being Offensive Killing Free Speech? UK: William Collins.
Inbar, Y., & Lammers, J. (2012). Political diversity in social and personality psy-chology. Perspectives on Psychological Science, 7, 496-503.
Independent. Ali, A. (2015). Muslim students from Goldsmiths University’s Is-lamic Society ‘heckle and aggressively interrupt’ Maryam Namazie talk. The In-dependent.
Jussim, L. (2012). Social Perception and Social Reality: Why Accuracy Dominates Bias and Self-Fulfilling Prophecy. Oxford, UK: Oxford University Press.
Klein, D. B., & Stern, C. (2009). Groupthink in academia: majoritarian departmen-tal politics and the professional pyramid. The Independent Review, 13, 585–600.
Kling, A. (2013). The Three Languages of Politics. Amazon eBook.
Knies, G. (2014). Understanding Society: The UK Household Longitudinal Study, waves 1-4, 2009-2013, user manual. UK Data Service.

20L.A. Times. Editorial. (2015). UC system going the wrong way on free speech. Los Angeles Times.
Langbert, M., Quain, A.J. & Klein, D.B. (2016). Faculty Voter Registration in Economics, History, Journalism, Law, and Psychology. Econ Journal Watch, 13, 422–451.
Marshall, P., & Laws, D. (2004). The Orange Book: Reclaiming Liberalism. Lon-don, UK: Profile Books.
Martin, C.C. (2015). How ideology has hindered sociological insight. The Ameri-can Sociologist, early online publication.
Mattey, J. (1998). Reasons for public support of research and development. Federal Reserve Bank of San Francisco Economic Letter.
McCrae, R.R. (1996). Social consequences of experiential openness. Psychological Bulletin, 120, 323-337.
McFall, S. (2013). Understanding Society: UK Household Longitudinal Study: Cognitive ability measures. UK Data Archive Study Number 6614.
Mellon, J. & Prosser, C. (2015). Why did the polls go wrong? British Election Study.
Mooney, C. (2012). The Republican Brain: The Science of Why They Deny Sci-ence—and Reality. New York City, NY: John Wiley & Sons, Inc.
Nyborg, H. (2011). The greatest collective scientific fraud of the 20th century: The demolition of differential psychology and eugenics. Mankind Quarterly, 51, 241–268.
Okimoto, T.G. & Gromet, D.M. (2016). Differences in Sensitivity to Deviance Partly Explain Ideological Divides in Social Policy Support. Journal of Personality and Social Psychology, 111, 98–117.
Orwell, G. (1941). England Your England. In Fyvel, T.R. & Orwell, G. (eds.). The Lion and the Unicorn: Socialism and the English Genius. London, UK: Secker & Warbug.
Pan, J. & Xu, Y. (2016). China’s ideological spectrum. Working Paper.
Park, W. (1990). A review of research on groupthink. Journal of Behavioral Deci-sion Making, 3, 229–245
Pesta, B.J., McDaniel, M.A., Poznanski, P.J., DeGroot, T. (2015). Discounting IQ’s Relevance to Organizational Behavior: The “Somebody Else’s Problem” in Management Education. Open Differential Psychology.

21Phillips, J.C. (2016). Why are there so few conservative and libertarian law pro-fessors? An empirical exploration of three hypotheses. Harvard Journal of Law & Public Policy, 39, 154-207.
Pinker, S. (2002). The Blank Slate: The Modern Denial of Human Nature. Lon-don, UK: Penguin Books.
Pinker, S. (2015). Why free speech is fundamental. The Boston Globe.
Sacks, D.O., & Theil, P. (1999). The Diversity Myth: Multiculturalism and Politi-cal Intolerance on Campus. Oakland, CA: Independent Institute.
Schoen, H. & Schumann, S. (2007). Personality Traits, Partisan Attitudes, and Voting Behavior. Evidence from Germany. Political Psychology, 28, 471–498.
Shields, J. (2007). The Extreme Right in France: From Petain to Le Pen. Milton Park, UK: Taylor & Francis.
Scruton, R. (1985). Thinkers of the New Left. Harlow, UK: Longman.
Solon, I. (2014). How intelligence mediates liberalism and prosociality. Intelli-gence, 47, 44–53.
Solon, I. (2015). Scholarly elites orient left, irrespective of academic affiliation. In-telligence, 51, 119–130.
Spiked. (2016). Free speech university rankings 2016: The epidemic of campus censorship. Spiked.
Stern, C. (2016). Undoing Insularity: A Small Study of Gender Sociology’s Big Problem. Econ Journal Watch, 13, 452–466.
Tetlock, P. E., & Mitchell, G. (2015). Why so few conservatives and should we care? Society, 52, 28–34.
THE (2015). Almost half of sector back Labour, THE election poll suggests. Times Higher Education.
THE (2016). EU referendum: 9 out of 10 university staff back Remain. Times Higher Education.
University of Essex. (2015). Institute for Social and Economic research and Nat-Cen social research, Understanding Society: waves 1–5, 2009–2015, 5th Edn. Es-sex: UK Data Archive, Colchester.
Washington Post. Sides, J. (2015). Why congress should not cut funding to the social science.

22Weyl, G. (2016). The Openness-Equality Trade-Off in Global Redistribution. Working Paper.
Winegard, B.M., Winegard, B. & Deaner, R.O. (2014). Misrepresentations of Evo-lutionary Psychology in Sex and Gender Textbooks. Evolutionary Psychology, 12, 474–508.
Winegard, B., & Winegard, B. (2016). A social science without sacred values. Working Paper.
Woessner, M., & Kelly-Woessner, A. (2009). Left pipeline: Why don’t conserva-tives get doctorates? In Maranto, R., Redding, R.E. & Hess, F.M. (eds.). The Po-litically Correct University: Problems, Scope and Reforms. Washington, DC: The AEI Press.
Yancey, G. (2011). Compromising Scholarship: Religious and Political Bias in American Higher Education. Waco, TX: Baylor University Press. METHODOLOGICAL APPENDIX
Table 1
As noted above, the THE poll (2015) was open to anyone with a UK university email address, including non-academic staff, and was self-selecting. The question posed by the THE poll (2015) was not stated explicitly in the write-up, but one can infer from the text that it asked respondents which party they intended to vote for, rather than which party they felt closest to. By contrast, Halsey (1992, Appendix 1) asked about party closeness, not vote intention. In addition, his data were collected systematically, namely by selecting every nth name from the Commonwealth Uni-versities Yearbook (where n varied according to gender and seniority). Insofar as the question posed by Halsey (1992) was different to the one posed by the THE poll (2015), the two sets of figures are not directly comparable. Nonetheless, since most people will tend to vote for the party to whom they feel closest, the compari-son is reasonably legitimate.
Tables 3, 4 and 5
The variable utilised for calculating party support within the general population and the top 5% of IQ is based on two questions, which were asked sequentially. First, respondents were asked whether they supported any party, and––if so––which one. Those who answered ‘No’ were then asked which party they felt closest to. IQ was obtained by extracting the first principal component from a PCA on six separate measures of cognitive ability (McFall, 2013): immediate word recall, delayed word recall, serial subtraction, number series, verbal fluency, and numeracy. This com-ponent explained 46% of the variance across the six measures. Openness to experi-ence was obtained by extracting the first principal component from a PCA on three measures of openness: a self-rating of how original the respondent believes he is; a self-rating of how artistic the respondent believes he is; and a self-rating of how ac-

23tive an imagination the respondent believes he has. This component explained 60% of the variance across the three measures. Cross-sectional sampling weights were applied when calculating the figures in order attain representativeness (Knies, 2014). The IQ variable and the openness variable were taken from Wave 3, while the party support variable was taken from Wave 5.