Embed Size (px)
Citation preview

OCS StudyMMS 2001-020
Coastal Marine Institute
Lafourche Parish and Port Fourchon,Louisiana: Effects of the Outer ContinentalShelf Petroleum Industry on the Economyand Public Services, Part 2
Cooperative AgreementCoastal Marine InstituteLouisiana State University
U.S. Department of the InteriorMinerals Management ServiceGulf of Mexico OCS Region

OCS StudyMMS 2001-020
Petroleum Mining on the Outer Continental Shelf,Gulf of Mexico: Impact on the Economy of andPublic Service Provision in Lafourche, Parish,Louisiana, Part 2
Authors
David W. HughesJ. Matthew FanninWalter KeithlyWilliams Olatubi,Jiemin Guo
April 2002
Prepared under MMS Contract1435-01-96-CT-30660-19945byDepartment of Agricultural Economics and AgribusinessandCoastal Fisheries InstituteLouisiana State UniversityBaton Rouge, Louisiana 70801
Published by

iiii
U.S. Department of the Interior Cooperative AgreementMinerals Management Service Coastal Marine
InstituteGulf of Mexico OCS Region Louisiana State University
DISCLAIMER
This model and user guide were prepared under contract between the Minerals Management Service(MMS) and Research and Planning Consultants, Inc. This report has been technically reviewed by theMMS, and it has been approved for publication. Approval does not signify that the contentsnecessarily reflect the views and policies of the MMS, nor does mention of trade names or commercialproducts constitute endorsement or recommendation for use. It is, however, exempt from review andcompliance with the MMS editorial standards.
REPORT AVAILABILITY
Extra copies of this model and user guide may be obtained from the Public Information Unit (Mail Stop5034) at the following address:
U.S. Department of the InteriorMinerals Management ServiceGulf of Mexico OCS RegionPublic Information Unit (MS 5034)1201 Elmwood Park BoulevardNew Orleans, Louisiana 70123-2394
Telephone: (504) 736-2519 or 1-800-200-GULF
CITATION
Suggested citation:
Hughes, D.W., J.M. Fannin, W. Keithly, W. Olatubi, and J. Guo. 2001. Lafourche Parish and PortFourchon, Louisiana: Effects of the Outer Continental Shelf Petroleum Industry on theEconomy and Public Services, Part 2. Prepared by the Louisiana State University, CoastalMarine Institute. U.S. Dept. of the Interior, Minerals Management Service, Gulf of MexicoOCS Region, New Orleans, LA. OCS Study MMS 2001-020. 51 pp.

v
TABLE OF CONTENTS
LIST OF FIGURES . . . . . . . . . . . . . . . . . . . . . . . . . . . . . . . . . . . . . . . . . . . . . . . . . . . . . . . . . . . vii
LIST OF TABLES . . . . . . . . . . . . . . . . . . . . . . . . . . . . . . . . . . . . . . . . . . . . . . . . . . . . . . . . . . . . ix
EXECUTIVE SUMMARY . . . . . . . . . . . . . . . . . . . . . . . . . . . . . . . . . . . . . . . . . . . . . . . . . . . . . . xi
I. INTRODUCTION . . . . . . . . . . . . . . . . . . . . . . . . . . . . . . . . . . . . . . . . . . . . . . . . . . . . . . . . . . . . 1
II. GULF OF MEXICO PETROLEUM ACTIVITIES . . . . . . . . . . . . . . . . . . . . . . . . . . . . . . . . . . 1A. Introduction . . . . . . . . . . . . . . . . . . . . . . . . . . . . . . . . . . . . . . . . . . . . . . . . . . . . . . . . . . 1B. A Brief History of Oil and Gas Activities . . . . . . . . . . . . . . . . . . . . . . . . . . . . . . . . . . . . . 2C. An Era of Cautious Optimism . . . . . . . . . . . . . . . . . . . . . . . . . . . . . . . . . . . . . . . . . . . . . 3D. Oil Production . . . . . . . . . . . . . . . . . . . . . . . . . . . . . . . . . . . . . . . . . . . . . . . . . . . . . . . . 3E. Gas Production . . . . . . . . . . . . . . . . . . . . . . . . . . . . . . . . . . . . . . . . . . . . . . . . . . . . . . . . 4F. Future Activities . . . . . . . . . . . . . . . . . . . . . . . . . . . . . . . . . . . . . . . . . . . . . . . . . . . . . . . 5
III. DEVELOPMENT OF PORT FOURCHON . . . . . . . . . . . . . . . . . . . . . . . . . . . . . . . . . . . . . . 7A. Introduction . . . . . . . . . . . . . . . . . . . . . . . . . . . . . . . . . . . . . . . . . . . . . . . . . . . . . . . . . . 7B. Non-OCS, Petroleum-Based Economic Activities . . . . . . . . . . . . . . . . . . . . . . . . . . . . . . 9
1. Louisiana Offshore Oil Port . . . . . . . . . . . . . . . . . . . . . . . . . . . . . . . . . . . . . . . . . 92. Waterborne Commerce . . . . . . . . . . . . . . . . . . . . . . . . . . . . . . . . . . . . . . . . . . . . 93. Commercial Fishing Activities . . . . . . . . . . . . . . . . . . . . . . . . . . . . . . . . . . . . . . . 9
C. Oil- and Gas-Based Economic Activities . . . . . . . . . . . . . . . . . . . . . . . . . . . . . . . . . . . . 10
IV. CHANGES IN PARISH SOCIOECONOMIC ACTIVITY . . . . . . . . . . . . . . . . . . . . . . . . . 11A. Employment Changes . . . . . . . . . . . . . . . . . . . . . . . . . . . . . . . . . . . . . . . . . . . . . . . . . . 11B. Population Changes . . . . . . . . . . . . . . . . . . . . . . . . . . . . . . . . . . . . . . . . . . . . . . . . . . . 12C. Residential Construction Changes . . . . . . . . . . . . . . . . . . . . . . . . . . . . . . . . . . . . . . . . . 12D. School Enrollment Changes . . . . . . . . . . . . . . . . . . . . . . . . . . . . . . . . . . . . . . . . . . . . . 13
V. THE LOUISIANA COMMUNITY IMPACT MODEL . . . . . . . . . . . . . . . . . . . . . . . . . . . . . 14A. Introduction . . . . . . . . . . . . . . . . . . . . . . . . . . . . . . . . . . . . . . . . . . . . . . . . . . . . . . . . . 14B. Input-Output and Labor Market Models . . . . . . . . . . . . . . . . . . . . . . . . . . . . . . . . . . . . 16C. Fiscal Module of LCIM . . . . . . . . . . . . . . . . . . . . . . . . . . . . . . . . . . . . . . . . . . . . . . . . 17D. Sectors With Direct OCS Oil Industry Links . . . . . . . . . . . . . . . . . . . . . . . . . . . . . . . . . 18E. Petroleum-Related Businesses Operating at Port Fourchon . . . . . . . . . . . . . . . . . . . . . . 19
1. Petroleum Production Firms . . . . . . . . . . . . . . . . . . . . . . . . . . . . . . . . . . . . . . . 20

vi
2. Other Oilfield Support Firms . . . . . . . . . . . . . . . . . . . . . . . . . . . . . . . . . . . . . . . 213. Shipbuilding . . . . . . . . . . . . . . . . . . . . . . . . . . . . . . . . . . . . . . . . . . . . . . . . . . . 224. Water Transportation . . . . . . . . . . . . . . . . . . . . . . . . . . . . . . . . . . . . . . . . . . . . 245. Motor Freight (Trucking) Companies . . . . . . . . . . . . . . . . . . . . . . . . . . . . . . . . . 256. Air Transportation (Helicopter Companies) . . . . . . . . . . . . . . . . . . . . . . . . . . . . 25
F. LCIM Model Results . . . . . . . . . . . . . . . . . . . . . . . . . . . . . . . . . . . . . . . . . . . . . . . . . . 26G. Results From the Input-Output Module . . . . . . . . . . . . . . . . . . . . . . . . . . . . . . . . . . . . . 26
1. Changes in Parish Population . . . . . . . . . . . . . . . . . . . . . . . . . . . . . . . . . . . . . . . 282. Local Government Revenue and Expenditure Impacts . . . . . . . . . . . . . . . . . . . . 29
2.a Changes in local government expenditures . . . . . . . . . . . . . . . . . . . . . . . 292.b Changes in local government revenues . . . . . . . . . . . . . . . . . . . . . . . . . 302.c Net costs to local government . . . . . . . . . . . . . . . . . . . . . . . . . . . . . . . . 31
H. Additional Pressures on Publicly Provided Services . . . . . . . . . . . . . . . . . . . . . . . . . . . . 351. City Water . . . . . . . . . . . . . . . . . . . . . . . . . . . . . . . . . . . . . . . . . . . . . . . . . . . . 352. Roads . . . . . . . . . . . . . . . . . . . . . . . . . . . . . . . . . . . . . . . . . . . . . . . . . . . . . . . . 353. Additional Costs to Local School System . . . . . . . . . . . . . . . . . . . . . . . . . . . . . 36
VI. SUMMARY AND CONCLUSIONS . . . . . . . . . . . . . . . . . . . . . . . . . . . . . . . . . . . . . . . . . . 36
REFERENCES . . . . . . . . . . . . . . . . . . . . . . . . . . . . . . . . . . . . . . . . . . . . . . . . . . . . . . . . . . . . . . . 37
APPENDIX A . . . . . . . . . . . . . . . . . . . . . . . . . . . . . . . . . . . . . . . . . . . . . . . . . . . . . . . . . . . . . . . 41

vii
LIST OF FIGURES
Figure Page
1 Offshore Oil Production, 1985-1997.......................................................... 4
2 Offshore Gas Production, 1985-1997......................................................... 5
3 Port Fourchon and Surrounding Area.......................................................... 8
4 Employment in Lafourche Parish, 1969-1997............................................. 11 5 Population in Lafourche Parish, 1969-1997................................................ 12
6 Residential Construction in Lafourche Parish, 1969-1997......................... 13
7 Public and Private K-12 School Enrollment in Lafourche Parish, 1989-1997.................................................................................................... 14
8 Overview of the Louisiana Community Impact Model .............................. 15
9 Petroleum Mining Employment in Lafourche Parish, 1982-1998.............. 22
10 Shipbuilding Employment in Lafourche Parish, 1987-1997...................... 23
11 Water Transportation Employment in Lafourche Parish, 1982-1998......... 24
12 Actual versus Predicted Population Change, Lafourche Parish, 1994-2002..................................................................................................... 29
13 Estimated Local Lafourche Parish Government Spending under Baseline and Oil Shock Scenarios, 1995-2002 ........................................................... 32
14 Estimated Local Lafourche Parish Government Revenue under Baseline and Oil Shock Scenarios, 1995-2002 ........................................................... 33
15 Estimated Local Lafourche Parish Government Revenues Less Costs under Baseline and Oil Shock Scenarios, 1995-2002 ................................... 34

ix
LIST OF TABLES
Table Page
1 Projected Daily Oil and Gas Production in the Gulf of Mexico, 1998-2002.................................................................................................... 6
2 Companies Operating out of Port Fourchon that Support OCS PetroleumActivity.................................................................................................... 19
3 Ordinary Least Squares (Regression) Analysis Results Indicating Employment in Lafourche Parish Water Transportation, Ship Building, and Mining Industries as a Function of Deep Water Outer Continental Shelf Oil Industry Activity........................................................................ 21
4 Direct, Indirect, and Induced Changes in Employment due to OCS Petroleum Industry Activity in Lafourche Parish, 1995-2002.................. 27
5 Direct, Indirect, and Induced Changes in Output due to OCS
Petroleum Industry Activity in Lafourche Parish, 1995-2002................... 28
6 Predicted Changes in Local Government Expenditures for Lafourche Parish Under OCS Oil Industry Development, 1995-2002.................... 30
7 Predicted Changes in Local Government Revenues for Lafourche Parish Under OCS Oil Industry Development, 1995-2002.................... 31

xi
EXECUTIVE SUMMARY
Published analysis indicates that oil production from the Gulf of Mexico will increase in therange of 35 to 70 percent between 1998 and 2002 (7-10 percent per year). Production fromdeepwater fields will soon account for up to 64 percent of total Gulf of Mexico oil (compared to 26percent in 1997). This increase in deepwater activity will require considerably more land basedservices than is currently available. Limitations on such facilities could place restrictions on futuredeepwater activities.
Port Fourchon’s strategic location provides it with a competitive advantage as a supply base foroil-and-gas related activities in the Central Gulf of Mexico. These activities are diverse, ranging fromsupply boats used to service oil and gas rigs to the maintenance and repair of mobile drilling rigs. Currently, more than 600 offshore platforms are located within a 40-mile radius of Port Fourchon andthe Port is likely to play an increasingly important role as development in the Outer Continental Shelf(OCS) progresses.
Further development of OCS activity and Port Fourchon is expected to markedly effectLafourche Parish. Rapid increases in parish employment, which began in 1995, have continued in 1998(2,184 new jobs) and have been concentrated in water transportation and shipbuilding.
Community Impact Models (CIM) quantify the linkages among economic activity in localcommunities and the demand for and ability to support local government services. A CIM developedfor Louisiana is used to evaluate the impact of the OCS petroleum industry on the economy and localgovernment finances of Lafourche Parish. An input-output model represents the local economy. Thismodel used data collected prior to January 2000.
The OCS petroleum industry has and will continue to have a significant impact on the LafourcheParish economy according to model results. Based on published estimates of OCS activity from 1995through 2002, the industry is predicted to be directly and indirectly responsible for the addition of 6,349jobs and $603 million in total output. But U.S. Census estimates indicate that the Lafourche Parishpopulation has continued to experience slow growth through 1997. Dramatic declines in parishunemployment levels (starting in 1995) indicate that many new jobs have gone to the unemployed andto workers commuting into the parish. However, population levels should ultimately begin to showstrong growth. For example, model results predict an increase in population of 4.2 percent from88,263 in 1997 to 91,977 in 2002.
Model results also indicate increases in various revenue and expenditure categories due to theOCS petroleum industry. Total, inflation-adjusted, revenues paid to local governments are expected toincrease by $20 million (11.2 percent) in 2002 from the 1995 level. Model results also indicate marked

xii
increases in expenditures ($9.6 million) by 2002 thus implying that ongoing activity in the Gulf ofMexico should not strain the ability of local governments to deliver publicly provided services. However, this result is tempered because certain costs incurred by local governments due to the OCSpetroleum industry, such as a major expansion in the water system, are not accounted for in modelresults. Such costs are an addition to costs increases predicted by the model. Hence, the ability of localgovernments to meet increases in cost due to the expansion of the OCS petroleum industry could beproblematic. Further, a detailed study shows that State Highway 1 (LA 1) is receiving significantdamage as a result of OCS activity. Because it is not a local responsibility, the cost of maintaining andupgrading the road is also not accounted for in model results.
Finally, the historical development of the OCS petroleum industry and the resulting impacts oneconomic and population levels in Lafourche Parish has been boom and bust. Increases in populationand economic activity could and in some cases are already requiring substantial new investment in localinfrastructure. If activity in the OCS petroleum industry should decrease rapidly in the future, localgovernments may incur the costs of infrastructure development without obtaining the levels of revenueneeded to meet such costs.

1
I. INTRODUCTION
In the summer of 1996, the Executive Director of the Greater Lafourche Port Authority(responsible for the operation of Port Fourchon) wrote the Regional Director of the MineralsManagement Service, Gulf of Mexico Region, calling his attention to the growing truck traffic onLouisiana State Highway 1 (LA 1) due to the increasing oil related activities on the Outer ContinentalShelf (OCS) in the Gulf of Mexico. The increase in truck traffic raised the concern that the road is andwill continue to be detrimentally affected. Hence, the ability of the road to handle increasing levels oftruck traffic is questionable.
This report grew out of that concern. The report provides a brief history of OCS activities inGulf waters, describes the current expansion in exploration, development and production activities onthe OCS, and examines the prospect for future activities. Resulting growth in the Lafourche Parisheconomy is examined both from long run and more recent perspectives. The increasing activities of theOCS oil and gas industry have strongly affected the Lafourche Parish economy and Port Fourchon isan important locus for these effects. This report describes the Port and its environs, focusing on issuesrelated to activities on the OCS.
Typically, rapid economic growth places stresses on a wide range of publicly provided servicesfrom schools, to police and fire protection, to welfare agencies, to provision of roads and utilities. Theeffects of the growth in the OCS petroleum industry on a range of public services in Lafourche Parishare discussed. In some cases, the offshore petroleum industry places unique stresses on publicservices. These are also described and discussed. (In particular, a detailed analysis of the impact ofOCS petroleum industry activity on LA 1 issue is provided in the companion document, “An Analysisof LA Highway 1 in Relation to Expanding Oil and Gas Activity in the Central Gulf of Mexico” (Guo etal., 2000).
A major portion of the research presented herein involved the development of a regionaleconomic model for Lafourche Parish and Port Fourchon. Accordingly, regional modeling in general,the regional model developed for this study, and the results from that model are extensively discussed. Also provided are discussions of the parish, the port, and oil and gas activity in the Gulf of Mexico.
II. GULF OF MEXICO PETROLEUM ACTIVITIES
A. Introduction
The Gulf of Mexico, almost completely surrounded by the United States, Mexico, and Cuba, isan oval sea encompassing some 3.9 million square kilometers. With approximately four thousand oiland gas platforms along the shelf and slope regions, the Gulf of Mexico is the most intensely developedregion of the world on the basis of offshore oil and gas production and accounts for 90 percent of all oiland gas production in offshore waters of the United States (Louisiana Mid-Continent Oil and Gas
1 The U.S. domestic production of oil equaled almost 2.4 billion barrels in 1995 while theproduction of gas equaled 18,902 billion cubic fee. Production of oil from the Gulf of MexicoOuter Continental Shelf (OCS), defined, with some exceptions, as the area of oceans beyondthe state boundaries out to 200 miles offshore, in 1995 (357 million barrels) represented 15percent of the nation’s 2.4 billion barrels produced while production of gas from the Gulf ofMexico OCS (5,015 billion cubic feet) represented more than a quarter of the nation’s totaldomestic supply.
2 This legal dispute emanated from a 1945 declaration by President Truman that the UnitedStates maintained ownership of natural resources of the seabed beyond the coastal states threenautical mile jurisdiction.
3 This figure may be somewhat inflated because some tracts may have been returned andreissued at a subsequent date.
2
Association, 1996).1 Between 1954 and 1993, oil and gas activities generated more than $90 billion tothe U.S. Treasury in the form of lease bonuses and royalties (American Petroleum Institute, 1998).
B. A Brief History of Oil and Gas Activities
While offshore oil and gas development dates back about a century ago to Santa Barbara,California, 1933 is considered the benchmark year for activities in the Gulf of Mexico. It was in thisyear that the first attempt to drill in the offshore waters of the Gulf of Mexico was made and the firstsuccessful producing well became active four years later in 1937. This well, about a mile offshore, wasdrilled in 13 feet of water. In 1947, Kerr-McGee Oil Company completed the first well completelybeyond sight of land. This well, which produced 600 barrels of oil per day, established the pattern ofsupporting offshore wells from onshore bases (Weber et al., 1990). Following a legal dispute betweenthe federal government and the states involving ownership of the offshore seabed adjacent to the statescoasts, the federal government, in 1954, conducted its first sale of offshore drilling rights.2 Since thatinitial sale, more than 100 thousand tracts totaling more than 500 million acres have been offered forlease and more than 40 million acres have been taken for lease3 (Weber et al., 1990).
Through time, the industry became more experienced and developed wells in ever greaterdepths. By the mid-1950's, wells fifty miles away from land were in operation (Weber et al., 1990). As of January 2000, 3,971 active oil and gas platforms were operating in the Gulf of Mexico OCS(Minerals Management Service, 2000). Exploration and drilling activities associated with these wellsrequire substantial land based infrastructure to ensure continued operation. This land basedinfrastructure -- including oil field equipment dealers, air transport, marine equipment and transportationservices, and contract labor and engineering services, to name just a few -- is located largely inLouisiana and Texas and contributes significantly to the economies of local coastal communities.
Until recently, the vast majority of oil and gas production from the Gulf of Mexico OCS wasshallow water based (defined as taken from depths of less than 1,000 feet). As recently as the late
3
1980's, most of the conventional fields were mature and moving toward production decline (the Gulf ofMexico was being referred to as the “Dead Sea”). This observation was discredited during the 1990's,however, as a result of several factors including significant deepwater discoveries, new exploration andextraction technologies, and deepwater royalty relief (Cranswick and Regg, 1997).
C. An Era of Cautious Optimism
The rejuvenation of oil and gas activities in the Gulf of Mexico OCS is generally credited tothree factors according to production analysts at Minerals Management Service (Cranswick and Regg,1997). First, there have been significant discoveries in the deepwater shelf of the Gulf of Mexico inrecent years. In 1997, for example, eleven new deepwater discoveries were announced. Second, newand improved technologies have been developed and implemented in recent years, which havepermitted the extension of the conventional fields and increased discoveries on fields in deeper waters. Third, the passage of Public Law 104-58, Title III, the OCS Deepwater Royalty Relief Act (signed onNovember 25, 1995) appears to have provided a stimulus to deepwater bidding and leasing activities. For example, before the passage of the OCS Deepwater Royalty Relief Act in 1994, 49 bids weresubmitted on Gulf of Mexico tracts in excess of 800 meters. After enactment of the Act, the number ofbids had increased to 722 in 1996 and to more than 1,100 in 1997 and as of April 2000, there were3,670 leases in water depths of 1000 feet or greater (Baud et al., 2000). As a result, economicconditions have been favorable in recent years (Cranswick and Regg, 1997) although output priceshave followed an erratic pattern of declines and increases from 1997 through 2000. Particularlypronounced growth since the early 1990's has been in deepwater activities (in excess of 1,000 feet ofwater) and there is cautious optimism that these offshore activities will continue, and likely expand, wellinto the next century. To assess oil and gas activities in the Gulf of Mexico, recent trends are firstpresented. Then, attention is turned to analysis of future activities based on available forecasts andother relevant information.
D. Oil Production
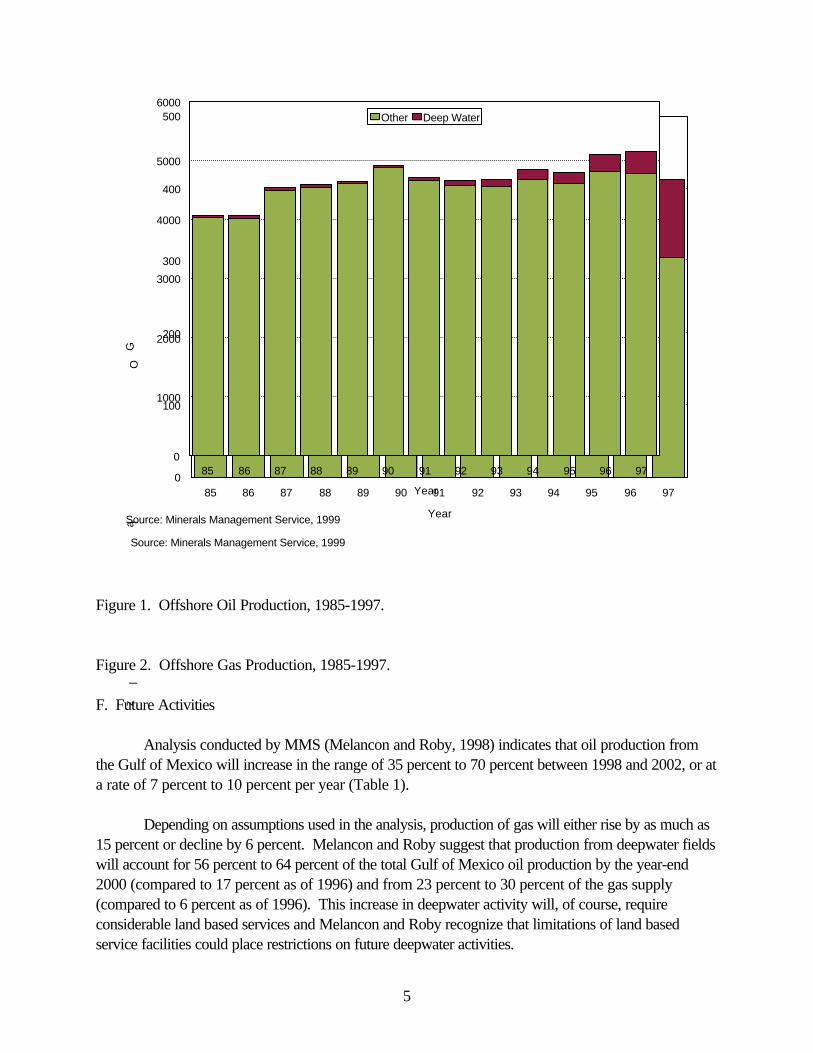
Production of oil from the Gulf of Mexico OCS for the 1985-97 period is illustrated in Figure1. Overall, annual production ranged from a low of 275 million barrels in 1990 to a high of 412 millionbarrels in 1997. Examination of the data suggests two distinct trends during this 13 year period. Thefirst, from 1985 to 1990, is one of a sharp decline in total production. Overall, total production duringthis period fell by about 20 percent. This decline is generally associated with the declining price of theproducts during this period. The second trend, evident from 1990 through 1997, is one of increasingtotal production. During this period, production of oil from the Gulf of Mexico (OCS) grew by 50 percent with the last four years exhibiting particularlypronounced production increases (Minerals Management Service, 1999).
The increasing production since 1990 is primarily the result of expanding deepwater activities(defined here as production in more than 1,000 feet of water). Deepwater production of oil from theGulf of Mexico equaled 12 million barrels in 1990. By 1997, deepwater production had increasedmore than ninefold to 108.5 million barrels (Figure 1). Overall, the share of Gulf of Mexico OCS oil
4 In one recent economic study, for example, Walls (1994) predicted that Gulf of Mexico oilproduction would decline from about 277 million barrels in 1989 to about 160 million barrelsby the year 2000. Similarly, production of gas was predicted to fall from 4275 bcf to 3160bcf. Walls under-predict activity because her predicted oil and gas wellhead prices were wellbelow current prices and because the technological development supporting current expansionin deepwater activities was not foreseen.
4
production represented by deepwater activities was 26.3 percent in 1997 as compared to 4.4 percentin 1990 (Minerals Management Service, 1999).
E. Gas Production
Natural gas production from the Gulf of Mexico (OCS) is given in Figure 2 for the 1985-97period. Total production, as indicated, increased from 4.1x10⁹ mcf in 1985 to 5.2x10⁹ mcf in 1997, anincrease of 26.4 percent. Production of natural gas from deepwater activities increased from 3.1x10⁷
mcf in 1990 to 3.8x10⁸ in 1997, an over tenfold increase. Overall, the share of the Gulf of MexicoOCS production derived from deepwater activities increased from less than 1 percent in 1990 to 7.4percent in 1997 (Minerals Management Service, 1999). Predicting future Gulf of Mexico oil and gasactivities is, at best, imprecise with the level of imprecision increasing in relation to the length of theforecast period.4 Having given this cautionary note, some forecasts and indications of future activitiesare contained herein.
5
Source: Minerals Management Service, 1999
85 86 87 88 89 90 91 92 93 94 95 96 97
Year
0
100
200
300
400
500
Oi
l
Pr
od
uc
ti
on
(M
il
li
on
s
ST
B)
Other Deep Water
Source: Minerals Management Service, 1999
85 86 87 88 89 90 91 92 93 94 95 96 97
Year
0
1000
2000
3000
4000
5000
6000
Ga
z
Pr
od
uc
ti
on
(M
il
li
on
MC
F)
Other Deep Water
Figure 1. Offshore Oil Production, 1985-1997.
Figure 2. Offshore Gas Production, 1985-1997.
F. Future Activities
Analysis conducted by MMS (Melancon and Roby, 1998) indicates that oil production fromthe Gulf of Mexico will increase in the range of 35 percent to 70 percent between 1998 and 2002, or ata rate of 7 percent to 10 percent per year (Table 1).
Depending on assumptions used in the analysis, production of gas will either rise by as much as15 percent or decline by 6 percent. Melancon and Roby suggest that production from deepwater fieldswill account for 56 percent to 64 percent of the total Gulf of Mexico oil production by the year-end2000 (compared to 17 percent as of 1996) and from 23 percent to 30 percent of the gas supply(compared to 6 percent as of 1996). This increase in deepwater activity will, of course, requireconsiderable land based services and Melancon and Roby recognize that limitations of land basedservice facilities could place restrictions on future deepwater activities.

6
Table 1
Projected Daily Oil and Gas Production in the Gulf of Mexico, 1998-2002. Rate Projections - GOM
1998 1999 2000 2001 2002
Low Oil MBOPD*(Decline Used)
1,226 1,493 1,592 1,606 1,976
High Oil MBOPD*(No Decline used)
1,347 1,667 1,816 1,874 1,976
Low Gas Bcfd**(Decline Used)
13.27 13.43 13.39 12.83 12.43
High Gas Bcfd**(No Decline Used)
15.26 16.30 17.07 17.25 17.54
* Oil in MBOPD includes condensate.** Gas in BCFPD includes associated or casinghead gasSource: Melancon and Roby, 1998.
Several indicators suggest considerable current and near-term future expansion of deepwateroil and gas activities in the Gulf of Mexico. Drilling permit applications (approved by the MineralsManagement Service) increased from 39 in 1992 to 126 in 1996. Rigs drilling in federal shallow anddeepwater for the period followed a similar trend, increasing from three in 1992 to 19 in 1996 (monthlyaverage). Similarly, for federal shallow and deepwater, the total number of fields in production equaled16 in 1996 compared to only six in 1992 while the total number of fields with proven reservesincreased from 15 in 1992 to 25 as of June 1996 (Melancon and Roby, 1998).
Baud et al. (2000) suggest that more recent information supports continued and evenaccelerated interest in deepwater activities in the Gulf of Mexico. They report, for instance, that anadditional 11 deepwater discoveries were announced in 1998. Furthermore, the 1997 lease sales inthe Central and Western Planning Areas of the Gulf of Mexico received set records in terms of thenumber of bids received, tracts bid on, and the number of tracts leased in deepwater. The averagenumber of rigs drilling for oil and natural gas in the deepwater of the Gulf of Mexico increased from 18in 1996 to 26 in 1997. Finally, Baud et al. (2000) report that deepwater oil production surpassedshallow-water production in late 1999. The steady increase in deepwater gas production has offset therecent declines in shallow-water gas production.

7
While past activities do not necessarily reflect future activities, the information provided abovesuggests significant future activities in the deepwater of the Gulf of Mexico, ceteris paribus. Much ofthe ongoing and anticipated future activities are concentrated in the Central Planning area and most areeasily accessible from the Port Fourchon area. This study presents an analysis of the impact of ongoingdeepwater oil and gas activities on Port Fourchon and the Lafourche Parish area and evaluatespotential impacts associated with expanding activities.
III. DEVELOPMENT OF PORT FOURCHON
A. Introduction
Port Fourchon, located in Southeast Louisiana near the mouth of Bayou Lafourche in southernLafourche Parish, is the only major Louisiana port located directly on the Gulf of Mexico (see Figure3). The Port covers 3.6 thousand acres and extends approximately three miles along the east side ofBayou Lafourche from its junction with Belle Pass and Pass Fourchon to the Flotation Canal (U.S.Army Corp of Engineers and Greater Lafourche Port Commission, 1994).
LA 1 is the only road providing surface access to Port Fourchon from the rest of the state. From where it dead-ends in Grand Isle, LA 1 runs north past Port Fourchon through Leeville, GoldenMeadow, Galliano, Larose, Lockport, and almost to Raceland before it connects to U.S.90. U.S. 90, in turn, runs east to New Orleans and west through Houma and New Iberia toLafayette. At Lafayette and in the New Orleans area, U.S. 90 connects with U.S. Interstate 10 (I-10), part of the interstate highway system. The technical term for the connectionfrom U.S. 90 to the Port is “intermodal.” Unlike commerce moving on U.S. I-10 or U.S. 90, whichmoves through the area and can go to other places and states, commerce going to Port Fourchon hasto stop there and be loaded on a boat - another “mode” of transportation - to continue its journey (U.S.Army Corp of Engineers and Greater Lafourche Port Commission, 1994).
Port Fourchon’s waterway connections are of primary importance to its functions as a port. Itis connected to the Gulf of Mexico by a navigation canal dredged through Bayou Lafourche and BellePass to the Gulf. Currently, the canal is 20 feet deep, approximately four miles long, and has a jetty atthe mouth. While this canal is of primary importance to the Port’s business, the port is also connectedby a canal dredged in Bayou Lafourche north to Lockport. At Larose, this canal bisects the southernarm of the Intercoastal Waterway, giving Port Fourchon access to this waterborne traffic (U.S. ArmyCorp of Engineers and Greater Lafourche Port Commission, 1994).
Federally constructed projects provide access on Bayou Lafourche from Lockport, Louisiana,to the Gulf of Mexico. Channels are maintained by the Federal Government with the exception of thereach (section) extending from Port Fourchon to the Gulf. This section is maintained by the GreaterLafourche Port Commission (U.S. Army Corp of Engineers and Greater Lafourche Port Commission,1994).

8
Port Fourchon is, first and foremost, a land based support terminal for the offshore oil and gasindustry in the Central Gulf of Mexico. As stated in a 1994 U.S. Army Corps of Engineers report(p.19) “the economic viability of Port Fourchon is directly related to the exploration and productionactivities of the offshore oil and gas industries operating in the Federal waters of the Gulf of Mexico.” The Port also provides logistical support for several other types of economic activities (U.S. ArmyCorp of Engineers and Greater Lafourche Port Commission, 1994). These activities - including theLouisiana Offshore Oil Port, waterborne commerce, and commercial fishing- are briefly examinedbelow. Then, a more detailed examination of the offshore oil and gas based services housed out of PortFourchon is provided.

9
Figure 3. Port Fourchon and Surrounding Area

10
B. Non-OCS Petroleum-Based Economic Activities
1. Louisiana Offshore Oil Port: The Louisiana Offshore Oil Port (LOOP) is locatedapproximately 21 miles south-southwest of Port Fourchon. The port, which became operational inMay of 1981, is the only deepwater port operating under U.S. license. The port was built to facilitatethe unloading of imported crude oil from oceangoing tankers. LOOP is a monobuoy facility thatsupports tankers up to 700 thousand deadweight tons. Crude oil is offloaded and pumped tounderground storage areas in the Galliano Salt Dome, located on the east side of Bayou Lafourche nearGolden Meadow, Louisiana. From there, the crude can be piped to storage areas and refineriesthroughout Louisiana, Texas, and the Midwest. Connection to five pipelines gives LOOP access tomore than 30 percent of the nation’s refinery capacity (U.S. Army Corp of Engineers and GreaterLafourche Port Commission, 1994). LOOP was developed to handle up to 1.2 million barrels of crudeoil per day. In 1995, LOOP handled approximately 685 thousand barrels of oil per day, or more than250 million barrels per year. LOOP handles 10 percent of all crude oil imports entering the UnitedStates (Louisiana Dept. of Transportation and Development, 1998).
2. Waterborne Commerce: Given its prime location, near the Gulf of Mexico mouth ofBayou Lafourche, Port Fourchon supports considerable internal waterborne commerce. As discussedin a 1994 U.S. Corps of Engineers feasibility study, Bayou Lafourche is navigable from upstream tothe northern end of the Federal navigation project in Lockport, Louisiana, to the Gulf of Mexico. Thiswaterway links the communities of Raceland, Lockport, Larose, Golden Meadow, and Leeville to theGulf Intracoastal Waterway. The Gulf Intracoastal Waterway intersects Bayou Lafourche at Larose(Gulf Intracoastal Waterway mile 35) (U.S. Army Corp of Engineers and Greater Lafourche PortCommission, 1997).
Waterborne commerce on Bayou Lafourche averaged approximately 1.15 million tonsannually during 1987-90. With the recent increase in OCS activity in the Central Gulf of Mexico, thesignificance of Bayou Lafourche in the movement of cargo in support of OCS activities has alsoincreased. Between 1990 and 1992, for example, freight traffic along Bayou Lafourche advanced fromapproximately 1.2 million tons to 2.0 million tons, or by 70 percent. By 1994, reported freight traffichad advanced to more than 3.1 million tons and advanced again to 4.2 million tons in 1996. Overall,1996 freight traffic exceeded the 1990 traffic by 250 percent (U.S. Army Corp of Engineers andGreater Lafourche Port Commission, 1994).
3. Commercial Fishing Activities: Commercial fishing has long been an important way ofmaking a living for residents of the Golden Meadow-Leeville-Port Fourchon area. Before the fulldevelopment of Alaska’s fisheries, Louisiana generally ranked either first or second (afterMassachusetts) when evaluated on the basis of commercial landings.
The area surrounding Port Fourchon lies in the heart of Louisiana’s commercial seafoodindustry. Because of the shallow drafts of the fishing boats and the traditional residence patterns of thefishing families, commercial vessels tend to tie up along the banks of Bayou Lafourche. The ex-vessel(dock) value of commercial marine products landed in Lafourche Parish in 1997 equaled $27.7 million,

11
or approximately 8 percent of the state’s $330.6 million reported harvest (Louisiana State UniversityAgricultural Center, 1998). Much of the product landed in the parish is delivered fresh to the NewOrleans market or shipped elsewhere for processing or fresh consumption.
Port Fourchon, at one time, represented an important unloading facility for the shrimp fleetoperating out of Lafourche Parish. The best information on commercial fishing vessel traffic at the Portis dated and comes from a special census of port traffic conducted by the Greater Lafourche PortCommission during the month extending from July 15 to August 15 in 1988. During this month, whichtends to be near the peak of the offshore shrimp season, 79 commercial vessels with drafts of 12 feet orgreater made 330 round trips out of the Port. This is approximately one trip per week per vessel whichreflects the common practice among Louisiana’s commercial fishermen (U.S. Army Corps of Engineersand Greater Lafourche Port Commission, 1994). Given the sharp reduction in the deflated docksideprice of shrimp since the Port Commission survey and the concurrent reduction in fleet size, the 1988figures are likely to be significantly higher than current activities.
C. Oil- and Gas-Based Economic Activities
Port Fourchon’s strategic location provides it with a competitive advantage as a supply base foroil and gas related activities in the Central Gulf of Mexico. These activities are diverse, ranging from theuse of supply boats and tugboats to service oil and gas rigs to the maintenance and repair required for mobile drilling rigs. As of 1998, more than 600 offshore platforms are located within a 40-mile radiusof Port Fourchon (Falgout, 1999) and the Port is likely to play an increasingly important role asdevelopment in the OCS progresses.
An examination of the types of waterborne cargo transported along Bayou Lafourche helpsestablish the importance of Port Fourchon to the offshore oil and gas sector. Specifically, 35 percent ofthe 4.2 million freight tons moved along Bayou Lafourche in 1996 constituted machinery (not electrical),classified under SIC code 7110 (U.S. Army Corp of Engineers, 1997). While statistics do not indicatethe end use for this machinery, most of it is used in OCS related activities (Falgout 1997). Petroleumand petroleum products represented an additional 27 percent of the total freight tonnage. Finally,inedible crude materials (such as limestone, gravel, and marine shells) accounted for about 16 percentof the 1996 freight traffic in terms of tonnage.
The OCS oil industry has numerous links with a variety of onshore and offshore industries. These industries range in nature from restaurants that provide food and catering to offshore workers,shipbuilders that fabricate drill ships and oil well service vessels, air transportation and watertransportation firms, as well as petroleum extraction companies. Estimating the relationship betweengrowth in OCS petroleum activity and growth in these industries was a major part of the research effortpresented in this document. Accordingly, a detailed discussion of these industries is presented in thesection concerning model application.

12
Source: United States Department of Commerce, Louisiana Department of Commerce
&
&
&&&&&&
&&
&&&&&
&&&&&&&
&&&
&&&&&
69 72 75 78 81 84 87 90 93 96
Year
15
20
25
30
35
40
45
Th
ou
sa
nd
s
Jobs&
IV. CHANGES IN PARISH SOCIOECONOMIC ACTIVITY
A. Employment Changes
The total number of jobs in Lafourche Parish has increased rapidly in recent years. While otherfactors, such as a healthy national economy, contributed to this increase, a sizeable portion is due toactivity in the deepwater offshore oil industry. From 1977 to 1998, employment in Lafourche Parishgrew at an annual rate of 1.6 percent (Louisiana Dept. of Labor, No Date). However, the growth rate
doesnotreflect thecyclicalnature oftheparisheconomy(dueinpartto thecyclicalnature of
the petroleum industry). Total jobs in the parish increased from 28,235 in 1977 to 34,119 in 1981 (a20.8 percent increase over a five-year period) (Figure 4).

13
Figure 4. Employment in Lafourche Parish, 1969-1997.
In the years preceding 1986, employment dropped in 1983 (to 30,934 jobs) but increased in1985 (32,130 total jobs). At that point, employment dropped by more than 5 percent in 1986 (as anet of 1,644 jobs were lost) and remained stagnant until 1990. Growth in employment then resumed ata slow pace. Rapid increases in employment began in 1995 and are estimated to have continued into1998. Parish employment increased from 35,357 jobs in 1995 to 36,664 jobs in 1996 (an increase of1,307 jobs or 3.7 percent). With the exception of 1993, this increase was the largest absoluteincrease in employment in Lafourche Parish since 1980. Employment estimates showed a similar levelof growth (1,326 jobs) from 1996 to 1997. Estimates through March of 1998 have shown evenstronger increases in employment. Based on this data (provided by the Louisiana Department ofEconomic Development, 1998), Parish employment is expected to increase by 2,505 jobs (6.6percent) to a total of 40,496 in 1998. These increases in employment are consistent with increases inemployment experienced from 1977 to 1978 (7.7 percent or 2,184 new jobs) during the 1970s oil boom. Recent increases in employment inLafourche Parish have been concentrated in the water transportation and shipbuilding sectors.
B. Population Changes
Published estimates through the middle of 1997 (Louisiana Dept. of Economic Development,1998) did not indicate marked increases in population as a result of the recent and dramatic increase indeep and shallow water petroleum activity in the Gulf of Mexico. Published Lafourche Parishpopulation estimates provided in Figure 5 indicate slow growth. Population in the parish grew at anannual rate of 0.36 percent from 1990 through 1997 as compared to an annual population growth rate for the entire state of 0.44 percent during the sameperiod. However, as discussed later, there are indications that marked increases in population growthmay be starting to occur.

14
Source: United States Department of Commerce
&
&
&&& & &
&&&&&
&
&& && &&
&& & && && && & &
69 72 75 78 81 84 87 90 93 96
Year
60
70
80
90
100T
ho
us
an
ds
Population&
Source: U.S. Bureau of Census, Construction Statistics Division
+
++
+
+
+
++
+ +
++
+ + ++ +
++
,
,
,
,
,,
, ,
, ,
,, ,
,,, , ,
,
1979 1981 1983 1985 1987 1989 1991 1993 1995 1997
Year
0
100
200
300
400
500
600
700
800
Nu
mb
er
Buildings Units, +
Fi gure5. Popul ationin Lafourche Parish, 1969-1997.
C. Residential Construction Changes
As indicated in Figure 6, residential construction in Lafourche Parish has consistently grown froma low of 136 buildings and 136 units (multi-unit residential buildings include apartment complexes,duplexes, and similar buildings) in 1988 to 358 buildings and 427 units in 1997 (U.S. Bureau of theCensus, 1998). From 1988 through 1997, residential construction grew at an annual rate of 11.15percent in terms of buildings and at an annual rate of 13.82 percent in terms of units. The number ofbuilding units constructed in 1997 either equaled or exceeded 1985 levels. However, residentialconstruction is still less than the levels seen in the late 1970s and early 1980s (the last sustained oilboom).

15
Figure 6. Residential Construction in Lafourche Parish, 1969-1997.
The increase in Gulf of Mexico petroleum and exploration activity and resulting growth in PortFourchon has undoubtedly contributed to the increase in residential construction in recent years. Residential construction, especially in terms of units, has shown continued strong growth from 1995through 1997. However, the recent increase in residential construction (buildings and units) has notdeviated from the longer term 1988 through 1997 growth trend. Accordingly, trends in residentialconstruction provide evidence that recent increases in employment have not translated into markedincreases in local population as of 1997.
D. School Enrollment Changes
Parish school enrollment exhibited modest increases from 1990 through 1997 (Figure 7). Inpercentage terms, the increase in school enrollment was consistent with estimated changes in population. During the 1987-97 period, a low of 17,679 students were enrolled in public and private primary andsecondary education in Lafourche Parish in 1992. Enrollment had increased to 18,759 students by1996, before declining slightly in 1997 (Louisiana Dept. of Education, 1997a).

5 A detailed discussion of the CIM model for Louisiana (LCIM) is provided in Appendix A.
16
Source: Louisiana Department of Education
&
&
&
&
&
&
&
&&
89 90 91 92 93 94 95 96 97175
180
185
190
Pu
pi
ls
(H
un
dr
ed
s)
Pupils&
Figure 7.Public andPrivate K-12Scho
ol Enrollment in Lafourche Parish, 1989-1997.
V. THE LOUISIANA COMMUNITY IMPACT MODEL
A. Introduction
In recent years, policy analysis tools called community impact models (Johnson 1991, 1996)have been developed to provide policy leaders a way to measure the potential impact of policy decisionson designated areas. Community Impact Models (CIM) are a further development from earlier effortswhere models of the local economy have been joined to demographic models of the community (Joneset al., 1988).
CIMs quantify the linkages among the three major components (economy, government revenue,government service provision) of the community economics local government system (Figure 8).5 Whena change in demand for an industry basic to the local economy occurs, initial economy activity develops(Block 1, Figure 8). The interdependency of local industries and spending behavior of local residents

6 For example, as local per capita income grows in Louisiana and many other states, the perstudent level of payments from state to local government supporting K-12 education declines.
17
Change in Demand for Local Industry
[Block 1]
Multiplier Effects in Local EconomyDirect, Indirect and Induced Effects on
Output, Earnings and Employment[Block 2]
Changes in Local Government Revenue
[Block 3]
Changes in Demand for Public Services
[Block 4]
leads to multiplier effects in the local economy (Block 2, Figure 8). An increase in external demand forthe output of the local industry causes that industry to increase its purchases from other local firms andfrom local labor. These purchases are dollars injected in the local economy that in turn drive additionalspending. For example, if shipbuilding grows in Lafourche Parish because of increased OCS petroleum
activity, then
Figure 8. Overview of the Louisiana Community Impact Model
shipbuilders will purchase additional output from local fabricators. The local fabricators will in turn makepurchases of their own. Hence, the re-spending of money interjected by particular types of activityleads to growth in jobs and income in the entire economy. For this study, any Lafourche Parishindustry directly tied to OCS oil and gas activity belongs to the basic set of industries (Block 1, Figure8). A major research challenge, therefore, is ascertaining the change in economic activity for industriessuch as water transportation and shipbuilding, directly due to growth in OCS activity.
Multiplier effects from the local economy simultaneously result in increases in local governmentrevenue and in demand for local public services ((Block 3 and Block 4, Figure 8). Changes in localgovernment revenues are primarily due to changes in various forms of local taxes (usually property andsales) and user fees as the economy grows or declines. Intergovernment transfers from state and federalgovernment to local government entities are another source of local government revenue. Such transferpayments also tend to change in step with local economic activity.6

18
Similarly, the demand placed on services provided by local government grows as the localeconomy grows (Block 4, Figure 8). Changes in local government expenditures occur in a variety ofcategories, such as roads and schools. As the economy grows, for example, population wouldultimately grow meaning that schools and roads would become more congested. Spending by localgovernment would increase as a result. In the CIM, the backward linkages that occur as a result ofgovernment spending also leads to additional multiplier effects within the local economy. That is,spending by local government to alleviate pressure on publicly provided services, such as increasedspending on education, will also interject dollars into the local economy. As local government revenuesincrease, local governments may have some additional discretionary spending, which can be used toprovide new or improved public services.
In this study, a community economic model developed for Louisiana (LCIM, LouisianaCommunity Impact Model) is used to evaluate the impact of the OCS industry on the economy and localgovernment finances of Lafourche Parish. In LCIM, an input-output model and a labor market modeltogether represent the local economy (Block 2 in Figure 8). A fiscal module represents both thegeneration of local government revenue (Block 3 in Figure 8) and the changes in demand for locallyprovided public services (Block 4 in Figure 8). The process originates with estimates of the impact ofOCS activity on Lafourche parish industry that directly support such activity (Block 1, Figure 8).
B. Input-Output and Labor Market Models
Input-output (I-O) analysis allows us to look at the flows of products between differentindustries of an economy in a formalized framework. As such, I-O analysis is especially useful in lookingat (1) the structure of a local economy and (2) secondary effects that may spin off from an initial changein economic activity. An I-O model serves as a framework for collecting, categorizing and analyzingdata that concerns the overall structure of a given regional economy (Schaffer, 1989). Thus, the modelserves as a way to link micro decision making at the firm level to economic events at the regional macrolevel (Powell et al., 1990). The economy is represented with general categories, such as interindustryproduct flows and value-added payments. Relationships between different economic agents areidentified within each major category, such as the level of intermediate product flows between specificindustries. By identifying interrelationships between households and firms and by indicating the presenceor absence of interindustry linkages, I-O models can make an important contribution to the policymaking process (Giarratani, 1990).
"Regional input-output studies attempt to quantify the impacts on the sectors located in aparticular region that are caused by new final demands for products made in the region" (Miller andBlair, 1985, p. 46). Economic multipliers (estimates of the total change in the regional economy resultingfrom an exogenous shock to the economy) are derived by tracing the ripple effect of a given exogenouschange in demand for regionally produced goods and services (Richardson, 1972). Policy relevantquestions concerning the total effect of a demand-side shock to a regional economy, such as or thegrowth or decline of an already established industry (California Commission on State Finance, 1988)can, therefore, be addressed.

7 Changes in the labor force are result in growth in and out commuting. Changes in commutingare netted from local jobs to estimate local jobs going to local workers. These local workersmay be previous unemployed or nonparticipants in the labor market or new residents.
8 The labor market module and the I-O model also interact in accounting for household spendinginduced effect impacts. That is, changes in jobs lead to changes in population and householdearnings. These in turn lead to household spending and additional induced effect impacts.
19
Accordingly, an I-O model is an appropriate tool for examining the impact of growth in OCSpetroleum activity on the economy of Lafourche Parish, especially in regards to growth in PortFourchon. The IMPLAN (Impact Planning) modeling system (U.S. Forest Service 1996) will be usedto compute the I-O model used in this study. IMPLAN is considered a ready-made modeling system. This modeling system relies on secondary data, such as employment, combined with the assumption thatthe regional economy is very similar in structure to the national economy (Hughes and Guedry 1993). Because this assumption is often tenuous, ready-made I-O models should be evaluated and altered inlight of other data sources and knowledge concerning the local economy.
Regional I-O models have been conjoined with models that represent the regional labor marketin various ways for a number of years (Miller and Blair, 1985). For this study, a conjoined model isappropriate because jobs generated in the local economy often go to in-commuters or the previouslyunemployed. Not accounting for these possibilities could lead to overestimation of both local populationand resident income growth. Hence, a labor market module (a set of econometric equations) is alsoused to represent the local economy. This component of the LCIM model allocated demand for laborby firms in the local economy between in-commuters, unemployed local workers, and in-migrants.7 Thiscomponent of the model also provides population estimates as the local economy grows or declines.8
C. Fiscal Module of LCIM
The fiscal model receives input from the conjoined I-O and labor market module. That is,changes in population and earnings from the I-O and labor market model are “drivers” in the fiscalmodule. For example, tax yields from retail sales are a function of population and income growth. Thisgrowth is determined by results from the I-O and labor market module.
Sixteen equations are included in the Louisiana fiscal module. Six of these equations are in therevenue generating part of the module. Two equations measure revenue capacity--assessed value andretail sales. Four direct revenue equations are included--severance tax revenue, state transfer revenue,federal transfer revenue (for both schools and other functions), and other tax revenue.
Ten expenditure equations are estimated in the fiscal model. These equations attempt to explainchanges in spending for school, road, general, administration and other, law enforcement, wastedisposal, hospital, levee and drainage, fire, parks and recreation, and utility expenditures. Hospitalexpenditures include own hospital expenditures, other hospital expenditures, and health careexpenditures. Waste disposal expenditures include solid waste expenditures and sewer expenditures.
9 A sector is either a single industry or an aggregate of industries in the I-O model.
20
Law enforcement expenditures include expenditures for judicial, police, and corrections. General,administration, and other expenditures include financial administration, general services/buildings, library,public welfare, general debt interest, insurance trust, and liquor store expenditures. Changes in localgovernment expenditures are indirectly driven by changes in population and earnings from the I-O andlabor market module. For example, changes in population and earnings drive changes in property taxyields, which in term drive changes in spending in K-12 education by local government.
D. Sectors With Direct OCS Oil Industry Links9
As previously stated, the modeling process sketched in Figure 7 starts with estimating thestrength of linkages between Lafourche Parish industries and OCS petroleum activity. To estimate theimpact of the OCS oil industry on the Lafourche Parish economy, changes in levels of economic activityin all sectors of the Lafourche Parish economy directly affected by the OCS oil industry had to beestimated. Estimates through 1997 and in some cases 1998 were based on a combination of regressionanalyses using employment data (Louisiana Department of Economic Development), telephoneconversations with firms with facilities at Port Fourchon, and data found in Melancon and Robyconcerning OCS Oil Industry activity. Least squares regression analysis was used to aid in ourpredictions concerning the direct impact of OCS oil industry activity on employment in the watertransportation, ship building, and mining industries in the parish. That is, the regression analysis was usedto confirm our observations based on other published sources and on the conversations with firms in thethree industries located at Port Fourchon. Estimates after 1997 were based on the assumptions thatestimated relationship between the OCS oil industry and the sector in question would remain unchangedand of conservative growth in future OCS oil industry activity (4.0 percent per year). Future growthrates are based on the most recent published projects of Gulf of Mexico OCS petroleum activity(Melancon and Roby, February 1998) at the time this research was conducted including the slowdownin OCS petroleum activity due to sharp declines in crude oil prices in the summer of 1998 (Baton RougeAdvocate, August 1, 1998). Growth rates and resulting economic impacts are projected through the year 2002.
Direct major changes in employment and economic activity were estimated for construction,catering, water transportation, petroleum extraction, shipbuilding, and air transportation. Relatively smallchanges in employment and economic activity were estimated for providers of oil field waste disposal, oilworker medical testing services, and equipment rental.
Other parish industries, such as oil spill clean up firms, diving companies, oil field equipmentmanufacturers, and fabricated metal product manufacturers, were also evaluated for changes inemployment due to growth in the offshore oil industry. No growth in employment or output was foundfor these industries in Lafourche Parish in relation to growth in the OCS oil industry. Likewise, firmsclassified as construction companies are often directly responsible for the construction of deepwater,offshore oil rigs. These companies usually fall into SIC category 1629, Heavy Construction NEC. However, data indicated no growth in this sector in Lafourche Parish in relation to OCS oil industry

21
activity, although, in other parts of the state, the sector is expanding in relation to the level of OCSactivities.E. Petroleum-Related Businesses Operating at Port Fourchon
The expansion in port facilities is attributable to the growth of the offshore oil and gas industry. More than 100 businesses are operating at Port Fourchon as of May of 1999 (Falgout, 1999). The vastmajority of these companies are either directly or indirectly involved in supporting OCS activity,including deepwater activity. Major commodities shipped through the port include steel pipe, various oilfield fluids, barite, limestone, and fuel. Further, the port is the major point of departure for offshore oilworkers, virtually all by helicopter (Louisiana Dept. of Economic Development, 1998). As shown inTable 2, these companies fall into a number of major categories.
Table 2
Companies Operating out of Port Fourchon that Support OCS Petroleum Activity
Firm Firm Type
MINING FIRMS:
Oryx Energy co. Oil Company
Greenhill Petroleum Corp. Oil Company
Agip Petroleum Co. Inc. Oil Company
Kinlaw Oil Company (Major)
Phillips Petroleum Co. Oil Company (Major)
Marathon Oil Co. Oil Company (Major)
Arnoco Oil Company (Major)
Kerr McGee Corp. Oil Company (Major)
Shell Offshore Oil Company (Major)
Pool Company Drilling Company
Rowan Petroleum Drilling Company
Diamond Offshore Turnkey Drilling Company
M I Drilling Fluids Oil Field Fluids
Anchor Drilling Fluids Oil Field Fluids
Chemrich Oil Field Fluids
Francis Drilling Fluids Oil Field Fluids
Ambar Oil Field Fluids
Baker Hughes Inteq Oil Field Fluids
Dowell Schlumberger Oil Field Fluids
OSCA Oil Field Fluids
SBM Operators Oil Field Fluids
Bariod Drilling Fluids Oil Field Fluids
Subsea International Pipeline Laying Company
Offshore Pipeline, Inc. Pipeline Laying Company
Shell Pipeline Corp. Pipeline Laying Company
OTHER OIL FIELD SERVICES:
Walsh Environmental, Inc. Computers and environmental testing services
American Oilfield Divers Divers
Buckner Rental Equipment Rentals
C-Port/Stone Fuel Supply
L & L Oil Dock #16 Fuel Supply
Tetra Oil & Gas Services Oil Field Services
Land Treatment Systems, Inc. Oil Field Waste Treatment
Newpark Environmental #1 Oil Field Waste Treatment

22
Cenac Environmental Services Oil Spill Response Firm
Hughes Tool Co. Oil Tool Company
B.J. Services Oil Tool Company
Halliburton Services Oilfield Cement
Chervon Pipeline Company Transmission Pipeline
Table 2
Continued
TRANSPORTATION:
Brown & Root (East Main Yard) Intermodal Terminal
Gulf Star Oilfield Services, Inc. Intermodal Terminal
Ocean Marine Operators Intermodal Terminal
Martin Fuel Dock Intermodal Terminal
C-Port Intermodal Terminal
Offshore Logistics, Inc. Helicopter Transportation Company
Era Aviation Helicopter Transportation Company
PHI Helicopters Helicopter Transportation Company
Airlogistics Helicopter Transportation Company
Evergreen Helicopters, Inc. Helicopter Transportation Company
Packard Trucking Trucking
Ace Transportation Trucking
Gulf South Systems Tanks for Truck Transportation of Oil Field Fluids
Bollinger Fourchon, L.L.C. Shipyard
MISCELLANEOUS SERVICES:
Lafarge Coporation Construction Cement
R & C Supply & Lumber Co., Inc. Hardware Store
Danos & Curole Labor Contractor (Stevedores)
Lafouche Services, Inc. Medical Testing, Job Drug Testing
Kajun Sportsman Truck Stops Restaurant
Source: Unpublished Records, Greater Lafourche Port Commission, 1998.
1. Petroleum Production Firms: Nine petroleum production companies maintain operations atPort Fourchon including major oil producers, such as Phillips Petroleum, and smaller, less well knowfirms, such as Greenhill Petroleum Corporation (Table 2). Based on discussion with local firms andobservation by the Port Director, oil producers have a relatively small number of employees located atthe Port (dispatchers and a petroleum engineer). These individuals are responsible for dispatchingequipment and other materials to offshore rigs through either inland barge to ship or truck to ship(intermodal) transportation facilities at the Port (Falgout, 1997). They are also responsible fordispatching personnel to and from offshore rigs.
Nineteen other firms at the Port fall into the SIC Code 13 Oil and Gas Extraction (Mining)Category (Table 2). These companies provide a variety of oil field production support facilities. Tenfirms provide various drilling fluids, such as drilling muds (Falgout, 1997). Drilling fluid companyemployees at Port Fourchon are responsible for overseeing the intermodal transfer of drilling fluids, fuel,and water to offshore rigs. The employees also provide a variety of special services as needed. At leastthree independent drilling companies also operate out of Port Fourchon as do several oilfield pipelinelaying companies, some of which are subsidiaries of major petroleum producers.

23
Based on telephone conversations with all of the firms located at the port, 29 companies identifiedas belonging to SIC 13 (Petroleum Mining) employed an estimated total of 533 people. More than 80percent of all current employment was credited to OCS activity. Of the 14 companies that responded toour inquires in early June 1998, an average increase in employment of 7.2 percent was indicated in thenear future due to increased activity in the deepwater OCS. Regression analysis provided in Table 3show mining employment in Lafourche Parish as positively and significantly related to the number of deepwater production plans filed with MMS.
Table 3
Ordinary Least Squares ( Regression) Analysis Results Indicating Employment in Lafourche Parish WaterTransportation, Ship Building, and Mining Industries as a Function of Deep Water Outer Continental
Shelf Oil Industry Activity.
Independent Variable -------- ----------------- Regression Equation-------------------
Water Transportation Ship Building Mining
Constant 1850.5* 724.55* 901.8*
Exploration Wells 1.3850 Na Na
Deep Water Production Plans 15.629*** Na 3.1402***
Deep Water Production Na .007996* Na
Number of Observations 7 13 7
R-Square 0.9435 0.6757 0.6828
Adjusted R-Square 0.9135 0.6462 0.6194Note:Values in the table are beta values.*Significant at the " = .001 probability level**Significant at the " =.01 probability level.***Significant at the " = .05 probability level.**** Significant at the " =.10 probability level.Na means that the equation in question does not contain that particular independent variable.Results for ship building are based on annual data for deep water production and parish employment; results for watertransportation and mining are based on quarterly data (1995-1st quarter 1998) for exploration wells, deep waterproduction plans, and parish employment. Data for the various measures of OCS production and exploration camefrom Melancon and Roby (1998). Employment data came from the Louisiana Department of Economic Development(1998).
The regression analysis indicated that one additional plan would be expected to result in a slight increase(3.1 percent) in mining jobs in Lafourche parish. Our projected increase in jobs (7.2 percent) was also

24
,
,
, ,
,
,
,,, ,
,
,, ,
,, ,
1982 1984 1986 1988 1990 1992 1994 1996 1998
Year
0
500
1000
1500
2000
Jo
bs
Jobs,
consistent with a slight increase in petroleum extraction employment credited to Lafourche Parishbeginning in 1995 (Figure 9).
2. Other Oilfield Support Firms: A variety of firms at Port Fourchon fall into the other oilfieldsupport services category (Table 2). Analysis of telephone conversations with such firms indicates thatthey have a small number of employees at the port. Still, the various services that they provide areimportant. Such firms also belong in a variety of different SIC categories. Two oilfield waste treatmentfirms are present at the Port as is one oil spill response company. At least
Figure 9. Petroleum Mining Employment in Lafourche Parish, 1982-1998.
one company provides diving services to the offshore petroleum industry. Several companies providefuel supplies while at least one company provided medical testing facilities for workers. Several major oiltool manufacturers, such as Hughes Tools, have employees at the port. Providers of oil field cement,used to plug-up dry wells and for other purposes, are also present.

25
Source: U.S. Dept of Commerce, Louisiana Department of Labor
$
$
$ $
$
$
$
$ $ $
$ $$
1985 1986 1987 1988 1989 1990 1991 1992 1993 1994 1995 1996 1997
Year
0
500
1000
1500
2000
Jo
bs
Jobs$
Based on telephone conversations with firms, small increases in employment in oil field wastetreatment, medical, and equipment rental sectors of the economy were assumed for the period of analysis(1995 through 2002). No growth in employment was assumed for firms that deal with oil field spills orfor diving companies.
3. Shipbuilding: Shipbuilding is an activity in Louisiana that has historically had strong ties to theoffshore oil and natural gas production industry. Three types of drilling rigs (jack up, semi-submersible,and drill ship) are used for exploratory wells in offshore waters (Minerals Management Service,November 1997). Drill ships are ship shaped vessels usually used for such a purpose in water depths ofmore than 750 meters. These vessels are usually constructed by shipbuilding firms (Minerals Management Service, November 1997). In fact, shipbuilding throughout theGulf Coast states has undergone a dramatic revitalization, in large part due to renewed activity in theOCS.
Figure 10. Shipbuilding Employment in Lafourche Parish, 1987-1997.

26
Employment in shipbuilding has grown in Lafourche Parish to the point where it is the majorparish manufacturing sector (Figure 10). Major shipbuilders in the parish include Bollinger Shipyards,with three facilities (at Larose, Lockport, and Port Fourchon), North American Shipyards, and AlliedShipyards, among others (Louisiana Dept. of Economic Development). Seven shipbuilding firms havefacilities located in the vicinity of Port Fourchon. Certain facilities, such as the Bollinger facility at PortFourchon, provide vessel repair services. Other facilities, such as the Bollinger yard in Lockport, arebeing used to construct ships, some up to 200 feet in length (Bollinger Shipyards Inc, 2000).
Shipbuilding in the parish is positively and highly significantly related to deep water productionlevels based on the regression analysis provided in Table 3. That is, deepwater OSC activity has beenresponsible for a significant share of the employment growth in shipbuilding. Based on the R-squareregression value reported for the shipbuilding employment equation reported in Table 3, deepwater OCSactivity has been responsible for 65 percent of the employment growth in shipbuilding from 1985-1997. This percentage is comparable to the statement by industry officials that 75 percent of shipbuildingemployment in Louisiana is tied to OCS petroleum production activity (Minerals Management Service, November 1997).
Regression results indicated that a 10 percent increase in OCS deepwater activity would be expected tolead to a 7 percent increase (120 more jobs from 1997 levels) in shipbuilding employment in LafourcheParish.
4. Water Transportation: Firms falling in the SIC category of Water Transportation (SIC 44)have experienced the largest levels of growth in Lafourche Parish due to deepwater OCS activity (Figure11). Employment in the sector has increased rapidly since 1995 with a net gain of 167 jobs in 1996, anadditional 323 jobs in 1997, and over 400 new additional jobs in the first quarter of 1998 (LouisianaDepartment of Labor, 1998). The sector has been, and continues to be, one of the largest sources ofemployment in the parish. It was directly responsible for 6.7 percent of all employment in LafourcheParish (with 2,176 jobs) in 1992. By the first quarter of 1998, the percent of parish employment directlyattributable to water transportation increased to 3,394 jobs, or 8.4 percent of total employment in theparish. Regression analysis based on quarterly employment data from 1995 through the first quarter of1998 showed that water

27
Source: Louisiana Department of Labor
&
&
& &&
&&
&& & &
& &&&&
&
1982 1984 1986 1988 1990 1992 1994 1996 1998
Year
0
1000
2000
3000
4000
Jo
bs
Jobs&
Fi gure11 .W aterTr ansporta tionE mploym ent inLa fourche Parish, 1982- 1998.
transportation in Lafourche Parish was a function of OCS exploration wells and deep water productionplans (Table 3). That is, the regression analysis indicates that the increase in employment in the sectorsince 1995 has been attributable to growth in deep water oil industry exploration and production activity.
Major water transportation firms at Port Fourchon are often also classified as intermodal terminaltransportation companies. That is, usually using cranes, they either offload equipment and other materialfrom inland barges or trucks to ocean going vessels for transport to offshore rigs or offload materials

28
from such vessels that have been picked up from offshore rigs. Such firms include Edison Chouest, whichoperates the recently constructed C-Port facility designed to service its own supply vessels. Hence, suchcompanies provide crane loading, fuel delivery, and other services. Some companies provide suchservices to subleases; for example, Brown and Root operates crane services as a sublease from MartinTerminal (Falgout, 1997). Five companies were identified as operators of intermodal terminal facilities atPort Fourchon (Table 2).
A variety of other services are provided by other companies classified as water transportationfirms. At least five companies in the area provide barge lines while six companies provide barge fleets(Louisiana Dept. of Economic Development, 1998). Liquid bulk items, such as water, fuel, oil fieldwaste, and oil field fluids, are generally moved by inland barge either into or out of Port Fourchon(Falgout, 1997). More than forty firms in the Port Fourchon region were identified as providing tugboatservices for barges and other shipping activity (Louisiana Dept. of Economic Development, 1998).
5. Motor Freight (Trucking) Companies: Five firms that all specialize in providing motorfreight or trucking services to the petroleum industry have dispatchers at Port Fourchon. All of thesecompanies have headquarters and major dispatch centers elsewhere in places such as Morgan City andLafayette. However, a review of the dispatch records for several companies indicated that a few driversreside in Lafourche Parish. Trucking companies are responsible for the transportation of less bulky items,(liquid bulk items are delivered to the port by inland barge if possible) (Falgout, 1997). Truckingcompanies transport most of the pipe, other equipment, groceries and other worker supplies that movethrough Port Fourchon to offshore rigs. While the five firms are undoubtedly the most importantproviders of motor freight services to Port Fourchon, other trucking firms, such as SAIA, also make asignificant number of deliveries to the port. Because the only alternative mode of transportation is inlandbarges, trucking companies provide a vital link to Port Fourchon. As discussed in more detail in thecompanion document, “An Analysis of LA Highway 1 in Relation to Expanding Oil and Gas Activity inthe Central Gulf of Mexico” (Guo et al., 2000), the dramatic recent increase in truck traffic to PortFourchon has strained the quality of services provided by LA 1, the only road leading directly to PortFourchon.
6. Air Transportation (Helicopter Companies): Five companies were identified as providinghelicopter transportation services to offshore facilities from Port Fourchon (Table 2). These firms allspecialize in providing oil industry air transportation support services, often throughout the Gulf Coast. The companies usually belong to either SIC Code Classification 4512 (Air Transportation Scheduled),SIC 4522 (Air Transportation Nonscheduled), or SIC 7359 (Miscellaneous Equipment Rental andLeasing, NEC). Such firms ferry workers and other as needed to and from offshore oil rigs. Anestimated 6,000 workers annually move through Port Fourchon by helicopter to offshore rigs. Theseworkers work on rigs for two weeks and then have two weeks off (Falgout, 1997).
Three helicopter companies at Port Fourchon responded to our inquiries in the Spring of 1998. Assuming the three companies are representative of all five helicopter companies at the port, helicoptertransportation firms employed a total of 222 workers at Port Fourchon. Of the three companiesresponding to our inquiries, an increase of 31.8 percent in employment in the

10 Because Port Fourchon has a low population base, most indirect and induced effects wouldoccur elsewhere in the Parish. In terms of direct growth, increases in water transportation andair transportation would be for firms located at the port. Some growth in petroleum extraction,nonresidential construction, ship building and repair, eating and drinking establishments, andservices industries would be in facilities located at Port Fourchon. The percent of growth atthe port would vary between industries.
29
near future was expected because of increased deepwater OCS activity. Based on company inquiriesand unpublished state employment for Lafourche Parish through 1997, more modest increases inemployment and output were assumed for the sector.
F. LCIM Model Results
Results from the LCIM are provided in terms of the input-output module, labor force module,and fiscal impacts module. Model results are used to assess the impact of the OCS petroleum industryon the Lafourche Parish economy. To properly evaluate the impact of OCS activity, one should accountfor economic growth that would have occurred in the parish without it. Such a baseline estimate is thechange in the local economy and fiscal sector that would have occurred without the recent and projectedgrowth in OCS petroleum activity.
It is assumed that the economy of Lafourche Parish would have grown at an annual rate of 1.0percent from 1995-1998 and at 0.5 percent from 1999-2002 without the development of the OCSpetroleum industry. These growth rates were based on discussions with local government and businessleaders and examination of population and employment trends. Employment data for major employersoriented toward outside markets and with no connection to the OCS oil industry were especiallyscrutinized. Employment data for other industries important to the Lafourche Parish economy, such assugar mills and farm machinery manufacturing, indicated little or no growth. Overall population growthalso indicated a slow growing economy without any growth in the OCS oil industry.
G. Results From the Input-Output Module
As previously discussed, direct growth in employment and output was estimated for numerousparts of the Lafourche Parish economy due to OCS petroleum activity. IMPLAN sectors experiencingdirect growth included Petroleum Extraction, Nonresidential Construction, Ship Building and Repair,Water Transportation, Air Transportation, Eating and Drinking Establishments, and Services. All othersectors provided in Table 4 and Table 5 experienced purely indirect and induced impacts in jobs andoutput.10
The OCS petroleum industry has and will continue to have a significant impact on the LafourcheParish economy according to model results. The industry was responsible for estimated direct andindirect employment impacts of 531 jobs in 1995, 864 jobs in 1996, 1,270 jobs in 1997 (Table 4). Employment impacts are predicted to peak at 1,424 jobs in 1998. Lower impacts in 1999 through 2002are a result of conservative estimates (made based on volatile oil prices) concerning future growth in OCS

30
petroleum activity. Growth in output showed a similar pattern as output growth peaked at $147 million(1995 constant dollars) in 1998 (Table 5). It is
Table 4
Direct, Indirect, and Induced Changes in Employment due to OCS Petroleum Industry Activity
in Lafourche Parish, 1995-2002
IMPLANSECTOR 1995 1996 1997 1998 1999 2000 2001 2002
1 Agriculture 4.2 6.8 10.1 11.2 4.7 4.8 4.9 5.0
28 Mining 0.0 0.0 0.0 0.0 0.0 0.0 0.0 0.0
38PetroleumMining 41.4 88.3 33.1 39.6 7.6 7.7 7.7 8.0
48 Construction 0.8 1.4 2.0 2.3 0.7 0.7 0.7 0.8
49NonresidentialConstruction 29.9 74.3 124.2 183.1 123.7 123.6 123.7 123.9
58 Manufacturing 6.3 11.1 17.3 18.6 7.5 7.6 7.8 8.0
392 Ship Building 16.5 73.7 107.8 37.4 37.7 39.7 41.8 43.8
433Transport andUtilities 15.5 23.6 38.0 43.9 12.7 13.1 13.5 14.0
436WaterTransportation 132.8 166.5 322.3 400.9 82.1 85.5 89.0 93.6
437AirTransportation 0.0 7.0 7.3 2.6 2.1 2.1 2.1 2.1
447 Trade 51.4 89.1 135.0 149.5 58.1 59.4 60.7 62.2
454Eating andDrinking 82.3 93.1 105.2 108.9 81.8 82.2 82.6 83.1
456Finance andReal Estate 22.9 37.0 54.1 61.4 19.2 19.8 20.3 21.0
463 Services 112.1 168.2 276.1 322.8 95.7 98.4 101.1 104.6
510 Government 15.0 23.7 37.0 42.2 13.4 13.8 14.2 14.6
Total 531.1 863.8 1,269.5 1,424.4 547.0 558.5 570.1 584.7
Source: Louisiana Community Impact Model(LCIM), Input-Output Module, IMPLAN.
Note: direct changes in employment are in petroleum mining, ship building, water transportation, air
transportation, nonresidential construction, eating and drinking establishments, and services. Changes in
agriculture, manufacturing, and transport and utilities are primarily indirect effects while changes in construction,
finance and real estate, services, and government are primarily induced effect changes.
important to note that impacts are assumed to be additions to growth in previous years. Hence, over theentire eight-year period, employment impacts are estimated at 6,349 jobs while total changes in outputare estimated to be $603 million.
Estimated direct employment impacts due to the OCS petroleum industry in Lafourche Parishwere 289 jobs in 1995 (54.4 percent of 531 total jobs), 476 jobs in 1996 (37.5 percent of 864 totaljobs), 732 jobs in 1998 (57.6 percent of 1,270 total jobs), and 330 jobs in 2001 (57.9 percent of 570total jobs) (Table 4). Accordingly, an “average” job in industries with direct links to OCS petroleumproduction lead to 1.837 total jobs (531 total jobs divided by 289) in the parish in 1995 (or 0.837

31
additional jobs for one direct job). Likewise, in 1998, 1.735 total jobs and in 2001 1.727 total jobswere generated by an average OCS petroleum related job. Among sectors with purely indirect andinduced impacts, finance and real estate and trade experienced relatively large job impacts. Fairly largejob impacts in services (323 jobs in 1998) were primarily due to the indirect and induced effects of theOCS petroleum industry on Lafourche Parish.
Table 5
Direct, Indirect, and Induced Changes in Output due to OCS Petroleum Industry Activity in Lafourche Parish, 1995-2002
IMPLAN SECTOR 1995 1996 1997 1998 1999 2000 2001 2002
1 Agriculture 118,010 191,305 281,665 313,913 131,567 134,028 136,490 139,573
28 Mining 371 623 1,016 1,219 478 487 496 506
38 Petroleum Mining 5,953,370 12,689,510 4,751,326 5,689,134 1,094,849 1,101,419 1,107,990 1,150,442
48 Construction 74,165 119,850 175,614 199,282 62,381 64,108 65,836 68,072
49NonresidentialConstruction 1,930,960 4,806,941 8,033,479 11,843,560 7,995,308 8,000,572 8,005,836 8,012,560
58 Manufacturing 1,196,732 2,105,997 3,271,762 3,532,117 1,416,582 1,448,684 1,480,786 1,520,004
392 Ship Building 1,346,230 5,999,970 8,779,054 3,045,815 3,073,855 3,239,215 3,404,575 3,570,718
433Other Transport andUtilities 2,546,139 3,894,207 6,259,432 7,225,241 2,098,405 2,161,164 2,223,923 2,305,280
436WaterTransportation 25,644,802 32,131,138 62,210,520 77,364,184 15,842,864 16,511,623 17,180,382 18,072,058
437 Air Transportation 44,876 1,066,688 1,122,347 403,138 321,053 322,268 323,484 324,996
447 Trade 2,729,803 4,730,583 7,164,705 7,935,991 3,083,769 3,151,656 3,219,542 3,304,033
454 Eating and Drinking 2,466,967 2,792,038 3,156,510 3,262,391 2,454,132 2,465,374 2,476,617 2,490,778
456Finance and RealEstate 3,359,889 5,430,565 7,952,549 9,023,963 2,824,318 2,902,541 2,980,764 3,082,023
463 Services 5,533,917 8,306,355 13,632,294 15,941,126 4,723,668 4,857,169 4,990,671 5,163,155
510 Government 427,785 677,955 1,057,866 1,205,357 383,335 393,718 404,101 417,432
Total 53,374,016 84,943,725 127,850,139 146,986,431 45,506,564 46,754,026 48,001,493 49,621,630
Source: Louisiana Community Impact Model(LCIM), Input-Output Module, IMPLAN.
*All Values in 1995 dollars.
Note: direct changes in employment are in petroleum mining, ship building, water transportation, air
transportation, nonresidential construction, eating and drinking establishments, and services. Changes in
agriculture, manufacturing, and transport and utilities are primarily indirect effects while changes in construction,
finance and real estate, services, and government are primarily induced effect changes.
1. Changes in Parish Population: Model predictions from the LCIM model indicate growth inpopulation due to the effects of the OCS petroleum industry (Figure 12). Population estimates made bythe U.S. Census Bureau through 1997 indicate that the Lafourche Parish population has continued toexperience slow growth despite the growth in the OCS petroleum industry. For example, the U.S.Census Bureau estimated the population at 87,391 in 1994 and 88,360 in 1997 (Louisiana Dept. ofEconomic Development, 1998) (an increase of only 1.1 percent over four years). As previouslydiscussed, public and private school enrollment data in the parish confirmed the slow growth inpopulation as did discussions with local government officials. Dramatic declines in the level ofunemployment in the Parish (starting in 1995) indicate that much of the job increase in the local economyhas gone to the previously unemployed and to workers commuting into the parish.
As of June 1998, unemployment was at very low levels (roughly 2.2 percent of the current laborforce) (Louisiana Dept. of Economic Development, 1998). According to the results from equation 2 in

32
Source: Louisiana Department of Economic Development, Louisiana Community Impact Model
$
$
$$
$
$$
$$
87.13 87.085
87.523
88.246
89.242
89.695
90.156
90.624
91.102
'
'
' ' ' ' ' ' '
87.13 87.11287.239
87.40187.516
87.63187.747 87.863
87.98
&
&
&&
87.13
87.88688.113
88.36
1994 1995 1996 1997 1998 1999 2000 2001 2002
Year
85
86
87
88
89
90
91
92
Po
pu
la
ti
on
(T
ho
us
an
ds
)
Actual Baseline Oil Shock& ' $
the labor force model, as unemployment reaches such low levels, population levels should begin to showstrong growth (Figure 12). For example, model results predict an increase in population of 4.2 percent(3,714) from 88,263 in 1997 to 91,977 in 2002. Increases in residential water main hookups (Barrios, 1998) of 2 percent from 1997 to 1998 provide additionalevidence of very recent population growth not yet reflected in published population estimates.
Figure 12. Actual versus Predicted Population Change, Lafourche Parish, 1994-2002.
2. Local Government Revenue and Expenditure Impacts: The fiscal component of the LCIM model was used to estimate the effects of the OCS petroleum industry on the ability of localgovernment to deliver publicly provided goods and services. Growth in a local economy will inevitableplace additional pressures on and hence increase the cost of providing services such as roads andschools. At the same time, growth should also increase local government revenues such as property andsales taxes. As previously discussed, net changes in local government spending and revenue in LafourcheParish due to the OCS petroleum industry are evaluated in comparison to the baseline change ineconomic activity.
2.a Changes in local government expenditures: Results from the fiscal module of the LCIMmodel indicate increases in the various expenditure categories due to the OCS petroleum industry (Table

33
6). Results are based on direct, indirect, and induced increases in economic activity (in particularpopulation) due to the OCS petroleum industry. Total expenditures by local government were projectedto increase by $5.325 million (1995 constant dollars) in 1998 from 1995 levels (a 3.6 percent increase)and by $9.551 million in 2002 from 1995 levels (a 6.4 percent increase). The school system was thelargest government expenditure item as it was responsible for 45.4 percent of all local governmentspending in 1995 and 45.0 percent in 2002. By 2002, expenditures on the public school system are predicted to increase to $71.152 million from $67.803million in 1995 (a $3.349 million increase equal to 4.9%).
Expenditures on local public schools had the largest absolute increases from 1995 to 2002 amongthe ten expenditure categories accounted for in the model. Other categories with large absolute increasesin spending from 1995 to 2002 included health care ($1.722 million), law enforcement ($1.300 million),and general administration ($1.259 million). In relative (percentage) terms, general administration (17.4percent) had the largest increase from 1995 to 2002 among the ten expenditure categories accounted forin the model followed by law enforcement (12.6 percent) and waste disposal (12.0 percent).
Table 6
Predicted Changes in Local Government Expenditures for Lafourche Parish Under OCS Oil Indus try Development, 1995-2002
ITEM 1995 1996 1997 1998 1999 2000 2001 2002
Schools 67,803,374 68,215,394 68,834,204 69,647,711 70,015,649 70,388,676 70,767,048 71,152,432
Roads 5,893,196 5,871,521 5,849,560 5,892,238 5,912,727 5,934,347 5,957,215 5,981,546
GeneralAdministration 7,216,990 7,423,809 7,700,174 7,971,014 8,094,095 8,219,118 8,346,123 8,475,637
Law Enforcement 10,327,916 10,520,355 10,790,402 11,082,011 11,214,867 11,350,025 11,487,535 11,627,975
Waste Disposal 6,636,528 6,759,949 6,929,256 7,104,291 7,183,865 7,264,709 7,346,850 7,430,627
Healthcare 37,325,518 37,513,344 37,823,329 38,249,931 38,444,177 38,641,691 38,842,526 39,047,506
Levees andDrainage 2,176,751 2,187,705 2,205,782 2,230,661 2,241,989 2,253,508 2,265,220 2,277,174
Fire Protection 1,148,909 1,154,690 1,164,232 1,177,363 1,183,342 1,189,421 1,195,603 1,201,913
Parks 1,900,503 1,910,067 1,925,850 1,947,571 1,957,462 1,967,519 1,977,744 1,988,181
Utilities 8,225,803 8,334,764 8,493,892 8,678,092 8,762,101 8,847,619 8,934,678 9,023,646
TOTAL 148,655,488 149,891,598 151,716,681 153,980,884 155,010,274 156,056,632 157,120,543 158,206,637
*All Values in 1995 dollars.
Source: Louisiana Community Impact Model(LCIM).
2.b Changes in local government revenues: Results from the fiscal module of the LCIMmodel indicate increases in the various revenue categories due to the OCS petroleum industry (Table 7). Like the expenditure estimates, results are based on direct, indirect, and induced increases in economicactivity (in particular population) due to the OCS petroleum industry. Total revenues received by localgovernment were projected to increase by $11.874 million (1995 constant dollars) in 1998 from 1995levels (a 6.6 percent increase) and by $20.028 million in 2002 from 1995 levels (a 11.2 percentincrease).

11 Local government entities in Louisiana can not have budget surpluses or deficits over the longrun. Hence, assuming that model results are correct, either government spending must increaseor tax levels decrease to provide a balance budget for all forms of local government inLafourche Parish.
34
Table 7
Predicted Changes in Local Government Revenues for Lafourche Parish Under OCS Oil Industry Development, 1995-2002
ITEM 1995 1996 1997 1998 1999 2000 2001 2002
Total Sales Tax Revenue 16,974,524 17,626,203 18,495,386 19,345,254 19,731,298 20,123,338 20,521,508 20,927,461
Net Advoloreum TaxRevenue 23,329,084 23,908,271 24,688,196 25,464,974 25,818,014 26,176,643 26,540,977 26,912,526
Total Severance Tax 500,835 500,835 500,835 500,835 500,835 500,835 500,835 500,835
Total StateTransfer(Transport) 724,546 728,192 734,209 742,490 746,261 750,095 753,994 757,973
Total StateTransfer(School) 41,649,257 41,618,296 41,661,868 41,351,387 41,212,202 41,212,202 41,212,202 41,212,202
Total Federal Transfer 9,931,268 9,981,243 10,063,722 10,177,229 10,228,912 10,281,465 10,334,901 10,389,441
Other tax Revenue 70,648,088 71,694,496 73,143,662 74,670,369 75,363,507 76,067,129 76,781,429 77,509,328
Other State Transfer 12,793,013 13,730,581 14,958,177 16,110,699 16,634,069 17,165,487 17,705,139 18,255,268
Total FederalTransfer(Other) 2,469,727 2,482,155 2,502,666 2,530,893 2,543,745 2,556,814 2,570,103 2,583,666
TOTAL 179,020,342 182,270,273 186,748,721 190,894,130 192,778,843 194,834,008 196,921,088 199,048,699
*All Values in 1995 dollars.
Source: Louisiana Community Impact Model(LCIM).
2.c Net costs to local government: Model results in Figures 13 through 15 indicate a markedincrease in both expenditures ($9.551 million by 2002) and revenues ($20.028 million by 2002) due tothe effect of to the OCS petroleum industry. As expected, changes in both variables are much largerthan under the baseline scenario. Further, under the OCS scenario, the effect of increased populationcauses revenues to increase more rapidly than expenditures (Figure 15).11 Hence, model results implythat ongoing activity in the Gulf of Mexico should not place additional strains on the ability of localgovernments to deliver publicly provided services. However, this result should be tempered by the factthat certain costs -– such as construction of new infrastructure -- being incurred by local governments due

12 It is also possible that a lag may occur between immediate service needs and a governmentrevenues (such as growth in property taxes) that do not occur immediately. However, giventheir reliance on sales taxes as a revenue source, this is probably not a problem for LafourcheParish Governments.
35
to the OCS petroleum industry are not accounted for in model results.12 Such costs should be seen as anaddition to costs increases predicted by the model.

36
Source: Louisiana Community Impact Model (LCIM)
,
,
,, , , , ,
&
&
&
&
&
&
&
&
1995 1996 1997 1998 1999 2000 2001 2002
Year
145
150
155
160S
pe
nd
in
g
(M
il
li
on
s
$)
Spending Baseline Spending& ,
Figure 13. Estimated Local Lafourche Parish Government Spending under Baseline and Oil Shock Scenarios, 1995-2002.

37
Source: Louisiana Community Impact Model (LCIM)
,,
, , , , , ,&
&
&
&
&&
&&
1995 1996 1997 1998 1999 2000 2001 2002
Year
170
180
190
200
210
Re
ve
nu
e
(M
il
li
on
s
$)
Receipts Baseline Receipts& ,
Figure 14. Estimated Local Lafourche Parish Government Revenue under Baseline and Oil Shock Scenarios, 1995-2002.

38
Source. Louisiana Community Impact Model (LCIM)
,,, , , , , ,
+
+
+
+
++
++
1995 1996 1997 1998 1999 2000 2001 2002
Year
20
30
40
50
Bu
dg
et
Su
rp
lu
s
(M
il
li
on
s
$)
Oil Shock Net Baseline Net+ ,
Figure 15. Estimated Local Lafourche Parish Government Revenues Less Costs under Baseline and Oil Shock Scenarios, 1995-2002.

39
H. Additional Pressures on Publicly Provided Services
Certain publicly provided services are tied to the unique needs of the offshore oil industry. Schools, city water, and roads have been especially impacted by certain aspects of growth unique to theoffshore oil industry, especially in Lafourche Parish. By and large, these additional pressures were notaccounted for in the previously discussed LCIM model results. Hence, efforts were made to assess theimpact of OCS industry growth on the quality, quantity, and additional expense of providing suchservices.
1. City Water: The provision of clean water has become a critical local need for the offshoreoil industry based out of Port Fourchon. According to Dirk Barrios, supervisor of Lafourche ParishWater District #1 at Lockport, between 1.2 million and 1.5 million gallons of water per day is beingdelivered to Port Fourchon. However, firms at the port indicate a minimum need of 4.0 million gallonsper day. Firms have even brought water in barges into Port Fourchon in some cases, although the wateris still provided by parish government. Water usage has increased dramatically because of use in drillingmuds and in washing down equipment and infrastructure at the Port and offshore. As noted earlier,employment in shipbuilding has increased dramatically in the recent past. Shipbuilders in the parish, suchas Bollinger, also use large amounts of water in their operations. Also, residential demand for city waterservices has increased recently.
A $10 million bond is in place to pay for increasing the capacity of the water district plant and theability to deliver water to the Port Fourchon area. An 18-inch pipe to the port has been installed, twonew storage tanks have been built at the Port, and booster pump improvements have also been made. These improvements were finished in the summer of 1999. The ability to deliver water to the areaincreased by 1.0 million gallons per day as a result. The capacity of the water plant also increased from 8million to 12 million gallons per day. Two construction projects in the winter of 1998 and 1999 also ledto necessary improvements in filtering and pumping capacity (both needed to support the long-runincrease in capacity). The 12 million gallons per day production goal was obtained by the end of thesummer of 2000. The improvements are being supported by a $10 million bond and by water usagecharges in the Port Fourchon area. Sale tax revenues from throughout the parish (with the exception ofthe cities of Thibodaux and Lockport) are being used to payoff the bond.
2. Roads: The quality of roads in Lafourche Parish, especially LA 1, has become an importantconcern for local government officials. Because it is a state road, local government is not responsible forany new construction on LA 1 or for its upkeep and maintenance. Still, the serviceability of the road is ofvital importance to local residents and to the OCS offshore petroleum industry based out of PortFourchon. The companion study “An Analysis of LA Highway 1 in Relation to Expanding Oil and GasActivity in the Central Gulf of Mexico” (Guo et al., 2000), has indicated that the large growth in trucktraffic to Port Fourchon due to OCS petroleum activity was significantly affecting the quality of the road. At the very least, current and projected growth in truck traffic was expected to increase the need torepave and upgrade the road in a number of respects.

40
3. Additional Costs to Local School System: The local school system is also bearingadditional costs due to the OCS petroleum industry, some of which are not accounted for in modelresults. In migration of foreign national workers has resulted in additional demand for locally providededucational services in the form of English as a second language class and expansion of vocationaleducation programs (Minerals Management Service, 1997). Changes in school expenditures due topopulation growth are accounted for in LCIM model results reported in this study. However, certainincreased expenditures, such as English as second language classes, are extraordinary costs that are notaccounted for in model results. Hence, increases in expenditures by the local school system due to suchextra activities are an additional cost for local government.
VI. SUMMARY AND CONCLUSIONS
The OCS petroleum industry is causing substantial levels of growth at Port Fourchon and in theLafourche Parish economy in general. Model results are based on the assumption that the level of activityfor the OCS petroleum industry will increase at an annual rate of 4 percent. These assumptions may ormay not be correct given changes in key factors, such as crude oil prices. However, this growth ispredicted to continue at least through the year 2002. As a result, increases in economic activity andpopulation growth through the year 2002 are predicted to be substantial.
Model results also included estimates of resulting changes in revenues paid to and expendituresmade by local government in Lafourche Parish. Model results indicated that the expanding OCSpetroleum industry will lead to marked increases in both expenditures by and revenues to localgovernment. By themselves, results imply that local government should be able to continue to meetincreases in expenditures caused by that activity. In comparison to baseline growth, increases in revenuesincreased at a more rapid rate than did increases in expenditures. However, additional costs, such asEnglish as a second language classes in the school system, may not always be reflected in model results. Hence, in the final analysis, the ability of parish government to meet increases in costs due to theexpansion of the OCS petroleum industry could be problematic.
Finally, the history of the development of the OCS petroleum industry and the resulting impactson economic activity and population levels in Lafourche Parish has been boom and bust. Projectedincreases in population and economic activity could and in some categories are already requiringsubstantial new investment in local infrastructure. If activity in the OCS petroleum industry shoulddecrease rapidly in the future, local government may incur the costs of infrastructure development withoutobtaining the levels of revenue needed to meet such costs.

41
REFERENCES
American Petroleum Institute. 1998. Energy and the Gulf of Mexico. Website: www.api.org/chs/gulf/.
Barrios, D. 1998. Supervisor, Lafourche Parish Water District #1 at Lockport. June 1998. Oral andWritten Communications. Lockport, LA.
The Baton Rouge Advocate. 1998. Oilfield Supply Boat Orders Drop Off as Oil Prices Decline. Saturday, August 1.
Baud, R.D., R.H. Peterson, C. Doyle, and G.E. Richardson. 2000. Deepwater in the Gulf of Mexico:America’s Emerging Frontier. U.S. Dept. of the Interior, Minerals Management Service, Gulf ofMexico OCS Region, New Orleans, LA. OCS Report MMS 2000-022.
Bollinger Shipyards Inc. 2000. Bollinger Shipyards, Inc. Lockport, LA. Website:www.bollingershipyards.com.
California Commission on State Finance. 1988. Impact of Federal Expenditures on California.Sacramento, CA.
Cranswick, D. and J. Regg. 1997. Deepwater in the Gulf of Mexico: America’s New Frontier. U.S.Dept. of the Interior, Minerals Management Service, Gulf of Mexico OCS Region, New Orleans,LA. OCS Report MMS 97-0004.
Deller, S.C. and M. Shields. 1996. The Wisconsin Extension Fiscal Impact Model: Preliminary Results.Presented at the Community Economic Modeling Conference, June, Madison, WI.
Giarratani, F. 1990. Summary Comment. International Regional Science Review. 13(1990):221-223.
Greene, W.H. 1997. Econometric Analysis. Third Edition. Englewood Cliffs, NJ: Prentice Hall.
Guo, J., D.W. Hughes, and W. Keithly. 2000. An Analysis of LA Highway 1 in Relation to ExpandingOil and Gas Activity in the Central Gulf of Mexico. Report Prepared for the U.S. Dept. of theInterior, Minerals Management Service, Gulf of Mexico OCS Region, New Orleans, LA. OCSReport MMS 2001-0019.
Falgout, T. 1999. Executive Director, Greater Lafourche Port Commission. Written testimony toCommittee on Resources, U.S. House of Representatives, Washington DC, May.

42
Falgout, T. 1997. Executive Director, Greater Lafourche Port Commission. Oral communication, BatonRouge, LA, November.
Hughes, D.W. and L.J. Guedry. 1993. Fundamental Economic Structure and Central Place Theory in theConstruction of Regional Hybrid Input-Output Models. Paper Presented at the Annual Meetingof the Southern Agricultural Economics Association, Tulsa, OK. January.
Isard, W., I.J. Azis, M.P. Drennan, R.E. Miller, S. Saltzman and E. Thorbecke. 1998. Methods ofInterregional and Regional Analysis. Brookfield, VT: Ashgate Publishing.
Johnson, T.G. 1991. A Description of the VIP Model. Unpublished manuscript, Department ofAgricultural Economics, Virginia Tech, Blacksburg, VA, April.
Johnson, T.G. 1996. Federal Policy Analysis with Representative Rural Community Models. Presentedat the Rural Policy Research Institute Modeling Conference, November, Kansas City, MO.
Johnson, T.G. 1997. The Community Policy Analysis System (COMPAS): A Proposed NationalNetwork of Econometric Community Impact Models. Presented at the Community PolicyAnalysis Network, November, Kansas City, MO.
Jones, L.L., S. Murdock, and F.L. Leistritz. 1998. Economic-Demographic Projection Models: AnOverview of Recent Developments for Infrastructure Analysis. Local Infrastructure Investmentin Rural America. Boulder, CO: Westview Press.
Louisiana Dept. of Economic Development. 1998. Parish of Lafourche, State of Louisiana, CertainFinancial and Statistical Data. Baton Rouge, LA.
Louisiana Dept. of Education. 1997a. Annual Financial and Statistical Report 1992-93 – 1995-96.Office of Research and Development, Bureau of School Accountability. Bulletin No. 1472.
Louisiana Dept. of Education.1997b. Minimum Foundation Program Handbook 1996-97. Office of
Management and Finance, Bureau of Educational Finance Services. Bulletin No. 1947.
Louisiana Dept. of Labor, Office of Employment Security, Research and Statistics Division. No Date.Louisiana Labor Market Information. Various Issues. Baton Rouge, LA.
Louisiana Dept. of Labor, Office of Employment Security, Research and Statistics Division. 1998. 1998/Unpublished ES202 Employment Data. 1982-2nd Quarter 1997. Baton Rogue, LA.
Louisiana Dept. of Transportation and Development. 1998. All About LOOP. Website:www.dotd.state.la.us/about/loop/loop.html, Baton Rouge, LA.

43
Louisiana Electronic Assistance Program. Center for Business and Economic Research, NortheastLouisiana University, Monroe, LA. http://leap.nlu.edu//.
Louisiana Mid-Continent Oil and Gas Association. 1996. Louisiana Oil and Gas Facts. 34th ed., BatonRouge, LA.
Louisiana Revised Statues. 1997. LSA-R.S. 1:11. R.S. 48:756. St. Paul, MN: West Publishing Co.
Louisiana State University Agricultural Center, Louisiana Cooperative Extension Service. 1998. 1997Louisiana Summary: Agriculture and Natural Resources. Louisiana State University AgriculturalCenter, Baton Rouge, LA.
Ma, J.C., J.K. Scott, and T.G. Johnson. 1996. The Show Me Community Impact Model:Specification, Estimation, Simulation, and Application. Presented at the Rural PolicyResearch Institute Modeling Conference, November, Kansas City, MO.
Melancon, J.M. and D.S. Roby. 1998. Gulf of Mexico Outer Continental Shelf Daily Oil and GasProduction Rate Projections from 1998 through 2002. U.S. Dept. of the Interior, MineralsManagement Service, Gulf of Mexico OCS Region, New Orleans, LA. OCS Report MMS 98-0013.
Miller, R.E. and P.D. Blair. 1985. Input-Output Analysis: Foundations and Extensions. Engelwood Cliffs, NJ: Prentice-Hall Inc.
Minerals Management Service. 2000. Gulf of Mexico Fast Facts: Offshore Statistics by Water Depth.U.S. Dept. of the Interior, Minerals Management Service, Gulf of Mexico OCS Region. NewOrleans, LA. Website: www.gomr.mms.gov/homepg/fastfacts/WaterDepth/WaterDepth.html.
Minerals Management Service. 1999. Deepwater Information. U.S. Dept. of the Interior, MineralsManagement Service, Gulf of Mexico OCS Region, New Orleans, LA.
Minerals Management Service. 1997. Gulf of Mexico OCS Oil and Gas Lease Sales 169, 172, 175,178, and 182 Central Planning Area, Final Environmental Impact Statement. U.S. Dept. of theInterior, Minerals Management Service, Gulf of Mexico OCS Region, New Orleans, LA.
Powell, R., M. McGovern, and J. Morison. 1990. A Microeconomic Input-Output Analysis of RegionalEconomic Instability. International Regional Science Review. 13(1990):205-214.
Richardson, H.W. 1972. Input-Output Analysis and Regional Economics. New York, NY: JohnWiley and Sons.
Schaffer, W.A. 1989. General Considerations in Building Regional Input-Output Tables. Socio-Economic Planning Science. 23(1989):251-259.

44
Stallmann, J.I., S.C. Deller, and M. Shields. 1998. The Impact of Young-Old and the Old-Old on aSmall Rural Region: An Application of the Wisconsin Economic Impact Modeling System. PaperPresented at the Annual Meetings of the Southern Regional Science Association, April,Savannah, GA.
Swenson, D. 1996. The Iowa Economic/Fiscal Impact Modeling System: An Overview. Presented at theCommunity Economic Modeling Conference, June, Madison, WI.
University of New Orleans. 1997. Statistical Abstract of Louisiana. 10th ed. University of NewOrleans, Division of Business and Economic Research, New Orleans, LA.
U.S. Army Corps of Engineers and Greater Lafourche Port Commission. 1994. Draft Report, PortFourchon Feasibility Study Main Report Environmental Impact Statement. New Orleans DistrictCorps of Engineers, New Orleans, LA.
U.S. Army Corps of Engineers. 1997. Waterborne Commerce of the United States. New OrleansDistrict Corps of Engineers, New Orleans, LA.
U.S. Bureau of the Census. 1991. Journey to Work Data 1990. U.S. Dept. of Commerce, Bureau ofEconomic Analysis, Washington, DC.
U.S. Bureau of the Census. 1992. Census of Governments. Vol. 4, Nos. 3 and 4.
U.S. Bureau of the Census. 1998. Residential Construction Permits. U.S. Dept. of Commerce,Construction Statistics Division, Washington, DC.
U.S. Forest Service. 1996. IMPLAN Software Manual. United States Dept. of Agriculture, ForestExperiment Station, Fort Collins, CO.
U.S. Dept. of Commerce, Bureau of Economic Analysis. 1998. Regional Economic Information SystemCD-ROM, 1969-1996.
Walls, M.A. 1994. Using a ‘Hybrid’ Approach to Model Oil and Gas Supply: A Case Study of the Gulfof Mexico Outer Continental Shelf. Land Economics 70(1):1-19.
Weber, M., R.T. Townsend, and R. Bierce. 1990. Environmental Quality in the Gulf of Mexico: ACitizen’s Guide. Center for Marine Conservation, Washington, DC. 20036.

13 The commodities for which the regional purchase coefficients (rpcs) were changed are listed asfollows: Hay and Pasture, Natural Gas & Crude Petroleum, Natural Gas Liquids, Sugar,Confectionery Products, Concrete Block and Brick, Concrete Product, N.E.C., Ready-mixedConcrete, Business Associations, Labor and Civic Organizations, and U.S. Postal Service.
14 Following standard practice, individual industries can be aggregated into a single industry groupby summing rows and columns in the I-O flows table. For example, for agriculture in this studyis a compilation of data for 27 individual agricultural industries in the original IMPLANdatabase.
45
APPENDIX A
Input-Output Module of LCIM
The I-O model was altered in several different ways to improve the accuracy of results. Originalemployment and output estimates for petroleum industries were changed in light of published andunpublished employment data for Lafourche Parish (U.S. Dept. of Commerce, 1998; Louisiana Dept. ofLabor, 1998). IMPLAN provides information on trade for 528 commodities. Estimates of shipments inand out of the parish for eleven commodities were changed in view of economic theory and knowledge ofthe regional economy.13 Finally, the model of the Lafourche Parish economy was aggregated based onstandard procedures and using the IMPLAN software to 15 sectors (aggregate industries) for ease ofanalysis and for presenting model results.14 Industry detail was retained for sectors with strong ties to theOCS petroleum industry, such as shipbuilding.
Besides the I-O module, the CIM contains a labor market module and a fiscal module. The labormarket module examines labor demand and supply, and the fiscal module measures effects of labormarkets and general economic activity on taxing ability and public service provisions (Ma et al., 1996).
Empirical Specification of the Labor Force Module
The labor force module serves to direct output from shocks in the input-output model intochanges in government revenue and expenditures in the fiscal module. Both the place of residence and

46
External Employment Index j External Employment i /Distanceii
n=
=∑ 2
1
place of work of the population are important to distinguish in the labor force module. Thus similar toJohnson (1991, 1996) and Swenson (1996), the Louisiana model empirically specifies seven equationsfor these variables, including external labor force and external employment index equations, which werecalculated using gravity models.
Gravity models have been used extensively to model interactions between regions where distancehas been an important factor in determining the costs and the benefit of the interaction (Isard et al.). Forexample, individuals are much less likely to commute 20 miles to a job than 10 miles. The opportunitycosts of commuting can be seen as increasing at an exponential rate. Hence, driving the 20 miles might beseen as four times (rather than twice) as costly by the worker than the 10 mile trip. The level of interactionbetween the regions is also governed by the size (mass) of the variable in question. That is, the bigger theset of available workers in a given region, the greater the number of workers that may commute to jobs inanother region. In this way, a gravity model can be used to produce an index that reflects the interactionbetween a particular region and all other regions in a given set. That is, assuming we had three regions inour gravity model, then the gravity index for region one would be the size (such as size of work force) inregion two divided by the squared distance between region one and two plus the size in region three
divided by thesquareddistancebetween regionone and region
three.In the labor market module, gravity equations are used to estimate external labor force and
external employment indices. The former is an independent variable in the in-commuting earningsequation while the latter is an independent variables in the out-commuting earnings equation. Formally,we can write the two gravity equations as
(1)External Labor Force Index j External Labor Forcei ii
n=
=∑ / Distance2
1
(2)
where: i Öj; and where, for the ith observation, the contribution to the labor force (employment) index forj is the size of the work force for i (job base) divided by the straight line distance between the geographiccenters of i and j. The external labor force index and the external employment index are calculated for all64 Louisiana parishes. The external labor force and external employment variables are defined to includeall 64 Louisiana parishes plus any out of state county with at least 100 commuters to the jth Louisianaparish in 1990 (U.S. Bureau of the Census, 1991).

15 That is, changes in earnings by local residents equals the change in earnings estimated with theI-O, minus the estimated change in in-commuter earnings (from the labor market model) plusthe estimated changes in out-commuter earnings (from the labor market module). Tax and
47
For the other five equations in the Labor market model, we have population (as a function of thelevel of employment and the level of unemployment), in-commuter earnings (as a function of place ofwork employment and external labor force index), and out-commuter earnings (as a function of laborforce and external employment index), or
Population = f (Employment, Unemployment) (3)
In-commuter Earnings = f (Place of Work Employment, External Labor Force Index) (4)
Out-commuter Earnings = f (Labor Force, External Employment Index) (5)
In-Commuters = In-Commuter Earnings / Average Parish In-Commuter Earnings (6)
Out-Commuters = Out-Commuter Earnings / Average Parish Out-Commuter Earnings (7)
where: in-commuter earnings is total pay (employee compensation plus proprietary income) to individualsworking but not living in the parish; place of work employment is the number of jobs in the parish; laborforce is the level of employed plus unemployed residents in the parish; and
parish in-commuting and out-commuting average earnings are calculated based on 1990 Census data(total in-commuting earnings divided by the total number of in-commuters and total out-commutingearnings divided by the total number of out-commuters).
Estimates of population, place of work employment, and unemployment were obtained frompublications by the Louisiana Department of Labor and the Louisiana Department of EconomicDevelopment. (Estimates for 24 years of data (Louisiana Dept. of Economic Development, 1998) forLafourche Parish were used in estimating the relationships in equation 1). Estimates of in-commuterearnings and out-commuter earnings came from the Census Bureau, Journey to Work data set for 1990. In addition, equations 6 and 7 are used to convert commuter earnings into estimates of the actual numberof in-commuters and out-commuters, based on average commuter earnings derived from the Journey toWork data set. The estimated labor force module is provided in Appendix A Table 1.
The labor force variable serves as the “link” between the input-output module and the fiscalmodule. That is, a final demand shock from the input-output module will lead to a change in the laborforce. The change in labor force will lead to changes in population, in-commuter earnings, and out-commuter earnings. Changes in earnings are also used to derive changes in household spending (inducedeffects) in the input-output model after accounting for leakages out of the local economy (to in-commuters), interjections from out-commuters and spending leakages in the form of income taxes,savings, and purchases from elsewhere.15 The round of induced effects spending occurs into the

spending leakages are removed from the change in earnings to local residents to arrive at anestimate of the change in disposal earnings (incomes) to local residents. The change in localeconomic activity (one round of the induced effect) is then calculated by assuming that thepattern of expenditures (including purchase of local goods versus purchase versus goodsproduced elsewhere) given for medium income households in the IMPLAN model holds true.
48
estimated total change in employment is very small (less than one job). Thus, the I-O model and labormarket model are operated interactively, as results from the I-O feed into the labor market module andthe resulting changes in variables from the labor market module feed back into the I-O model, until thechanges in variables approach zero.
Changes in variables in the fiscal component of the model are also based on changes in variablesfrom the combined I-O and labor market model. That is, changes in population, in-commuter earnings,and out-commuter earnings are independent variables in the fiscal component of the model. Thus, thecommunity impact model works in a block recursive fashion.
Previous research (Deller and Shields, 1996), a likelihood ratio test (Greene, 1997), andeconomic theory were used to determine the functional forms for equations (2) – (4) in the labor forcemodule. It was determined that in-commuter earnings and out-commuter earnings would be estimatedusing a Cobb-Douglas functional form, whereas population would be estimated using a linear functionalform.
Empirical Specification of the Fiscal Module
To estimate the changes in local government revenues and expenditures, the theoretical derivationof the fiscal module must be empirically specified. The empirical specification used in this module closelyfollows the fiscal modules of Johnson (1991, 1996) and Deller and Shields (1996). The structuralequations identifying public service demand and supply are not observed. Rather, the equilibrium levelsof public goods are what is observed in the local economy. Thus, by estimating a set of reduced formequations, changes can be followed in the provision and production of publicly provided goods andservices even when the parameters for the structural equations are unidentifiable (Stallmann et al., 1998).
Previous research provides a starting point for estimating the public good expenditure equations. Fiscal modules developed by Johnson (1991, 1996), Deller and Shields (1996), and Swenson (1996)were used as starting points for empirical specification of the Louisiana fiscal module. However, asJohnson (1997) explains, the underlying structure surrounding the production and delivery of publiclyprovided goods and services varies from state to state, and thus empirical specification will differ.
Sixteen equations are included in the Louisiana fiscal module. The primary forms of local taxes inLouisiana are real estate property (based on assessed value) and retail sales taxes. Two equationsmeasure revenue capacity--assessed property value and retail sales (Appendix A Table 2). Four directrevenue equations are included--severance tax revenue, state transfer revenue, federal transfer revenue(for both schools and other functions), and other tax revenue. Severance tax revenue includes all tax

16 Equations were estimated for per capita variable values, such as per capita spending onschools. For four spending categories (hospitals, levee and drainage, fire, and parks andrecreation), no relationship was found between changes in local population and earnings andper capita spending. Hence, expenditures were assumed to increase at a constant rate withpopulation, and a regression approach was not used.
49
revenue collected from the extraction of oil, natural gas, other minerals, and timber and pulpwood. Federal transfer payments include Medicare, Medicaid, and school lunch program payments. Statetransfer revenue consists of public school transfers from the state minimum foundation program, localpublic road transfers from the parish transportation trust fund, and all other state transfer revenue. Othertax revenue includes revenue generated from license taxes, general charges, hospital charges, specialassessments, interest earnings, fines and forfeitures, and miscellaneous general revenues (Appendix ATable 3).
Ten expenditure equations are estimated in the fiscal model (Appendix A Table 4). Theseequations attempt to explain changes in spending for school, road, general, administration and other, lawenforcement, waste disposal, utility, hospital, levee and drainage, fire, and parks and recreationexpenditures. Hospital expenditures also include other health care expenditures. Waste disposalexpenditures include solid waste expenditures and sewer expenditures. Law enforcement expendituresinclude expenditures for judicial, police, and corrections. General, administration, and other expendituresinclude financial administration, general services/buildings, library, public welfare, general debt interest,insurance trust, and liquor store expenditures.16
One year of data for assessed value, retail sales, and severance tax revenue came from theStatistical Abstract of Louisiana (1997). Estimates of other tax revenue, federal transfer revenue, andother state transfer revenue came from the 1992 Census of Governments (U.S. Bureau of the Census1992). State school transfer revenue was derived from the Louisiana Department of Education minimumfoundation formula (Louisiana Department of Education 1997b) whereas federal school transfer revenuecame for the Louisiana Department of Education Annual Financial and Statistical Report (LouisianaDepartment of Education 1997a). Parish transportation trust fund revenue was derived from the formulagiven in the Louisiana Revised Statues (1997).
All expenditure estimates except for school and levees and drainage came from the 1992 Censusof Governments (U.S. Bureau of the Census, 1992). Expenditures for an individual parish werecalculated as the sum of expenditures from the parish governing body and all municipalities within theparish. This aggregation was necessary because different public goods and services are produced bydifferent government entities. School revenues and expenditures came from the Louisiana Department ofEducation Annual Financial and Statistical Report (Louisiana Dept. of Education, 1997b). Expenditureson levees and drainage were assumed to equal revenues explicitly collected for such activity. Revenuesoften do not equal expenditures in a given year, but it is assumed that on the average, a local governmentwill be in fiscal balance; that is, no long-term surpluses or deficits will exist.

50
Again, previous research, economic theory, and a likelihood ratio test were used to test forfunctional form. A Cobb-Douglas functional form was used to estimate the school expenditure equationwhereas a linear functional form was used for the other five regression-based expenditure equations. TheCobb-Douglas functional form used is based on the assumption that the average (per capita) cost ofsupplying publicly provided goods and services increases at a decreasing rate as population increases(i.e., economies of scale exist).

51
Table A1
Estimation Results from the Labor Force Module of the Louisiana Community Impact Model
----------------- Dependent Variable--------------
Independent Variable Population In-Commuter Earnings Out-Commuter EarningsLabor Force Na Na 0.973**
Place of Work Employment 0.618**
(3.28)
1.094**
(18.03)
Na
Place of Work Unemployment 0.907**
(3.44)
Na Na
External Labor Force Index Na
0.002**
(3.27)
Na
External Employment Index Na
Na 0.00229**
(15.88)Constant 272.84
(1.31)
6.780**
(11.49)
1.324*
(2.41)R-Square 0.45 0.82 0.81Condition Index 2.21 N/A N/AHeteroskedasticity Tests:B-P-G Test 4.49 N/A N/AHarvey Test 6.047* N/A N/AGlejser Test 5.184* N/A N/A
** - Significant at "=.01 * - Significant at "=.10
Note: T-Statistics are in Parenthesis.
Population equation estimated with first difference for all variables to correct for autocorrelation. In-commuterand out-commuter equations were transformed to account for heteroskedacity. Na means the equation inquestion does not contain that independent variable. N/A means the test does not apply.

52
Table A2
Least Square Results of Assessed Value and Retail Sales from the Louisiana Community Impact Model
----------- Dependent Variable---------Independent Variable Assessed Value Retail Sales Arable Land Density 115,280*
(1.87)
-41,180
(-1.63) In-commuter Earnings Na -0.15473**
(-3.62) Out-commuter Earnings 0.10223**
(11.02)
0.36299**
(7.76) Resident-Employed Earnings 0.29459**
(44.80)
0.78686**
(34.96) Constant 44,032,000**
(5.54)
-14,743,000**
(-10.01) R-Square 0.93 0.98
** - Significant at "= .01 * - Significant at " = .10
Note: T-Statistics are in Parenthesis. Both equations were transformed to account for heteroskedacity. Nameans the equation in question does not contain that independent variable.
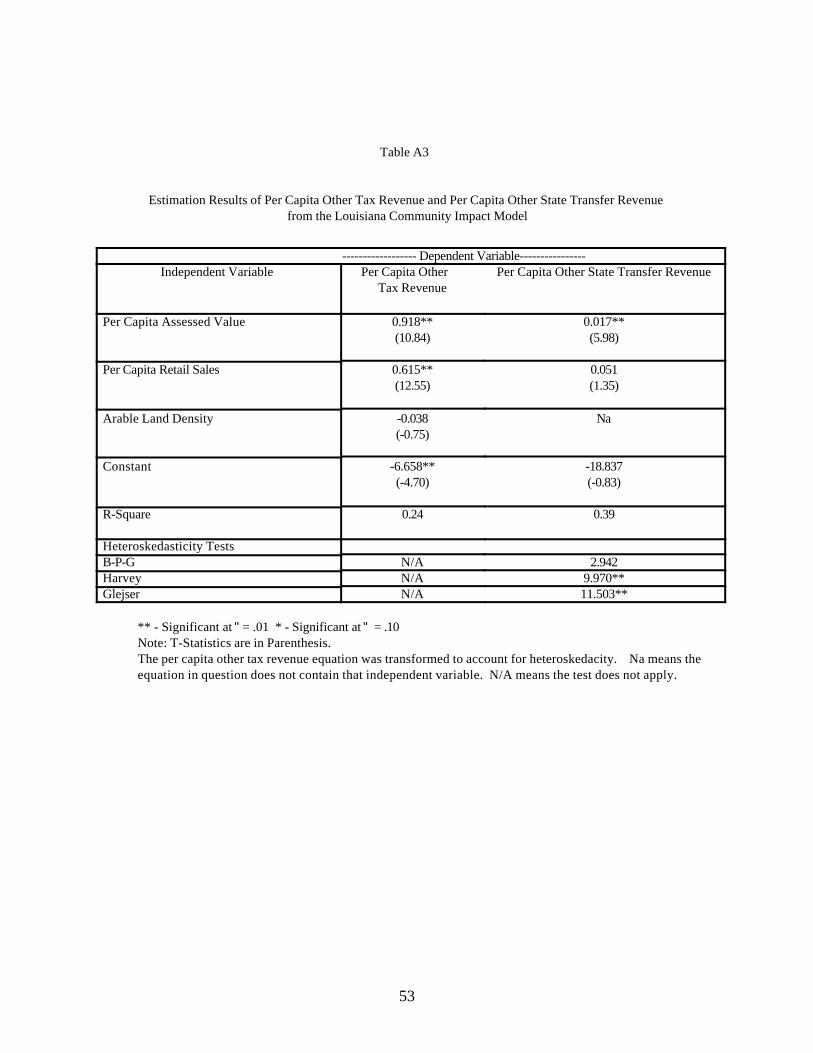
53
Table A3
Estimation Results of Per Capita Other Tax Revenue and Per Capita Other State Transfer Revenue from the Louisiana Community Impact Model
------------------ Dependent Variable----------------Independent Variable Per Capita Other
Tax RevenuePer Capita Other State Transfer Revenue
Per Capita Assessed Value 0.918**(10.84)
0.017**(5.98)
Per Capita Retail Sales 0.615**(12.55)
0.051(1.35)
Arable Land Density -0.038(-0.75)
Na
Constant -6.658**(-4.70)
-18.837(-0.83)
R-Square 0.24 0.39
Heteroskedasticity TestsB-P-G N/A 2.942Harvey N/A 9.970**Glejser N/A 11.503**
** - Significant at "= .01 * - Significant at " = .10Note: T-Statistics are in Parenthesis.The per capita other tax revenue equation was transformed to account for heteroskedacity. Na means theequation in question does not contain that independent variable. N/A means the test does not apply.

54
Table A4
Per Capita Expenditure Equations from the Louisiana Community Impact Model
-------------------------------------------------------Dependent Variable--------------------------------------------------------
Independent Variable School Road General,Administration, and Other
LawEnforcement
Waste Disposal Utilities
Per Capita Assessed Value 0.24873**(5.21)
0.01505**(3.51)
0.03083*(2.22)
0.02272**(3.43)
0.01718**(3.19)
0.00995(1.49)
Per Capita Retail Sales -0.00891*(-2.09)
-0.00033(-0.05)
Arable Land Density 0.03000(1.35)
0.13854*(2.56)
0.11456*(1.70)
0.09681(1.15)
Per Capita Public SchoolRegistration
0.87287**(4.43)
Pupil to Teacher Ratio -0.65749**(-2.93)
Per Capita Local RoadMiles
823.28000(1.32)
Per Capita All OtherExpenditures
0.11446*(2.053)
Non-Wetland Acres -0.00001(-0.23)
Percent Urban 120.27000*(2.55)
Public Electricity Dummy 113.83000**(3.95)
Public Gas Dummy 9.95460(0.35)
Public TransportationDummy
64.35600(1.51)
Constant 7.92**(8.91)
49.24(1.44)
-9.89(-0.15)
53.27(1.45)
-22.15(-0.61)
22.39(0.63)
R-Square 0.4605 0.1957 0.2083 0.1828 0.2621 0.2381Standard Error 0.16352 80.761 243.86 124.64 100.85 127.11White' Test 15.12 13.68 2.82 1.38 3.17 20.36
LM Test for Contemporaneous Covariance of the System of Equations = 118.95**** - Significant at "= .01 * - Significant at " = .10Note: T-Statistics are in Parenthesis.

The Department of the Interior Mission As the Nation's principal conservation agency, the Department of the Interior has responsibility for most of our nationally owned public lands and natural resources. This includes fostering sound use of our land and water resources; protecting our fish, wildlife, and biological diversity; preserving the environmental and cultural values of our national parks and historical places; and providing for the enjoyment of life through outdoor recreation. The Department assesses our energy and mineral resources and works to ensure that their development is in the best interests of all our people by encouraging stewardship and citizen participation in their care. The Department also has a major responsibility for American Indian reservation communities and for people who live in island territories under U.S. administration. The Minerals Management Service Mission As a bureau of the Department of the Interior, the Minerals Management Service's (MMS) primary responsibilities are to manage the mineral resources located on the Nation's Outer Continental Shelf (OCS), collect revenue from the Federal OCS and onshore Federal and Indian lands, and distribute those revenues. Moreover, in working to meet its responsibilities, the Offshore Minerals Management Program administers the OCS competitive leasing program and oversees the safe and environmentally sound exploration and production of our Nation's offshore natural gas, oil and other mineral resources. The MMS Minerals Revenue Management meets its responsibilities by ensuring the efficient, timely and accurate collection and disbursement of revenue from mineral leasing and production due to Indian tribes and allottees, States and the U.S. Treasury. The MMS strives to fulfill its responsibilities through the general guiding principles of: (1) being responsive to the public's concerns and interests by maintaining a dialogue with all potentially affected parties and (2) carrying out its programs with an emphasis on working to enhance the quality of life for all Americans by lending MMS assistance and expertise to economic development and environmental protection.