Embed Size (px)
Citation preview
PROJECT DESIGN DOCUMENT FORM (CDM-SSC-PDD) - Version 03 CDM – Executive Board
1
Laguna de Bay Community Waste Management Project:
Avoidance of Methane Production from Biomass Decay Through Composting-1
Clean Development Mechanism Project Design Document
Small Scale Activity
LAGUNA LAKE DEVELOPMENT AUTHORITY
PROJECT DESIGN DOCUMENT FORM (CDM-SSC-PDD) - Version 03 CDM – Executive Board
2
CLEAN DEVELOPMENT MECHANISM
PROJECT DESIGN DOCUMENT FORM (CDM-SSC-PDD) Version 03 - in effect as of: 22 December 2006
CONTENTS
A. General description of the small scale project activity B. Application of a baseline and monitoring methodology C. Duration of the project activity / crediting period D. Environmental impacts E. Stakeholders’ comments
Annexes Annex 1: Contact information on participants in the proposed small scale project activity Annex 2: Information regarding public funding Annex 3: Baseline information
Annex 4: Monitoring Information
PROJECT DESIGN DOCUMENT FORM (CDM-SSC-PDD) - Version 03 CDM – Executive Board
3
Revision history of this document Version Number
Date Description and reason of revision
01 21 January 2003
Initial adoption
02 8 July 2005 • The Board agreed to revise the CDM SSC PDD to reflect guidance and clarifications provided by the Board since version 01 of this document.
• As a consequence, the guidelines for completing CDM SSC PDD have been revised accordingly to version 2. The latest version can be found at <http://cdm.unfccc.int/Reference/Documents>.
03 22 December 2006
• The Board agreed to revise the CDM project design document for small-scale activities (CDM-SSC-PDD), taking into account CDM-PDD and CDM-NM.
PROJECT DESIGN DOCUMENT FORM (CDM-SSC-PDD) - Version 03 CDM – Executive Board
4
SECTION A. General description of small-scale project activity A.1 Title of the small-scale project activity: >>“Laguna de Bay Community Waste Management Project: Avoidance of methane production from biomass decay through composting -1” PDD version 2 Date of the document: 02-09-07 A.2. Description of the small-scale project activity: >> Description The objective of the Laguna de Bay Community Waste Management Project is to implement a set of small scale waste management projects in the Laguna de Bay watershed, a watershed that is heavily degraded and has ever-increasing environmental pressures from more than 10 million people and thousands of industries that produce largely untreated solid and liquid wastes. The continued degradation has resulted in increasing greenhouse gas emissions from waste, and through the waste management interventions under the project, both environmental degradation and greenhouse gas emissions will be reduced1. The Laguna de Bay Community Waste Management Project is made up of two different CDM projects, consisting of two separate PDDs: methane recovery by wastewater treatment and methane avoidance by composting. Wastewater treatment: The purpose of these activities is to reduce organic water pollution from piggeries, industries, slaughterhouses and municipalities in the watershed while reducing greenhouse gas emissions. These activities are covered under another PDD using the small scale methodology AMS-II.H. Solid waste composting: The purpose of these activities is to reduce the waste disposed in landfills and the associated methane emissions in the Region through composting of organic matter. These activities are covered under this PDD and are based on the small scale methodology AMS-III.F. The solid waste composting project described in this PDD includes eleven small municipalities with populations ranging from 23,000 to 145,000. All are in the Laguna de Bay region. Alaminos, Kalayaan, Liliw, Nagcarlan, Santa Cruz and Siniloan are in the province of Laguna. Angono, Cardona, Morong, Tanay and Teresa are in the province of Rizal. General Mariano Alvarez is in the province of Cavite. In these municipalities, as with many small municipalities in the country, waste management systems are not able to collect all the waste produced and have primitive disposal systems, some of which are undergoing some improvement. In particular, collection of waste is typically around 70-80% of generated waste and ranges from as low as 20% (e.g., Liliw) to 94% (e.g., Morong). Collected wastes containing 50-75% organic matter on average are disposed either in controlled dumps (6 municipalities) 1 The Laguna de Bay Institutional Strengthening and Community Participation Project, to which this PDD is linked was explicitly designed to help reverse the degradation of the Laguna de Bay Watershed while reducing greenhouse gas emissions through its interventions (Laguna de Bay Institutional Strengthening and Community Participation Project, World Bank Project Appraisal Document, December 2003).
PROJECT DESIGN DOCUMENT FORM (CDM-SSC-PDD) - Version 03 CDM – Executive Board
5
or in open dumpsites (5 municipalities). A few municipalities have established material recovery facilities that recycle but municipal composting is not undertaken. The decomposition of organic wastes in disposal site results in methane emissions. The project will reduce these emissions by establishing and operating composting facilities in the participating municipalities to treat organic matter produced from municipal waste. Through this, the anaerobic decay of organic matter in disposal sites will be avoided and allow decomposition to take place under aerobic conditions producing carbon dioxide. Composting will thereby avoid the production of methane emissions that would otherwise occur if organic wastes were left to degrade in disposal sites. The Laguna Lake Development Authority will have performance contracts with these municipalities to produce a quantity of compost necessary to meet emissions reduction targets and to undertake associated monitoring. Payments to the municipalities will be based on the achieved CERs. Contribution to sustainable development Laguna de Bay watershed is a priority watershed for environmental sustainability goals because it contains 13 percent of the population of the Philippines and the lake and its tributaries supports fisheries, recreation, domestic water supply and provide aesthetic value for the many small, historic towns in the area. Current water quality in the lake’s tributaries is very poor especially in the west bay and accumulation of solid wastes in these areas due to poor solid waste management systems has contributed to organic pollution and aesthetic problems. The project will contribute to the environmentally sustainable development of the area through better organized waste management practices, increasing the amount of waste to be safely handled and increasing the lifetime of disposal sites. The project also provides new sources of financing to increase and improve the effectiveness of public investments. Through carbon finance, the project will provide additional revenues for operation and maintenance and encourage the sustainability of the interventions. Through the participatory planning and implementation process the project will also provide an avenue for participation in watershed planning and management with specific attention made for inclusion of marginalized groups (indigenous peoples, women and others) in the process. Disclosure of municipal performance on environment projects will also be enhanced as the composting and associated emissions reductions during implementation will be made available to these groups and to the general public. As part of the process, the project will also provide opportunities for training of a wide group of stakeholders in watershed planning and management. A.3. Project participants: >> Table 1. Project Participants
Name of Party involved (*) ((host) indicates a host party)
Private and/or public entity(ies) project participants
(as applicable)
Kindly indicate if the Party involved wishes to be considered as project participant (Yes/No)
Government of the Philippines (host)
Laguna Lake Development Authority
No
Government of the Philippines (host)
Municipality of Alaminos No
Government of the Philippines (host)
Municipality of Angono No
PROJECT DESIGN DOCUMENT FORM (CDM-SSC-PDD) - Version 03 CDM – Executive Board
6
Government of the Philippines (host)
Municipality of Cardona No
Government of the Philippines (host)
Municipality of General Mariano Alvarez
No
Government of the Philippines (host)
Municipality of Kalayaan No
Government of the Philippines (host)
Municipality of Liliw No
Government of the Philippines (host)
Municipality of Morong No
Government of the Philippines (host)
Municipality of Nagcarlan No
Government of the Philippines (host)
Municipality of Siniloan No
Government of the Philippines (host)
Municipality of Santa Cruz No
Government of the Philippines (host)
Municipality of Tanay No
Government of the Philippines (host)
Municipality of Teresa No
Government of Italy
International Bank for Reconstruction and Development as
a Trustee of Community Development Carbon Fund (CDCF)
Yes
(*) In accordance with the CDM modalities and procedures, at the time of making the CDM-PDD public at the stage of validation, a Party involved may or may not have provided its approval. At the time of requesting registration, the approval by the Party(ies) involved as required. (See Annex 1 for the list of project participants and their contact information.) A.4. Technical description of the small-scale project activity: A.4.1. Location of the small-scale project activity: >> A.4.1.1. Host Party(ies): >> The subprojects will be located in 13 Municipalities (see Table 2) in the Laguna de Bay watershed which is south and east of Manila on the island of Luzon. The host party is the Republic of the Philippines. A.4.1.2. Region/State/Province etc.: >> The projects are in the provinces of Laguna, Rizal and Cavite which is in the Laguna de Bay Region which is part of the Southern Tagalog Region or Region IV.
PROJECT DESIGN DOCUMENT FORM (CDM-SSC-PDD) - Version 03 CDM – Executive Board
7
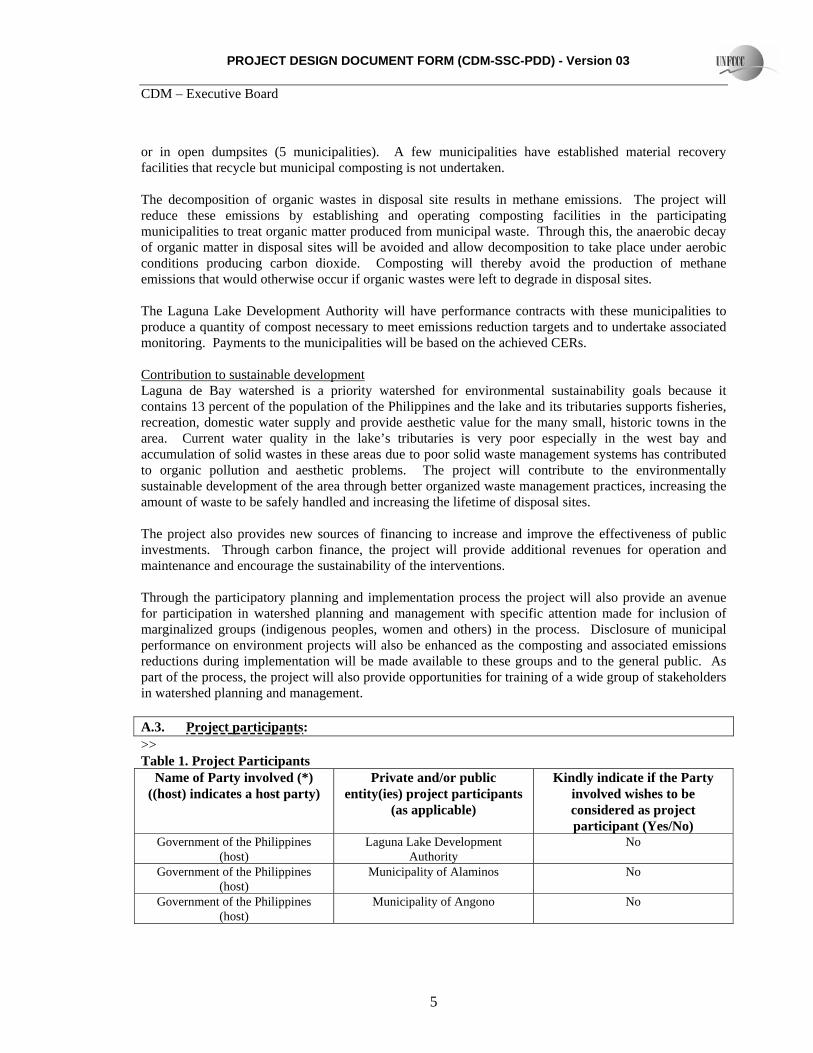
Figure 1: Map showing The Laguna de Bay Watershed and participating municipalities
(highlighted in Red) A.4.1.3. City/Town/Community etc: A.4.1.3. City/Town/Community etc: >> Table 2. Location of Project Activity
Municipality Province Barangay where plant is located
Detailed description of plant location
Alaminos Laguna Palma Located at 14o04’49” N and 121 o 22’82” which is 2.8 km from the disposal site (14005’67”N 121025’12”E)
Angono Rizal San Isidro Located at 14o54’32” N and 121 o 15’47”E and on the same site as the disposal facility.
Cardona Rizal Del Remedios Cadastral Lot No734 Cad 606-D
PROJECT DESIGN DOCUMENT FORM (CDM-SSC-PDD) - Version 03 CDM – Executive Board
8
of the Cardona Cadastre which is 1 km from the disposal facility (Cadastral Lot No 841)
General Mariano Alvarez Cavite Poblacion 1 The Project site has 3 composting sites: Site 1 (14o18’41” N and 121 o 0’26”E); Site 2 (14o18’5” N and 121 o 0’3”E). Site 3 (14o29’50” N and 121 o 0’06”E) which are an average of 4.9 km from the disposal site located in San Pedro municipality (14033’89”N 121001’34”E )
Kalayaan Laguna Longos Located at 14o31’44” N and 121 o 49’14”E which is 2.8 km from the disposal site (14o20”14.8” N’ 121o29”47”E).
Liliw Laguna Ibabang Palina Located at Cadastral Lot No. 7076-A Psd 04-142848 a portion of Lot 7076,Cad 484-D of the Liliw Cadastre which is adjacent to the disposal site.
Morong Rizal San Pedro Located at 14o50’27” N and 121 o 22’76”E which is 3.2 km from the disposal site (14050’28”N 121022’73”E .
Nagcarlan Laguna Talangan Located at Cadastral Lot No. 4102 portion Lot C (with TCT # 214829) of the Nagcarlan Cadastre which is 12.8 from the disposal site located in San Pablo municipality (1404’6”N 121023’8”E ).
Siniloan Laguna Salubungan Located at 14o42’52” N and 121 o 46’39”E at the disposal site location.
Sta. Cruz Laguna Alipit Located at TCT No. T-92991 Lot No. 2 Psu-1093 and TCT No. T-92992 Lot No. 1-A Psd 302434 at the disposal site location.
Tanay Rizal Tandang Kutyo Located at 14o32’28” N and 121 o 17’58”E which is 2.6 km from the disposal site (Cadastral Lot No 7786-D Cad 393).
Teresa Rizal Dalig Located at 14o57’11” N and 121 o 22’32”E at the site of the disposal facility..
A.4.1.4. Details of physical location, including information allowing the unique identification of this small-scale project activity : >> See Table 2 above
PROJECT DESIGN DOCUMENT FORM (CDM-SSC-PDD) - Version 03 CDM – Executive Board
9
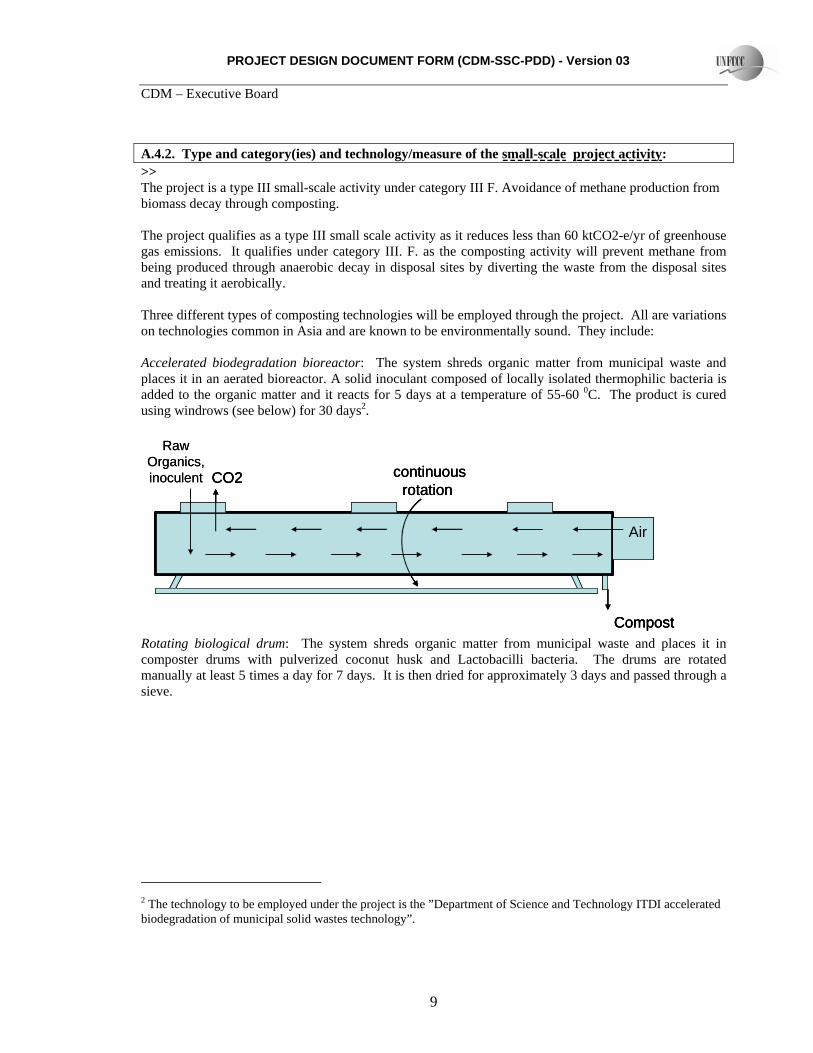
A.4.2. Type and category(ies) and technology/measure of the small-scale project activity: >> The project is a type III small-scale activity under category III F. Avoidance of methane production from biomass decay through composting. The project qualifies as a type III small scale activity as it reduces less than 60 ktCO2-e/yr of greenhouse gas emissions. It qualifies under category III. F. as the composting activity will prevent methane from being produced through anaerobic decay in disposal sites by diverting the waste from the disposal sites and treating it aerobically. Three different types of composting technologies will be employed through the project. All are variations on technologies common in Asia and are known to be environmentally sound. They include: Accelerated biodegradation bioreactor: The system shreds organic matter from municipal waste and places it in an aerated bioreactor. A solid inoculant composed of locally isolated thermophilic bacteria is added to the organic matter and it reacts for 5 days at a temperature of 55-60 0C. The product is cured using windrows (see below) for 30 days2.
RawOrganics,inoculent
Air
CO2
Compost
continuousrotation
RawOrganics,inoculent
Air
CO2
Compost
continuousrotation
Air
CO2
Compost
continuousrotation
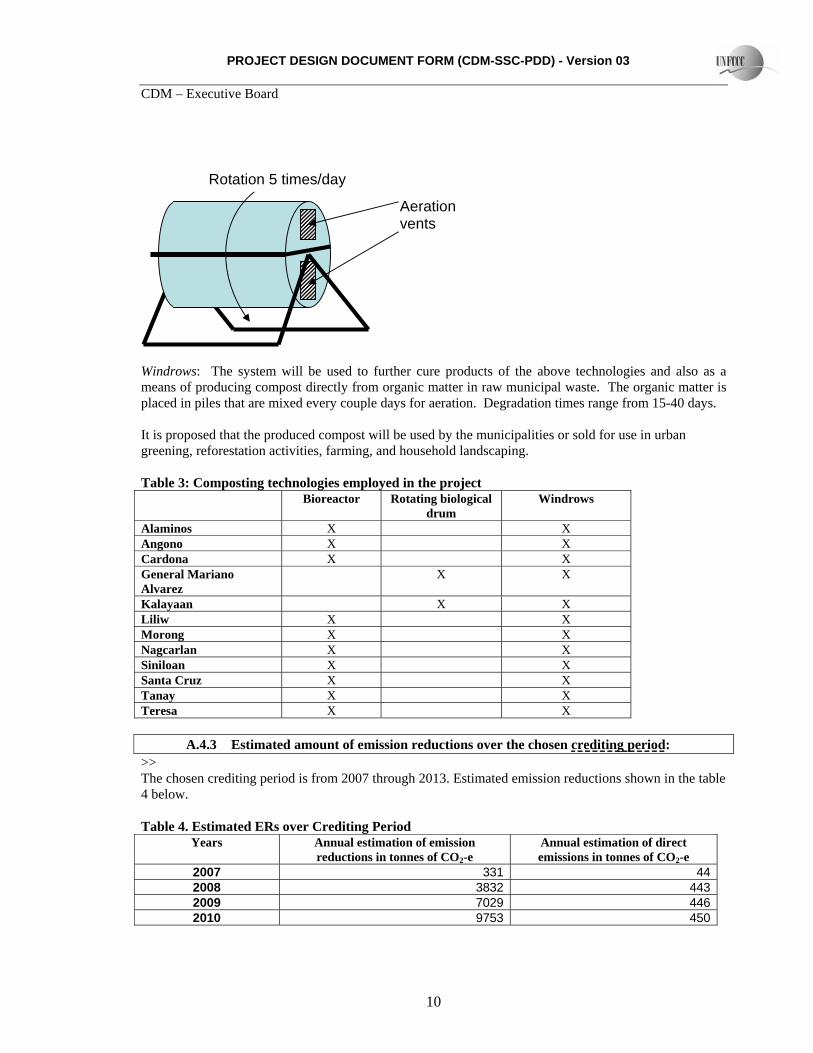
Rotating biological drum: The system shreds organic matter from municipal waste and places it in composter drums with pulverized coconut husk and Lactobacilli bacteria. The drums are rotated manually at least 5 times a day for 7 days. It is then dried for approximately 3 days and passed through a sieve.
2 The technology to be employed under the project is the ”Department of Science and Technology ITDI accelerated biodegradation of municipal solid wastes technology”.
PROJECT DESIGN DOCUMENT FORM (CDM-SSC-PDD) - Version 03 CDM – Executive Board
10
Windrows: The system will be used to further cure products of the above technologies and also as a means of producing compost directly from organic matter in raw municipal waste. The organic matter is placed in piles that are mixed every couple days for aeration. Degradation times range from 15-40 days. It is proposed that the produced compost will be used by the municipalities or sold for use in urban greening, reforestation activities, farming, and household landscaping. Table 3: Composting technologies employed in the project Bioreactor Rotating biological
drum Windrows
Alaminos X X Angono X X Cardona X X General Mariano Alvarez
X X
Kalayaan X X Liliw X X Morong X X Nagcarlan X X Siniloan X X Santa Cruz X X Tanay X X Teresa X X
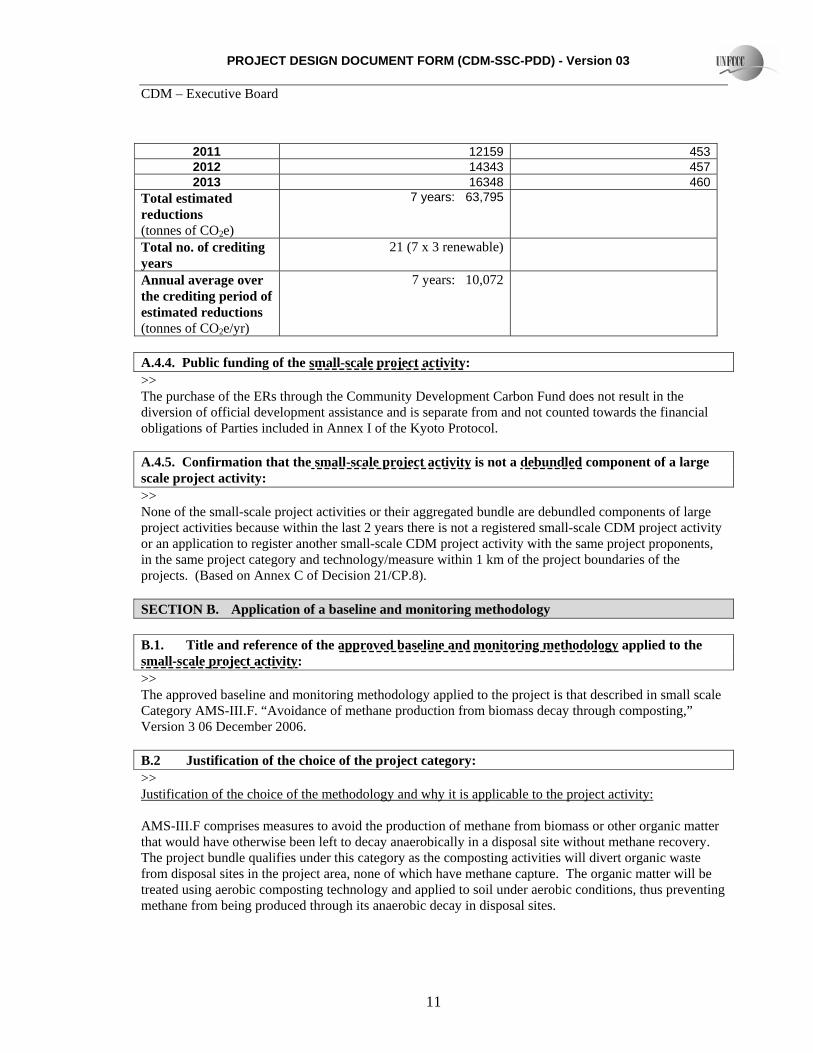
A.4.3 Estimated amount of emission reductions over the chosen crediting period: >> The chosen crediting period is from 2007 through 2013. Estimated emission reductions shown in the table 4 below. Table 4. Estimated ERs over Crediting Period
Years Annual estimation of emission reductions in tonnes of CO2-e
Annual estimation of direct emissions in tonnes of CO2-e
2007 331 442008 3832 4432009 7029 4462010 9753 450
Aeration vents
Rotation 5 times/day
PROJECT DESIGN DOCUMENT FORM (CDM-SSC-PDD) - Version 03 CDM – Executive Board
11
2011 12159 4532012 14343 4572013 16348 460
Total estimated reductions (tonnes of CO2e)
7 years: 63,795
Total no. of crediting years
21 (7 x 3 renewable)
Annual average over the crediting period of estimated reductions (tonnes of CO2e/yr)
7 years: 10,072
A.4.4. Public funding of the small-scale project activity: >> The purchase of the ERs through the Community Development Carbon Fund does not result in the diversion of official development assistance and is separate from and not counted towards the financial obligations of Parties included in Annex I of the Kyoto Protocol. A.4.5. Confirmation that the small-scale project activity is not a debundled component of a large scale project activity: >> None of the small-scale project activities or their aggregated bundle are debundled components of large project activities because within the last 2 years there is not a registered small-scale CDM project activity or an application to register another small-scale CDM project activity with the same project proponents, in the same project category and technology/measure within 1 km of the project boundaries of the projects. (Based on Annex C of Decision 21/CP.8). SECTION B. Application of a baseline and monitoring methodology B.1. Title and reference of the approved baseline and monitoring methodology applied to the small-scale project activity: >> The approved baseline and monitoring methodology applied to the project is that described in small scale Category AMS-III.F. “Avoidance of methane production from biomass decay through composting,” Version 3 06 December 2006. B.2 Justification of the choice of the project category: >> Justification of the choice of the methodology and why it is applicable to the project activity: AMS-III.F comprises measures to avoid the production of methane from biomass or other organic matter that would have otherwise been left to decay anaerobically in a disposal site without methane recovery. The project bundle qualifies under this category as the composting activities will divert organic waste from disposal sites in the project area, none of which have methane capture. The organic matter will be treated using aerobic composting technology and applied to soil under aerobic conditions, thus preventing methane from being produced through its anaerobic decay in disposal sites.
PROJECT DESIGN DOCUMENT FORM (CDM-SSC-PDD) - Version 03 CDM – Executive Board
12
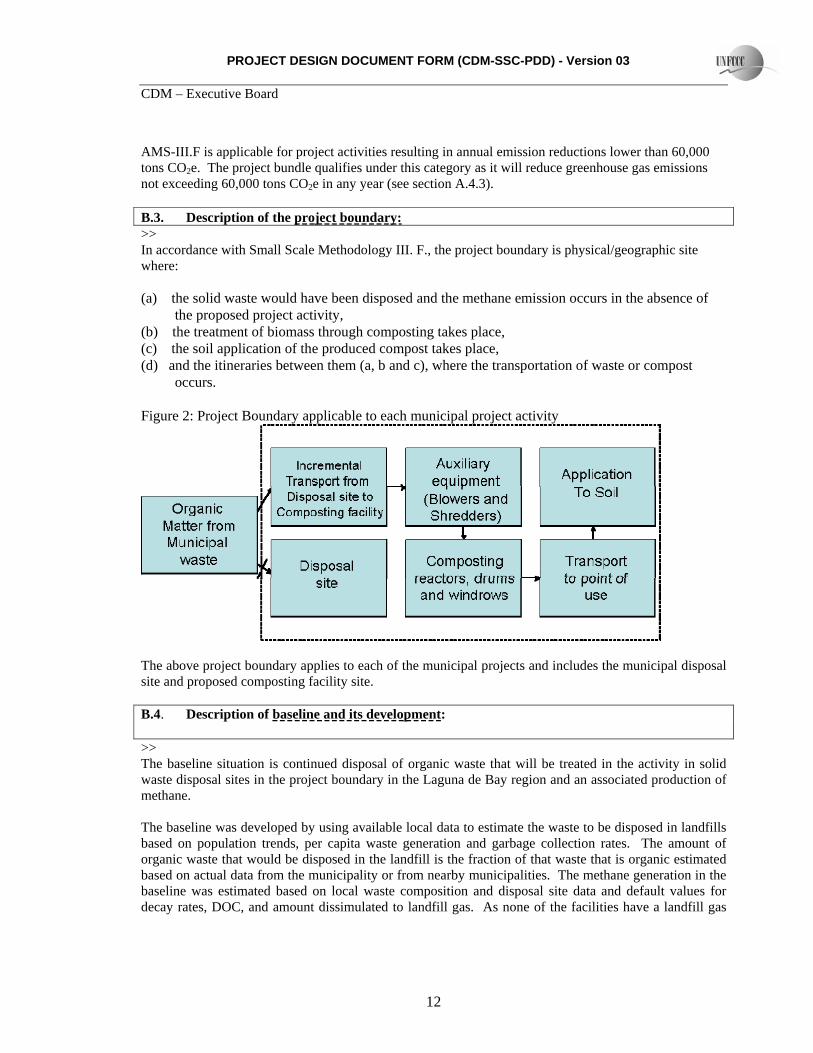
AMS-III.F is applicable for project activities resulting in annual emission reductions lower than 60,000 tons CO2e. The project bundle qualifies under this category as it will reduce greenhouse gas emissions not exceeding 60,000 tons CO2e in any year (see section A.4.3). B.3. Description of the project boundary: >> In accordance with Small Scale Methodology III. F., the project boundary is physical/geographic site where: (a) the solid waste would have been disposed and the methane emission occurs in the absence of
the proposed project activity, (b) the treatment of biomass through composting takes place, (c) the soil application of the produced compost takes place, (d) and the itineraries between them (a, b and c), where the transportation of waste or compost
occurs. Figure 2: Project Boundary applicable to each municipal project activity
The above project boundary applies to each of the municipal projects and includes the municipal disposal site and proposed composting facility site. B.4. Description of baseline and its development: >> The baseline situation is continued disposal of organic waste that will be treated in the activity in solid waste disposal sites in the project boundary in the Laguna de Bay region and an associated production of methane. The baseline was developed by using available local data to estimate the waste to be disposed in landfills based on population trends, per capita waste generation and garbage collection rates. The amount of organic waste that would be disposed in the landfill is the fraction of that waste that is organic estimated based on actual data from the municipality or from nearby municipalities. The methane generation in the baseline was estimated based on local waste composition and disposal site data and default values for decay rates, DOC, and amount dissimulated to landfill gas. As none of the facilities have a landfill gas
PROJECT DESIGN DOCUMENT FORM (CDM-SSC-PDD) - Version 03 CDM – Executive Board
13
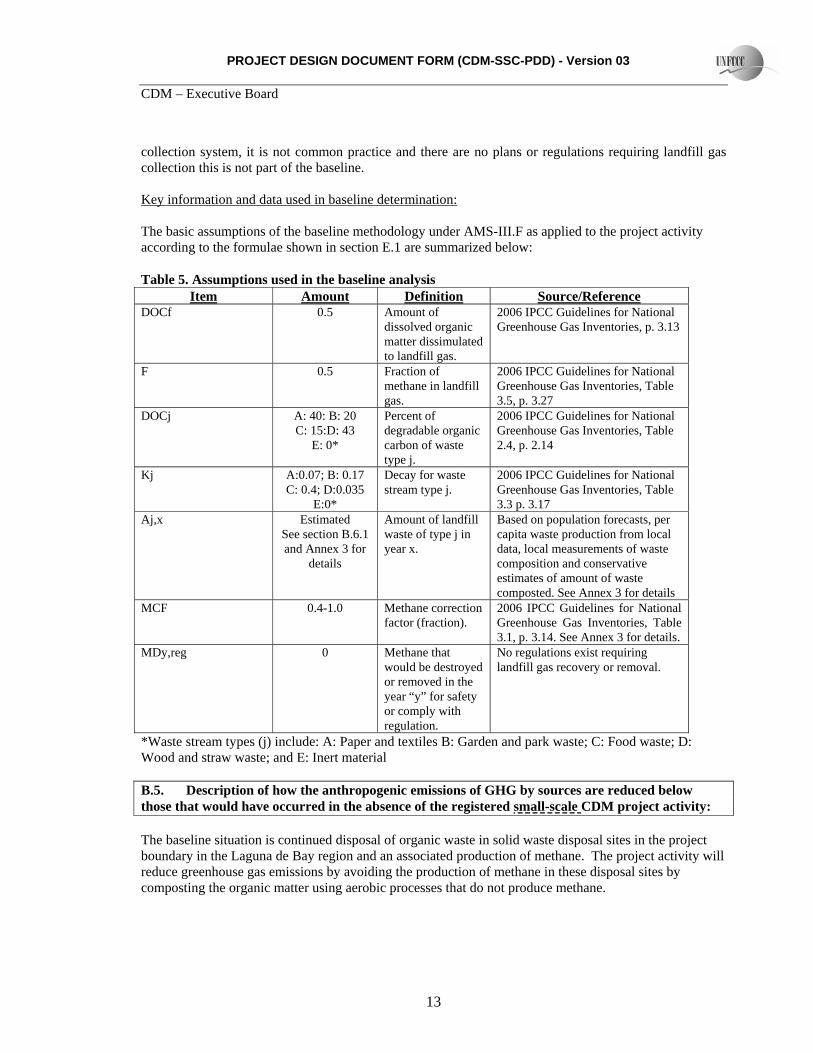
collection system, it is not common practice and there are no plans or regulations requiring landfill gas collection this is not part of the baseline. Key information and data used in baseline determination: The basic assumptions of the baseline methodology under AMS-III.F as applied to the project activity according to the formulae shown in section E.1 are summarized below: Table 5. Assumptions used in the baseline analysis
Item Amount Definition Source/Reference DOCf 0.5 Amount of
dissolved organic matter dissimulated to landfill gas.
2006 IPCC Guidelines for National Greenhouse Gas Inventories, p. 3.13
F 0.5 Fraction of methane in landfill gas.
2006 IPCC Guidelines for National Greenhouse Gas Inventories, Table 3.5, p. 3.27
DOCj A: 40: B: 20 C: 15:D: 43
E: 0*
Percent of degradable organic carbon of waste type j.
2006 IPCC Guidelines for National Greenhouse Gas Inventories, Table 2.4, p. 2.14
Kj A:0.07; B: 0.17 C: 0.4; D:0.035
E:0*
Decay for waste stream type j.
2006 IPCC Guidelines for National Greenhouse Gas Inventories, Table 3.3 p. 3.17
Aj,x Estimated See section B.6.1 and Annex 3 for
details
Amount of landfill waste of type j in year x.
Based on population forecasts, per capita waste production from local data, local measurements of waste composition and conservative estimates of amount of waste composted. See Annex 3 for details
MCF 0.4-1.0 Methane correction factor (fraction).
2006 IPCC Guidelines for National Greenhouse Gas Inventories, Table 3.1, p. 3.14. See Annex 3 for details.
MDy,reg 0 Methane that would be destroyed or removed in the year “y” for safety or comply with regulation.
No regulations exist requiring landfill gas recovery or removal.
*Waste stream types (j) include: A: Paper and textiles B: Garden and park waste; C: Food waste; D: Wood and straw waste; and E: Inert material B.5. Description of how the anthropogenic emissions of GHG by sources are reduced below those that would have occurred in the absence of the registered small-scale CDM project activity: The baseline situation is continued disposal of organic waste in solid waste disposal sites in the project boundary in the Laguna de Bay region and an associated production of methane. The project activity will reduce greenhouse gas emissions by avoiding the production of methane in these disposal sites by composting the organic matter using aerobic processes that do not produce methane.
PROJECT DESIGN DOCUMENT FORM (CDM-SSC-PDD) - Version 03 CDM – Executive Board
14
The baseline emissions will be higher than that of the project activity because the project activity will avoid methane emissions and would not have occurred anyway because of the following barriers: Investment Barriers: Municipal solid waste composting projects in the Philippines and in many parts of the world are challenged by the ability to produce and market compost and fetch adequate sale price. No readily accessible mass markets for municipal compost exist and most municipal compost that is sold is either done so in small quantities and or at a price that is lower than the recurrent production cost. As a result, composting facilities in the Philippines commonly give away a significant portion of their compost for free, use it for demonstration purposes (in a local vegetable garden etc), urban greening or let it accumulate. In the case of the project activities, there are no contractual arrangements for the sale of the compost in place or being seriously considered. The only contractual arrangements for revenues are those associated with carbon finance. The lack of security in revenues and likelihood of low revenues is a significant risk that commonly prevents investment and causes composting facilities to fail during implementation. This combined with the relative technical resources and associated capacity necessary to build and operate such a facility makes composting a riskier and more complicated option than the business as usual scenario of continued disposal of organic matter. Financial resources: The local governments in the project activity source investments in development activities through national budget transfers. Of their Internal Revenue Allotment (IRA) from the national government they use 20% of that amount for investment in development activities such as the composting facility. The local governments in the project activity are unlikely to invest and maintain the project activities due to a combination of two factors: (i) the high investment cost of the project facilities is significant relative to this allotment and would also require additional funds for operation and maintenance over the project lifetime, at least some of which would need to be sourced through municipal funds; and, (ii) relative to other activities composting projects are financially and politically unattractive. Financially they are less attractive due to their revenue risk and the likely need for a subsidy. This is in contrast to activities such as municipal markets or slaughterhouses which are reliable sources of revenues. Politically they are also less attractive. Mayors have elections every 3 years and investing in construction and maintenance of composting facilities is politically less valuable relative to projects such as roads, municipal markets, community centers, water supply, schools, health facilities and livelihood programs which can provide very direct benefits, respond to important interest groups and in most cases provide an easy means (commonly by naming the facility after the Mayor and placing signs that indicate this in well trafficked areas) to gain public visibility as people receive their benefits. An investment in the project activity would mean forgoing investments in such activities and the proven political gains.
PROJECT DESIGN DOCUMENT FORM (CDM-SSC-PDD) - Version 03 CDM – Executive Board
15
Emission reductions due to project activity are estimated at 9,114 tCO2e per year (see E.1.2.1 below).
B.6. Emissions Reductions
B.6.1. Explanation of methodological choices: >> As outlined in AMS-III.F, the following formula was used to calculated emission reductions: ERy = BEy - (PEy+Leakagey) Where:
ERy= Emissions reduction in year “y” (tonnes of CO2-e). BEy= Baseline emissions in year “y” (tonnes of CO2-e) PEy= Project emissions in year “y” (tonnes of CO2-e) Leakagey= Emissions due to leakage in year y.
Calculation of baseline emissions In accordance with AMS-III.F the baseline emissions (BEy) are the amount of methane from the decay of organic waste treated in the project activity during the crediting period. Baseline emissions exclude methane emissions that would have to be removed or combusted to comply with safety requirements or legal regulations. The baseline emissions are estimated as: BEy = BECH4,SWDS,y-MDy,reg*GWP_CH4 Where:
Box 1: National policies related to composting: The main solid waste law is the Philippines Republic Act No. 9003 Ecological Solid Waste Management Act (ESWMA) of 2000. Overall the implementation of the Act has been hampered by limited enforcement and the limited financial resources of the local governments. The Act does not mandate composting but considers it as an option to treat waste. In particular, the Act mandates the construction of Materials Recovery Facilities (MRFs) covering every Barangay (district or village) in the country. Through these facilities they should divert at least 25% of their waste from waste disposal facilities. Composting is one of several options listed (e. g. reuse, recycling, composting or other resource recovery activities) for reaching this goal but there is no mandatory requirement to adopt composting to meet the target. MRF establishment and the diversion targets are not being enforced and have very low compliance as MRFs cover only 3.7% of the Barangays in the country*. Composting is not widely adopted with a only a portion of the MRFs operating significantly sized composting facilities. The remainder do not compost or have small demonstration facilities with mixed success in operation. For Metro Manila which is proximate to the project sites less than 0.5 percent of the total municipal solid waste produced is composted by these facilities.* * Information provided by the National Solid Waste Management Commission. In September 2006, 1,550 of the 41,943 Barangays in the country are covered by MRFs. . **Of the 6,600 tons/day of waste produced in Metro Manila only 20 tons/day are composted. (Asian Development Bank and Department of Environmental and Natural Resources, Final Report Study of Markets for Recycled Solid Waste, September 2003). More recent data has indicated comparable rates of composting of waste (4 tons/day of compost produced or approximately 15-20 tons/day of waste processed) in Metro Manila. (Constancio de Guzman, Assessment of Biowaste Reuse Practices in Metro Manila, 2006).
PROJECT DESIGN DOCUMENT FORM (CDM-SSC-PDD) - Version 03 CDM – Executive Board
16
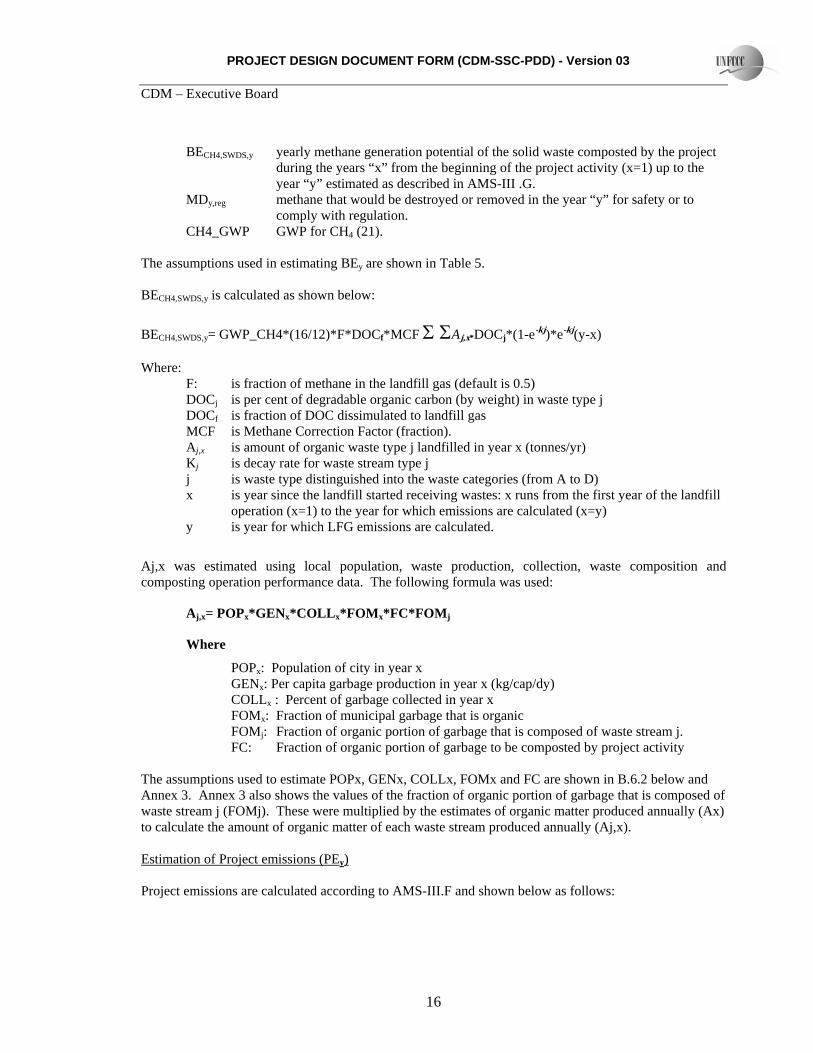
BECH4,SWDS,y yearly methane generation potential of the solid waste composted by the project during the years “x” from the beginning of the project activity (x=1) up to the year “y” estimated as described in AMS-III .G.
MDy,reg methane that would be destroyed or removed in the year “y” for safety or to comply with regulation.
CH4_GWP GWP for CH4 (21).
The assumptions used in estimating BEy are shown in Table 5. BECH4,SWDS,y is calculated as shown below:
BECH4,SWDS,y= GWP_CH4*(16/12)*F*DOCf*MCF Σ ΣAj,x*DOCj*(1-e-kj)*e-kj(y-x) Where: F: is fraction of methane in the landfill gas (default is 0.5) DOCj is per cent of degradable organic carbon (by weight) in waste type j DOCf is fraction of DOC dissimulated to landfill gas MCF is Methane Correction Factor (fraction). Aj,x is amount of organic waste type j landfilled in year x (tonnes/yr) Kj is decay rate for waste stream type j
j is waste type distinguished into the waste categories (from A to D) x is year since the landfill started receiving wastes: x runs from the first year of the landfill
operation (x=1) to the year for which emissions are calculated (x=y) y is year for which LFG emissions are calculated.
Aj,x was estimated using local population, waste production, collection, waste composition and composting operation performance data. The following formula was used:
Aj,x= POPx*GENx*COLLx*FOMx*FC*FOMj
Where
POPx: Population of city in year x GENx: Per capita garbage production in year x (kg/cap/dy) COLLx : Percent of garbage collected in year x FOMx: Fraction of municipal garbage that is organic FOMj: Fraction of organic portion of garbage that is composed of waste stream j. FC: Fraction of organic portion of garbage to be composted by project activity The assumptions used to estimate POPx, GENx, COLLx, FOMx and FC are shown in B.6.2 below and Annex 3. Annex 3 also shows the values of the fraction of organic portion of garbage that is composed of waste stream j (FOMj). These were multiplied by the estimates of organic matter produced annually (Ax) to calculate the amount of organic matter of each waste stream produced annually (Aj,x). Estimation of Project emissions (PEy) Project emissions are calculated according to AMS-III.F and shown below as follows:
PROJECT DESIGN DOCUMENT FORM (CDM-SSC-PDD) - Version 03 CDM – Executive Board
17
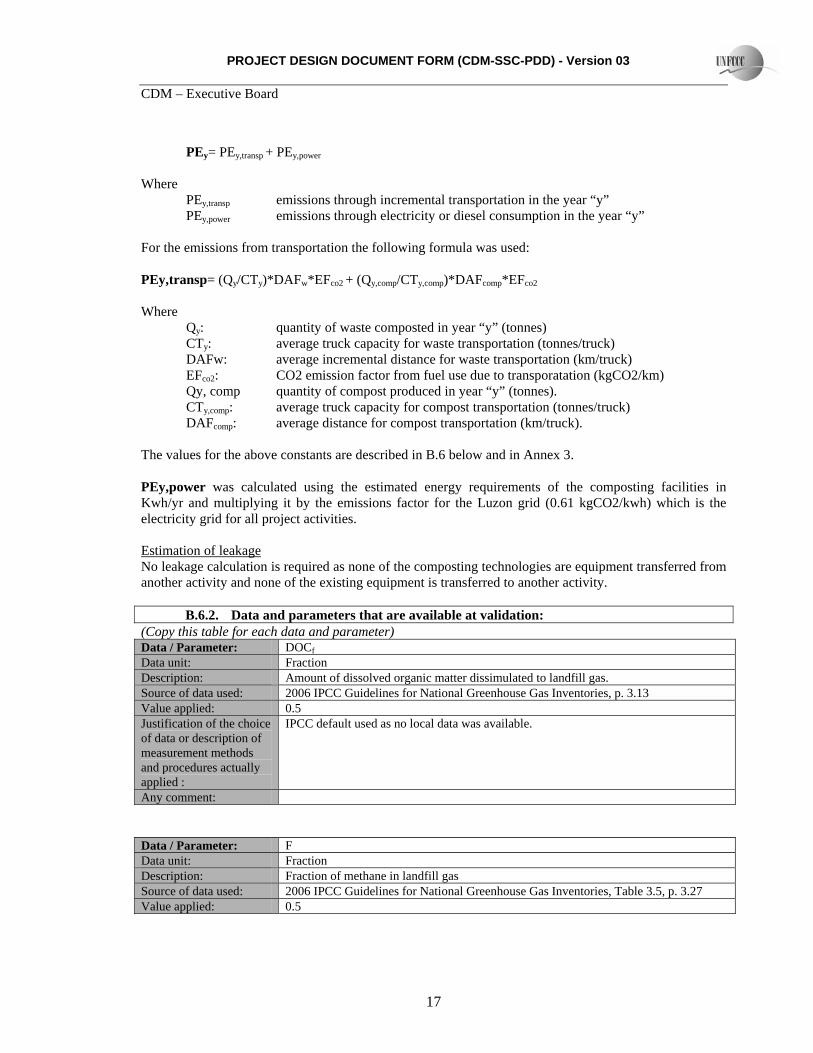
PEy= PEy,transp + PEy,power Where
PEy,transp emissions through incremental transportation in the year “y” PEy,power emissions through electricity or diesel consumption in the year “y”
For the emissions from transportation the following formula was used: PEy,transp= (Qy/CTy)*DAFw*EFco2 + (Qy,comp/CTy,comp)*DAFcomp*EFco2 Where Qy: quantity of waste composted in year “y” (tonnes)
CTy: average truck capacity for waste transportation (tonnes/truck) DAFw: average incremental distance for waste transportation (km/truck) EFco2: CO2 emission factor from fuel use due to transporatation (kgCO2/km)
Qy, comp quantity of compost produced in year “y” (tonnes). CTy,comp: average truck capacity for compost transportation (tonnes/truck) DAFcomp: average distance for compost transportation (km/truck).
The values for the above constants are described in B.6 below and in Annex 3. PEy,power was calculated using the estimated energy requirements of the composting facilities in Kwh/yr and multiplying it by the emissions factor for the Luzon grid (0.61 kgCO2/kwh) which is the electricity grid for all project activities. Estimation of leakage No leakage calculation is required as none of the composting technologies are equipment transferred from another activity and none of the existing equipment is transferred to another activity.
B.6.2. Data and parameters that are available at validation: (Copy this table for each data and parameter) Data / Parameter: DOCf Data unit: Fraction Description: Amount of dissolved organic matter dissimulated to landfill gas. Source of data used: 2006 IPCC Guidelines for National Greenhouse Gas Inventories, p. 3.13 Value applied: 0.5 Justification of the choice of data or description of measurement methods and procedures actually applied :
IPCC default used as no local data was available.
Any comment:
Data / Parameter: F Data unit: Fraction Description: Fraction of methane in landfill gas Source of data used: 2006 IPCC Guidelines for National Greenhouse Gas Inventories, Table 3.5, p. 3.27 Value applied: 0.5
PROJECT DESIGN DOCUMENT FORM (CDM-SSC-PDD) - Version 03 CDM – Executive Board
18
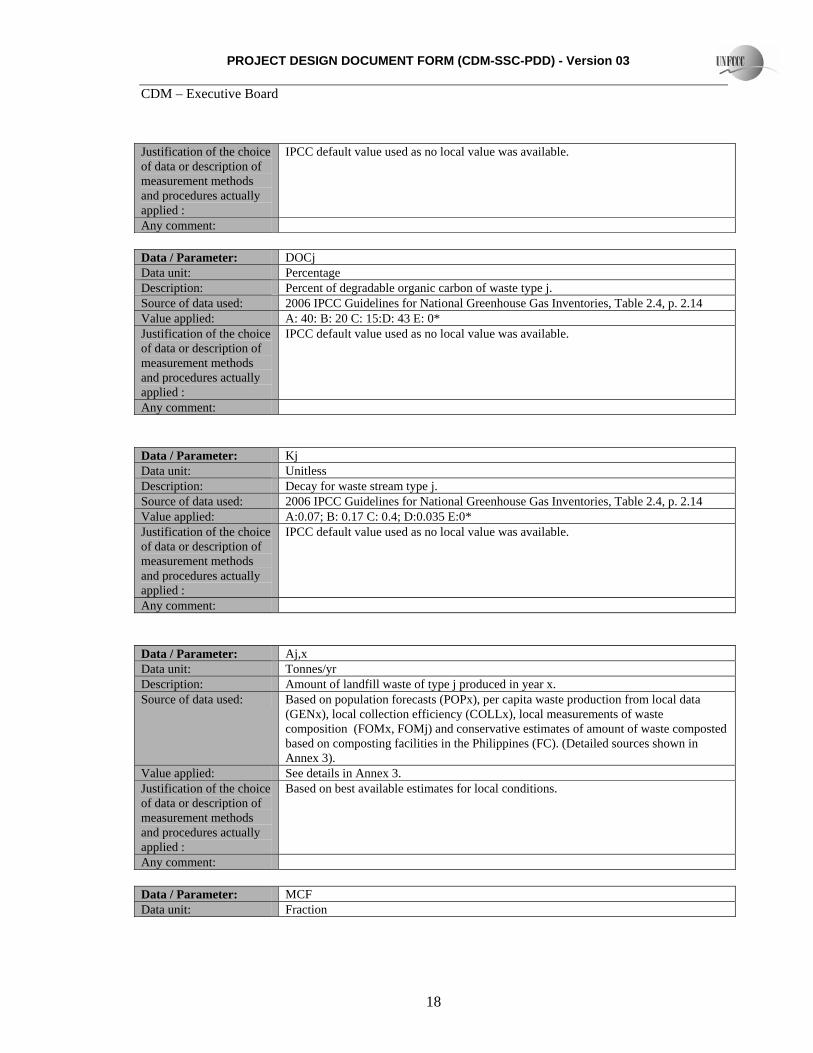
Justification of the choice of data or description of measurement methods and procedures actually applied :
IPCC default value used as no local value was available.
Any comment: Data / Parameter: DOCj Data unit: Percentage Description: Percent of degradable organic carbon of waste type j. Source of data used: 2006 IPCC Guidelines for National Greenhouse Gas Inventories, Table 2.4, p. 2.14 Value applied: A: 40: B: 20 C: 15:D: 43 E: 0* Justification of the choice of data or description of measurement methods and procedures actually applied :
IPCC default value used as no local value was available.
Any comment:
Data / Parameter: Kj Data unit: Unitless Description: Decay for waste stream type j. Source of data used: 2006 IPCC Guidelines for National Greenhouse Gas Inventories, Table 2.4, p. 2.14 Value applied: A:0.07; B: 0.17 C: 0.4; D:0.035 E:0* Justification of the choice of data or description of measurement methods and procedures actually applied :
IPCC default value used as no local value was available.
Any comment:
Data / Parameter: Aj,x Data unit: Tonnes/yr Description: Amount of landfill waste of type j produced in year x. Source of data used: Based on population forecasts (POPx), per capita waste production from local data
(GENx), local collection efficiency (COLLx), local measurements of waste composition (FOMx, FOMj) and conservative estimates of amount of waste composted based on composting facilities in the Philippines (FC). (Detailed sources shown in Annex 3).
Value applied: See details in Annex 3. Justification of the choice of data or description of measurement methods and procedures actually applied :
Based on best available estimates for local conditions.
Any comment: Data / Parameter: MCF Data unit: Fraction
PROJECT DESIGN DOCUMENT FORM (CDM-SSC-PDD) - Version 03 CDM – Executive Board
19
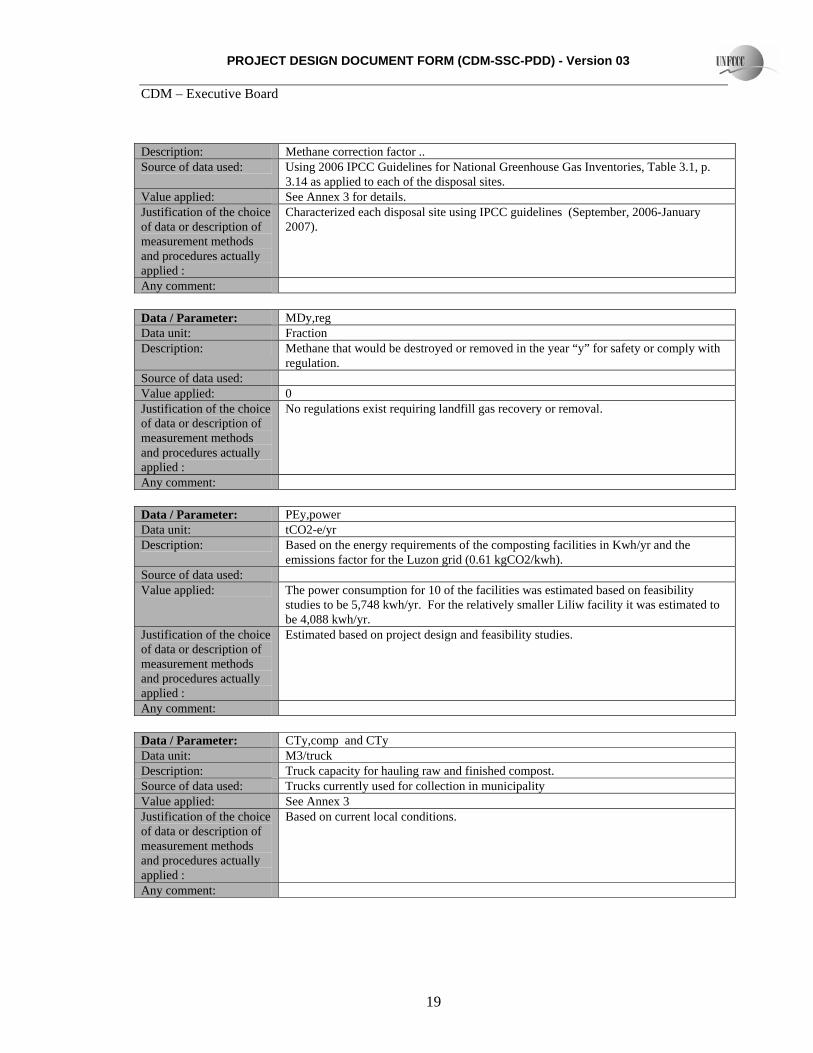
Description: Methane correction factor .. Source of data used: Using 2006 IPCC Guidelines for National Greenhouse Gas Inventories, Table 3.1, p.
3.14 as applied to each of the disposal sites. Value applied: See Annex 3 for details. Justification of the choice of data or description of measurement methods and procedures actually applied :
Characterized each disposal site using IPCC guidelines (September, 2006-January 2007).
Any comment: Data / Parameter: MDy,reg Data unit: Fraction Description: Methane that would be destroyed or removed in the year “y” for safety or comply with
regulation. Source of data used: Value applied: 0 Justification of the choice of data or description of measurement methods and procedures actually applied :
No regulations exist requiring landfill gas recovery or removal.
Any comment: Data / Parameter: PEy,power Data unit: tCO2-e/yr Description: Based on the energy requirements of the composting facilities in Kwh/yr and the
emissions factor for the Luzon grid (0.61 kgCO2/kwh). Source of data used: Value applied: The power consumption for 10 of the facilities was estimated based on feasibility
studies to be 5,748 kwh/yr. For the relatively smaller Liliw facility it was estimated to be 4,088 kwh/yr.
Justification of the choice of data or description of measurement methods and procedures actually applied :
Estimated based on project design and feasibility studies.
Any comment: Data / Parameter: CTy,comp and CTy Data unit: M3/truck Description: Truck capacity for hauling raw and finished compost. Source of data used: Trucks currently used for collection in municipality Value applied: See Annex 3 Justification of the choice of data or description of measurement methods and procedures actually applied :
Based on current local conditions.
Any comment:
PROJECT DESIGN DOCUMENT FORM (CDM-SSC-PDD) - Version 03 CDM – Executive Board
20
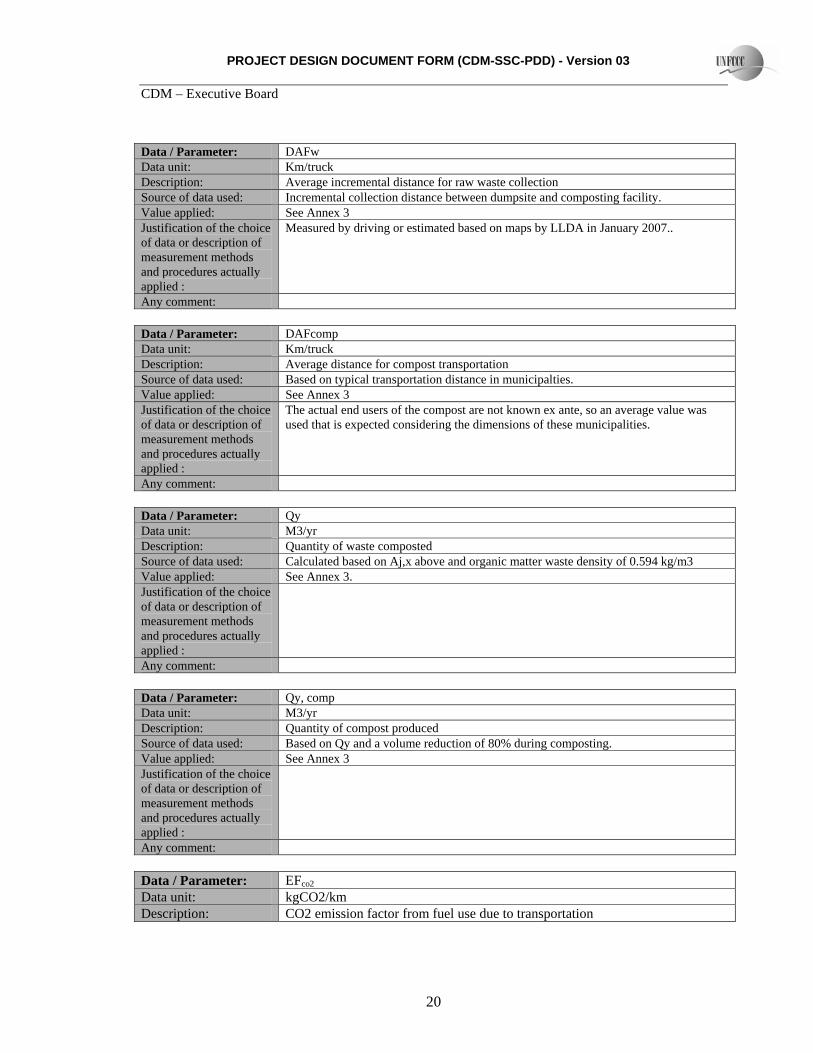
Data / Parameter: DAFw Data unit: Km/truck Description: Average incremental distance for raw waste collection Source of data used: Incremental collection distance between dumpsite and composting facility. Value applied: See Annex 3 Justification of the choice of data or description of measurement methods and procedures actually applied :
Measured by driving or estimated based on maps by LLDA in January 2007..
Any comment: Data / Parameter: DAFcomp Data unit: Km/truck Description: Average distance for compost transportation Source of data used: Based on typical transportation distance in municipalties. Value applied: See Annex 3 Justification of the choice of data or description of measurement methods and procedures actually applied :
The actual end users of the compost are not known ex ante, so an average value was used that is expected considering the dimensions of these municipalities.
Any comment: Data / Parameter: Qy Data unit: M3/yr Description: Quantity of waste composted Source of data used: Calculated based on Aj,x above and organic matter waste density of 0.594 kg/m3 Value applied: See Annex 3. Justification of the choice of data or description of measurement methods and procedures actually applied :
Any comment: Data / Parameter: Qy, comp Data unit: M3/yr Description: Quantity of compost produced Source of data used: Based on Qy and a volume reduction of 80% during composting. Value applied: See Annex 3 Justification of the choice of data or description of measurement methods and procedures actually applied :
Any comment: Data / Parameter: EFco2
Data unit: kgCO2/km Description: CO2 emission factor from fuel use due to transportation
PROJECT DESIGN DOCUMENT FORM (CDM-SSC-PDD) - Version 03 CDM – Executive Board
21
Source of data used: IPCC default Value applied: 0.579 Justification of the choice of data or description of measurement methods and procedures actually applied :
Any comment:
PROJECT DESIGN DOCUMENT FORM (CDM-SSC-PDD) - Version 03 CDM – Executive Board
22
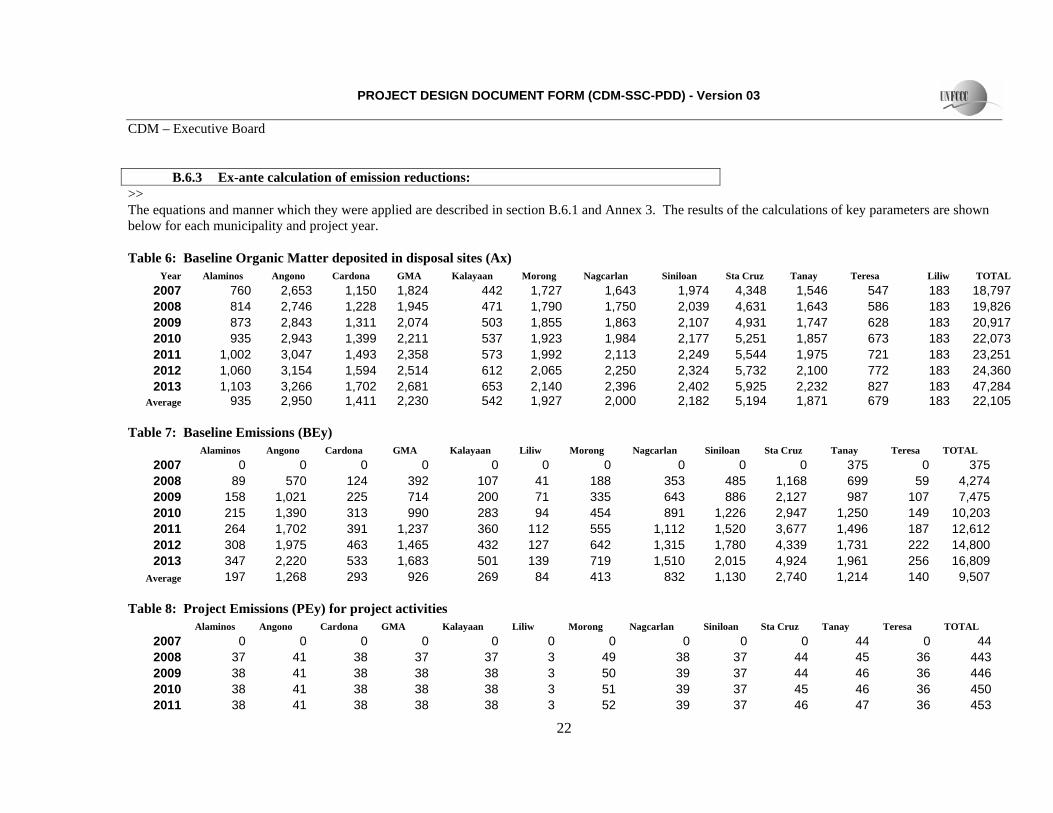
B.6.3 Ex-ante calculation of emission reductions:
>> The equations and manner which they were applied are described in section B.6.1 and Annex 3. The results of the calculations of key parameters are shown below for each municipality and project year. Table 6: Baseline Organic Matter deposited in disposal sites (Ax)
Year Alaminos Angono Cardona GMA Kalayaan Morong Nagcarlan Siniloan Sta Cruz Tanay Teresa Liliw TOTAL 2007 760 2,653 1,150 1,824 442 1,727 1,643 1,974 4,348 1,546 547 183 18,797 2008 814 2,746 1,228 1,945 471 1,790 1,750 2,039 4,631 1,643 586 183 19,826 2009 873 2,843 1,311 2,074 503 1,855 1,863 2,107 4,931 1,747 628 183 20,917 2010 935 2,943 1,399 2,211 537 1,923 1,984 2,177 5,251 1,857 673 183 22,073 2011 1,002 3,047 1,493 2,358 573 1,992 2,113 2,249 5,544 1,975 721 183 23,251 2012 1,060 3,154 1,594 2,514 612 2,065 2,250 2,324 5,732 2,100 772 183 24,360 2013 1,103 3,266 1,702 2,681 653 2,140 2,396 2,402 5,925 2,232 827 183 47,284
Average 935 2,950 1,411 2,230 542 1,927 2,000 2,182 5,194 1,871 679 183 22,105 Table 7: Baseline Emissions (BEy)
Alaminos Angono Cardona GMA Kalayaan Liliw Morong Nagcarlan Siniloan Sta Cruz Tanay Teresa TOTAL 2007 0 0 0 0 0 0 0 0 0 0 375 0 375 2008 89 570 124 392 107 41 188 353 485 1,168 699 59 4,274 2009 158 1,021 225 714 200 71 335 643 886 2,127 987 107 7,475 2010 215 1,390 313 990 283 94 454 891 1,226 2,947 1,250 149 10,203 2011 264 1,702 391 1,237 360 112 555 1,112 1,520 3,677 1,496 187 12,612 2012 308 1,975 463 1,465 432 127 642 1,315 1,780 4,339 1,731 222 14,800 2013 347 2,220 533 1,683 501 139 719 1,510 2,015 4,924 1,961 256 16,809
Average 197 1,268 293 926 269 84 413 832 1,130 2,740 1,214 140 9,507 Table 8: Project Emissions (PEy) for project activities
Alaminos Angono Cardona GMA Kalayaan Liliw Morong Nagcarlan Siniloan Sta Cruz Tanay Teresa TOTAL 2007 0 0 0 0 0 0 0 0 0 0 44 0 44 2008 37 41 38 37 37 3 49 38 37 44 45 36 443 2009 38 41 38 38 38 3 50 39 37 44 46 36 446 2010 38 41 38 38 38 3 51 39 37 45 46 36 450 2011 38 41 38 38 38 3 52 39 37 46 47 36 453
PROJECT DESIGN DOCUMENT FORM (CDM-SSC-PDD) - Version 03 CDM – Executive Board
23
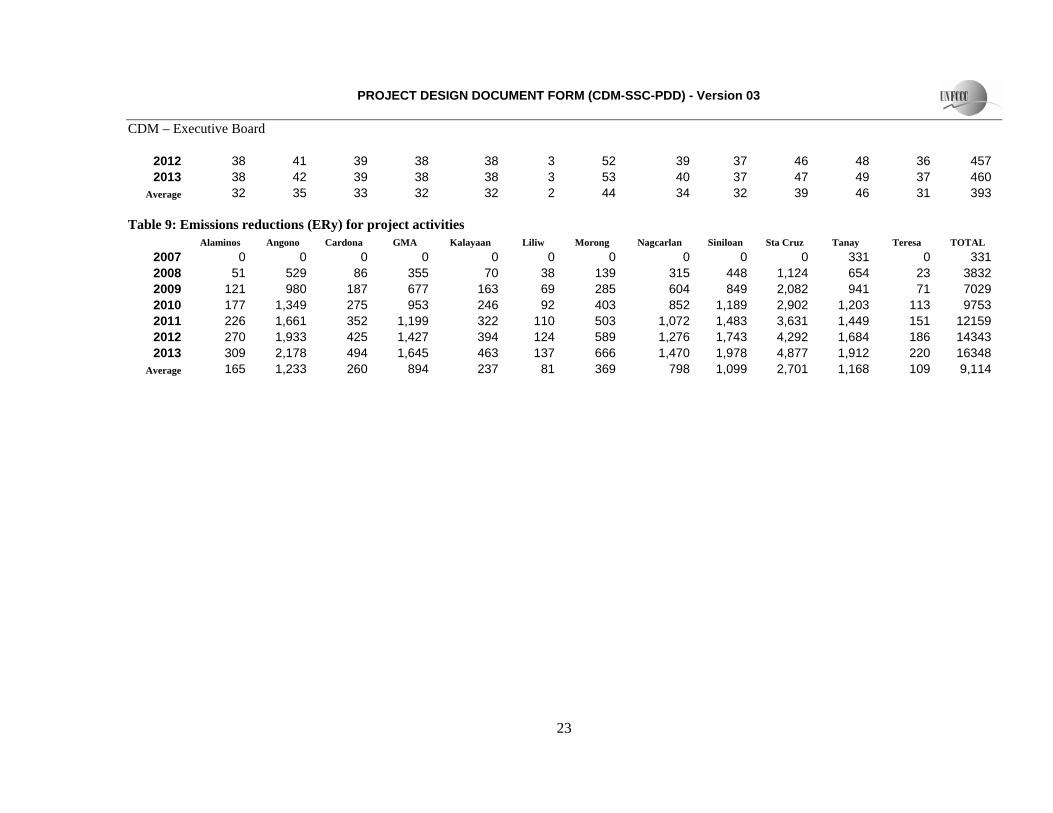
2012 38 41 39 38 38 3 52 39 37 46 48 36 457 2013 38 42 39 38 38 3 53 40 37 47 49 37 460
Average 32 35 33 32 32 2 44 34 32 39 46 31 393 Table 9: Emissions reductions (ERy) for project activities
Alaminos Angono Cardona GMA Kalayaan Liliw Morong Nagcarlan Siniloan Sta Cruz Tanay Teresa TOTAL 2007 0 0 0 0 0 0 0 0 0 0 331 0 331 2008 51 529 86 355 70 38 139 315 448 1,124 654 23 3832 2009 121 980 187 677 163 69 285 604 849 2,082 941 71 7029 2010 177 1,349 275 953 246 92 403 852 1,189 2,902 1,203 113 9753 2011 226 1,661 352 1,199 322 110 503 1,072 1,483 3,631 1,449 151 12159 2012 270 1,933 425 1,427 394 124 589 1,276 1,743 4,292 1,684 186 14343 2013 309 2,178 494 1,645 463 137 666 1,470 1,978 4,877 1,912 220 16348
Average 165 1,233 260 894 237 81 369 798 1,099 2,701 1,168 109 9,114
PROJECT DESIGN DOCUMENT FORM (CDM-SSC-PDD) - Version 03 CDM – Executive Board
24
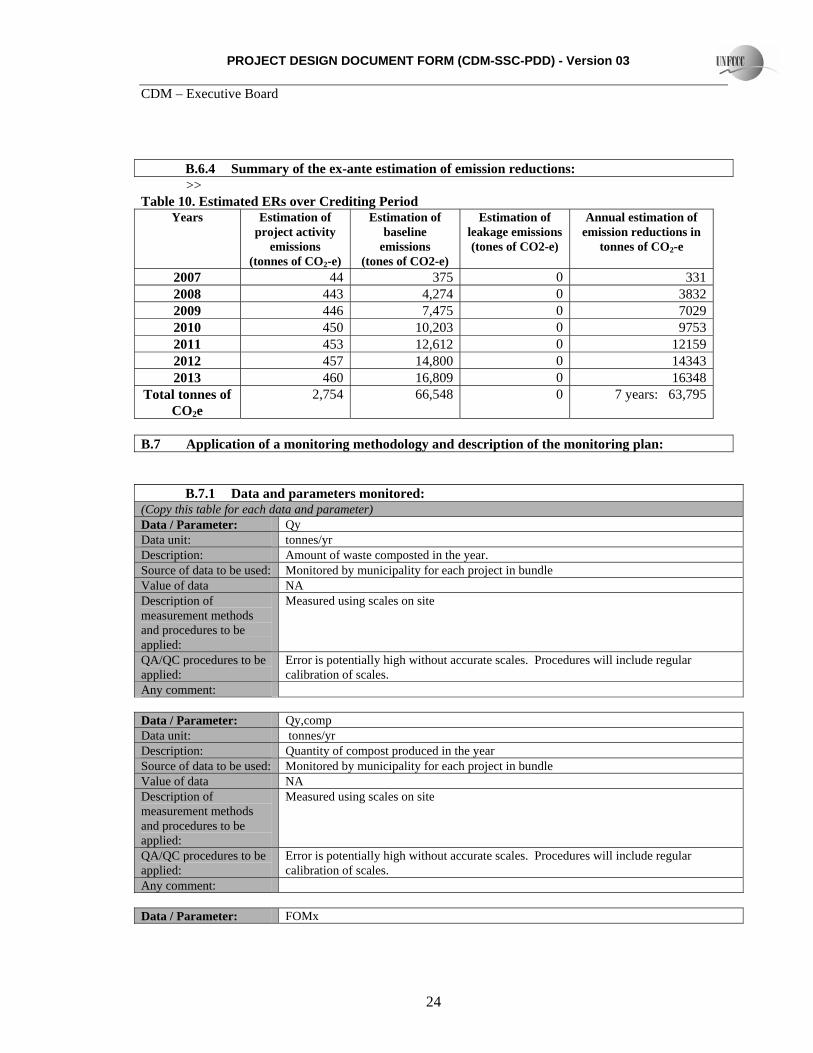
B.6.4 Summary of the ex-ante estimation of emission reductions: >>
Table 10. Estimated ERs over Crediting Period Years Estimation of
project activity emissions
(tonnes of CO2-e)
Estimation of baseline
emissions (tones of CO2-e)
Estimation of leakage emissions (tones of CO2-e)
Annual estimation of emission reductions in
tonnes of CO2-e
2007 44 375 0 3312008 443 4,274 0 38322009 446 7,475 0 70292010 450 10,203 0 97532011 453 12,612 0 121592012 457 14,800 0 143432013 460 16,809 0 16348
Total tonnes of CO2e
2,754 66,548 0 7 years: 63,795
B.7 Application of a monitoring methodology and description of the monitoring plan:
B.7.1 Data and parameters monitored: (Copy this table for each data and parameter) Data / Parameter: Qy Data unit: tonnes/yr Description: Amount of waste composted in the year. Source of data to be used: Monitored by municipality for each project in bundle Value of data NA Description of measurement methods and procedures to be applied:
Measured using scales on site
QA/QC procedures to be applied:
Error is potentially high without accurate scales. Procedures will include regular calibration of scales.
Any comment:
Data / Parameter: Qy,comp Data unit: tonnes/yr Description: Quantity of compost produced in the year Source of data to be used: Monitored by municipality for each project in bundle Value of data NA Description of measurement methods and procedures to be applied:
Measured using scales on site
QA/QC procedures to be applied:
Error is potentially high without accurate scales. Procedures will include regular calibration of scales.
Any comment: Data / Parameter: FOMx
PROJECT DESIGN DOCUMENT FORM (CDM-SSC-PDD) - Version 03 CDM – Executive Board
25
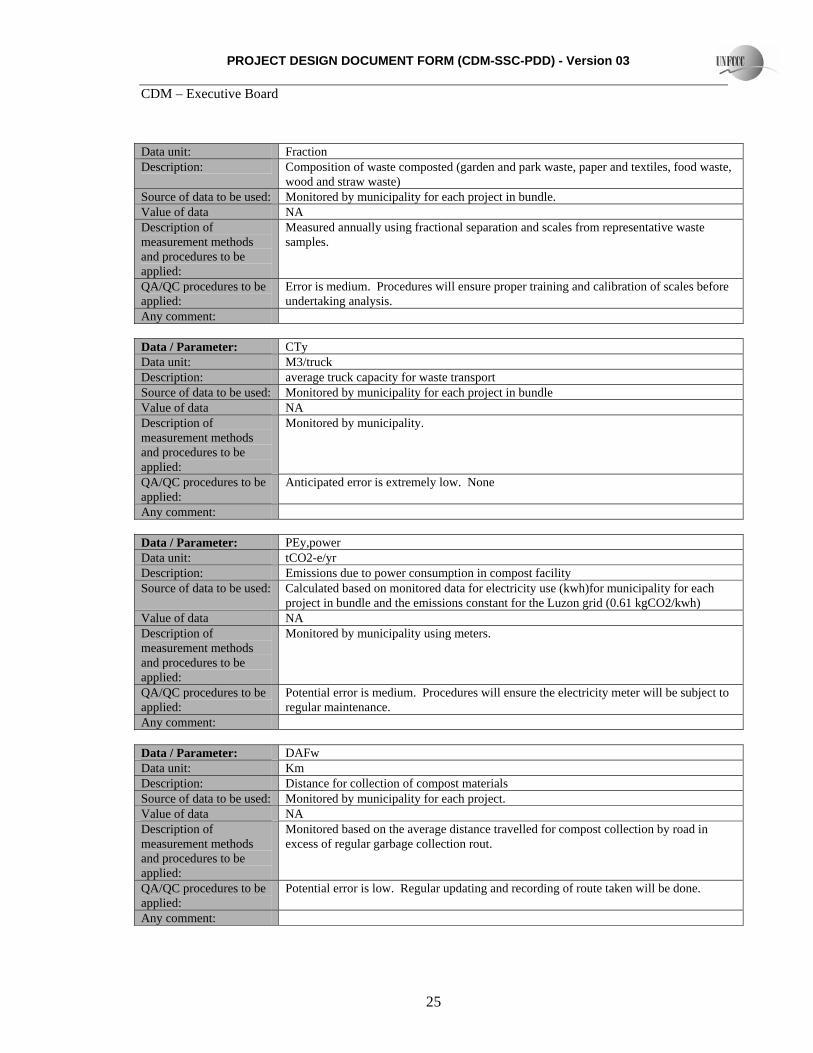
Data unit: Fraction Description: Composition of waste composted (garden and park waste, paper and textiles, food waste,
wood and straw waste) Source of data to be used: Monitored by municipality for each project in bundle. Value of data NA Description of measurement methods and procedures to be applied:
Measured annually using fractional separation and scales from representative waste samples.
QA/QC procedures to be applied:
Error is medium. Procedures will ensure proper training and calibration of scales before undertaking analysis.
Any comment: Data / Parameter: CTy Data unit: M3/truck Description: average truck capacity for waste transport Source of data to be used: Monitored by municipality for each project in bundle Value of data NA Description of measurement methods and procedures to be applied:
Monitored by municipality.
QA/QC procedures to be applied:
Anticipated error is extremely low. None
Any comment: Data / Parameter: PEy,power Data unit: tCO2-e/yr Description: Emissions due to power consumption in compost facility Source of data to be used: Calculated based on monitored data for electricity use (kwh)for municipality for each
project in bundle and the emissions constant for the Luzon grid (0.61 kgCO2/kwh) Value of data NA Description of measurement methods and procedures to be applied:
Monitored by municipality using meters.
QA/QC procedures to be applied:
Potential error is medium. Procedures will ensure the electricity meter will be subject to regular maintenance.
Any comment: Data / Parameter: DAFw Data unit: Km Description: Distance for collection of compost materials Source of data to be used: Monitored by municipality for each project. Value of data NA Description of measurement methods and procedures to be applied:
Monitored based on the average distance travelled for compost collection by road in excess of regular garbage collection rout.
QA/QC procedures to be applied:
Potential error is low. Regular updating and recording of route taken will be done.
Any comment:
PROJECT DESIGN DOCUMENT FORM (CDM-SSC-PDD) - Version 03 CDM – Executive Board
26
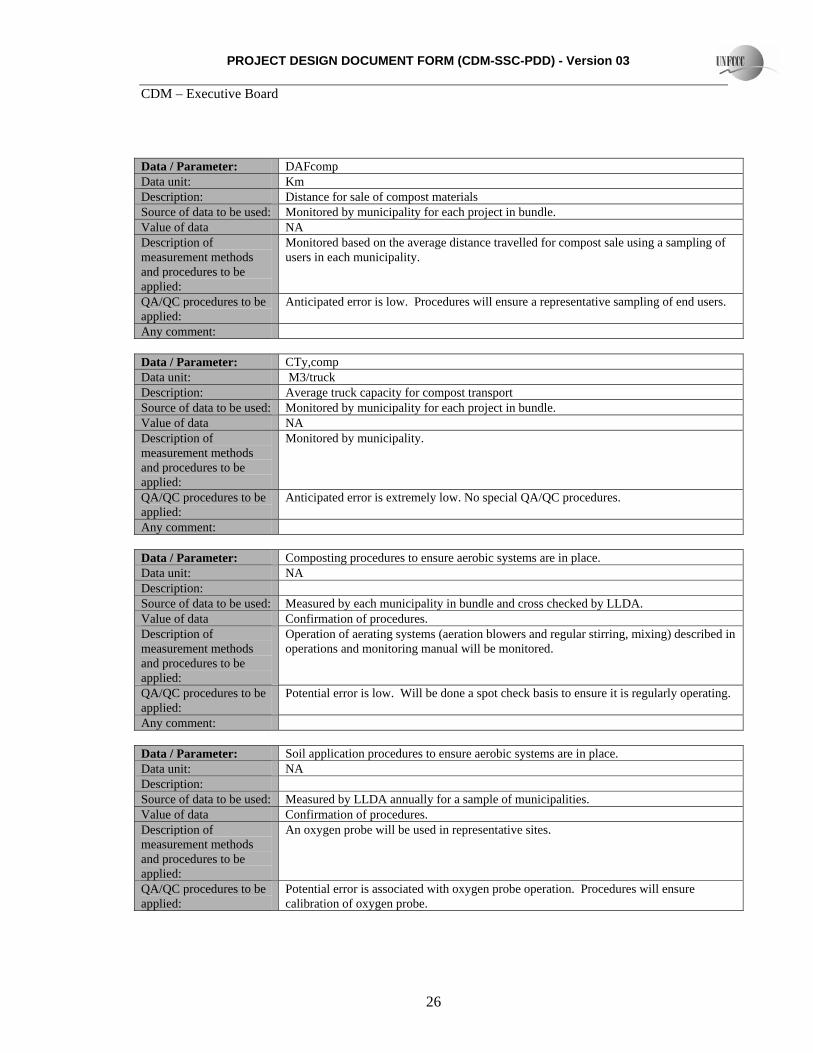
Data / Parameter: DAFcomp Data unit: Km Description: Distance for sale of compost materials Source of data to be used: Monitored by municipality for each project in bundle. Value of data NA Description of measurement methods and procedures to be applied:
Monitored based on the average distance travelled for compost sale using a sampling of users in each municipality.
QA/QC procedures to be applied:
Anticipated error is low. Procedures will ensure a representative sampling of end users.
Any comment: Data / Parameter: CTy,comp Data unit: M3/truck Description: Average truck capacity for compost transport Source of data to be used: Monitored by municipality for each project in bundle. Value of data NA Description of measurement methods and procedures to be applied:
Monitored by municipality.
QA/QC procedures to be applied:
Anticipated error is extremely low. No special QA/QC procedures.
Any comment: Data / Parameter: Composting procedures to ensure aerobic systems are in place. Data unit: NA Description: Source of data to be used: Measured by each municipality in bundle and cross checked by LLDA. Value of data Confirmation of procedures. Description of measurement methods and procedures to be applied:
Operation of aerating systems (aeration blowers and regular stirring, mixing) described in operations and monitoring manual will be monitored.
QA/QC procedures to be applied:
Potential error is low. Will be done a spot check basis to ensure it is regularly operating.
Any comment: Data / Parameter: Soil application procedures to ensure aerobic systems are in place. Data unit: NA Description: Source of data to be used: Measured by LLDA annually for a sample of municipalities. Value of data Confirmation of procedures. Description of measurement methods and procedures to be applied:
An oxygen probe will be used in representative sites.
QA/QC procedures to be applied:
Potential error is associated with oxygen probe operation. Procedures will ensure calibration of oxygen probe.
PROJECT DESIGN DOCUMENT FORM (CDM-SSC-PDD) - Version 03 CDM – Executive Board
27
Any comment: Data / Parameter: Presence of a methane recovery facility at disposal site.used by municipality Data unit: NA Description: Presence/absence Source of data to be used: Based on observations by municipality and cross-checked by LLDA. Value of data Description of measurement methods and procedures to be applied:
Observation.
QA/QC procedures to be applied:
Potential error is negligible. No special procedures will be employed.
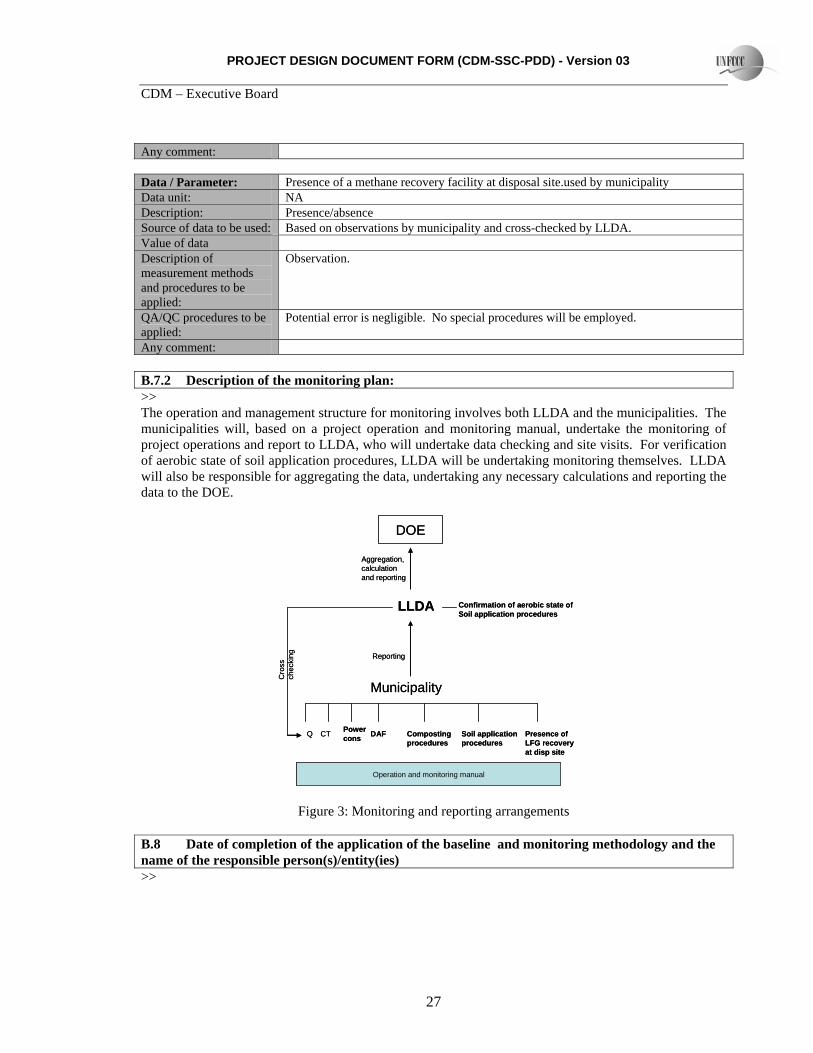
Any comment: B.7.2 Description of the monitoring plan: >> The operation and management structure for monitoring involves both LLDA and the municipalities. The municipalities will, based on a project operation and monitoring manual, undertake the monitoring of project operations and report to LLDA, who will undertake data checking and site visits. For verification of aerobic state of soil application procedures, LLDA will be undertaking monitoring themselves. LLDA will also be responsible for aggregating the data, undertaking any necessary calculations and reporting the data to the DOE.
Q CT Powercons DAF Composting
proceduresSoil application procedures
Operation and monitoring manual
Municipality
LLDA Confirmation of aerobic state ofSoil application procedures
Reporting
Cro
ss
chec
king
Aggregation, calculation and reporting
DOE
Presence ofLFG recoveryat disp site
Q CT Powercons DAF Composting
proceduresSoil application procedures
Operation and monitoring manual
Municipality
LLDA Confirmation of aerobic state ofSoil application procedures
Reporting
Cro
ss
chec
king
Aggregation, calculation and reporting
DOE
Presence ofLFG recoveryat disp site
Figure 3: Monitoring and reporting arrangements B.8 Date of completion of the application of the baseline and monitoring methodology and the name of the responsible person(s)/entity(ies) >>
PROJECT DESIGN DOCUMENT FORM (CDM-SSC-PDD) - Version 03 CDM – Executive Board
28
The baseline and monitoring methodology was completed on February 2, 2007 by Adelaida Schwab and John Morton of the World Bank. They are not a project participant as listed in Annex 1. Their contact information is as follows: World Bank, 1818 H St. NW, Washington DC 20433 J. Morton: (202) 473-4879 [email protected] A. Schwab: (202) 458-4594 [email protected] SECTION C. Duration of the project activity / crediting period C.1 Duration of the project activity: C.1.1. Starting date of the project activity: >>1 June 2006 C.1.2. Expected operational lifetime of the project activity: >>25 years C.2 Choice of the crediting period and related information: C.2.1. Renewable crediting period >> 3 x 7 year C.2.1.1. Starting date of the first crediting period: >>01/07/07. C.2.1.2.Length of the first crediting period: >>7 years C.2.2. Fixed crediting period: C.2.2.1.Starting date: >> C.2.2.2. Length: >> SECTION D. Environmental impacts >> D.1. If required by the host Party, documentation on the analysis of the environmental impacts of the project activity: >> In accordance with the Environmental Impact Assessment Law, the projects fall under the Non-Covered projects for which only the preparation of an Environment Management Plan (EMP) is required pursuant. Environmental Management Plans have been prepared for each of the projects in accordance with this requirement.
PROJECT DESIGN DOCUMENT FORM (CDM-SSC-PDD) - Version 03 CDM – Executive Board
29
D.2. If environmental impacts are considered significant by the project participants or the host Party, please provide conclusions and all references to support documentation of an environmental impact assessment undertaken in accordance with the procedures as required by the host Party: >> SECTION E. Stakeholders’ comments >> E.1. Brief description how comments by local stakeholders have been invited and compiled: >> Stakeholders from each of the localities were identified through a stakeholder mapping exercise and invited (by letter) to a series of workshops over a period of 2-3 months to solicit input at the project identification and preparation stages using the local River Council as a convening entity. The stakeholder groups included the private sector, municipal and village leaders in the project area, NGOs, fisherfolk, farmers and indigenous peoples groups. Among the topics covered including prioritization of issues, project interventions, siting, design, and the Kyoto protocol and CDM. E.2. Summary of the comments received: >> The stakeholders supported the project choice, design and the priorities it is addressing. E.3. Report on how due account was taken of any comments received: >> See above
PROJECT DESIGN DOCUMENT FORM (CDM-SSC-PDD) - Version 03 CDM – Executive Board
30
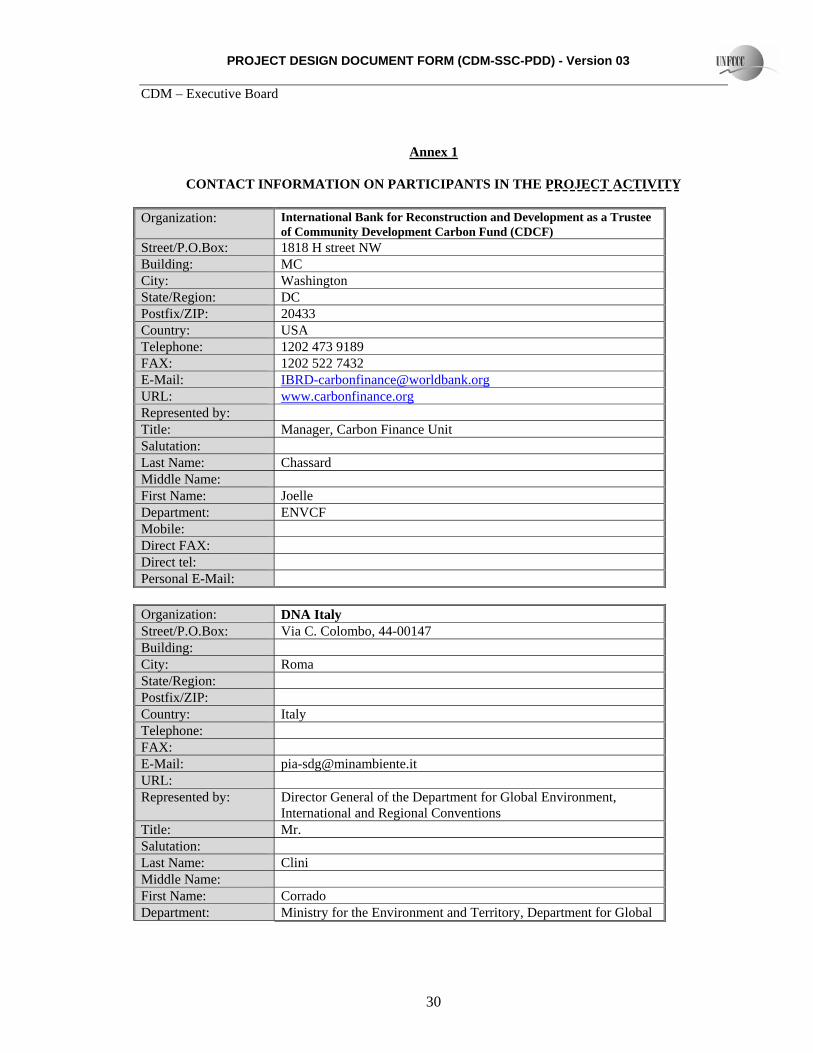
Annex 1
CONTACT INFORMATION ON PARTICIPANTS IN THE PROJECT ACTIVITY Organization: International Bank for Reconstruction and Development as a Trustee
of Community Development Carbon Fund (CDCF) Street/P.O.Box: 1818 H street NW Building: MC City: Washington State/Region: DC Postfix/ZIP: 20433 Country: USA Telephone: 1202 473 9189 FAX: 1202 522 7432 E-Mail: [email protected] URL: www.carbonfinance.org Represented by: Title: Manager, Carbon Finance Unit Salutation: Last Name: Chassard Middle Name: First Name: Joelle Department: ENVCF Mobile: Direct FAX: Direct tel: Personal E-Mail: Organization: DNA Italy Street/P.O.Box: Via C. Colombo, 44-00147 Building: City: Roma State/Region: Postfix/ZIP: Country: Italy Telephone: FAX: E-Mail: [email protected] URL: Represented by: Director General of the Department for Global Environment,
International and Regional Conventions Title: Mr. Salutation: Last Name: Clini Middle Name: First Name: Corrado Department: Ministry for the Environment and Territory, Department for Global
PROJECT DESIGN DOCUMENT FORM (CDM-SSC-PDD) - Version 03 CDM – Executive Board
31
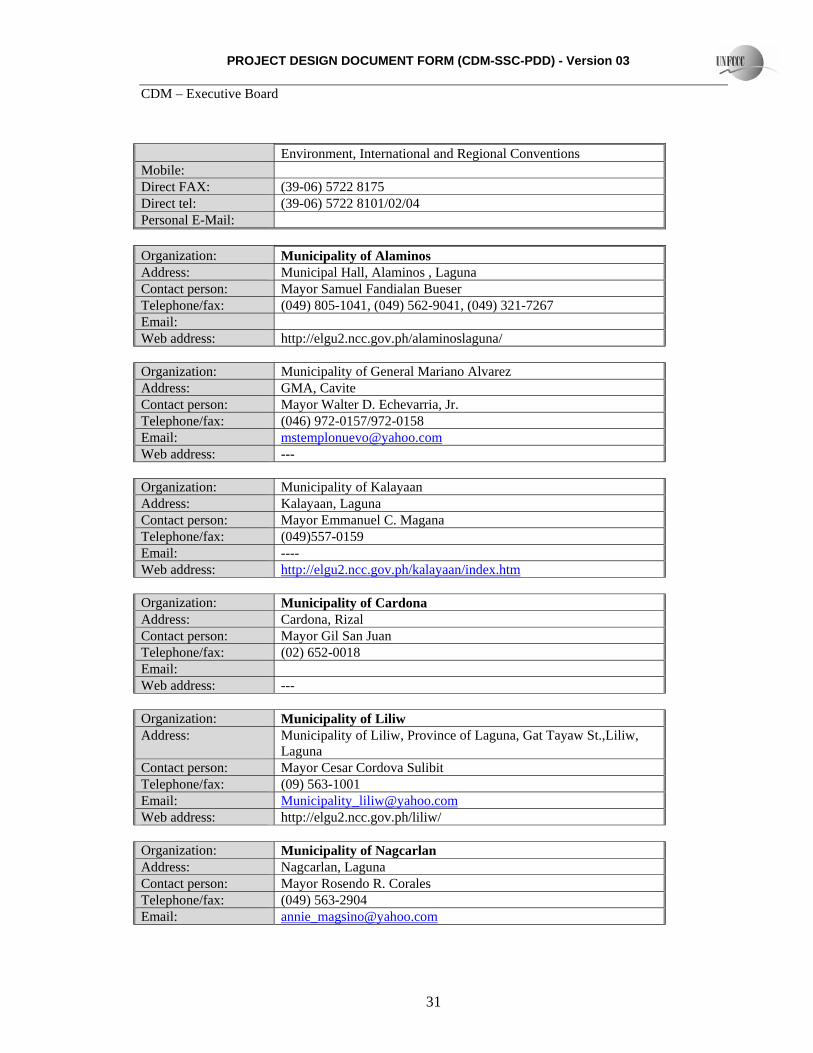
Environment, International and Regional Conventions Mobile: Direct FAX: (39-06) 5722 8175 Direct tel: (39-06) 5722 8101/02/04 Personal E-Mail: Organization: Municipality of Alaminos Address: Municipal Hall, Alaminos , Laguna Contact person: Mayor Samuel Fandialan Bueser Telephone/fax: (049) 805-1041, (049) 562-9041, (049) 321-7267 Email: Web address: http://elgu2.ncc.gov.ph/alaminoslaguna/ Organization: Municipality of General Mariano Alvarez Address: GMA, Cavite Contact person: Mayor Walter D. Echevarria, Jr. Telephone/fax: (046) 972-0157/972-0158 Email: [email protected] Web address: --- Organization: Municipality of Kalayaan Address: Kalayaan, Laguna Contact person: Mayor Emmanuel C. Magana Telephone/fax: (049)557-0159 Email: ---- Web address: http://elgu2.ncc.gov.ph/kalayaan/index.htm Organization: Municipality of Cardona Address: Cardona, Rizal Contact person: Mayor Gil San Juan Telephone/fax: (02) 652-0018 Email: Web address: --- Organization: Municipality of Liliw Address: Municipality of Liliw, Province of Laguna, Gat Tayaw St.,Liliw,
Laguna Contact person: Mayor Cesar Cordova Sulibit Telephone/fax: (09) 563-1001 Email: [email protected] Web address: http://elgu2.ncc.gov.ph/liliw/ Organization: Municipality of Nagcarlan Address: Nagcarlan, Laguna Contact person: Mayor Rosendo R. Corales Telephone/fax: (049) 563-2904 Email: [email protected]
PROJECT DESIGN DOCUMENT FORM (CDM-SSC-PDD) - Version 03 CDM – Executive Board
32
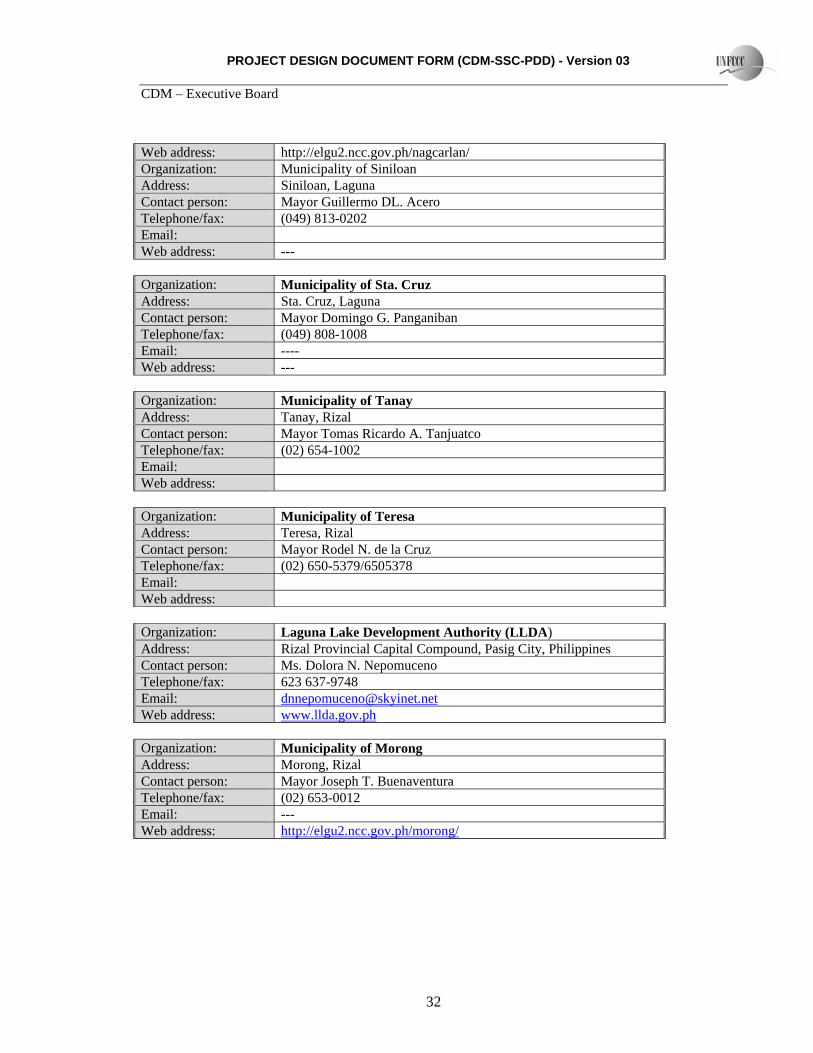
Web address: http://elgu2.ncc.gov.ph/nagcarlan/ Organization: Municipality of Siniloan Address: Siniloan, Laguna Contact person: Mayor Guillermo DL. Acero Telephone/fax: (049) 813-0202 Email: Web address: --- Organization: Municipality of Sta. Cruz Address: Sta. Cruz, Laguna Contact person: Mayor Domingo G. Panganiban Telephone/fax: (049) 808-1008 Email: ---- Web address: --- Organization: Municipality of Tanay Address: Tanay, Rizal Contact person: Mayor Tomas Ricardo A. Tanjuatco Telephone/fax: (02) 654-1002 Email: Web address: Organization: Municipality of Teresa Address: Teresa, Rizal Contact person: Mayor Rodel N. de la Cruz Telephone/fax: (02) 650-5379/6505378 Email: Web address: Organization: Laguna Lake Development Authority (LLDA) Address: Rizal Provincial Capital Compound, Pasig City, Philippines Contact person: Ms. Dolora N. Nepomuceno Telephone/fax: 623 637-9748 Email: [email protected] Web address: www.llda.gov.ph Organization: Municipality of Morong Address: Morong, Rizal Contact person: Mayor Joseph T. Buenaventura Telephone/fax: (02) 653-0012 Email: --- Web address: http://elgu2.ncc.gov.ph/morong/
PROJECT DESIGN DOCUMENT FORM (CDM-SSC-PDD) - Version 03 CDM – Executive Board
33
Annex 2
INFORMATION REGARDING PUBLIC FUNDING Carbon finance will be provided through the Community Development Carbon Fund. The project will not result in the diversion of official development assistance and is separate from and is not counted towards the financial obligations of Parties included in Annex I of the Kyoto Protocol.
PROJECT DESIGN DOCUMENT FORM (CDM-SSC-PDD) - Version 03 CDM – Executive Board
34
Annex 3
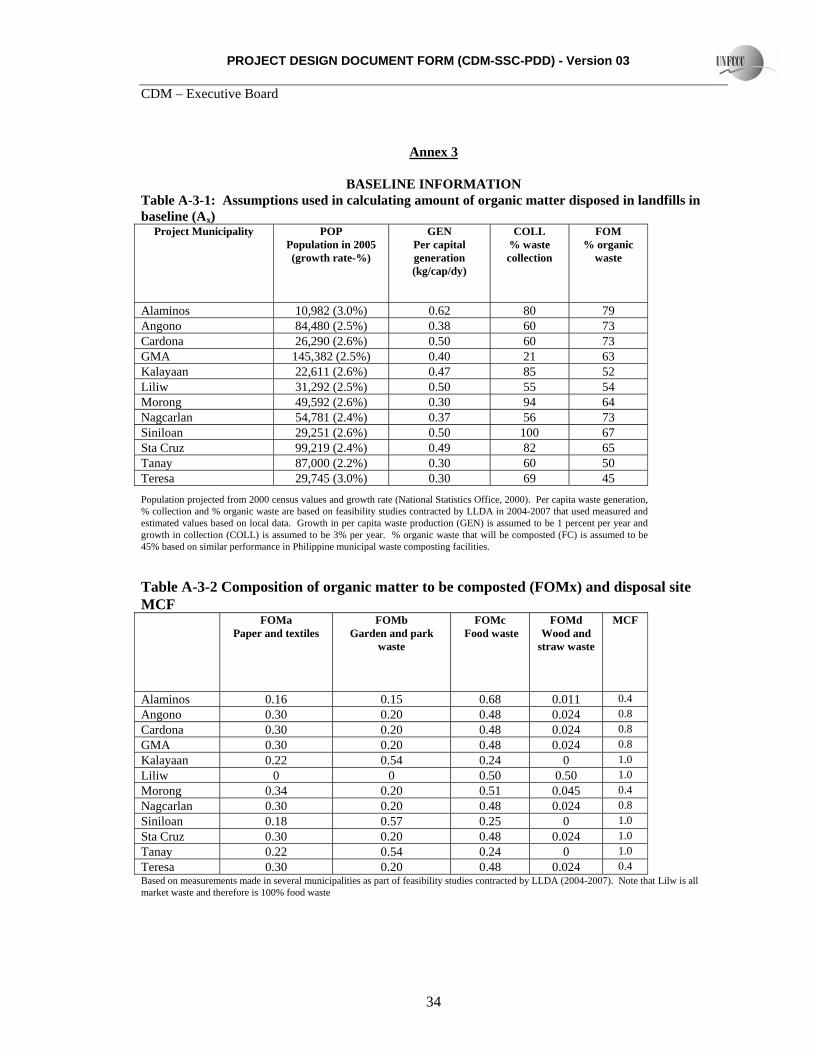
BASELINE INFORMATION Table A-3-1: Assumptions used in calculating amount of organic matter disposed in landfills in baseline (Ax)
Project Municipality POP Population in 2005 (growth rate-%)
GEN Per capital generation (kg/cap/dy)
COLL % waste collection
FOM % organic
waste
Alaminos 10,982 (3.0%) 0.62 80 79 Angono 84,480 (2.5%) 0.38 60 73 Cardona 26,290 (2.6%) 0.50 60 73 GMA 145,382 (2.5%) 0.40 21 63 Kalayaan 22,611 (2.6%) 0.47 85 52 Liliw 31,292 (2.5%) 0.50 55 54 Morong 49,592 (2.6%) 0.30 94 64 Nagcarlan 54,781 (2.4%) 0.37 56 73 Siniloan 29,251 (2.6%) 0.50 100 67 Sta Cruz 99,219 (2.4%) 0.49 82 65 Tanay 87,000 (2.2%) 0.30 60 50 Teresa 29,745 (3.0%) 0.30 69 45 Population projected from 2000 census values and growth rate (National Statistics Office, 2000). Per capita waste generation, % collection and % organic waste are based on feasibility studies contracted by LLDA in 2004-2007 that used measured and estimated values based on local data. Growth in per capita waste production (GEN) is assumed to be 1 percent per year and growth in collection (COLL) is assumed to be 3% per year. % organic waste that will be composted (FC) is assumed to be 45% based on similar performance in Philippine municipal waste composting facilities.
Table A-3-2 Composition of organic matter to be composted (FOMx) and disposal site MCF
FOMa Paper and textiles
FOMb Garden and park
waste
FOMc Food waste
FOMd Wood and
straw waste
MCF
Alaminos 0.16 0.15 0.68 0.011 0.4 Angono 0.30 0.20 0.48 0.024 0.8 Cardona 0.30 0.20 0.48 0.024 0.8 GMA 0.30 0.20 0.48 0.024 0.8 Kalayaan 0.22 0.54 0.24 0 1.0 Liliw 0 0 0.50 0.50 1.0 Morong 0.34 0.20 0.51 0.045 0.4 Nagcarlan 0.30 0.20 0.48 0.024 0.8 Siniloan 0.18 0.57 0.25 0 1.0 Sta Cruz 0.30 0.20 0.48 0.024 1.0 Tanay 0.22 0.54 0.24 0 1.0 Teresa 0.30 0.20 0.48 0.024 0.4 Based on measurements made in several municipalities as part of feasibility studies contracted by LLDA (2004-2007). Note that Lilw is all market waste and therefore is 100% food waste
PROJECT DESIGN DOCUMENT FORM (CDM-SSC-PDD) - Version 03 CDM – Executive Board
35
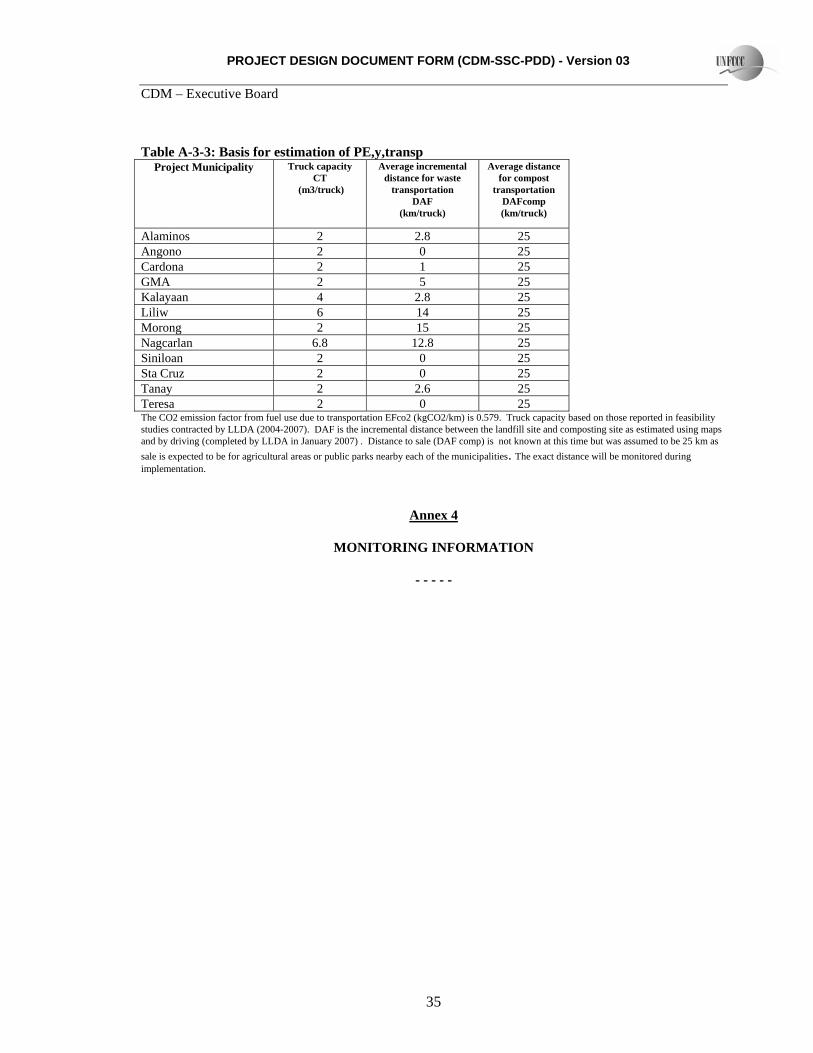
Table A-3-3: Basis for estimation of PE,y,transp Project Municipality Truck capacity
CT (m3/truck)
Average incremental distance for waste
transportation DAF
(km/truck)
Average distance for compost
transportation DAFcomp (km/truck)
Alaminos 2 2.8 25 Angono 2 0 25 Cardona 2 1 25 GMA 2 5 25 Kalayaan 4 2.8 25 Liliw 6 14 25 Morong 2 15 25 Nagcarlan 6.8 12.8 25 Siniloan 2 0 25 Sta Cruz 2 0 25 Tanay 2 2.6 25 Teresa 2 0 25 The CO2 emission factor from fuel use due to transportation EFco2 (kgCO2/km) is 0.579. Truck capacity based on those reported in feasibility studies contracted by LLDA (2004-2007). DAF is the incremental distance between the landfill site and composting site as estimated using maps and by driving (completed by LLDA in January 2007) . Distance to sale (DAF comp) is not known at this time but was assumed to be 25 km as sale is expected to be for agricultural areas or public parks nearby each of the municipalities. The exact distance will be monitored during implementation.
Annex 4
MONITORING INFORMATION
- - - - -