Embed Size (px)
Citation preview
Copernican Journal of Finance & Accounting
e-ISSN 2300-3065p-ISSN 2300-12402016, volume 5, issue 2
Date of submission: December 28, 2016; date of acceptance: January 20, 2017.* Contact information: [email protected], Accounting Department, Faculty of
Tourism and Hospitality Management, University of Rijeka, UniPrimorska 42, p.p. 51410 Opatija, Croatia, phone: +385 51 294 698.
** Contact information: [email protected], Business Department, Karlovac University of Applied Sciences, Trg J. J. Strossmayera 9, 47000 Karlovac, Croatia, phone: +385 47 843 546.
Peršić, M., & Halami, L. (2016). Disclosing non-financial information in companies’ reports in Cro-atia. Copernican Journal of Finance & Accounting, 5(2), 181–200. http://dx.doi.org/10.12775/CJFA.2016.022
Milena Peršić*
University of Rijeka
Lahorka haLmi**
Karlovac University of Applied Sciences
discLosing non-financiaL information in companies’ reports in croatia
Keywords: companies’ reports, disclosure of non-financial information, Directive 2014/95/EU, GRI, KPIs, sustainability indicators.
J E L Classification: M14, Q56.
Abstract: Subsequent to the provision of the Directive 2014/95/EU requiring disclosu-re of non-financial and diversity information of all EU Member States companies with 500 and more employees, a research was conducted at the beginning of 2016 on a sam-ple of sustainability reports disclosed by Croatian companies in 2014 that had registe-red 400 and more employees in that same year, with an assumption of their growth by 2018 in terms of the number of their employees. This research was focused on the structure of the indicators identified in non-financial reports, viewed as content-orien-ted and entry-oriented measures (attributes). The indicators analyzed were extracted from the original research done on the quality of non-financial reports of the compa-nies in Croatia registering 400 and more employees. The method employed was a con-
Milena Peršić, Lahorka Halmi182
tent analysis. The results show that many of the disclosed sustainability indicators are “story-tellers”, meaning that they are past-oriented and qualitatively stated, suggesting that activities concerning sustainability in company are present, but no cause-effect relationships are presented therein. The results point to a need for significant impro-vements in defining a minimum of requirements for the indicators disclosed in non-fi-nancial reports. Since very few indicators reflect all of the attributes assessed in this research, there is a need for finding ways to capture relevant data in accounting of en-terprises, so as to establish a requirement for comparability of non-financial informa-tion disclosed in sustainability reports and thus bring about the requirements of the Directive 2014/95/EU.
Introduction
With European Commission’s (EC) issuing of the Directive 2014/95/EU and re-quiring disclosure of non-financial and diversity information, there is a need to assess the preparedness of companies with 500 and more employees in the EU Member States to successfully put this Directive into practice. The re-search was conducted at the beginning of 2016 on the sample of sustainabil-ity reports disclosed by companies that in 2014 had registered 400 and more employees, with the assumption of their growth by 2018 in terms of the num-ber of their employees. Eventually all these companies will be obliged to dis-close non-financial information in sustainability reports. Since the EC has not yet published any guidelines on disclosing non-financial information, the qual-ity of non-financial information disclosed in sustainability reports is assessed according to the GRI G4 framework. The paper examines the structure of the indicators disclosed as non-financial information in sustainability reports of Croatian companies.
Theoretical Background
Today there are almost countless frameworks dealing with sustainability is-sues in companies, which can be grouped as either only to report on sustain-ability or to rate and rank the companies according to their sustainability result(s) (Herriott, 2016, p. 25). According to the Directive 2014/95EU, compa-nies may rely on national or EU – based frameworks (e.g. EMAS, ISO 14001, etc.) or any other recognized international frameworks (e.g. GRI, UN Global Com-pact, OECD Guideline, ISO 26000, ILO Tripartite Declaration) (EC 2014, para 9; GRI 2014a; GRI 2014b). There have been few attempts of classifying these re-

Disclosing non-financial information in companies’ reports… 183
porting frameworks according to any similarity, but these classifications dif-fered (Choi, 2003; GISR, 2015; Perrini, 2005, p. 611).
Herriott (2016, pp. 50–69) states that this number of sustainability frame-works is due to the: “philosophy, or philosophies, of sustainability [that] is (are) implied by the indicators in a standard” (2016, p. 51) or framework, thus re-flecting either a worldview or an ethical system (Herriott, 2016, p. 50, 209), this being a root cause of so many frameworks. Windolph (2011, p. 2) recog-nized the lack of standardization of measures and methodologies among rating frameworks (or systems), which are evident among any of the reporting frame-works as well.
While dealing with the waste measurement, Herriott (2016, pp. 149–168, 203–204) came to the conclusion that not even at the primary category (envi-ronmental and social) level of the frameworks are indicators consistently clas-sified, suggesting that these indicators should be consistent in at least primary categories, thus making comparison of sustainability reports and results possi-ble. Herriott also recognized the need of scholarly research in the development of KPIs as subcategories (Herriott, 2016, p. 213).
Only measurable and verifiable sustainability activities ought to be dis-closed in sustainability reports, for information that is not measurable and verifiable is not auditable or comparable and does not provide relevant and ob-jective information to any of the stakeholders (Brockett, Rezaee, 2012, p. 45) interested in sustainability information for any given reason. In line with this statement and with the requirements of the Directive 2014/95/EU, the focus of this research will be on the structure of the disclosed indicators (Herriott, 2016, p. 99) as non-financial information disclosed in sustainability reports, that can be found under titles such as annual report, environmental report, so-cial responsibility report, corporate responsibility report, integrated report, segment responsibility report, and alike.
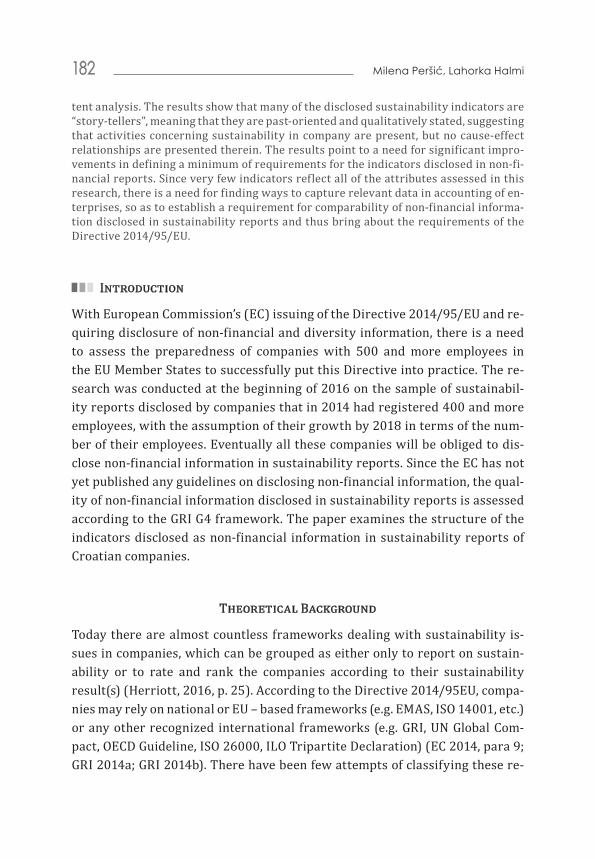
On an assessment scale of sustainability-dimension-inclusion, with an op-tion of being included with a minimum reference (☻), included with some cov-erage (☻☻), and included with extensive coverage (☻☻☻), the GRI guidelines have been assessed as a sustainability (reporting) framework that includes all three sustainability dimensions (economic, environmental, social) with exten-sive coverage (Perrini, 2005, p. 614), as shown in table 1.
Along with extensive coverage of sustainability dimensions, the GRI (G4) guidelines recognize a hierarchical order of data disclosed as categories, as-
Milena Peršić, Lahorka Halmi184
pects and indicators (GRI, 2014a, p. 9, 2014b, pp. 19–21), hence being a relevant starting point in implementing the provisions of EU the Directive 2014/95/EU. For the purpose of this research, the term aspect was equaled to the term in-dicator, whereas indicator defined by the GRI G4 was treated as an item or the smallest unit of information (Herriott, 2016, p. 71) that could be reported un-der standard. Although numerous companies in different countries present non-financial information, this area is still insufficiently imbedded in and coor-dinated through regulations, meaning that non-financial reports are still most-ly voluntary based (SSEI), so these starting points were also recognized in this research.
Research sample, framework, and methodology
The EU Directive 2014/95/EU on disclosing non-financial information is di-rected at large undertakings, groups and big companies of public interest reg-istering 500 and more employees (EC, 2013, art. 2; EC, 2014). Subsequently to the provisions of the Directive 2014/95/EU, in 2016 a research was conducted on companies registering 400 and more employees in Croatia, which will be re-quired to disclose non-financial information in sustainability reports in 2018 and onwards.
Stan
dard
nam
e
UN
Glob
al
Com
pact
Amne
sty
Int.
Guid
elin
.ET
I Su
lliva
n Pr
inci
ples
OEC
D gu
idel
in.
WHO
/ UN
ICEF
Br
east
m
ilkEC
CR /
ICCR
SA
8000
ISO
90
00 /
ISO
14
001
EMAS
EU E
co-
labe
lFS
CDJ
GSI
ECPI
Et
hica
l In
deks
Eu
roFT
SE4
GOO
DGR
I AA
10
00S
econ
omic
☻☻
☻☻
☻☻☻☻
☻so
cial
☻☻☻
☻☻☻
☻☻
☻☻☻
☻☻
☻☻
☻☻
☻☻
☻☻
☻☻☻
☻☻☻
envi
ronm
enta
l☻
☻☻
☻☻☻
☻☻
☻☻
☻☻
☻☻
☻☻
☻☻☻
☻
finan
cial
☻☻
☻☻
☻☻
☻☻☻
econ
omic
de
velo
pmen
t☻☻
☻☻
☻☻
☻☻☻☻
☻☻
cons
umer
aff
airs
☻☻☻
☻☻☻☻
☻☻☻☻
☻☻☻
hum
an ri
ghts
☻☻☻
☻☻☻
☻☻
☻☻☻
☻☻☻
☻☻☻☻
☻☻
☻☻☻☻
☻☻☻
empl
oyee
re
latio
ns☻☻☻
☻☻
☻☻
☻☻
☻☻☻
☻☻
☻☻☻☻
☻☻☻
com
mun
ity
inve
stm
ent
☻☻
☻☻
☻☻
☻☻☻
☻☻☻
brib
ery
and
corr
uptio
n☻
☻☻
☻☻
☻☻☻
☻☻☻
bio
dive
rsity
☻☻
☻☻
☻☻☻
☻☻☻
☻☻☻
☻☻
☻☻☻
☻ai
r qua
lity
and
nois
e po
llutio
n☻
☻☻☻
☻☻
☻☻☻
☻
ener
gy a
nd w
ater
☻☻☻☻
☻☻☻
☻☻☻☻
☻m
ater
ials
☻☻☻☻
☻☻☻
☻☻☻
☻☻
☻☻☻☻
☻☻
RATI
NG
INDI
CES
ACCO
UN
TABI
LITY
AN
D RE
PORT
ING
FR
AMEW
ORK
☻ ☻ ☻ ☻
☻☻
☻☻ ☻ ☻
ASPI
RATI
ON
AL P
RIN
CIPL
ES A
ND
CODE
S O
F PR
ACTI
CES
MAN
AGEM
ENT
SYST
EMS
AND
CERT
IFIC
ATIO
N S
CHEM
ES
ASPI ☻
CSR
issu
es
Dim
ensi
ons
Tabl
e 1.
Sus
tain
abili
ty d
imen
sion
s cov
ered
in s
usta
inab
ility
fram
ewor
ks
So
urc
e: P
erri
ni, 2
005,
p. 6
14.
Milena Peršić, Lahorka Halmi186
The sample companies (with 400 and more employees) were retrieved from Croatian Company Directory (CCD) website provided by Croatian Cham-ber of Economy (Croatian Chamber of Economy); their websites were searched for available reports disclosing non-financial information, commonly referred to as sustainability, social and/or environmental report, presented either in a form of stand-alone report or annual (financial) reports. If no such reports were found, further research was done by predefined key-word phrases via Google search, and downloaded from the company websites.
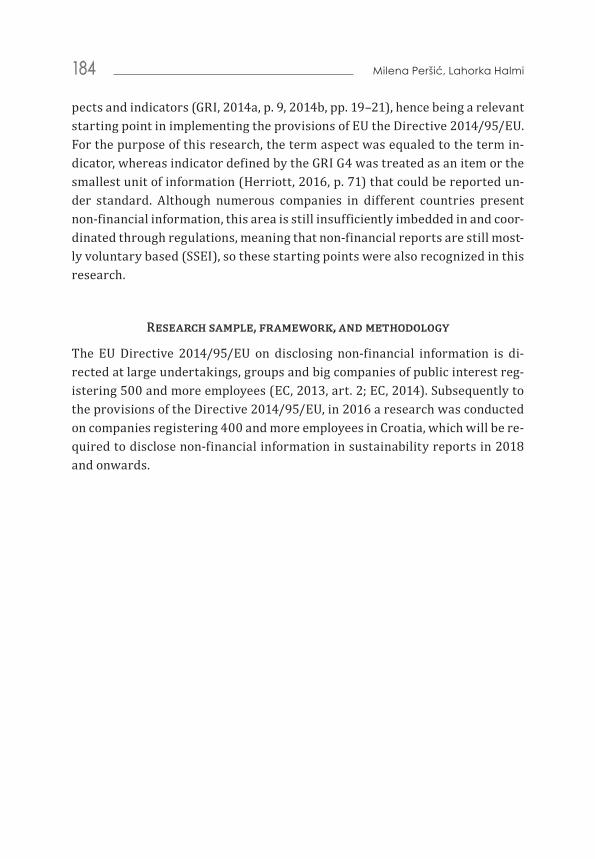
Sustainability reports for the reporting year 2014 were collected in Decem-ber 2015 and analyzed at the beginning of 2016. The list of the retrieved com-panies was divided into 2 major groups. The first group was composed of large, medium and small companies (CAA, 2015), registering 500 and more employ-ees (500+), and the second composed of companies registering between 400 and 500 employees in 2014. Since many of the Croatian companies were mem-bers of a business group appearing in both size-groups, the final number of re-ports available for research was 38, as shown in the table 2.
Table 2. Croatian companies with 400 and more employees
Description Big companies Medium andsmall companies TOTAL
Number of employees in retrieved Cro-atian companies
500 400–499 400–500
Number of Croatian companies retrieved 172 49 221
Number of Croatian companies reporting (merged with the group)
142 42 184
Number of sustainability reports available for research
37 1 38
S o u r c e : results of empirical research.
As shown in table 3, there were 221 companies retrieved from the Croatian Company Directory in January 2016. There were 179 companies with 500 plus employees and 42 companies with 400–499 employees registered in 2014. Af-ter coding companies that were members of a group and counting the number of available sustainability reports, there were available only: ■ 19 sustainability reports disclosed by companies registering 500 plus
employees,

Disclosing non-financial information in companies’ reports… 187
■ 18 sustainability reports disclosed by companies that were not members of any group,
■ 1 sustainability report disclosed by a company with 400 to 499 employ-ees, not member of any of the groups.
These reports were analyzed according to the GRI G4 standards’ method-ological framework and guidelines, which were chosen as globally accepted reporting guidelines. Except for being assessed as a framework including all three sustainability categories (environmental, social, economic) with exten-sive coverage (Perrini, 2005, p. 614), these guidelines are of particular impor-tance for disclosing non-financial information, because they present reporting principles (GRI, 2014a, pp. 16–18) that are divided into two groups of tasks: first, principles related to the report content (stakeholder inclusiveness, sus-tainability context, materiality), and second, principles related to the quality of reports (balance, comparability, accuracy, timeliness, clarity, reliability).
Table 3. Processing number of available sustainability reports
total no. of companies 221 no. of reports members of group +500 19
+500 (all) 179 no. of reports not member of a group +500 18
group/& reports 19 no. of reports +500 37
+500 (not member of a group) 123 no. Reports 400–499 1
+500 + groups 142 TOTAL no. of reports 38
+400–499 42
total no. of companies 184
S o u r c e : results of empirical research.
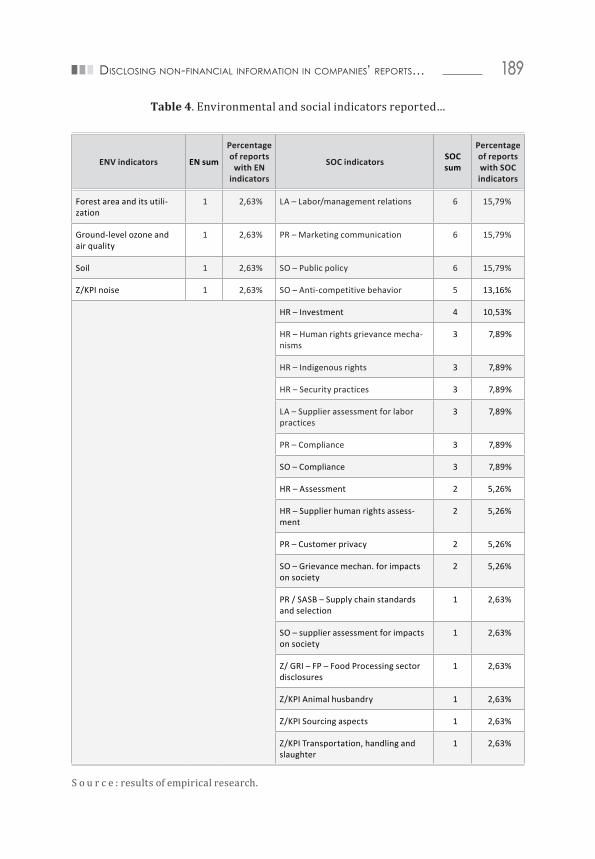
The goal of the research was to identify the presence of categories and sub-categories’ indicators (GRI, 2014a; GRI, 2014b) in the sustainability reports. An indicator found and disclosed in each of the sample’s reports was recorded and their frequency calculated (table 4). In this research the most frequent indica-tors in both environmental and social categories were analyzed from the as-pect of their attributes that were measured as lead / lag indicators, process / outcome indicators, absolute / relative indicators, and quantity / quality indi-cators. This approach to the sustainability indicators emerged from the fact that the root cause of numerous sustainability (reporting) frameworks are and spring form varieties of worldviews and / or ethical systems that result in in-

Milena Peršić, Lahorka Halmi188
consistency of classifying indicators even at the primary, category level (Her-riott, 2016, p. 99, 50, 203). Indicators presented in table 4 were disclosed in accordance with the GRI G4 guidelines and further analyzed, for they provide information on the status or (occurred) change concerning sustainability (i.e. an impact a company has on environment or society). Based on previous re-searches (Brockett, Rezaee, 2012, p. 255; Burns, 2000, p. 120; BusinessDic-tionary.com; Center for Instructional Technolgy; Cokins, 2009, p. 208; Epstein, Buhovac, 2014, pp. 123–130; GEMI, 1998, p. 3; Hair et al., 2009, p. 3; Herriott, 2016, p. 76, 81, 82, 99; Horvat, Mijoč, 2012, p. 22, 26; Kaplan, Norton, 1996, p. 32; Schaltegger, Bennett, Burritt, 2006, p. 91; Šošić, 2006, p. 7), and for the purposes of this research, attributes were grouped as (a) content-oriented at-tributes, or (b) entry-oriented attributes.
Table 4. Environmental and social indicators reported by Croatian companies
ENV indicators EN sum
Percentage of reports
with EN indicators
SOC indicators SOC sum
Percentage of reports with SOC indicators
Energy 24 63,16% LA – Occupational health and safety 19 50,00%
Emissions 21 55,26% LA – Training and education 18 47,37%
Waste (and effluents) 20 52,63% LA – Employment 17 44,74%
Water 18 47,37% PR – Product and service labeling 10 26,32%
Materials 15 39,47% HR – Non-discrimination 9 23,68%
Biodiversity 10 26,32% LA – Diversity and equal opportunity 9 23,68%
Compliance – EN 9 23,68% PR – Customer health and safety 9 23,68%
Products and services – EN
6 15,79% SO – Anti-corruption 9 23,68%
Transport 5 13,16% SO – Local communities 9 23,68%
Environmental grievance mechanisms
3 7,89% HR – Freedom of association and collective bargaining
7 18,42%
Overall environment pro-tection expenditure
3 7,89% HR – Child labor 6 15,79%
Air pollution (and GHG emissions)
2 5,26% HR – Forced or compulsory labor 6 15,79%
Supplier/vendor environ-mental assessment
2 5,26% LA – Equal remuneration for men and women
6 15,79%
Disclosing non-financial information in companies’ reports… 189
ENV indicators EN sum
Percentage of reports
with EN indicators
SOC indicators SOC sum
Percentage of reports with SOC indicators
Forest area and its utili-zation
1 2,63% LA – Labor/management relations 6 15,79%
Ground-level ozone and air quality
1 2,63% PR – Marketing communication 6 15,79%
Soil 1 2,63% SO – Public policy 6 15,79%
Z/KPI noise 1 2,63% SO – Anti-competitive behavior 5 13,16%
HR – Investment 4 10,53%
HR – Human rights grievance mecha-nisms
3 7,89%
HR – Indigenous rights 3 7,89%
HR – Security practices 3 7,89%
LA – Supplier assessment for labor practices
3 7,89%
PR – Compliance 3 7,89%
SO – Compliance 3 7,89%
HR – Assessment 2 5,26%
HR – Supplier human rights assess-ment
2 5,26%
PR – Customer privacy 2 5,26%
SO – Grievance mechan. for impacts on society
2 5,26%
PR / SASB – Supply chain standards and selection
1 2,63%
SO – supplier assessment for impacts on society
1 2,63%
Z/ GRI – FP – Food Processing sector disclosures
1 2,63%
Z/KPI Animal husbandry 1 2,63%
Z/KPI Sourcing aspects 1 2,63%
Z/KPI Transportation, handling and slaughter
1 2,63%
S o u r c e : results of empirical research.
Table 4. Environmental and social indicators reported…

Milena Peršić, Lahorka Halmi190
Through “content-oriented attributes” it was determined if the content of a disclosed indicator, was a future- or past-oriented (lead and lag indicators). Content-oriented measures are associated with the activity and recording of the process, or oriented towards presenting a final result. Leading measures are performance drivers (Kaplan, Norton, 1996, p. 32) and in-process measures (GEMI, 1998, p. 3), tailored to evaluate change during a period of time (Cokins, 2009, p. 208), and can be applied in measuring results of environmental prac-tices (Schaltegger et al., 2006, p. 3). These measures refer to the future and show what the performance was at the time prior to the measurement (Herri-ott, 2016, p. 76). Lagging measures present a mix of outcomes (Kaplan, Norton, 1996, p. 32), offer end-of-process measures (GEMI, 1998, p. 3), present results of implementation of practices and lead to improved performance (Schalteg-ger et al., 2006, p. 91). Lagging measures report after-the-fact information at the end of a time period (Cokins 2009, p. 100, 208), which means that these are past-oriented measures (Herriott, 2016, p. 76).
Process measures are sequences of independent and linked procedures, which at every stage, consume one or more resources in converting inputs into outputs (BusinessDictionary.com, l. process measure). Process measures are a systematic series of actions designed with a goal as the end-point (EPA, 2011). These measures show how the system operates (Center for Instructional Tech-nolgy), and refer to doing (Herriott, 2016, p. 99). In contrast to these measures, outcome measures refer to achieving (Herriott, 2016, p. 99) with determination and evaluation of the results of an activity, plan, process, or program and their comparison with the intended or projected results (BusinessDictionary.com, l. outcome measure) and are associated with final products or results (Center for Instructional Technolgy).
Through entry-oriented attributes it was determined whether indicators were qualitatively or quantitatively recorded, where quantitatively recorded in-dicators could be disclosed as an absolute or a relative measure.
Absolute measures use numerical variations (Hartman), report a total amount (e.g. pollutant emitted, water/materials used, etc.), and permit mean-ingful evaluation. These measures are employed in comparison between and within companies, but very often require a statement of the measure relative to the size and type of the company (Herriott, 2016, p. 81). Relative measures use statistical variations based on percentages to determine how far from real-ity a forecast is (Hartman), and are normalized in relationship to the business activity. Relative measures are normalized, i.e. are put in a correlation to the
Disclosing non-financial information in companies’ reports… 191
business activity, meaning that homogeneous products are normalized by total quantity of the products, whereas heterogeneous products are normalized by sales revenue and number of employees (Herriott, 2016, p. 82, 99).
Quantitative (or metric) measures identify or describe subjects (or objects) not only on the possession of an attribute, but also by the amount or degree to which the subject may be characterized by the attribute (Hair et al., 2009, p. 3). These measures are numerical (Herriott, 2016, p. 99) and are measured on an interval or ratio scale (Šošić, 2006, p. 7; Horvat, Mijoč, 2012, p. 22, 26; Burns, 2000, p. 120). On the other hand, qualitative (or nonmetric) measures are cat-egorical and ordinal-scales measures (Šošić, 2006, p. 7; Horvat, Mijoč, 2012, p. 23; Herriott, 2016, p. 99). In qualitative measures goals are often soft skill-oriented and are measured by a different kind of observation without using any statistics or metrics to pull from.
Research framework and methodology
Since Herriott (2016, p. 70) defined a measure as a specific way to quantify or evaluate an indicator, the goal was to measure the (quality of) indicators, pre-viously defined and elaborated as the content-oriented or entry-oriented attrib-utes. The assessment was done by awarding: ■ (1) one point for the identified attribute to each of the indicators in indi-
vidual sustainability reports, and ■ (0) zero points for not meeting the criteria.
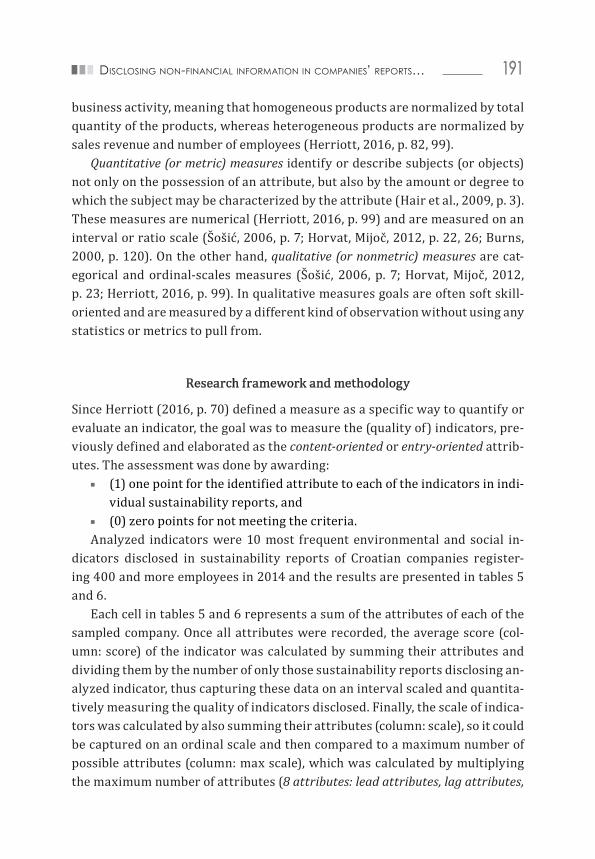
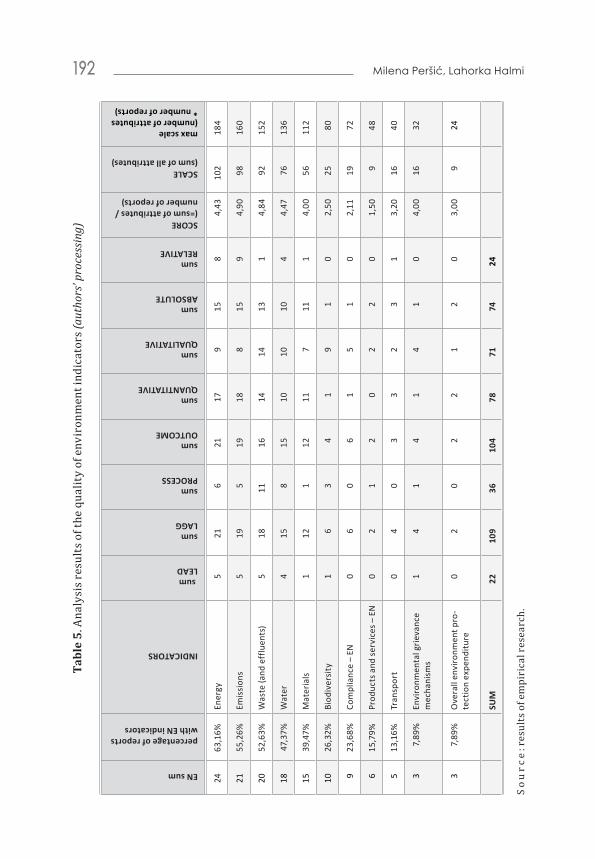
Analyzed indicators were 10 most frequent environmental and social in-dicators disclosed in sustainability reports of Croatian companies register-ing 400 and more employees in 2014 and the results are presented in tables 5 and 6.
Each cell in tables 5 and 6 represents a sum of the attributes of each of the sampled company. Once all attributes were recorded, the average score (col-umn: score) of the indicator was calculated by summing their attributes and dividing them by the number of only those sustainability reports disclosing an-alyzed indicator, thus capturing these data on an interval scaled and quantita-tively measuring the quality of indicators disclosed. Finally, the scale of indica-tors was calculated by also summing their attributes (column: scale), so it could be captured on an ordinal scale and then compared to a maximum number of possible attributes (column: max scale), which was calculated by multiplying the maximum number of attributes (8 attributes: lead attributes, lag attributes,
Milena Peršić, Lahorka Halmi192Ta
ble
5. A
naly
sis r
esul
ts o
f the
qua
lity
of e
nvir
onm
ent i
ndic
ator
s (au
thor
s’ pr
oces
sing
)EN sum
percentage of reports with EN indicators
INDICATORS
sum LEAD
sum LAGG
sum PROCESS
sum OUTCOME
sum QUANTITATIVE
sum QUALITATIVE
sum ABSOLUTE
sum RELATIVE
SCORE (=sum of attributes / number of reports)
SCALE (sum of all attributes)
max scale (number of attributes * number of reports)
2463
,16%
Ener
gy5
216
2117
915
84,
4310
218
4
2155
,26%
Emis
sion
s5
195
1918
815
94,
9098
160
2052
,63%
Was
te (a
nd e
fflu
ents
)5
1811
1614
1413
14,
8492
152
1847
,37%
Wat
er4
158
1510
1010
44,
4776
136
1539
,47%
Mat
eria
ls1
121
1211
711
14,
0056
112
1026
,32%
Biod
iver
sity
1
63
41
91
02,
5025
80
923
,68%
Com
plia
nce
– EN
06
06
15
10
2,11
1972
615
,79%
Prod
ucts
and
ser
vice
s – E
N0
21
20
22
01,
509
48
513
,16%
Tran
spor
t0
40
33
23
13,
2016
40
37,
89%
Envi
ronm
enta
l grie
vanc
e m
echa
nism
s1
41
41
41
04,
0016
32
37,
89%
Ove
rall
envi
ronm
ent p
ro-
tect
ion
expe
nditu
re
02
02
21
20
3,00
924
SUM
2210
936
104
7871
7424
So
urc
e: r
esul
ts o
f em
piri
cal r
esea
rch.
Disclosing non-financial information in companies’ reports… 193Ta
ble
6. A
naly
sis r
esul
ts o
f the
qua
lity
of so
cial
indi
cato
rs (a
utho
rs’ p
roce
ssin
g)SOC sum
percentage of reports with SOC indicators
INDICATORS
sum LEAD
sum LAGG
sum PROCESS
sum OUTCOME
sum QUANTITATIVE
sum QUALITATIVE
sum ABSOLUTE
sum RELATIVE
SCORE (=sum of attributes / number of reports)
SCALE (sum of all attributes)
max scale (number of attributes * number of reports)
1950
,00%
LA –
Occ
upat
iona
l hea
lth
and
safe
ty4
167
149
159
24,
2877
144
1847
,37%
LA –
Tra
inin
g an
d ed
u-ca
tion
514
911
816
92
3,89
7415
2
1744
,74%
LA –
Em
ploy
men
t2
141
1211
1212
14,
0665
128
1026
,32%
PR –
Pro
duct
and
ser
vice
la
belli
ng2
81
72
102
03,
2032
80
923
,68%
HR
– N
on-d
iscr
imin
atio
n4
74
65
73
04,
5036
64
923
,68%
LA –
Div
ersi
ty a
nd e
qual
op
port
unity
16
26
26
20
2,78
2572
923
,68%
PR –
Cus
tom
er h
ealth
and
sa
fety
210
96
1010
11
3,11
2872
923
,68%
SO –
Ant
i-cor
rupt
ion
35
42
08
20
2,67
2472
923
,68%
SO –
Loc
al c
omm
uniti
es1
22
11
21
05,
0010
16
718
,42%
HR
– Fr
eedo
m o
f ass
o-ci
atio
n an
d co
llect
ive
barg
aini
ng
05
33
07
00
2,57
1856
SUM
2487
4268
4893
416
So
urc
e: r
esul
ts o
f em
piri
cal r
esea
rch.

Milena Peršić, Lahorka Halmi194
process attributes, outcome attributes, absolute attributes, relative attributes, quantitative attributes, qualitative attributes) with the number of reports dis-closing analyzed indicator (dependent on the number of reports in which each of the indicators was identified).
Research results
When analyzing content-oriented attributes in the environment category, lag (109 out of total 131) and outcome (104 out of total 140) indicators seem to be prevalent, meaning that a significant number of the information disclosed in the analyzed sustainability reports is past- and outcome-oriented.
Figure 1. Scaling environmental indicators (authors’ processing)
Research results
When analyzing content-oriented attributes in the environment category, lag (109 out of
total 131) and outcome (104 out of total 140) indicators seem to be prevalent, meaning that a
significant number of the information disclosed in the analyzed sustainability reports is past-
and outcome-oriented.
Figure 1. Scaling environmental indicators (authors’ processing)
Source: results of empirical research.
Energy
Emissions
Waste (and effluents)
Water
Materials
Biodiversity
Compliance - EN
Products and services - EN
Transport
Environmental grievance mechanisms
Overall environment protection expenditure
102
98
92
76
56
25
19
9
16
16
9
184
160
152
136
112
80
72
48
40
32
24
SCALE(sum of all attributes)
max scale(number of attributes * number of reports)
S o u r c e : results of empirical research.

Disclosing non-financial information in companies’ reports… 195
Content-oriented attributes in social category, lag (87 out of 111) and out-come (68 out of total 110) indicators are also prevalent, also suggesting that in-dicators reporting on social issues are past- and outcome-oriented.
Figure 2. Scaling social indicators (authors’ processing)
Content-oriented attributes in social category, lag (87 out of 111) and outcome (68 out of
total 110) indicators are also prevalent, also suggesting that indicators reporting on social
issues are past- and outcome-oriented.
Figure 2. Scaling social indicators (authors’ processing)
Source: results of empirical research.
Substance of indicators
As to the entry-oriented attributes, environmental indicators indicated that quantitative
and qualitative indicators are almost equally present (quantitative: 78, qualitative: 71).
Quantitative indicators are mostly disclosed in absolute measures (74 out of total 98), as
opposed to relative measures (24 out of total 98), where a relative measure was an indicator
that was measured against certain business activity. Information provided only in a form of
proportion was treated as a qualitative indicator. In social category there are also more
LA - Occupational health and safety
LA - Training and education
LA - Employment
PR - Product and service labeling
HR - Non-discrimination
LA - Diversity and equal opportunity
PR - Customer health and safety
SO - Anti-corruption
SO - Local communities
HR - Freedom of association and collectivebargaining
77
74
65
32
36
25
28
24
10
18
144
152
128
80
64
72
72
72
16
56
SCALE(sum of all attributes)
max scale(number of attributes * number of reports)
S o u r c e : results of empirical research.
Substance of indicators
As to the entry-oriented attributes, environmental indicators indicated that quantitative and qualitative indicators are almost equally present (quantita-tive: 78, qualitative: 71). Quantitative indicators are mostly disclosed in abso-lute measures (74 out of total 98), as opposed to relative measures (24 out of to-tal 98), where a relative measure was an indicator that was measured against
Milena Peršić, Lahorka Halmi196
certain business activity. Information provided only in a form of proportion was treated as a qualitative indicator. In social category there are also more qualitative (93 out of total 141) than quantitative (48 out of total 141) indica-tors, as well as indicators expressed in absolute measures (41 out of total 47) as opposed to relative measures (6 out of total 47). Here too information provided only in a form of proportion was treated as a qualitative indicator.
Scaling and scoring reported indicators
Although individualized by the number of reports disclosing each indicator, both scale for environmental indicators and scale for social indicators show that very few indicators reflect the all of the attributes assessed in the research (Figure 1, figure 2) and that there is a need for finding ways to capture data in such a way that indicators (or aspects according to GRI) disclosed would contain all eight attributes. Since not all data can and should be quantified, it is expected that dif-ferent items (indicators according to GRI) would be recorded in such a way that the higher level of information (indicators according to this research; aspects according to GRI) would reflect all of the attributes assessed in this research.
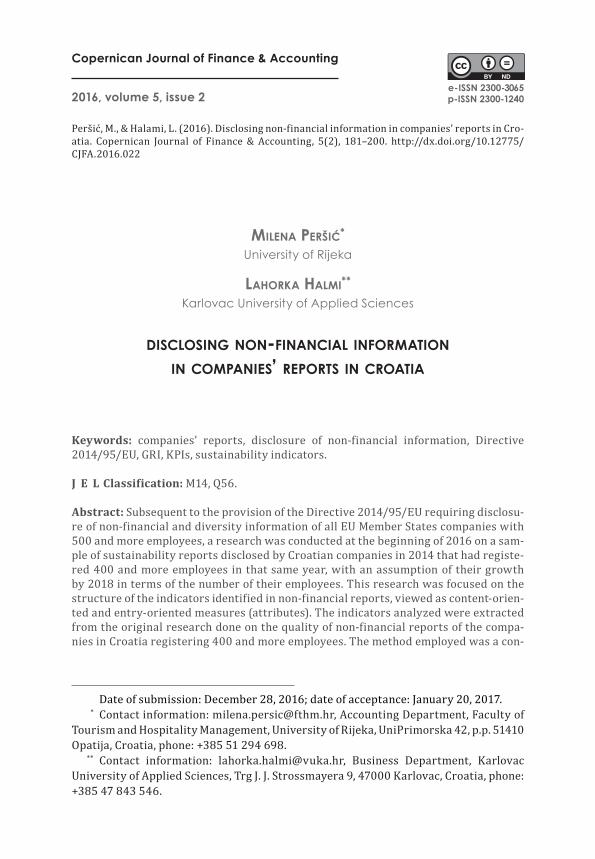
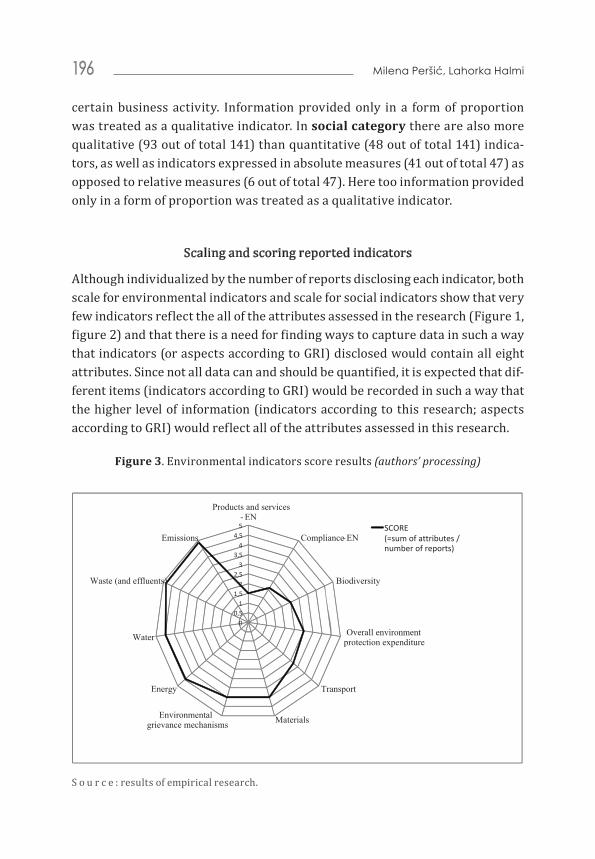
Figure 3. Environmental indicators score results (authors’ processing)
qualitative (93 out of total 141) than quantitative (48 out of total 141) indicators, as well as
indicators expressed in absolute measures (41 out of total 47) as opposed to relative measures
(6 out of total 47). Here too information provided only in a form of proportion was treated as
a qualitative indicator.
Scaling and scoring reported indicators
Although individualized by the number of reports disclosing each indicator, both scale for
environmental indicators and scale for social indicators show that very few indicators reflect
the all of the attributes assessed in the research (figure 1, figure 2) and that there is a need for
finding ways to capture data in such a way that indicators (or aspects according to GRI)
disclosed would contain all eight attributes. Since not all data can and should be quantified, it
is expected that different items (indicators according to GRI) would be recorded in such a way
that the higher level of information (indicators according to this research; aspects according to
GRI) would reflect all of the attributes assessed in this research.
Figure 3. Environmental indicators score results (authors’ processing)
Source: results of empirical research.
Environmental indicator with the highest score are items referring to the emissions
(4,90), whereas the indicators with the lowest scores were items referring to products and
00,5
11,5
22,5
33,5
44,5
5
Products and services- EN
Compliance -EN
Biodiversity
Overall environment protection expenditure
Transport
MaterialsEnvironmentalgrievance mechanisms
Energy
Water
Waste (and effluents)
EmissionsSCORE (=sum of attributes /number of reports)
S o u r c e : results of empirical research.
Disclosing non-financial information in companies’ reports… 197
Environmental indicator with the highest score are items referring to the emissions (4,90), whereas the indicators with the lowest scores were items re-ferring to products and services indicating their environmental impacts (1,50). Other indicators with high scores are waste and effluents (4,84), water (4,47), energy (4,43), environmental grievance mechanisms (4,00) and materials (4,00). Indicators with the lowest scores refer to transport (3,20), overall en-vironment protection expenditure (3,00), biodiversity (2,50), environmental compliance (in terms of monetary value of significant fines, number of non-monetary sanctions for non-compliance with environmental laws and regu-lations; 2,11), and products and services with environmental impacts (1,50). These results imply that environmental indicators recognized by social scienc-es as having an impact on an environment are not as sophisticated as indicators recognized and developed over the years by environmental sciences.
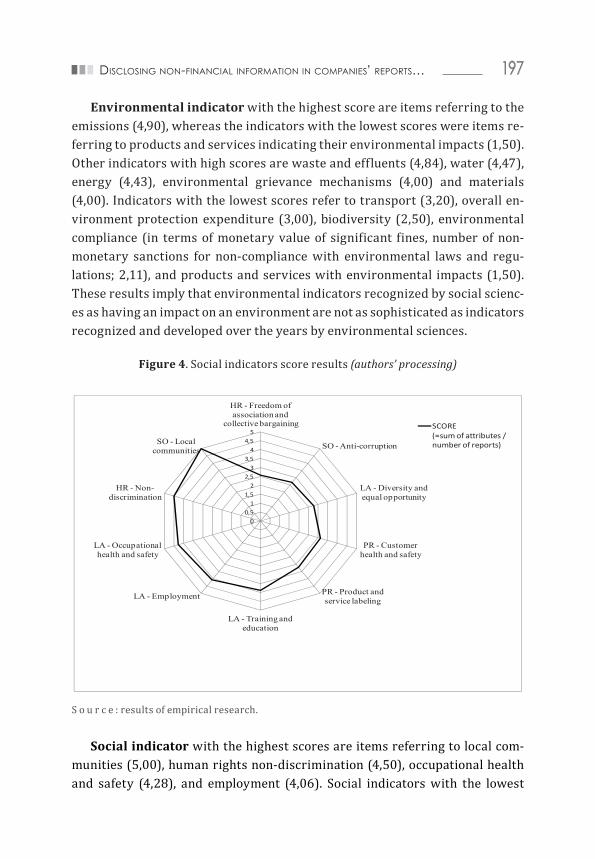
Figure 4. Social indicators score results (authors’ processing)
services indicating their environmental impacts (1,50). Other indicators with high scores are
waste and effluents (4,84), water (4,47), energy (4,43), environmental grievance mechanisms
(4,00) and materials (4,00). Indicators with the lowest scores refer to transport (3,20), overall
environment protection expenditure (3,00), biodiversity (2,50), environmental compliance (in
terms of monetary value of significant fines, number of non-monetary sanctions for non-
compliance with environmental laws and regulations; 2,11), and products and services with
environmental impacts (1,50). These results imply that environmental indicators recognized
by social sciences as having an impact on an environment are not as sophisticated as
indicators recognized and developed over the years by environmental sciences.
Figure 4. Social indicators score results (authors’ processing)
Source: results of empirical research.
Social indicator with the highest scores are items referring to local communities (5,00),
human rights non-discrimination (4,50), occupational health and safety (4,28), and
employment (4,06). Social indicators with the lowest scores are indicators referring to human
resources freedom of association and collective bargaining (2,57), social anti-corruption
(2,67), and labor diversity and equal opportunity (2,78). As already mentioned (Herriott,
00,5
11,5
22,5
33,5
44,5
5
HR - Freedom of association and
collective bargaining
SO - Anti-corruption
LA - Diversity and equal opportunity
PR - Customer health and safety
PR - Product and service labeling
LA - Training and education
LA - Employment
LA - Occupational health and safety
HR - Non-discrimination
SO - Local communities
SCORE (=sum of attributes / number of reports)
S o u r c e : results of empirical research.
Social indicator with the highest scores are items referring to local com-munities (5,00), human rights non-discrimination (4,50), occupational health and safety (4,28), and employment (4,06). Social indicators with the lowest
Milena Peršić, Lahorka Halmi198
scores are indicators referring to human resources freedom of association and collective bargaining (2,57), social anti-corruption (2,67), and labor diversity and equal opportunity (2,78). As already mentioned (Herriott, 2016, p. 52), sus-tainability standards and indicators found therein reflect certain values and worldviews, which is particularly noticeable in social category.
Conclusion, limitations and further research
The research results show that many of the indicators disclosed are mere “sto-ry-tellers”, meaning that those indicators are mostly past-oriented and quali-tatively stated, leaving the stakeholder (for whom these non-financial reports are made in the first place), in wonderment if the information presented is true and reliable.
In this research indicators were captured on ordinal and interval scales, each scale appertaining to its individual category and are not comparable.
Due to the diversity of and voluntary approaches to the form of reporting on sustainability issues, the number of indicators analyzed for their quantitative attributes do not necessarily reflect the sum of absolute and relative attrib-utes, for the focus of the research was to simply identify any of the indicators (aspects according to GRI) and how they were measured and reported. For that reason, authors suggest that the future researches first identify and segregate items as termed in this research (or indicators according to GRI) as qualitative and quantitative, and then those quantitative items analyze as absolute or rela-tive items (indicators according to GRI).
The criterion for the research was a mere mention of an indicator in the re-port regardless of the items reported therein and not the extent of the infor-mation presented, meaning that not specific items of an indicator were indi-vidually analyzed. For further research it is suggested to first, group presented information into indicators; second, to determine which items are to form an indicator and then; third, to analyze individual items of indicators. This will form a plateau for improving the quality of non-financial information in a way that it will make clearer what items should form an indicator, both in an envi-ronmental and social category, as well as point to the means that will enable comparability of non-financial reports.
Some of the frameworks used for creating sustainability reports require certain items to be disclosed as a proportion, which was recognized as qualita-tive data in this research. Therefore, one of the suggestions for future research
Disclosing non-financial information in companies’ reports… 199
as to classifying indicators within a primary category would be to consider seg-regating quantitative indicators from qualitative indicators.
Another suggestion for further research would be developing an assess-ment matrix where items according to this research (or indicators according to GRI G4) will be analyzed according to these attributes, thus providing a more comprehensive study on the structure of the indicators disclosed in the sus-tainability reports.
Since very few indicators reflect all of the attributes assessed in this re-search, there is a need for finding ways to capture relevant data in accounting of enterprises so as to establish prerequisites for comparability of non-finan-cial information disclosed in sustainability reports. Apparently there is also a need for significant improvement in defining a minimum of requirements for the disclosed non-financial information in the sustainability reports, in order to comply with the requirements of the Directive 2014/95/EU.
References Burns, R. B. (2000.) Introduction to research methods. London, UK: SAGE Publications.Brockett, A., & Rezaee, Z. (Ed.) (2012). Corporate Sustainability: Integrating Perfor-
mance and Reporting. Google Books. Hoboken, New Jersey: John Wiley & Sons, Inc., https://books.google.hr/books?id=mnEE0XQrWKUC&printsec=frontcover&source=gbs_ge_summary_r&cad=0#v=onepage&q&f=false. doi: http://dx.doi.org/10.1002/9781119202899 (accessed: 22. 07. 2016).
BusinessDictionary.com. BusinessDictionary.com – Online Business Dictionary, http://www.businessdictionary.com/ (accessed: 16.10.2015).
Center for Instructional Technolgy. What is Quality Improvement? http://patient-safetyed.duhs.duke.edu/module_a/measurement/measurement.html (accessed: 28.11.2016).
Choi, F.D.S. (2003). International Finance and Accounting Handbook. John Wiley & Sons, htt-ps://books.google.com/books?id=5z2pGMGE8mYC&pgis=1 (accessed: 16.10.2015).
Cokins, G. (2009). Performance management. Integrating Strategy Execution, Method-ologies, Risk and Analytics. New Jersey: John Wiley&Sons, Inc.
Croatian Chamber of Economy. Croatian Company Directory, http://www1.biznet.hr/HgkWeb/do/language?lang=en_GB (accessed: 10. 12. 2015).
EC. (2013). Directive 2013/34/EU amending Directive 2006/43/EC and repealing Coun-cil Directives 78/660/EEC and 83/349/EEC on the annual financial statements, con-solidated financial statements and related reports of certain types of undertakings. Official Journal of the European Union, 2013(June), L 182/19-75.
EC. Directive 2014/95/EU, Official Journal of the European Union 1–9 (2014). http://eur-lex.europa.eu/legal-content/EN/TXT/PDF/?uri=CELEX:32014L0095&from=
HR (accessed: 28.12.2016).
Milena Peršić, Lahorka Halmi200
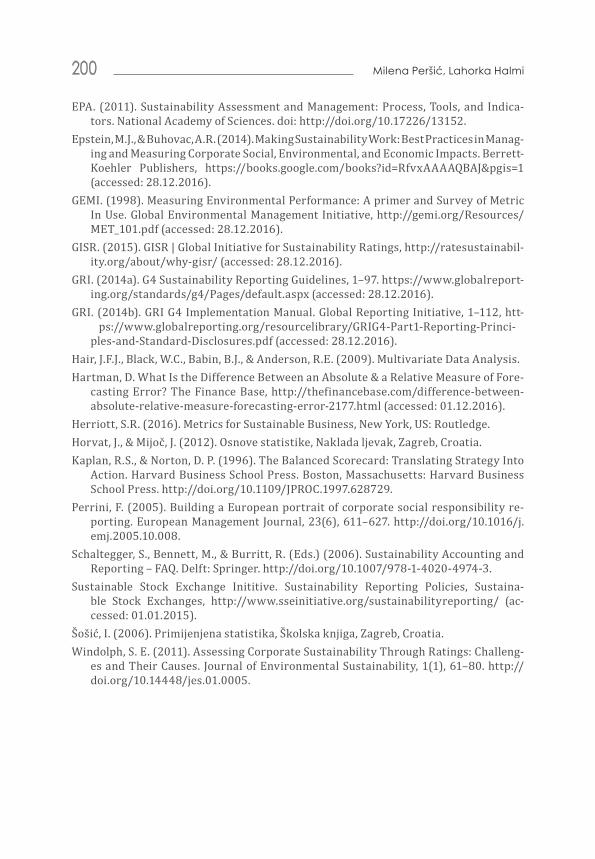
EPA. (2011). Sustainability Assessment and Management: Process, Tools, and Indica-tors. National Academy of Sciences. doi: http://doi.org/10.17226/13152.
Epstein, M.J., & Buhovac, A.R. (2014). Making Sustainability Work: Best Practices in Manag-ing and Measuring Corporate Social, Environmental, and Economic Impacts. Berrett-Koehler Publishers, https://books.google.com/books?id=RfvxAAAAQBAJ&pgis=1 (accessed: 28.12.2016).
GEMI. (1998). Measuring Environmental Performance: A primer and Survey of Metric In Use. Global Environmental Management Initiative, http://gemi.org/Resources/MET_101.pdf (accessed: 28.12.2016).
GISR. (2015). GISR | Global Initiative for Sustainability Ratings, http://ratesustainabil-ity.org/about/why-gisr/ (accessed: 28.12.2016).
GRI. (2014a). G4 Sustainability Reporting Guidelines, 1–97. https://www.globalreport-ing.org/standards/g4/Pages/default.aspx (accessed: 28.12.2016).
GRI. (2014b). GRI G4 Implementation Manual. Global Reporting Initiative, 1–112, htt-ps://www.globalreporting.org/resourcelibrary/GRIG4-Part1-Reporting-Princi-
ples-and-Standard-Disclosures.pdf (accessed: 28.12.2016).Hair, J.F.J., Black, W.C., Babin, B.J., & Anderson, R.E. (2009). Multivariate Data Analysis.Hartman, D. What Is the Difference Between an Absolute & a Relative Measure of Fore-
casting Error? The Finance Base, http://thefinancebase.com/difference-between-absolute-relative-measure-forecasting-error-2177.html (accessed: 01.12.2016).
Herriott, S.R. (2016). Metrics for Sustainable Business, New York, US: Routledge.Horvat, J., & Mijoč, J. (2012). Osnove statistike, Naklada ljevak, Zagreb, Croatia.Kaplan, R.S., & Norton, D. P. (1996). The Balanced Scorecard: Translating Strategy Into
Action. Harvard Business School Press. Boston, Massachusetts: Harvard Business School Press. http://doi.org/10.1109/JPROC.1997.628729.
Perrini, F. (2005). Building a European portrait of corporate social responsibility re-porting. European Management Journal, 23(6), 611–627. http://doi.org/10.1016/j.emj.2005.10.008.
Schaltegger, S., Bennett, M., & Burritt, R. (Eds.) (2006). Sustainability Accounting and Reporting – FAQ. Delft: Springer. http://doi.org/10.1007/978-1-4020-4974-3.
Sustainable Stock Exchange Inititive. Sustainability Reporting Policies, Sustaina-ble Stock Exchanges, http://www.sseinitiative.org/sustainabilityreporting/ (ac-cessed: 01.01.2015).
Šošić, I. (2006). Primijenjena statistika, Školska knjiga, Zagreb, Croatia. Windolph, S. E. (2011). Assessing Corporate Sustainability Through Ratings: Challeng-
es and Their Causes. Journal of Environmental Sustainability, 1(1), 61–80. http://doi.org/10.14448/jes.01.0005.


![[Sve djelatnosti] · Centar za plesnu i izvedbenu umjetnost, Plesni studio FREE DANCE Karlovac, Karlovac 5 Chorus Carolostadien Karlovac, Karlovac 5 Davor Kristić 5 ... Sakristijski](https://img.pdfslide.net/doc/110x75/5e3b7da9b38e535c0b3cce7b/sve-djelatnosti-centar-za-plesnu-i-izvedbenu-umjetnost-plesni-studio-free-dance.jpg)