Embed Size (px)
Citation preview

Prepared by Emily M. Seger, W.G. Gawley, R.M. Breen January 2006 ANP Natural Resource Report 2006-02
Acadia National Park
Lake Monitoring Report 2002-2005

1
Acadia National Park Lake Monitoring Report: 2002 to 2005 Emily M. Seger, W.G. Gawley, and R.M. Breen.
Acadia National Park Natural Resource Report 2006-02. ABSTRACT
This report outlines the goals, objectives, and methods of the Acadia National Park lake monitoring program, and summarizes the data collected in the 2002 through 2005 seasons. Field measurements and water samples were taken monthly at ten park lakes from May through October each year, providing data for a variety of water quality parameters that can serve as indicators for the effects of atmospheric deposition, cultural eutrophication, and climate change.
The monitoring data indicates that the lakes recovered from the effects of the 2001 drought in 2002. Secchi transparency and lake water levels followed the precipitation trends of the seasons. Dissolved oxygen, pH, acid neutralizing capacity, and nutrients all generally appeared to be relatively stable with concentrations generally within the historical range of variability for these lakes.
Although no statistical analyses were performed in this report to determine long-term data trends, a primary recommendation is that such an analysis be conducted to enhance the understanding of the current condition of the park's aquatic resources.
INTRODUCTION
Freshwater resources at Acadia National Park (ANP) include 24 named lakes (Figure 1), 34 named streams, and numerous wetlands within or adjacent to the park boundary. The current lake monitoring program has largely evolved from recommendations of a 1997 workshop designed to develop long-term monitoring strategies for ANP freshwater resources, and guidance outlined in the Acadia National Park Water Resources Management Plan (WRMP) (Kahl et al., 2000). Specific monitoring protocols have been selected to provide the information needed to detect changes in aquatic ecosystem structure and function caused by natural processes and human-induced factors. Lake monitoring forms the ‘core’ of the long-term freshwater monitoring program at ANP, and is a cooperative effort involving park staff, the US Geological Survey (USGS), University of Maine, Maine Department of Environmental Protection (MDEP), volunteers and others.
A representative subset of all park lakes, sampled monthly from May through October, makes up the foundation of the monitoring program. These 10 lakes range in size from 1 acre to 897 acres, with maximum depths from less than 3 meters to more than 45 meters (Table 1). All water monitoring data are incorporated into a comprehensive ANP database that includes recent as well as historical water quality data for park waters.
The major water related concerns that could affect ANP resources include atmospheric deposition, toxic contaminants within the watershed, input of nitrogen and other nutrients, and climate change. In addition to the lake monitoring program, park staff monitor benthic stream macroinvertebrates and bacteria at ANP swim beaches. There are also a number of water related research studies currently being conducted at the park that will help to better define water quality and watershed processes and function at ANP.

2
Figure 1: Acadia National Park Lake Monitoring Locations

3
MONITORING OBJECTIVES
The primary objective of the ANP lake monitoring program is to detect changes in aquatic ecosystem structure and function; and determine if, and to what degree, human-induced factors are contributing to these changes. In order to measure human-induced changes it is necessary to determine the normal variability inherent in natural aquatic systems, and to establish baseline conditions from which future changes can be detected.
Specific objectives of the lake monitoring program are:
1) characterize existing water quality conditions and establish a baseline for future comparisons;
2) to serve as an early warning system for anthropogenic effects such as non-point source pollution (cultural eutrophication), climate change, and atmospheric deposition of acidic and toxic contaminants, nitrogen, and other nutrients;
3) assist in identifying potential sources of pollution;
4) provide water quality data and information needed to manage and protect other ANP resources;
5) track long and short-term trends.
As described previously, the process of designing a long-term monitoring program for freshwater resources was initiated at a workshop held in January of 1997 at ANP. Participants with diverse and multidisciplinary backgrounds represented a variety of state, federal agencies and academia at the workshop. The workshop concluded that the primary threats to ANP water resources are impacts associated with atmospheric deposition and nutrient enrichment (cultural eutrophication). Expanding and enhancing the existing ANP lake monitoring program was recommended as being a strategy to provide a broad foundation upon which additional water related monitoring and research can be supported.
METHODS
An Interim Report was prepared describing the 1997 workshop accomplishments, suggested monitoring priorities, and research and inventory needs (Kahl and Manski, 1997). Current monitoring protocols have been adopted based on recommendations in the Interim Report and guidelines identified in the WRMP. There has been no evaluation of monitoring protocols and their effectiveness in addressing set objectives since the program’s inception in 1997.
Because of funding and staff limitations, annual comprehensive monitoring of all ANP lakes, streams and other surface waters is not realistic. However, lakes to a large extent reflect the hydrogeochemical processes that occur within their respective watersheds. Therefore, the current freshwater monitoring program focuses on a subset of park lakes that provide a range of geophysical and ecological conditions, and allows for a preliminary assessment of changes and impacts associated with human related activity.

4
Sampling locations
The core monitoring design identifies three subsets of lakes to sample (Table 1.). The first, is a set of five lakes (Jordan Pond, Bubble Pond, Sargent Mountain Pond, The Bowl, and Witch Hole Pond) that are sampled to determine response to acidification and changes in atmospheric deposition. These lakes were selected to be representative of: a) the main large/deep water lakes on Mount Desert Island that are most associated with ANP (Jordan and Bubble ponds); b) smaller headwater and/or high elevation lakes most likely to show chronic acidification trends (Sargent, The Bowl); and c) an organically affected lake, as it is adjacent to wetlands (Witch Hole).
The second subset includes five lakes sampled for indicators of nutrient enrichment (Witch Hole Pond, Upper Hadlock, Seal Cove, Echo Lake, and Jordan Pond). These lakes were selected to be representative of the broad range of ANP lakes vulnerable to cultural eutrophication primarily from surrounding residential development. These lakes were also selected based on a variety of physical and environmental factors (e.g. size/depth, morphology, trophic state, watershed/ ecosystem type, amount of watershed development, burned/unburned in a major fire in 1947, amount/type of recreational and other human use). Jordan Pond was included on both lists because it is considered the "jewel of Acadia waters” and perhaps the entire state.
A third group of lakes that are sampled as part of the core lake monitoring program are lakes with existing long-term monitoring records (Secchi transparency, some chemical/physical parameters) and are not included in the first two lake sets. These lakes, Eagle Lake, Long Pond (MDI) and Bubble Pond (also included in the set of acidification lakes) are sampled a minimum of once monthly May through October for temperature and Secchi, pH, ANC, and dissolved oxygen/temperature profile.
Table 1: Lakes monitored by ANP from 1996-2004
Lake
Area
(acres)
Max.
Depth (m)
Wshed (acres)1
Flush rate/yr.2
Trophic state
ANP Bndry
Fishery type
Water supply
Monitoring Regime
The Bowl
6
8.8
59 1.3 Mesotrophic within ---
No Acidification
Bubble Pond
32
11.9
463 1.88 Oligotrophic within Cold
Yes Acid./ LT Eutr.
Eagle Lake
437
33.6
1850 0.26 Oligotrophic within Cold
Yes LT Eutrophica.
Echo Lake
237
20.1
1782 0.61 Oligotrophic borders Cold
No Eutrophication
Jordan Pond
187
45.7
1217 0.17 Oligotrophic within Cold
Yes Acid./ Eutroph.
Long Pond
897
34.5
3410 0.32 Oligotrophic borders c/w
Yes LT Eutrophica.
Sargent Mtn
1
3.0
8 --- Mesotrophic within ---
No Acidification
Seal Cove Pond
283
13.4
1778 1.92 Mesotrophic borders Warm
No Eutrophication
Upper Hadlock
35
10.7
878 4.12 Mesotrophic within Cold
Yes Eutrophication
Witch Hole
28
9.5
260 1.2 Mesotrophic within Cold
No Acid./ Eutroph.

5
Sample collection and analysis
The analytes selected for the acidification and eutrophication sampling regimes (Table 2.), and the annual monitoring schedule (Table 3.), are essentially unchanged since 1997 and follow closely the recommendations of the workshop. Acidification parameters are analyzed at the University of Maine (UMO) lab on samples taken in April and October during spring and fall turnover. Eutrophication parameters are analyzed at the UMO lab on samples taken in June and August, to represent the spectrum of productivity developing through summer season. Two additional measurements have been added to the eutrophication sampling regime: water column light extinction/attenuation using a LI-COR radiation sensor (scaled back to 1 profile/lake during the 2005 season), and weekly lake surface level (stage) monitoring during the open water season spring through fall.
The lake sampling regime entails collecting half-meter deep grab samples from the deep hole (or center, in the case of lakes with uniform depth) of the lake for acidification chemistry, based on the assumption that early spring and late fall water columns are relatively homogeneous. For eutrophication chemistry, an epilimnion core sample (4-10 meter depth) is collected at the deep hole if the lake is stratified, or a half-meter grab sample if unstratified. For lakes with poor accessibility by boat, a throw bottle was used in fall 2003 and spring/fall 2004 and 2005 to collect epilimnion grab samples. The throw bottle took samples at a depth of 0.6 meters, at a distance of about 9 meters from shore.
Table 2. Analytes for eutrophication and acidification sampling
Eutrophication Acidification Field temperature X X Secchi transparency X X pH, closed cell X X pH, equilibrated X ANC X Specific conductance X X True color X X DOC X X DIC X Ca, Mg, K, Na X NH4, Si X SO4, Cl, NO3 X Al (total dissolved) X Total P X Total N X X Chlorophyll a X Lake Stage X X DO/Temp. Profile X X

6
Table 3. Lake Monitoring Scheduleearly May June July August September October
Jordan Pond DO XXXXXX XXXXXX XXXXXX XXXXXX XXXXXX XXXXXXTemp/Secchi XXXXXX XXXXXX XXXXXX XXXXXX XXXXXX XXXXXXlight profile XXXXXX XXXXXX XXXXXX XXXXXX XXXXXX XXXXXXeutroph. analytes XXXXXX XXXXXXacidif. analytes XXXXXX XXXXXXlake stage XXXXXX XXXXXX XXXXXX XXXXXX XXXXXX XXXXXX
Bubble Pond DO XXXXXXTemp/Secchi XXXXXX XXXXXX XXXXXXlight profile XXXXXXeutroph. analytesacidif. analytes XXXXXX XXXXXXlake stage XXXXXX XXXXXX XXXXXX XXXXXX XXXXXX XXXXXX
Sargent Mt. Pond DOTemp/Secchi XXXXXX XXXXXXeutroph. analytesacidif. analytes XXXXXX XXXXXX
The Bowl DOTemp/Secchi XXXXXX XXXXXXeutroph. analytesacidif. analytes XXXXXX XXXXXX
Witch Hole Pond DO XXXXXX XXXXXX XXXXXX XXXXXX XXXXXX XXXXXXTemp/Secchi XXXXXX XXXXXX XXXXXX XXXXXX XXXXXX XXXXXXlight profile XXXXXX XXXXXX XXXXXX XXXXXX XXXXXX XXXXXXeutroph. analytes XXXXXX XXXXXXacidif. analytes XXXXXX XXXXXXlake stage XXXXXX XXXXXX XXXXXX XXXXXX XXXXXX XXXXXX
Upper Hadlock DO XXXXXX XXXXXX XXXXXX XXXXXX XXXXXX XXXXXXTemp/Secchi XXXXXX XXXXXX XXXXXX XXXXXX XXXXXX XXXXXXlight profile XXXXXX XXXXXX XXXXXX XXXXXX XXXXXX XXXXXXeutroph. analytes XXXXXX XXXXXXacidif. analyteslake stage XXXXXX XXXXXX XXXXXX XXXXXX XXXXXX XXXXXX
Seal Cove Pond DO XXXXXX XXXXXX XXXXXX XXXXXX XXXXXX XXXXXXTemp/Secchi XXXXXX XXXXXX XXXXXX XXXXXX XXXXXX XXXXXXlight profile XXXXXX XXXXXX XXXXXX XXXXXX XXXXXX XXXXXXeutroph. analytes XXXXXX XXXXXXacidif. analyteslake stage XXXXXX XXXXXX XXXXXX XXXXXX XXXXXX XXXXXX
Echo Lake DO XXXXXX XXXXXX XXXXXX XXXXXX XXXXXX XXXXXXTemp/Secchi XXXXXX XXXXXX XXXXXX XXXXXX XXXXXX XXXXXXlight profile XXXXXX XXXXXX XXXXXX XXXXXX XXXXXX XXXXXXeutroph. analytes XXXXXX XXXXXXacidif. analyteslake stage XXXXXX XXXXXX XXXXXX XXXXXX XXXXXX XXXXXX
Long Pond DO XXXXXXTemp/Secchi XXXXXX XXXXXX XXXXXX XXXXXX XXXXXX XXXXXXlight profile XXXXXXeutroph. analytesacidif. analytes
Eagle Lake DO XXXXXXTemp/Secchi XXXXXX XXXXXX XXXXXX XXXXXX XXXXXX XXXXXXlight profile XXXXXXeutroph. analytesacidif. analyteslake stage XXXXXX XXXXXX XXXXXX XXXXXX XXXXXX XXXXXX

7
Specific methods used for field measurements, sample collection techniques, and QA/QC procedures are described in the Acadia National Park Lake Monitoring Field and Laboratory Methods (Gawley, 1996). Secchi disk transparency, weather conditions; dissolved oxygen (DO), temperature, and light penetration profiles, and lake stage were measured in the field. A YSI 52 meter was used to measure DO and temperature, and LI-COR spherical PAR and deck cells measured light penetration. Light attenuation coefficients were calculated using methods developed for the NPS North Atlantic Coastal Parks (Kopp and Neckles, 2004). Lake stage was measured from a drilled hole ("tape down point") in a large rock in each pond using a wooden leveling stick and folding ruler.
Laboratory analysis for acidification and eutrophication parameters was conducted by the Environmental Chemistry Lab at the University of Maine in from 1996 to 2003. Beginning in 2004, samples were analyzed at the George Mitchell Center for Environmental and Watershed Research Laboratory at the University of Maine. Chemical analysis (summarized in Table 4) and QA/QC procedures followed by the two EPA-certified University of Maine labs were similar in methods and protocol. Independent audits performed by Environment Canada in 2004 between the two UMO labs indicated data were consistent and not compromised for long-term analysis. The GMC continues to participate in both EPA and Environment Canada audits to ensure data quality.
A recommendation of the 1997 workshop was for ANP staff to also perform analysis on closed cell pH, conductivity, ANC, and color at the park laboratory. Procedures for ANP chemistry and QC criteria are described in Gawley (1996) and Seger (2005). The workshop additionally recommended conducting an interlab comparison between the park lab and the University of Maine lab for these analytes. This comparison would provide an opportunity for park staff to evaluate the in-house capability to perform these standardized analyses.
For data up to 2001, casual comparisons suggested there was good agreement in most instances between the UMO and ANP labs, though a comprehensive statistical evaluation was not done. Monthly chemical analysis of these four analytes has continued at the ANP lab to maintain the dataset. In a more in-depth report (Seger, 2005), preliminary interlab comparisons were again performed on 2002 to 2004 data using percent difference calculations. For consistency, and because agreement between the ANP lab and the EPA-certified UMO lab was not always within acceptable range, only UMO data are used for graphical analysis of chemical parameters in this report. Graphs and descriptive statistics were produced with Microsoft Excel 2003 software.

8
Table 4. Analytical Methods for the University of Maine Laboratory.
____________________________________________________________________________________ Analyte Method Reference
pH, closed cell Electrode Hillman et al.6, EPA 19.05
pH, aerated Electrode Hillman et al.6, EPA 5.05
Specific conductance Wheatstone bridge EPA 120.12,EPA 23.05
True color Spectrophotometer, 457.5 nm EPA 110.22
ANC Gran Titration Hillman et al.6, EPA 5.05
Anions: Cl, NO3, SO4 Ion chromatography EPA 300.01
Pre 1999 analysis methods for Ca, Mg, Na, K, and Al
Calcium AAS with N20-acetylene flame EPA 215.12
Magnesium AAS with N20-acetylene flame EPA 242.12
Sodium AAS with air-acetylene flame EPA 258.12
Potassium AAS with air-acetylene flame EPA 273.12
Aluminum (total) AAS with graphite furnace EPA 200.91
1999 to 2003 methods for Ca, Mg, Na, K, and Al
Calcium Inductively Coupled Atomic Emission Spectroscopy (ICP) EPA 200.1510
Magnesium Inductively Coupled Atomic Emission Spectroscopy (ICP) EPA 200.1510
Sodium Inductively Coupled Atomic Emission Spectroscopy (ICP) EPA 200.1510
Potassium Inductively Coupled Atomic Emission Spectroscopy (ICP) EPA 200.1510
Aluminum (total) Inductively Coupled Atomic Emission Spectroscopy (ICP) EPA 200.1510
2003 to present methods for Ca, Mg, Na, K, NH4
Calcium Ion Chromatography (IC) ASTM D 6919-0311
Magnesium Ion Chromatography (IC) ASTM D 6919-0311
Sodium Ion Chromatography (IC) ASTM D 6919-0311
Potassium Ion Chromatography (IC) ASTM D 6919-0311
Ammonium Ion Chromatography (IC) ASTM D 6919-0311
2003 to present methods for Al
Aluminum (total) AAS with graphite furnace EPA 200.91
Dissolved Organic Carbon IR C analyzer, persulfate oxidation EPA 415.12

9
Table 4. (cont'd) Analytical Methods for the University of Maine Laboratory. ____________________________________________________________________________________ Analyte Method Reference Ammonium (prior to 2003) Autoanalyzer EPA 9.05 and
Bran & Luebbe 780-86T7
Silica Autoanalyzer EPA 22.05 and Bran & Luebbe 785-86T7 Total P Persulfate Digestion/Ascorbic Method 4500-P-B-53 Acid Method Method 4500-P-E 3 ______________________________________________________________________________________ AAS=atomic absorption spectrophotometry IR=Infrared Spectrophotometry CVAFS=cold vapor atomic fluorescence spectrometry Method references: 1. Methods for the Determination of Inorganic Substances in Environmental Samples, EPA 600/R-93-100, 1993. 2. Methods for Chemical Analysis of Water and Wastes, EPA 600/4-79-020, 1979, Revised 1983. 3. Standard Methods for Examination of Water and Wastewater, 20th ed. 1998. 4. Methods for the Determination of Metals in Environmental Samples, EPA 600/4-91/010, 1991, Supplement 1,
EPA 600/R-94/111, 1994. 5. Handbook of Methods for Acid Deposition Studies: Laboratory Analysis For Surface Water Chemistry, EPA
600/4-87-026, 1987. 6. Hillman,D.C., J. Potter, and S. Simon, 1986. Analytical methods for the National Surface Water Survey, Eastern
Lake Survey. EPA/600/4-86/009, EPA Las Vegas. 7. Bran & Luebbe Manual 8. Mercury in Water by Oxidation, Purge and Trap, and Cold Vapor Atomic Fluorescence Spectrometry, EPA 821-R-
99-005, 1999 9. Methyl Mercury in Water by Distillation, Aqueous Ethylation, Purge and Trap, and Cold Vapor Atomic Fluorescence Spectrometry, EPA Draft, 1998 10 EPA 200.15, Determination of Metals and Trace Elements in Water by Ultrasonic Nebulization Inductively Coupled Plasma-Atomic Emission Spectrometry. Rev. 1.2, 1994.
11 ASTM D 6919-03 Standard Test Method for Determination of Dissolved Alkali and Alkaline Earth Cations and Ammonium in Water and Wastewater by Ion Chromatography. Annual Book of ASTM Standards, Vol 11.01, 2003.

10
RESULTS AND DISCUSSION
General
Data from the ANP and UMO labs from 2002 to 2005 are included in tabular form in Appendix A. The lakes sampled in the ANP monitoring program have been selected to be representative of the broad range of hydrogeochemical and morphological conditions at the park. The core monitoring lakes range in size from 1 to 897 acres in surface area, and from 3 meters to 45 meters in depth. Although park lakes are poorly buffered, most are circumneutral in pH with trophic levels ranging from oligotrophic to eutrophic (most are mesotrophic), and acid neutralizing capacity (ANC) among the lowest in Maine. In general, the data indicate concentrations for most water quality parameters were within their historical range and continued to meet park water quality objectives.
Precipitation Trends
Statewide, 2001 to 2002 was the worst drought period in over thirty years (Lombard, 2003) and this is reflected in precipitation patterns at Acadia National Park as well. By late spring 2002 surface water levels returned to normal due to increased precipitation; however, groundwater levels statewide remained low throughout 2002 as there is a lag in response to climatic shifts in groundwater levels (Stewart et. al, 2003). Mean precipitation measured at the McFarland Hill National Atmospheric Deposition Program (NADP) site at Acadia National Park headquarters for the period 1982-2005 was 54.51 inches. Annual precipitation trends for this period are shown in Figure 1. For the Acadia area, 2002 to 2004 annual precipitation consecutively decreased over the three years from above normal conditions to a drier period (though 2004 was not nearly as dry as 2001). In 2005 annual precipitation reached the highest level since the NADP began monitoring at Acadia National Park (Figure 2).
Precipitation is one factor that has had relatively large seasonal fluctuations over the years. For example, above normal annual precipitation and temperature conditions occurred in 2002, near normal in 2003, then below normal in 2004 (though temperatures were average), then increasing again in 2005. Seasonal changes however were different between the years. Winter temperatures, snow levels, spring rainfall, and annual precipitation were less in 2004 than the previous two years, but 2004 had a wetter/cooler summer and a drier fall than 2002 and 2003 (Figure 3). In 2005 precipitation was the highest it had been in over 24 years, but most accumulation occurred in winter, spring, and fall. The 2005 summer was similar in mean rainfall and temperatures to 2002 and 2003. Mean summer (June-August) precipitation volumes were 3.15, 3.69, 4.60, and 2.12 inches in 2002 to 2005 respectively. Again though, 2004 annual rainfall was below normal. Both seasonal and annual shifts in precipitation and temperatures can have distinctive short-term and cumulative effects on lake levels, physical lake properties, and water chemistry.

11
Figure 2. McFarland Hill Monthly Precipitation and Temperature 2002 to 2005
0
2
4
6
8
10
12
14
16
18
Mar
-02
Jun-
02
Sep-
02
Dec
-02
Mar
-03
Jun-
03
Sep-
03
Dec
-03
Mar
-04
Jun-
04
Sep-
04
Dec
-04
Mar
-05
Jun-
05
Sep-
05
Dec
-05
Prec
ipita
tion
(inch
es)
0
10
20
30
40
50
60
70
80
Tem
pera
ture
(F)
PrecipitationTemperature
20052002 2003 2004
Winter Winter WinterSummer Summer Summer Winter Summer
Figure 3.
McFarland Hill Annual Precipitation
20
25
30
35
40
45
50
55
60
65
70
75
80
85
90
1980 1982 1984 1986 1988 1990 1992 1994 1996 1998 2000 2002 2004 2006Year
Prec
ipita
tion
(inch
es)
State of Maine NCDC thirty year normal precipitation mean (1971 to 2000) 41.27 inces.McFarland Hill site mean precipitation (1981 to 2005) was 54.51 inches.

12
Lake Stage Monitoring
Spring lake levels are influenced by snowmelt and spring rains. Summer and fall levels are influenced by precipitation and evapoconcentration. Additional factors that can affect lake levels are drinking water demand in water district lakes (Bubble, Eagle, Upper Hadlock, Jordan), use for fire control (the Tarn), and human and beaver damming activity. Some lakes are flashier in response to the timing, frequency, and duration of rainfall depending on their watershed influences and flushing rate. In general, lake levels reflected rainfall trends throughout the summer and into fall during 2002 to 2005 (Appendix B). Upper Hadlock, The Tarn, and sometimes Bubble appeared to be more responsive to precipitation.
Emergent vegetation at the Tarn and Aunt Betty ponds has continued to increase in recent years. Both of these ponds are naturally very shallow with summer water levels between 1 and 2 meters, as well as have active beaver activity. These ponds appear to be slowly succeeding to freshwater wetlands as organic sediments accumulate on the pond bottom.
Secchi Disk Transparency
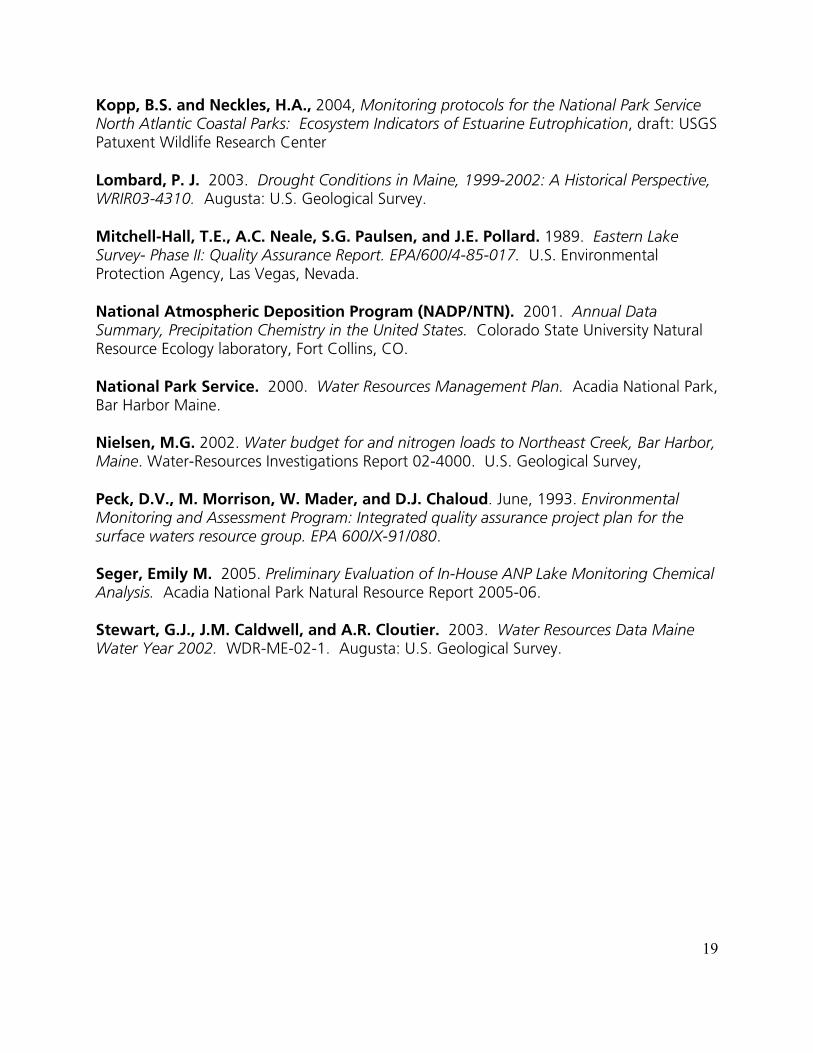
One long-term water quality measurement available for the core monitoring lakes at ANP is Secchi depth transparency. Mean, maximum, and minimum annual transparency and values for the core ponds (except Sargent Mountain Pond and The Bowl), can be seen in Table 5. Raw data of monthly readings are available on the University of Maine's Pearl website (http://pearl.maine.edu/).
Mean annual transparency has remained remarkably stable in the core ponds despite a number of different monitors over the years. Some ponds appear to have experienced a slight increase in transparency since the mid-1990’s, however this probably corresponds to a change in monitoring equipment. In 1995, the Secchi viewing scope was modified by adding two side flaps that shade the observer’s eyes from peripheral light. These flaps help to reduce the glare seen by the observer looking through the scope and tend to increase the transparency reading.
Graphs of annual mean Secchi transparency and Trophic State Index (TSI) data from 1980s to present are included in Appendix C. The more oligotrophic lakes appear to have slightly more variation in annual Secchi readings and thus transparency conditions in these lakes may be more responsive to precipitation and other environmental influences. The general Secchi trend in most of the core lakes was a decrease in transparency since the drought of 2001. This follows the pattern of increased summer precipitation from 2002 to 2004. Often during drier conditions lakes will become more clear due to less runoff of nutrient and soil inputs. In 2005 several lakes continued to have decreased secchi readings, due most likely to extremely high levels of spring and fall precipitation, and cumulative effects of a high rainfall year.

13
Table 5. Secchi Disk Readings
Dissolved Oxygen
Dissolved oxygen (DO) is the measure of the amount of oxygen occurring throughout the water column. Low oxygen rates can stress or directly kill organisms. Water with less than 1 mg/L of oxygen is considered anoxic and can promote the release of phosphorous from sediments and possibly increase algal blooms; less than 5 mg/L (hypoxia) is generally considered stressful to most coldwater fish. Temperature affects DO as well, in that increased water temperature leads to decreased oxygen solubility. Near the bottom of the water column, the more mesotrophic Seal Cove, Witch Hole, and Upper Hadlock ponds often reached below 5 mg/L or became anoxic during the months July through September. The more oligotrophic lakes sometimes reached below 1 mg/L, but only directly above the bottom sediment.
Graphs of mean hypolimnion depth, dissolved oxygen, and temperature (Appendix D) suggest that these parameters are staying relatively constant over time. Although annual mean hypolimnion temperatures are somewhat variable due to normal fluctuations in climate, both mean hypolimnion depths and DO levels appear to be either stable or slightly increasing. This indicates that the majority of the water column in park lakes continues to be well oxygenated, since most hypoxia occurs in the hypolimnion and the relative proportion of hypolimnetic water remains fairly unchanged.
Eutrophication Subset of Lakes
In the lakes sampled for eutrophication indicators, annual and seasonal (June/August) values for total phosphorus, total nitrogen and chlorophyll a from 1996 to 2005 continued to be

14
relatively stable with concentrations generally within the historical range of variability for these lakes (see Appendix E.). Although tests for statistically significant trends were not conducted, general patterns were observed, with some anomalies. Often total phosphorous (TP) and total nitrogen (TN) were higher in the early summer compared to late. This is most likely due to spring runoff from snowmelt and rainfall. Chlorophyll a was higher in the late summer, as this is the prime growing time for phytoplankton and algae. TP concentrations from 1996 to 2005 in Witch Hole Pond were the highest of the five lakes, with a mean concentration of 9.9 ug/L. Mean total phosphorus concentration in the other eutrophication lakes ranged from 2.8 ug/L in Jordan Pond to 6.1 ug/L in Seal Cove Pond. Upper Hadlock had an unexplainably high TP concentration of 12 ug/L in June 2001, but dropped to 3.9 ug/L in August, and then went back up to 11 ug/L the following June 2002. Most likely this is due to spring rain runoff. In early summer 2003, both TP and TN in Jordan were unusually high at 10.3 ug/L and 0.328 mg/L respectively. TN continued to be high in the late summer. In 2004 the levels were back to normal. TN ranged from a mean low of 0.134 mg/L in Bubble Pond to 0.377 mg/L in Witch Hole Pond from 1996 to 2005. Mean chlorophyll a concentrations ranged from a low of 1.0 ug/L in Jordan Pond to 4.2 ug/L in Witch Hole Pond from 1996 to 2005.
Light Penetration Profiles
Light penetration profiles were collected monthly for many of the eutrophication lakes from 2002 through 2004, using a LI-COR submersible PAR cell and surface deck cell. The goal of this sampling was to obtain baseline data and to attempt to determine a relationship between Secchi transparency and the light meter readings. The light penetration data and corresponding Secchi depths were examined by USGS staff in 2005 during the development of sampling protocols for NPS Vital Signs monitoring. Although the direct correlation between the Secchi depth and meter values was not as strong as anticipated, attenuation coefficients calculated from the profile data were shown to be a remarkably consistent index for seasonal comparison of lake transparency (Lombard, 2005; pers.comm.).
The profile information from deeper lakes may also be of value to compare with dissolved oxygen and temperature data, and to relate to productivity/food web studies. Secchi depth has long been considered a suitable and easily obtainable index for transparency, and the USGS comparison studies did not suggest there would be any advantage to augmenting (or replacing) Secchi transparency with LI-COR profiles in lakes that are deep enough to obtain Secchi readings. However, the greatest value of the LI-COR profiles is the ability to have an index of comparison (the attenuation coefficient) in shallower lakes. This data gap was noted in the 1998-2001 Lake Monitoring Report (Breen, et.al, 2002), so the sampling strategy was modified in 2005 to collect light profiles only in lakes too shallow for Secchi disk readings. Although each shallow lake was profiled once in 2005, increasing sampling frequency in future years would provide a more statistically robust sample size.
Light penetration profile data and graphs are found in Appendix F.
Acidification Subset of Lakes
Results for the five lakes sampled for acidification analytes indicate pH and acid neutralizing capacity (ANC) remained relatively stable both seasonally (spring/fall) and annually within each

15
lake from 1996 to 2005 (see Appendix G). From 1998 to 2005 Sargent Mountain Pond was the most acidic lake with a mean air equilibrated pH of 4.91, and mean ANC of –11.35 ueq/L. Jordan and Bubble Ponds were the most circumneutral lakes with mean pH values of 6.9, and mean ANC of 58.32 ueq/L and 56.10 ueq/L respectively. Spring pH and ANC tended to be somewhat lower than fall values in the Bowl, Jordan, Bubble, and Witch Hole Ponds, most likely due to spring melt episodic acidification. The reverse pattern was true for Sargent Mountain Pond, which is different in that it is a higher elevation headwater lake. However, in 2005 more often fall pH and ANC values were lower in the lakes than in spring. This is most likely due to above average fall precipitation (12.9 inches in the ten days preceding the fall sampling dates).
Interlab Comparison
Detailed results and discussion of the interlab comparison can be found in Seger, 2005. Overall results showed that apparent color analyzed at ANP is often less than true color values from the UMO lab. However, ANP values have been consistent since analysis began at ANP and are generally consistent within acceptable QC limits. ANC had the greatest discrepancy between the two labs. Conductivity differences between the two labs were generally less than 10%. Closed cell pH had the best agreement between the two labs. Again, these results were from a preliminary comparison. Percent difference limits followed were those used by the UMO lab for acceptable differences between field duplicate samples. Because differences are inevitable due to slightly varied analytical methods between the two labs, these percent difference limits may have been too strict. A stronger statistical comparison using peer-reviewed standards will be completed in the near future.
CONCLUSIONS
In summary of the results reported here using 2002 to 2005 data (and 1996 to 2005 data for graphs presenting longer periods of record), recovery from the 2001 drought occurred in 2002, with the two subsequent years becoming consecutively drier on an annual basis, although summers received relatively average amounts of precipitation. 2005 was an anomalous year with very high precipitation levels (totaling 84.3 inches), yet an average summer in temperature and rainfall. Secchi transparency and lake levels followed the precipitation trends of the seasons. Dissolved oxygen levels were within the expected ranges for the trophic type of each lake. In the eutrophication sampling subset of lakes, annual and seasonal (June/August) variation for total phosphorus, total nitrogen and chlorophyll a from 1996 to 2005 continued to be relatively stable with concentrations generally within the historical range of variability for these lakes. A notable exception is that TN appeared to be increasing over the years in Seal Cove Pond, though tests were not conducted to determine if this is a statistically significant trend. Results for the five acidification sampling subset of lakes indicate pH and acid neutralizing capacity (ANC) remained relatively stable both seasonally (spring/fall) and annually within each lake.
Although the results of the 2002 to 2005 lake monitoring were generally within their historical range, several samples with inexplicably elevated levels of TP and TN should be considered.

16
These nutrient spikes were initially attributed to episiodic loading due to heavy rainfall prior to sampling, but closer examination revealed that only one of the samples was preceded by more than 0.10" of rain in the 72 hours before sampling. It appears unlikely that rainfall was the cause of these transient high nutrient levels, and further investigation is suggested to try to establish the cause.
Attempting to determine long-term trends for specific water quality parameters is complicated by a variety of factors. Although the ANP lakes database contains records dating back to 1942, only the data collected using the current sampling and analytical protocols can be confidently used for trend analysis, and we are only now reaching the point of having a sufficient number of years of data to conduct such an analysis. Analytical methods for some analytes have changed in recent years from those used in earlier monitoring, making direct comparisons between different sets of data problematic. Analytical methods since the mid-1990s are much more uniform because the University of Maine laboratory has performed all of the analysis. In many instances, data from this period can be compared to data collected and analyzed by University of Maine researchers from the early 1980s, through 1995 that used essentially the same methodology (Kahl, 1996). However, data collected before 1980 was often analyzed using different or unknown methods.
Another factor making the analysis of trends difficult is the natural variation in annual and seasonal environmental/climatic conditions, especially in recent years. There has been great variation in seasonal and annual precipitation and temperature conditions in the past decade, as well as changes in atmospheric deposition patterns due to emission reductions as a result of amendments to the Clean Air Act in 1990. Differences in various data sets can be observed but these relatively short-term differences may not represent long-term trends.
The ANP lake monitoring program is designed to provide critical baseline data on the chemical status of ANP lakes and the temporal variability of individual constituents inherent within each water body. Because the monitored lakes reflect the broad range of lake types within ANP, these data also provide an indication of the relative status of unmonitored park lakes. Although there has not yet been a formal evaluation of the draft lake monitoring protocols, park staff and others who have informally reviewed the draft protocols believe they represent a reasonable and cost effective basis for a core long-term freshwater monitoring program.
In addition to the current lake and invertebrate monitoring programs conducted by park staff, a number of research investigations are underway to more fully characterize freshwater and estuarine systems at ANP. Several USGS research projects are investigating water budgets and nutrient enhancement in major estuaries (Nielsen, 2002), identifying and characterizing key ecological indicators and developing long-term monitoring protocols for freshwater wetlands (Guntenspurgen and Neckles, in prog.), and characterizing groundwater recharge and contamination potential (Culbertson, in prog.). The University of Maine and the USGS collaborated in a comprehensive paired watershed study to assess chemical cycling and the potential ecological impacts of atmospheric deposition on forested ecosystems (Kahl, et al, 2003). These additional water related research efforts are furnishing numerous datasets that can be integrated with other elements of the ANP long-term water monitoring program in the next few years. The Vital Signs Inventory and Monitoring Program currently being developed

17
within the National Park Service to identify key indicators of ecosystem health and a long-term monitoring program for parks will likely provide one opportunity for that integration. In preparation for this, a rigorous statistical analysis of the first 10 years of lake monitoring data, including an assessment of earlier lake monitoring data sets, is needed to determine if the current monitoring strategy will provide the data necessary to determine long-term trends in key water monitoring parameters. The park hopes to receive a full evaluation of the current monitoring program in 2006.
RECOMMENDATIONS
1) Consider more thorough investigation of nutrient (TP, TN) concentrations and sources in eutrophication group of lakes. Examine the relationship between precipitation and nutrient levels to determine the relative contributions of direct deposition and runoff to lakes.
2) Collect light profiles only in lakes too shallow for Secchi disk readings. Although each shallow lake was profiled once in 2005, increasing sampling frequency in future years would provide a more statistically robust sample size.
3) Obtain a comprehensive statistical analysis of the first 10 years of lake monitoring data collected using current protocols to determine if the current monitoring strategy will provide the data necessary to determine long-term trends in key water monitoring parameters. (Technical Assistance Request for this task was submitted to NPS Water Resources Division September 2005)
4) Obtain a formal evaluation of the draft lake monitoring protocols to determine if they represent a reasonable and cost effective basis for a ‘core’ long-term freshwater monitoring program. (Technical Assistance Request for this task was submitted to NPS Water Resources Division September 2005)
5) Continue to integrate lake monitoring data with information obtained from other aquatic monitoring and research conducted at ANP in order to better understand the current condition of the freshwater resources, as well as their responses to environmental variability and anthropogenic threats.

18
REFERENCES Breen, Robert, William Gawley, Michael Fraser, Heather Dumais. 2002. Acadia National Park Lake Monitoring Report 1998-2001. Acadia National Park Natural Resource Report 2002-03. Culbertson, C.W. (Manuscript in preparation 2006) Assessing Ground Water Quality Degradation and its Impact on Estuaries in Acadia National Park, Maine. U.S. Geological Survey. Gawley, William G. 1996. Acadia National Park Lake Monitoring: Field and Laboratory Methods. Acadia National Park Natural Resource Report 96-01. Gawley, William G., and Robert M. Breen. 1996. 1995 Water Monitoring Program: Year End Report. Acadia National Park Natural Resource Report 96-04. Gawley, William G. and Robert M. Breen. 1998. Acadia National Park Lake Monitoring, 1997 Year-end Report. Acadia National Park Natural Resource Report 98-02. Guntenspergen, G., and H. Neckles (Project in progress 2006). Development of a Wetland Monitoring Protocol for Acadia National Park. U.S. Geological Survey. Herlihy, A.T., D.H. Landers, R.F. Cusimano, W.S. Overton, P.J. Wigington, Jr., A.K. Pollack, and T.E. Mitchell-Hall. 1991. Temporal Variability in Lakewater Chemistry in the Northeastern United States: Results of Phase II of the Eastern Lake Survey. EPA/600/3-91 /012. U.S. Environmental Protection Agency, Washington, D.C. Kahl, Jeffrey S. 1996. Lake Chemistry at Acadia National Park, 1995. A report to: Acadia National Park. Water Research Institute, University of Maine, Orono, Maine. Kahl, Jeffrey S. , Ivan Fernandez, Stephen Norton, G. Bruce Wiersma, George Jacobson, Sarah Nelson, Aria Amirbahman, Michael Bank, Janet Eckhoff, Jose Elvir, Heather Good, Terry Haines, Ken Johnson, Robert Lent, Cynthia Loftin, Martha Nielsen, Jennifer Parker, John Peckenham, Phillip Ruck, Molly Schauffler, John Stoddard, Robert Breen, Bill Gawley, David Manski, Charles Roman, Lindsey Rustad, Kathy Tonnessen, Kathleen Weathers, Christopher Cronan, Alan White. 2003. Final integrated report: Establishing paired gauged watersheds at Acadia National Park for long-term research on acidic deposition, nitrogen saturation, forest health, and mercury biogeochemistry (1998-2002) University of Maine, Orono, Maine Kahl, Steve, and David Manski. 1997. Developing Long-term Monitoring Protocols for Freshwater Resources at Acadia National Park. Interim Report from a workshop, January 9-10, 1997.
19
Kopp, B.S. and Neckles, H.A., 2004, Monitoring protocols for the National Park Service North Atlantic Coastal Parks: Ecosystem Indicators of Estuarine Eutrophication, draft: USGS Patuxent Wildlife Research Center Lombard, P. J. 2003. Drought Conditions in Maine, 1999-2002: A Historical Perspective, WRIR03-4310. Augusta: U.S. Geological Survey. Mitchell-Hall, T.E., A.C. Neale, S.G. Paulsen, and J.E. Pollard. 1989. Eastern Lake Survey- Phase II: Quality Assurance Report. EPA/600/4-85-017. U.S. Environmental Protection Agency, Las Vegas, Nevada. National Atmospheric Deposition Program (NADP/NTN). 2001. Annual Data Summary, Precipitation Chemistry in the United States. Colorado State University Natural Resource Ecology laboratory, Fort Collins, CO. National Park Service. 2000. Water Resources Management Plan. Acadia National Park, Bar Harbor Maine. Nielsen, M.G. 2002. Water budget for and nitrogen loads to Northeast Creek, Bar Harbor, Maine. Water-Resources Investigations Report 02-4000. U.S. Geological Survey, Peck, D.V., M. Morrison, W. Mader, and D.J. Chaloud. June, 1993. Environmental Monitoring and Assessment Program: Integrated quality assurance project plan for the surface waters resource group. EPA 600/X-91/080. Seger, Emily M. 2005. Preliminary Evaluation of In-House ANP Lake Monitoring Chemical Analysis. Acadia National Park Natural Resource Report 2005-06. Stewart, G.J., J.M. Caldwell, and A.R. Cloutier. 2003. Water Resources Data Maine Water Year 2002. WDR-ME-02-1. Augusta: U.S. Geological Survey.

`APPENDIX A Water Chemistry Data 2002-2005
National Park Service U.S. Department of the Interior

Description Start Date Sample Type
Depth (m)
Lab Code
QC Type
Closed Cell pH eqPH Color
(PCU)Conductivity
(µeq/L)ANC
(µg/L)
Chloro-phyll a (µg/L)
TP (µg/L)
TN (mg/L)
DOC (mg/L)
DIC (mg/L)
Ca (µeq/L)
BEAR BROOK POND 8/25/2005 G 0.2 ANP REG 6.97 26 93 185BUBBLE POND 4/21/2005 G 0.2 ANP REG 6.54 4 34.23 59.2BUBBLE POND 4/21/2005 G 0.2 ANP REP 6.14 5 34.23 60.5BUBBLE POND 4/21/2005 G 0.2 GMC REG 6.59 6.54 4.78 34.74 61.7 0.122 1.6 1 104.2BUBBLE POND 5/18/2005 G 0.2 ANP REG 6.55 9 30.04 51BUBBLE POND 5/18/2005 G 0.2 ANP REP 6.55 8 30.86 43.6BUBBLE POND 6/24/2005 G 0.2 ANP REG 6.53 4 23.8 32.8BUBBLE POND 7/14/2005 C 4.5 ANP REG 6.67 4 26.81 53.6BUBBLE POND 8/19/2005 G 0.2 ANP REG 6.77 4 28 52.8BUBBLE POND 9/22/2005 G 0.2 ANP REG 6.7 4 28.2 62.3BUBBLE POND 9/22/2005 G 0.2 ANP REG 6.7 4 28.2 62.3BUBBLE POND 9/22/2005 G 0.2 ANP DUP 6.78 3 27.7 56.7BUBBLE POND 9/22/2005 G 0.2 ANP DUP 6.78 3 27.7 56.7BUBBLE POND 10/18/2005 G 0.2 ANP REG 6.48 24.31BUBBLE POND 10/18/2005 G 0.2 GMC REG 6.4 6.65 9.99 23.72 43.8 0.151 3.2 0.899 72.34DUCK POND 8/4/2005 G 0.2 ANP REG 5.17 32 22.51 4.7DUCK POND 8/4/2005 G 0.2 ANP REP 5.15 32 22.41 8.24EAGLE LAKE 5/12/2005 G 0.2 ANP REG 6.45 2 34 55EAGLE LAKE 5/12/2005 G 0.2 ANP DUP 6.48 1 33.6 38.1EAGLE LAKE 6/27/2005 G 0.2 ANP REG 6.98 0 33.85 52.1EAGLE LAKE 6/27/2005 G 0.2 ANP REP 6.89 0 33.85 53.2EAGLE LAKE 7/19/2005 G 0.2 ANP REG 6.86 2 35.51 53.1EAGLE LAKE 8/23/2005 G 0.2 ANP REG 6.69 2 36 48.1EAGLE LAKE 8/23/2005 G 0.2 ANP REG 6.69 2 36 48.1EAGLE LAKE 9/27/2005 G 0.2 ANP REG 6.67 1 38.2 62.1EAGLE LAKE 10/31/2005 G 0.2 ANP REG 6.43 4 33.5 46.3ECHO LAKE 5/19/2005 G 0.2 anp REG 6.69 7 73.18 76.8ECHO LAKE 6/21/2005 C 3 ANP REG 6.89 7 69.9 87ECHO LAKE 6/21/2005 C 3 GMC REG 6.72 12.5 67.8 1.6 8.2 0.245 3.6ECHO LAKE 7/13/2005 C 4 ANP REG 6.92 8 72.76 72.2ECHO LAKE 8/18/2005 C 8 ANP REG 6.86 7 72 95.3ECHO LAKE 8/18/2005 C 8 GMC REG 6.67 8 69.5 3.5 1.9 0.165 3.3ECHO LAKE 9/14/2005 G 0.2 ANP REG 6.85 5 71.48 77.2ECHO LAKE 10/31/2005 G 0.2 ANP REG 6.7 11 65.8 69.9
Appendix A: Lake Chemistry 2002-2005 1

Description Start Date Sample Type
Depth (m)
Lab Code
QC Type
Closed Cell pH eqPH Color
(PCU)Conductivity
(µeq/L)ANC
(µg/L)
Chloro-phyll a (µg/L)
TP (µg/L)
TN (mg/L)
DOC (mg/L)
DIC (mg/L)
Ca (µeq/L)
FAWN POND 8/22/2005 G 0.5 ANP REG 6.07 14 24 96.2FAWN POND 8/22/2005 G 0.5 ANP REP 6.07 14 24 76HALFMOON POND 8/24/2005 G 0.2 ANP REG 6.12 17 23 68HODGDON POND 8/26/2005 G 0.2 ANP REG 6.41 24 43 47.3JORDAN POND 4/21/2005 G 0.2 ANP REG 6.28 3 35.62 61.6JORDAN POND 4/21/2005 G 0.2 GMC REG 6.53 6.6 3.85 35.4 56.4 0.126 1.6 0.9 102.7JORDAN POND 5/18/2005 G 0.2 ANP REG 6.78 5 37.66 32.7JORDAN POND 6/13/2005 C 4 ANP REG 6.72 2 35.4 53.4JORDAN POND 6/13/2005 C 4 GMC REG 6.65 4.59 33.25 0.7 2.8 0.121 2.1JORDAN POND 7/20/2005 C 6 ANP REG 7.13 3 36.04 74JORDAN POND 8/16/2005 C 8 ANP REG 7.02 4 36 70.8JORDAN POND 8/16/2005 C 8 GMC REG 6.76 4 32.84 1 0.9 0.127 2.1JORDAN POND 9/19/2005 G 0.2 ANP REG 6.9 2 34.9 51JORDAN POND 10/18/2005 G 0.2 ANP REG 6.69 31.9JORDAN POND 10/18/2005 G 0.2 GMC REG 6.62 6.53 4.53 31.14 57.6 0.156 2.2 0.99 94.22LAKE WOOD 9/2/2005 G 0.2 ANP REG 6.72 6 23 81.8LAKE WOOD 9/2/2005 G 0.2 ANP REP 7 23 88.2LONG POND (MDI) 5/19/2005 G 0.2 ANP REG 6.57 8 49.23 43.9LONG POND (MDI) 6/21/2005 G 0.2 ANP REG 6.99 12 44.8 61.4LONG POND (MDI) 7/13/2005 G 0.2 ANP REG 6.74 10 47.73 41.6LONG POND (MDI) 8/26/2005 G 0.2 ANP REG 6.81 6 49 41.5LONG POND (MDI) 9/30/2005 C 0.2 ANP REG 6.61 6 47 58.3LONG POND (MDI) 10/31/2005 G 0.5 ANP REG 6.3 10 45.3 42.1LOWER BREAKNECK 8/24/2005 G 0.2 ANP REG 6.62 10 37 77.6LOWER HADLOCK 8/19/2005 G 0.2 ANP REG 6.6 9 46 51.1MILL FIELD RESERVOIR 8/4/2005 G 0.2 ANP REG 6.14 10 45.13 122ROUND POND 7/7/2005 G 0.2 ANP REG 6.09 15 35.88 4.54SARGENT MTN POND 5/2/2005 G 1 ANP REG 5.13 20 25.7 -1.79SARGENT MTN POND 5/2/2005 G 0.2 GMC REG 4.89 4.84 19 23.16 -15.1 0.188 4.2 0.7 12.47SARGENT MTN POND 9/2/2005 G 0.5 ANP REG 5.06 10 22 -6.83SARGENT MTN POND 10/19/2005 G 0.2 GMC REG 4.85 4.9 27.2 22.26 -10.4 0.429 5.4 0.651 16.91SEAL COVE POND 6/20/2005 C 5 ANP REG 6.64 16 40.23 47.2SEAL COVE POND 6/20/2005 C 5 ANP DUP 6.49 16 39.38 53.7SEAL COVE POND 6/20/2005 C 5 GMC REG 6.43 21.5 39.99 2.8 9.6 0.268 5.8
Appendix A: Lake Chemistry 2002-2005 2

Description Start Date Sample Type
Depth (m)
Lab Code
QC Type
Closed Cell pH eqPH Color
(PCU)Conductivity
(µeq/L)ANC
(µg/L)
Chloro-phyll a (µg/L)
TP (µg/L)
TN (mg/L)
DOC (mg/L)
DIC (mg/L)
Ca (µeq/L)
SEAL COVE POND 7/22/2005 C 3 ANP REG 7.02 14 44.35 67.7SEAL COVE POND 8/17/2005 C 6 ANP REG 6.74 12 43 65.6SEAL COVE POND 8/17/2005 C 6 GMC REG 6.66 12 41.55 3.6 4.5 0.278 5.4SEAL COVE POND 9/28/2005 G 0.2 ANP REG 6.73 9 45.4 83.8SEAL COVE POND 10/31/2005 G 0.5 ANP REG 6.16 19 37.4 46.7THE BOWL 4/26/2005 G 1 ANP REG 6.06 6 34.78 23.9THE BOWL 4/26/2005 G 0.2 GMC REG 6 6.06 3.34 34.94 12.1 0.149 1.6 0.8 48.5THE BOWL 8/22/2005 G 0.5 ANP REG 6.1 6 34 16.7THE BOWL 10/18/2005 G 0.2 ANP REG 6.07 26.29THE BOWL 10/18/2005 G 0.2 GMC REG 6.03 6.4 8.06 27.86 18.6 0.224 2.9 0.661 40.16THE TARN 8/25/2005 G 0.2 ANP REG 6.72 12 89 111THE TARN 8/25/2005 G 0.2 ANP DUP 6.75 12 89 117UPPER BREAKNECK 8/24/2005 G 0.2 ANP REG 6.44 19 47 86.4UPPER HADLOCK 5/17/2005 G 0.5 ANP REG 5.93 17 35.39 20.5UPPER HADLOCK 6/13/2005 G 0.2 ANP REG 6.32 17 31.9 87.6UPPER HADLOCK 6/13/2005 G 0.2 GMC REG 6.25 15 30.83 0.8 8.3 0.15 4.5UPPER HADLOCK 7/11/2005 C 4 ANP REG 6.61 13 35.06 40.1UPPER HADLOCK 8/15/2005 C 4 ANP REG 6.63 10 37 58.1UPPER HADLOCK 8/15/2005 C 4 GMC REG 6.55 7 34.74 1.7 3 0.274 4.5UPPER HADLOCK 9/19/2005 G 0.2 ANP REG 6.75 6 37.6 65.6UPPER HADLOCK 10/31/2005 G 0.2 ANP REG 5.84 24 27.9 30.5WITCH HOLE POND 4/26/2005 G 1 ANP REG 6.11 18 26.52 56.4WITCH HOLE POND 4/26/2005 G 0.2 GMC REG 6.11 6.39 24.1 24.85 42.3 0.229 3.6 1.4 50.18WITCH HOLE POND 5/17/2005 G 0.5 ANP REG 6.09 16 20.14 49.7WITCH HOLE POND 6/20/2005 C 3 ANP REG 6.24 21 22.68 28.4WITCH HOLE POND 6/20/2005 C 3 GMC REG 6.13 27.2 21.27 5 10.4 0.322 4.6WITCH HOLE POND 7/13/2005 C 4 ANP REG 6.27 21 22.07 45.3WITCH HOLE POND 7/13/2005 C 4 ANP DUP 6.31 22 22.07 46.7WITCH HOLE POND 8/18/2005 C 3 ANP REG 6.56 17 24 44.3WITCH HOLE POND 8/18/2005 C 3 ANP DUP 6.52 18 23 52.8WITCH HOLE POND 8/18/2005 C 3 GMC REG 6.3 21 23.07 4.1 6.6 0.389 5.3WITCH HOLE POND 9/21/2005 G 0.2 ANP REG 6.35 15 25.3 52.5WITCH HOLE POND 10/19/2005 G 0.2 GMC REGWITCH HOLE POND 10/19/2005 G 0.2 GMC REG 5.87 6.58 36.9 20.96 38.9 0.351 5.8 1.415 47.76
Appendix A: Lake Chemistry 2002-2005 3

Description Start Date Sample Type
Depth (m)
Lab Code
QC Type
Closed Cell pH eqPH Color
(PCU)Conductivity
(µeq/L)ANC
(µg/L)
Chloro-phyll a (µg/L)
TP (µg/L)
TN (mg/L)
DOC (mg/L)
DIC (mg/L)
Ca (µeq/L)
AUNT BETTYS 7/20/2004 G 0.2 ANP 6.44 25 66.1 70.6BEAR BROOK POND 7/12/2004 G 0.2 ANP 6.99 25 93.68 151BEAR BROOK POND 7/12/2004 G 0.2 ANP DUP 7.14 25 93.68 149BEAR BROOK POND 7/12/2004 G 0.2 ANP REP 25 92.84 148BUBBLE POND 5/5/2004 G 0.2 GMC 6.47 6.71 6 36.2 54 0.22 2.6 1 109.3BUBBLE POND 7/6/2004 C 3 ANP 7.09 2 37.3 59.7BUBBLE POND 8/5/2004 G 0.2 ANP DUP 6.88 1 37.9 71.5BUBBLE POND 8/5/2004 G 0.2 ANP 6.77 1 37.9 59.1BUBBLE POND 8/27/2004 G 0.2 ANP 6.71 1 37.4 64.2BUBBLE POND 9/27/2004 G 0.2 ANP 6.83 3 38 100BUBBLE POND 9/27/2004 G 0.2 ANP DUP 6.86 3 36.4 92.1BUBBLE POND 10/20/2004 G 0.2 ANP 6.87 2 36.11 81.2BUBBLE POND 10/20/2004 G 0.2 GMC 6.62 6.91 5 35.7 68.9 2.2 1.2 105.6DUCK POND 8/5/2004 G 0.2 ANP 4.92 33 32 13.2EAGLE LAKE 5/20/2004 G 0.2 ANP 6.46 3 41.1 48.1EAGLE LAKE 6/16/2004 G 0.2 ANP 6.98 1 39.78 55.6EAGLE LAKE 7/20/2004 G 0.2 ANP DUP 6.78 2 38.86 52.5EAGLE LAKE 7/20/2004 G 0.2 ANP 6.56 2 39.18 57.9EAGLE LAKE 9/1/2004 G 0.2 ANP 6.79 1 38.8 42.8EAGLE LAKE 9/27/2004 G 0.2 ANP 6.7 2 38.1 32.7ECHO LAKE 6/21/2004 C 4 GMC 6.86 7 75.6 1 3.5 0.21 3.7ECHO LAKE 6/21/2004 C 4 ANP 6.89 4 83.3 93.2ECHO LAKE 7/20/2004 G 4 ANP 7.3 4 74.9 89.7ECHO LAKE 8/25/2004 C 9 ANP 7.04 5 78.85 91.8ECHO LAKE 8/25/2004 C 9 GMC 6.88 8 74 2.4 3.6 0.21 3.5ECHO LAKE 9/14/2004 C 10 ANP 7.25 6 76 109FAWN POND 8/6/2004 G 0.8 ANP 6.39 12 33.4 84.5HALFMOON POND 7/14/2004 G 0.2 ANP 6.21 15 26.2 65.3HODGDON POND 8/4/2004 G 0.2 ANP 6.7 19 56.6 77.4JORDAN POND 5/5/2004 G 0.2 GMC 6.59 6.6 3 36.8 59.4 0.12 1.9 1 114.3JORDAN POND 6/17/2004 C 7 ANP 0 41.3 70.1JORDAN POND 6/17/2004 C 7 GMC 6.7 4 36.3 0.7 4.9 0.16 2.4
Appendix A: Lake Chemistry 2002-2005 4

Description Start Date Sample Type
Depth (m)
Lab Code
QC Type
Closed Cell pH eqPH Color
(PCU)Conductivity
(µeq/L)ANC
(µg/L)
Chloro-phyll a (µg/L)
TP (µg/L)
TN (mg/L)
DOC (mg/L)
DIC (mg/L)
Ca (µeq/L)
JORDAN POND 7/7/2004 C 6 ANP 7.02 3 36.98 46.1JORDAN POND 8/9/2004 C 10 GMC 6.86 3 36.8 1 2.3 0.13 2.4JORDAN POND 8/9/2004 C 10 ANP 6.68 1 37.7 66.4JORDAN POND 9/24/2004 C 10 ANP 6.86 3 36.6 83.8JORDAN POND 10/20/2004 G 0.2 ANP 6.93 2 36.01 69.8JORDAN POND 10/20/2004 G 0.2 GMC 6.74 6.76 5 35.8 63.1 2 1.1 107.2JORDAN POND 10/20/2004 G 0.2 ANP REP 6.93 3 35.39 70.8LAKE WOOD 8/24/2004 G 0.2 ANP 6.85 7 31.6 99.8LONG POND (MDI) 6/30/2004 G 0.2 ANP 6.86 4 49.35 42.1LONG POND (MDI) 7/29/2004 G 0.2 ANP 7.04 5 49.8 59.3LONG POND (MDI) 8/26/2004 G 0.2 ANP 6.9 2 57.9 56.8LONG POND (MDI) 8/26/2004 G 0.2 ANP DUP 6.83 4 55.6 59.1LONG POND (MDI) 9/20/2004 G 0.2 ANP 6.7 6 53.4 42.5LOWER BREAKNECK 7/14/2004 G 0.2 ANP 6.69 12 47.4 90.9LOWER BREAKNECK 7/14/2004 G 0.2 ANP REP 10 48.3 90.9LOWER HADLOCK 8/4/2004 G 0.2 ANP 6.94 4 65.4 46.7MILL FIELD RESERVOIR 7/19/2004 G 0.8 ANP 6.37 6 49.2 83.4SARGENT MTN POND 5/4/2004 G 0.2 ANP 5.11 10 28.53 129SARGENT MTN POND 5/4/2004 G 0.2 GMC 4.98 5.02 14 28.4 -6.35 0.2 4 0.6 20.5SARGENT MTN POND 8/12/2004 G 0.75 ANP 5.17 6 32.4 -6.92SARGENT MTN POND 10/20/2004 G 0.2 GMC 5.06 5.09 8 28.3 -9.64 4 0.5 20.91SARGENT MTN POND 10/20/2004 G 0.2 ANP 5.11 8 27.23 10.5SEAL COVE POND 6/23/2004 C 4 ANP 6.75 10 61.8 54.2SEAL COVE POND 6/23/2004 C 4 GMC 6.66 10 49.7 2.6 5.3 0.4 4.9SEAL COVE POND 7/29/2004 C 6 ANP 6.97 7 52.12 71.8SEAL COVE POND 8/25/2004 C 9 GMC 6.55 8 49.7 4.3 3.7 0.28 4.8SEAL COVE POND 8/25/2004 C 9 ANP 6.95 8 54.74 62.9SEAL COVE POND 9/16/2004 C 4 ANP 6.79 8 56.3 80.7THE BOWL 4/14/2004 G 0.2 ANP 5.99 6 37.6 28.8THE BOWL 4/14/2004 G 0.2 GMC 5.97 6.18 3 41.7 18.1 0.24 2.9 1.2 63.9THE BOWL 8/23/2004 G 0.75 ANP 6.32 8 44.6 35.1THE BOWL 10/19/2004 G 0.2 GMC 6.09 6.5 7 39.1 27 0.24 3.1 0.7 56.4THE BOWL 10/19/2004 G 0.2 ANP 6.14 7 36.92 32.9THE TARN 7/12/2004 G 0.25 ANP 7.21 12 140 106
Appendix A: Lake Chemistry 2002-2005 5

Description Start Date Sample Type
Depth (m)
Lab Code
QC Type
Closed Cell pH eqPH Color
(PCU)Conductivity
(µeq/L)ANC
(µg/L)
Chloro-phyll a (µg/L)
TP (µg/L)
TN (mg/L)
DOC (mg/L)
DIC (mg/L)
Ca (µeq/L)
UPPER BREAKNECK 7/14/2004 G 0.2 ANP 6.41 22 52.1 105UPPER HADLOCK 5/21/2004 G 0.2 ANP 6.41 7 60.67 43.9UPPER HADLOCK 6/17/2004 G 0.2 GMC 6.5 10 57.4 1 4.1 0.17 3.5UPPER HADLOCK 6/17/2004 G 0.2 ANP 6.3 5 59.4 98.9UPPER HADLOCK 7/7/2004 C 4 ANP 6.74 7 58.81 56.7UPPER HADLOCK 8/10/2004 C 4 ANP REP 6 60.3 54.9UPPER HADLOCK 8/10/2004 C 4 GMC 6.57 7 58.7 2.8 4.4 0.23 4.1UPPER HADLOCK 8/10/2004 C 4 ANP 6.83 5 60.4 58.9UPPER HADLOCK 9/27/2004 C 4 ANP 6.64 11 53.1 65.7WITCH HOLE POND 5/6/2004 G 0.2 ANP 6.48 16 28.33 149WITCH HOLE POND 5/6/2004 G 0.2 GMC 6.4 6.61 23 29.3 51.5 0.29 4.5 1 66.9WITCH HOLE POND 5/21/2004 G 0.2 ANP 6.41 20 29.25 148WITCH HOLE POND 5/21/2004 G 0.2 ANP 6.41 20 29.25 148WITCH HOLE POND 6/16/2004 C 3 ANP 6.58 19 30.9 49.8WITCH HOLE POND 6/16/2004 C 3 GMC 26 29.1 1.7 8.7 0.33 5.6WITCH HOLE POND 7/16/2004 C 4 ANP 6.61 21 30.15 56.1WITCH HOLE POND 8/10/2004 C 3 GMC 6.54 26 31 2.3 9.4 0.55 7WITCH HOLE POND 8/10/2004 C 3 ANP 6.55 20 31.6 70.5WITCH HOLE POND 9/20/2004 C 4 ANP REP 20 32.7 70.8WITCH HOLE POND 9/20/2004 C 4 ANP 6.52 20 32.1 63.3WITCH HOLE POND 10/19/2004 G 0.2 ANP DUP 6.42 21 28.05 75.2WITCH HOLE POND 10/19/2004 G 0.2 GMC 6.28 6.85 25 29.5 68 6.7 1.5 67.06WITCH HOLE POND 10/19/2004 G 0.2 ANP 6.43 22 27.85 68.2
AUNT BETTYS 8/21/2003 G 0.2 ANP 6.21 27 62.06 126BEAR BROOK POND 8/13/2003 G 0.2 ANP 6.88 31 83.6 172BUBBLE POND 5/14/2003 G 0.2 ANP 6.4 4 38.18 59.5BUBBLE POND 5/14/2003 G 0.2 ECL 6.53 6.7 6 33.3 64.1 0.083 1.73 1.1 88.32BUBBLE POND 7/2/2003 G 0.2 ANP 6.61 5 34.8 62.7BUBBLE POND 7/30/2003 C 6 ANP 6.69 3 39 76.5BUBBLE POND 8/26/2003 G 0.2 ANP 6.77 1 38.79 101BUBBLE POND 10/3/2003 G 0.2 ANP 6.93 1 42.11 128BUBBLE POND 10/22/2003 G 0.2 ANP 6.74 1 40.79 72.8
Appendix A: Lake Chemistry 2002-2005 6

Description Start Date Sample Type
Depth (m)
Lab Code
QC Type
Closed Cell pH eqPH Color
(PCU)Conductivity
(µeq/L)ANC
(µg/L)
Chloro-phyll a (µg/L)
TP (µg/L)
TN (mg/L)
DOC (mg/L)
DIC (mg/L)
Ca (µeq/L)
BUBBLE POND 10/22/2003 G 0.2 ECL 6.52 7.08 3 35.6 70.8 0.15 1.91 1.06 86.83EAGLE LAKE 6/18/2003 G ANP 6.66 1 46 67EAGLE LAKE 7/17/2003 G 0.2 ANP 6.54 2 43.5 51.5EAGLE LAKE 8/20/2003 G 0.2 ANP 6.95 44.1 37.7EAGLE LAKE 9/17/2003 G 0.2 ANP 6.76 2 42.55 49.2ECHO LAKE 5/30/2003 G 0.2 ANP 6.66 9 78.78 68ECHO LAKE 6/16/2003 G 0.2 ANP 6.74 4 79.6 88.6ECHO LAKE 6/16/2003 G 0.2 ECL 7 71.7 2 3.6 0.147 2.6ECHO LAKE 7/8/2003 C 6 ANP 6.89 5 82.65 86.2ECHO LAKE 8/15/2003 C 4 ECL 4 78.9 1.8 5.2 0.212 2.89ECHO LAKE 8/15/2003 C 4 ANP 6.81 3 84.9 98.9ECHO LAKE 9/17/2003 G 0.2 ANP 6.93 3 84.07 97HODGDON POND 8/21/2003 G 0.2 ANP 6.74 20 59.16 88.2JORDAN POND 5/14/2003 G 0.2 ECL 6.51 6.8 4 36.1 61.1 0.083 1.68 1 94.31JORDAN POND 5/14/2003 G 0.2 ANP 6.47 3 42.58 63.2JORDAN POND 6/24/2003 C 3 ECL 3 35.7 0.2 10.3 0.328 2.24JORDAN POND 6/24/2003 C 3 ANP 6.52 18 39.8 106JORDAN POND 7/25/2003 G 0.2 ANP 6.62 4 44.3 63.8JORDAN POND 8/12/2003 C 7 ECL 2 38.8 0.8 2.7 0.208 1.89JORDAN POND 8/12/2003 C 7 ANP 6.84 3 40.3 57.9JORDAN POND 9/9/2003 G 0.2 ANP 6.89 1 39.33 60JORDAN POND 10/28/2003 G 0.2 ECL 6.6 7.03 2 37.8 66.1 0.14 1.74 1.17 99.3JORDAN POND 10/28/2003 G 0.2 ANP 7.02 2 42.45 70.6LAKE WOOD 8/14/2003 G 0.2 ANP 6.87 4 29.1 83.5LONG POND (MDI) 6/25/2003 G 0.2 ANP 6.7 6 55.1 66.9LONG POND (MDI) 7/17/2003 G 0.2 ANP 6.62 5 55.7 51.1LONG POND (MDI) 8/15/2003 G 0.2 ANP 6.9 4 54.7 63.9LONG POND (MDI) 9/17/2003 G 0.2 ANP 6.63 4 56.24 63.7LOWER BREAKNECK 8/22/2003 G 0.2 ANP 6.71 11 45.3 95.9LOWER HADLOCK 8/11/2003 G 0.2 ANP 6.48 8 62.9 45.1SARGENT MTN POND 5/6/2003 G 0.2 ANP 5.11 13 27.8 -9.47SARGENT MTN POND 5/6/2003 G 0.2 ECL 5.24 5.31 13 24 0 0.16 2.6 0.8 20.96SARGENT MTN POND 8/18/2003 G 0.2 ANP 5.48 11 27.53 13.4SARGENT MTN POND 10/28/2003 G 0.2 ECL 5.03 4.75 22 34.2 -15.4 0.28 5.04 0.82 21.96
Appendix A: Lake Chemistry 2002-2005 7

Description Start Date Sample Type
Depth (m)
Lab Code
QC Type
Closed Cell pH eqPH Color
(PCU)Conductivity
(µeq/L)ANC
(µg/L)
Chloro-phyll a (µg/L)
TP (µg/L)
TN (mg/L)
DOC (mg/L)
DIC (mg/L)
Ca (µeq/L)
SARGENT MTN POND 10/28/2003 G 0.2 ANP 4.94 17 36.18 1.3SEAL COVE POND 5/21/2003 G 0.2 ANP 6.38 12 55 49.2SEAL COVE POND 6/26/2003 C 3 ECL 11 46.7 2.1 5.9 0.38 5.52SEAL COVE POND 6/26/2003 C 3 ANP 6.74 10 56.6 63SEAL COVE POND 7/18/2003 C 6 ANP 6.77 11 54.95 73.3SEAL COVE POND 8/14/2003 C 4 ANP 6.93 9 56.1 156SEAL COVE POND 8/14/2003 C 4 ECL 8 51.5 2.9 8.9 0.346 4.77SEAL COVE POND 9/12/2003 G 0.2 ANP 6.63 5 53.71 68.5THE BOWL 5/14/2003 G 0.2 ANP 5.92 3 40.15 23.5THE BOWL 5/14/2003 G 0.2 ECL 5.93 6.37 6 34 21.6 0.139 2.08 0.8 43.41THE BOWL 8/12/2003 G 0.2 ANP 6.36 8 39.5 42.5THE BOWL 10/20/2003 G 0.2 ANP 6.32 6 41.69 35.6THE BOWL 10/20/2003 G 0.2 ECL 6.29 6.76 5 38.9 38 0.306 2.74 0.84 45.41THE TARN 8/13/2003 G 0.2 ANP 6.87 39 110.3 134UPPER BREAKNECK 8/22/2003 G 0.2 ANP 6.56 16 54.2 129UPPER HADLOCK 5/29/2003 G 0.2 ANP 6.15 4 60.49 33.1UPPER HADLOCK 6/18/2003 G 0.2 ANP 6.36 9 63.9 20.4UPPER HADLOCK 6/18/2003 G 0.2 ECL 12 53.7 1.6 4 0.149 3.13UPPER HADLOCK 7/16/2003 G 0.2 ANP 6.56 5 65.4 52.6UPPER HADLOCK 8/11/2003 C 6 ANP 6.4 11 60.4 43.6UPPER HADLOCK 8/11/2003 C 6 ECL 11 54.6 4.7 5.5 0.269 3.57UPPER HADLOCK 9/22/2003 G 0.2 ANP 7.18 7 61.94 61.1WITCH HOLE POND 5/8/2003 G 0.2 ECL 6.13 6.57 24 25.8 44.3 0.199 3.8 1.1 41.96WITCH HOLE POND 5/8/2003 G 0.2 ANP 5.93 18 29.4 61.1WITCH HOLE POND 6/13/2003 G 0.2 ECL 28 25.4 2.4 7.1 0.282 4.62WITCH HOLE POND 6/13/2003 G 0.2 ANP 6.39 20 28.8 59.4WITCH HOLE POND 7/16/2003 G 0.2 ANP 6.43 22 31.7 65.4WITCH HOLE POND 8/22/2003 C 3 ANP 6.61 19 31.4 76.3WITCH HOLE POND 8/22/2003 C 3 ECL 20 29.5 2.3 8.8 0.482 6.07WITCH HOLE POND 9/18/2003 G 0.2 ANP 6.5 16 32.2 67.7WITCH HOLE POND 10/20/2003 G 0.2 ANP 6.33 21 35.35 73.2WITCH HOLE POND 10/20/2003 G 0.2 ECL 6.32 6.93 25 30.7 70.6 0.4 5.78 1.49 53.39
Appendix A: Lake Chemistry 2002-2005 8

Description Start Date Sample Type
Depth (m)
Lab Code
QC Type
Closed Cell pH eqPH Color
(PCU)Conductivity
(µeq/L)ANC
(µg/L)
Chloro-phyll a (µg/L)
TP (µg/L)
TN (mg/L)
DOC (mg/L)
DIC (mg/L)
Ca (µeq/L)
BUBBLE POND 4/24/2002 G 0.2 ECL 6.38 6.9 5 38.3 54.8 2.7 0.097 1.82 83.3BUBBLE POND 4/24/2002 G 0.2 ANP 6.42 1 35.6 55.9BUBBLE POND 6/13/2002 G 0.2 ANP 5.97 8 35.6 61.5BUBBLE POND 7/25/2002 G 0.2 ANP 6.68 4 35.11 45.2BUBBLE POND 9/11/2002 G 0.2 ANP 6.73 2 36.08 70.1BUBBLE POND 10/22/2002 G 0.2 ECL 6.45 6.99 3 36.5 62.9 0.132 2.09 1.3 92.8EAGLE LAKE 6/4/2002 G 0.2 ANP 6.31 4 39.9 54.9EAGLE LAKE 7/3/2002 G 0.2 ANP 6.32 4 37.7 38.4EAGLE LAKE 7/25/2002 G 0.2 ANP 6.79 3 39.18 46.5EAGLE LAKE 9/18/2002 G 0.2 ANP 6.52 1 38.7 93.4ECHO LAKE 5/23/2002 G 0.2 ANP 6.4 3 72.8 62.1ECHO LAKE 6/21/2002 C 7 ECL 5 75.6 1.2 4.4 0.167 2.82ECHO LAKE 6/21/2002 C 7 ANP 6.27 7 73.6 90.3ECHO LAKE 7/18/2002 G 0.2 ANP 6.8 5 73.32 87.5ECHO LAKE 8/23/2002 C 9 ANP 6.6 1 68.5 103ECHO LAKE 8/23/2002 C 9 ECL 3 76.8 2.6 2.7 0.189 2.9ECHO LAKE 9/13/2002 G 0.2 ANP 6.75 6 76.48 122JORDAN POND 4/24/2002 G 0.2 ECL 6.4 7 3 40.2 62.9 1.9 0.105 1.71 93.8JORDAN POND 4/24/2002 G 0.2 ANP 6.57 7 3 37.1 73.8JORDAN POND 5/24/2002 G 0.2 ANP 6.39 1 37.3 56.2JORDAN POND 6/20/2002 C 4 ANP 6.22 3 38.1 70.5JORDAN POND 6/20/2002 C 4 ECL 2 38.3 0.8 5.6 0.143 1.96JORDAN POND 7/18/2002 G 0.2 ANP 6.79 2 36.58 74JORDAN POND 8/22/2002 C 9 ECL 2 38.8 1.3 1.5 0.133 2.36JORDAN POND 8/22/2002 C 9 ANP 6.46 0 34.8 63.5JORDAN POND 9/19/2002 G 0.2 ANP 6.85 0 39.3 55.6JORDAN POND 10/22/2002 G 0.2 ECL 6.51 7.05 1 37.2 64.8 0.124 1.86 1.3 102.3LONG POND (MDI) 5/24/2002 G 0.2 ANP 6.33 6 46.4 53.3LONG POND (MDI) 7/24/2002 G 0.2 ANP 6.93 6 50.72 54.1LONG POND (MDI) 9/18/2002 G 0.2 ANP 6.57 3 50.4 45.5SARGENT MTN POND 4/30/2002 G 0.2 ANP 4.91 11 31.62 -4.43SARGENT MTN POND 4/30/2002 G 0.2 ECL 4.9 4.93 8 35.4 -7 2.7 0.139 3.37 22.5SARGENT MTN POND 10/21/2002 G 0.2 ECL 4.99 4.97 10 35.9 -9.5 0.223 3.88 0.7 29.4SEAL COVE POND 5/24/2002 G 0.2 ANP 6.33 3 47.6 57.7
Appendix A: Lake Chemistry 2002-2005 9

Description Start Date Sample Type
Depth (m)
Lab Code
QC Type
Closed Cell pH eqPH Color
(PCU)Conductivity
(µeq/L)ANC
(µg/L)
Chloro-phyll a (µg/L)
TP (µg/L)
TN (mg/L)
DOC (mg/L)
DIC (mg/L)
Ca (µeq/L)
SEAL COVE POND 6/21/2002 C 4 ANP 6.2 12 53.7 29.3SEAL COVE POND 6/21/2002 C 4 ECL 13 51.8 1.8 9.4 0.272 4.99SEAL COVE POND 7/24/2002 G 0.2 ANP 6.77 8 50.22 62.1SEAL COVE POND 8/28/2002 C 7 ECL 8 54.3 3.8 2.9 0.278 4.65SEAL COVE POND 8/28/2002 C 7 ANP 6.41 7 52.3 79.4SEAL COVE POND 9/13/2002 G 0.2 ANP 5.71 11 51.26 73.3THE BOWL 4/29/2002 G 0.2 ANP 5.93 7 41.5 19.3THE BOWL 4/29/2002 G 0.2 ECL 5.62 6.35 2 42.6 17 3.8 0.15 2.35 46.9THE BOWL 10/28/2002 G 0.2 ECL 5.95 6.72 7 44.5 31 0.262 4.14 1 48.9UPPER HADLOCK 5/22/2002 G 0.2 ANP 5.89 7 47.7 64.2UPPER HADLOCK 6/20/2002 C 4 ANP 5.94 8 50.1 53.5UPPER HADLOCK 6/20/2002 C 4 ECL 10 51.4 1.4 11 0.197 3.91UPPER HADLOCK 7/18/2002 G 0.2 ANP 6.36 9 50.34 39.3UPPER HADLOCK 8/29/2002 C 6 ANP 6.61 5 52.1 58.1UPPER HADLOCK 8/29/2002 C 6 ECL 4 54.5 2.8 4.4 0.249 3.69UPPER HADLOCK 9/19/2002 G 0.2 ANP 6.45 1 53 62.3WITCH HOLE POND 4/24/2002 G 0.2 ANP 5.98 6.5 21 30.3 32.9WITCH HOLE POND 4/24/2002 G 0.2 ECL 5.79 6.5 28 32.5 33.2 14 0.595 4.98 49.9WITCH HOLE POND 5/21/2002 G 0.2 ANP 5.82 19 28.9 56.9WITCH HOLE POND 6/19/2002 C 3 ANP 30 30.4WITCH HOLE POND 6/19/2002 C 3 ECL 33 30.6 3.6 15 0.42 5.31WITCH HOLE POND 7/19/2002 G 0.2 ANP 6.41 27 31 52.4WITCH HOLE POND 8/29/2002 C 3 ECL 27 32.7 6.2 7.4 0.502 6.65WITCH HOLE POND 8/29/2002 C 3 ANP 6.17 17 33.5 78.5WITCH HOLE POND 9/26/2002 G 0.2 ANP 6.44 38 31.9 73WITCH HOLE POND 10/22/2002 G 0.2 ECL 6.16 6.83 29 31.9 58.7 0.381 6.54 1.4 58.9
Appendix A: Lake Chemistry 2002-2005 10

Description Start Date Sample Type
Depth (m)
Lab Code
QC Type
BEAR BROOK POND 8/25/2005 G 0.2 ANP REGBUBBLE POND 4/21/2005 G 0.2 ANP REGBUBBLE POND 4/21/2005 G 0.2 ANP REPBUBBLE POND 4/21/2005 G 0.2 GMC REGBUBBLE POND 5/18/2005 G 0.2 ANP REGBUBBLE POND 5/18/2005 G 0.2 ANP REPBUBBLE POND 6/24/2005 G 0.2 ANP REGBUBBLE POND 7/14/2005 C 4.5 ANP REGBUBBLE POND 8/19/2005 G 0.2 ANP REGBUBBLE POND 9/22/2005 G 0.2 ANP REGBUBBLE POND 9/22/2005 G 0.2 ANP REGBUBBLE POND 9/22/2005 G 0.2 ANP DUPBUBBLE POND 9/22/2005 G 0.2 ANP DUPBUBBLE POND 10/18/2005 G 0.2 ANP REGBUBBLE POND 10/18/2005 G 0.2 GMC REGDUCK POND 8/4/2005 G 0.2 ANP REGDUCK POND 8/4/2005 G 0.2 ANP REPEAGLE LAKE 5/12/2005 G 0.2 ANP REGEAGLE LAKE 5/12/2005 G 0.2 ANP DUPEAGLE LAKE 6/27/2005 G 0.2 ANP REGEAGLE LAKE 6/27/2005 G 0.2 ANP REPEAGLE LAKE 7/19/2005 G 0.2 ANP REGEAGLE LAKE 8/23/2005 G 0.2 ANP REGEAGLE LAKE 8/23/2005 G 0.2 ANP REGEAGLE LAKE 9/27/2005 G 0.2 ANP REGEAGLE LAKE 10/31/2005 G 0.2 ANP REGECHO LAKE 5/19/2005 G 0.2 anp REGECHO LAKE 6/21/2005 C 3 ANP REGECHO LAKE 6/21/2005 C 3 GMC REGECHO LAKE 7/13/2005 C 4 ANP REGECHO LAKE 8/18/2005 C 8 ANP REGECHO LAKE 8/18/2005 C 8 GMC REGECHO LAKE 9/14/2005 G 0.2 ANP REGECHO LAKE 10/31/2005 G 0.2 ANP REG
Mg (µeq/L)
K (µeq/L)
Na (µeq/L)
Cl (µeq/L)
NO3 (µeq/L)
SO4 (µeq/L)
NH4 (mg/L)
Si (mg/L)
Al (µg/L)
Sample Event Code
176917351735
43.25 5.58 157.34 151.1 0.56 73 0.24 1.56 33.1 17351734173417491759177817861786178617861794
30.23 5.3 116.34 92.1 0.29 64.3 0 1.2 50 17941765176517431743175017501761177917791790180217441752175217571775177517851800
Appendix A: Lake Chemistry 2002-2005 11

Description Start Date Sample Type
Depth (m)
Lab Code
QC Type
FAWN POND 8/22/2005 G 0.5 ANP REGFAWN POND 8/22/2005 G 0.5 ANP REPHALFMOON POND 8/24/2005 G 0.2 ANP REGHODGDON POND 8/26/2005 G 0.2 ANP REGJORDAN POND 4/21/2005 G 0.2 ANP REGJORDAN POND 4/21/2005 G 0.2 GMC REGJORDAN POND 5/18/2005 G 0.2 ANP REGJORDAN POND 6/13/2005 C 4 ANP REGJORDAN POND 6/13/2005 C 4 GMC REGJORDAN POND 7/20/2005 C 6 ANP REGJORDAN POND 8/16/2005 C 8 ANP REGJORDAN POND 8/16/2005 C 8 GMC REGJORDAN POND 9/19/2005 G 0.2 ANP REGJORDAN POND 10/18/2005 G 0.2 ANP REGJORDAN POND 10/18/2005 G 0.2 GMC REGLAKE WOOD 9/2/2005 G 0.2 ANP REGLAKE WOOD 9/2/2005 G 0.2 ANP REPLONG POND (MDI) 5/19/2005 G 0.2 ANP REGLONG POND (MDI) 6/21/2005 G 0.2 ANP REGLONG POND (MDI) 7/13/2005 G 0.2 ANP REGLONG POND (MDI) 8/26/2005 G 0.2 ANP REGLONG POND (MDI) 9/30/2005 C 0.2 ANP REGLONG POND (MDI) 10/31/2005 G 0.5 ANP REGLOWER BREAKNECK 8/24/2005 G 0.2 ANP REGLOWER HADLOCK 8/19/2005 G 0.2 ANP REGMILL FIELD RESERVOIR 8/4/2005 G 0.2 ANP REGROUND POND 7/7/2005 G 0.2 ANP REGSARGENT MTN POND 5/2/2005 G 1 ANP REGSARGENT MTN POND 5/2/2005 G 0.2 GMC REGSARGENT MTN POND 9/2/2005 G 0.5 ANP REGSARGENT MTN POND 10/19/2005 G 0.2 GMC REGSEAL COVE POND 6/20/2005 C 5 ANP REGSEAL COVE POND 6/20/2005 C 5 ANP DUPSEAL COVE POND 6/20/2005 C 5 GMC REG
Mg (µeq/L)
K (µeq/L)
Na (µeq/L)
Cl (µeq/L)
NO3 (µeq/L)
SO4 (µeq/L)
NH4 (mg/L)
Si (mg/L)
Al (µg/L)
Sample Event Code
17761776178017671739
45.84 6.26 159.69 156.2 1.21 78.6 0.31 0.97 17.1 173917421753175317621771177117881795
42.19 5.94 147.2 144.5 0.13 72.9 0 0.88 21.3 17951784178417411751175617661792179917811777176417551740
18.98 5.9 103.35 95.9 0.32 52.1 0.11 0.5 236 17401783
18.01 5.07 96.64 84.6 2.36 57.4 0.1 0.68 185 1796174717471747
Appendix A: Lake Chemistry 2002-2005 12

Description Start Date Sample Type
Depth (m)
Lab Code
QC Type
SEAL COVE POND 7/22/2005 C 3 ANP REGSEAL COVE POND 8/17/2005 C 6 ANP REGSEAL COVE POND 8/17/2005 C 6 GMC REGSEAL COVE POND 9/28/2005 G 0.2 ANP REGSEAL COVE POND 10/31/2005 G 0.5 ANP REGTHE BOWL 4/26/2005 G 1 ANP REGTHE BOWL 4/26/2005 G 0.2 GMC REGTHE BOWL 8/22/2005 G 0.5 ANP REGTHE BOWL 10/18/2005 G 0.2 ANP REGTHE BOWL 10/18/2005 G 0.2 GMC REGTHE TARN 8/25/2005 G 0.2 ANP REGTHE TARN 8/25/2005 G 0.2 ANP DUPUPPER BREAKNECK 8/24/2005 G 0.2 ANP REGUPPER HADLOCK 5/17/2005 G 0.5 ANP REGUPPER HADLOCK 6/13/2005 G 0.2 ANP REGUPPER HADLOCK 6/13/2005 G 0.2 GMC REGUPPER HADLOCK 7/11/2005 C 4 ANP REGUPPER HADLOCK 8/15/2005 C 4 ANP REGUPPER HADLOCK 8/15/2005 C 4 GMC REGUPPER HADLOCK 9/19/2005 G 0.2 ANP REGUPPER HADLOCK 10/31/2005 G 0.2 ANP REGWITCH HOLE POND 4/26/2005 G 1 ANP REGWITCH HOLE POND 4/26/2005 G 0.2 GMC REGWITCH HOLE POND 5/17/2005 G 0.5 ANP REGWITCH HOLE POND 6/20/2005 C 3 ANP REGWITCH HOLE POND 6/20/2005 C 3 GMC REGWITCH HOLE POND 7/13/2005 C 4 ANP REGWITCH HOLE POND 7/13/2005 C 4 ANP DUPWITCH HOLE POND 8/18/2005 C 3 ANP REGWITCH HOLE POND 8/18/2005 C 3 ANP DUPWITCH HOLE POND 8/18/2005 C 3 GMC REGWITCH HOLE POND 9/21/2005 G 0.2 ANP REGWITCH HOLE POND 10/19/2005 G 0.2 GMC REGWITCH HOLE POND 10/19/2005 G 0.2 GMC REG
Mg (µeq/L)
K (µeq/L)
Na (µeq/L)
Cl (µeq/L)
NO3 (µeq/L)
SO4 (µeq/L)
NH4 (mg/L)
Si (mg/L)
Al (µg/L)
Sample Event Code
176317721772179117981738
44.25 4.66 191.43 193.7 0.82 70.7 0.57 0.83 28.6 173817731793
36.81 5.01 161.43 153 0 64.7 0 0.65 35.8 1793176817681782174517541754175817701770178918011737
32.66 5.64 131.48 120 0.47 34.4 0.51 0.89 28.9 17371746174817481760176017741774177417871797
29.88 5.64 113.2 96.6 0.21 31.9 0.01 0.93 51 1797
Appendix A: Lake Chemistry 2002-2005 13

Description Start Date Sample Type
Depth (m)
Lab Code
QC Type
AUNT BETTYS 7/20/2004 G 0.2 ANPBEAR BROOK POND 7/12/2004 G 0.2 ANPBEAR BROOK POND 7/12/2004 G 0.2 ANP DUPBEAR BROOK POND 7/12/2004 G 0.2 ANP REPBUBBLE POND 5/5/2004 G 0.2 GMCBUBBLE POND 7/6/2004 C 3 ANPBUBBLE POND 8/5/2004 G 0.2 ANP DUPBUBBLE POND 8/5/2004 G 0.2 ANPBUBBLE POND 8/27/2004 G 0.2 ANPBUBBLE POND 9/27/2004 G 0.2 ANPBUBBLE POND 9/27/2004 G 0.2 ANP DUPBUBBLE POND 10/20/2004 G 0.2 ANPBUBBLE POND 10/20/2004 G 0.2 GMCDUCK POND 8/5/2004 G 0.2 ANPEAGLE LAKE 5/20/2004 G 0.2 ANPEAGLE LAKE 6/16/2004 G 0.2 ANPEAGLE LAKE 7/20/2004 G 0.2 ANP DUPEAGLE LAKE 7/20/2004 G 0.2 ANPEAGLE LAKE 9/1/2004 G 0.2 ANPEAGLE LAKE 9/27/2004 G 0.2 ANPECHO LAKE 6/21/2004 C 4 GMCECHO LAKE 6/21/2004 C 4 ANPECHO LAKE 7/20/2004 G 4 ANPECHO LAKE 8/25/2004 C 9 ANPECHO LAKE 8/25/2004 C 9 GMCECHO LAKE 9/14/2004 C 10 ANPFAWN POND 8/6/2004 G 0.8 ANPHALFMOON POND 7/14/2004 G 0.2 ANPHODGDON POND 8/4/2004 G 0.2 ANPJORDAN POND 5/5/2004 G 0.2 GMCJORDAN POND 6/17/2004 C 7 ANPJORDAN POND 6/17/2004 C 7 GMC
Mg (µeq/L)
K (µeq/L)
Na (µeq/L)
Cl (µeq/L)
NO3 (µeq/L)
SO4 (µeq/L)
NH4 (mg/L)
Si (mg/L)
Al (µg/L)
Sample Event Code
1701169216921692
45.2 7.2 165.3 166.4 2.1 70.8 0.05 1.63 51.7 16801691170717071712172617261733
44.31 6.49 167.27 151.4 72.1 0.05 1.5 11.9 17331708167416851699169917171725168416841700172117211719170616961704
48.5 6.4 166.2 163.6 1 79.2 0.05 0.9 13.5 167916881688
Appendix A: Lake Chemistry 2002-2005 14

Description Start Date Sample Type
Depth (m)
Lab Code
QC Type
JORDAN POND 7/7/2004 C 6 ANPJORDAN POND 8/9/2004 C 10 GMCJORDAN POND 8/9/2004 C 10 ANPJORDAN POND 9/24/2004 C 10 ANPJORDAN POND 10/20/2004 G 0.2 ANPJORDAN POND 10/20/2004 G 0.2 GMCJORDAN POND 10/20/2004 G 0.2 ANP REPLAKE WOOD 8/24/2004 G 0.2 ANPLONG POND (MDI) 6/30/2004 G 0.2 ANPLONG POND (MDI) 7/29/2004 G 0.2 ANPLONG POND (MDI) 8/26/2004 G 0.2 ANPLONG POND (MDI) 8/26/2004 G 0.2 ANP DUPLONG POND (MDI) 9/20/2004 G 0.2 ANPLOWER BREAKNECK 7/14/2004 G 0.2 ANPLOWER BREAKNECK 7/14/2004 G 0.2 ANP REPLOWER HADLOCK 8/4/2004 G 0.2 ANPMILL FIELD RESERVOIR 7/19/2004 G 0.8 ANPSARGENT MTN POND 5/4/2004 G 0.2 ANPSARGENT MTN POND 5/4/2004 G 0.2 GMCSARGENT MTN POND 8/12/2004 G 0.75 ANPSARGENT MTN POND 10/20/2004 G 0.2 GMCSARGENT MTN POND 10/20/2004 G 0.2 ANPSEAL COVE POND 6/23/2004 C 4 ANPSEAL COVE POND 6/23/2004 C 4 GMCSEAL COVE POND 7/29/2004 C 6 ANPSEAL COVE POND 8/25/2004 C 9 GMCSEAL COVE POND 8/25/2004 C 9 ANPSEAL COVE POND 9/16/2004 C 4 ANPTHE BOWL 4/14/2004 G 0.2 ANPTHE BOWL 4/14/2004 G 0.2 GMCTHE BOWL 8/23/2004 G 0.75 ANPTHE BOWL 10/19/2004 G 0.2 GMCTHE BOWL 10/19/2004 G 0.2 ANPTHE TARN 7/12/2004 G 0.25 ANP
Mg (µeq/L)
K (µeq/L)
Na (µeq/L)
Cl (µeq/L)
NO3 (µeq/L)
SO4 (µeq/L)
NH4 (mg/L)
Si (mg/L)
Al (µg/L)
Sample Event Code
16901711171117241732
47.43 6.54 165.3 159.1 0.08 76.1 0.05 0.82 7.78 1732173217141682170217131713172316941694170516981678
27.1 11.8 137 146.7 0.5 56.2 0.05 0.46 166 16781715
24.68 10 143.69 135.3 0.14 62.8 0.05 0.44 146 173117311683168317031722172217201681
52.6 6.6 222.7 237 2.6 70.8 0.05 0.52 25.8 16811716
49.4 5.6 220.1 217.2 64.6 0.05 0.25 10.7 172817281693
Appendix A: Lake Chemistry 2002-2005 15

Description Start Date Sample Type
Depth (m)
Lab Code
QC Type
UPPER BREAKNECK 7/14/2004 G 0.2 ANPUPPER HADLOCK 5/21/2004 G 0.2 ANPUPPER HADLOCK 6/17/2004 G 0.2 GMCUPPER HADLOCK 6/17/2004 G 0.2 ANPUPPER HADLOCK 7/7/2004 C 4 ANPUPPER HADLOCK 8/10/2004 C 4 ANP REPUPPER HADLOCK 8/10/2004 C 4 GMCUPPER HADLOCK 8/10/2004 C 4 ANPUPPER HADLOCK 9/27/2004 C 4 ANPWITCH HOLE POND 5/6/2004 G 0.2 ANPWITCH HOLE POND 5/6/2004 G 0.2 GMCWITCH HOLE POND 5/21/2004 G 0.2 ANPWITCH HOLE POND 5/21/2004 G 0.2 ANPWITCH HOLE POND 6/16/2004 C 3 ANPWITCH HOLE POND 6/16/2004 C 3 GMCWITCH HOLE POND 7/16/2004 C 4 ANPWITCH HOLE POND 8/10/2004 C 3 GMCWITCH HOLE POND 8/10/2004 C 3 ANPWITCH HOLE POND 9/20/2004 C 4 ANP REPWITCH HOLE POND 9/20/2004 C 4 ANPWITCH HOLE POND 10/19/2004 G 0.2 ANP DUPWITCH HOLE POND 10/19/2004 G 0.2 GMCWITCH HOLE POND 10/19/2004 G 0.2 ANP
AUNT BETTYS 8/21/2003 G 0.2 ANPBEAR BROOK POND 8/13/2003 G 0.2 ANPBUBBLE POND 5/14/2003 G 0.2 ANPBUBBLE POND 5/14/2003 G 0.2 ECLBUBBLE POND 7/2/2003 G 0.2 ANPBUBBLE POND 7/30/2003 C 6 ANPBUBBLE POND 8/26/2003 G 0.2 ANPBUBBLE POND 10/3/2003 G 0.2 ANPBUBBLE POND 10/22/2003 G 0.2 ANP
Mg (µeq/L)
K (µeq/L)
Na (µeq/L)
Cl (µeq/L)
NO3 (µeq/L)
SO4 (µeq/L)
NH4 (mg/L)
Si (mg/L)
Al (µg/L)
Sample Event Code
1695167516871687168917101710171017271677
40.3 7.9 156.2 146.7 0 33.3 0.05 0.54 31.4 16771676167616861686169717091709171817181730
39.95 6.39 164.52 143.5 0.18 24.6 0.05 0.53 18.1 17301730
163116231656
37.02 5.37 143.12 134 1.1 70.5 0.05 1.9 40.9 165616361644163516601663
Appendix A: Lake Chemistry 2002-2005 16

Description Start Date Sample Type
Depth (m)
Lab Code
QC Type
BUBBLE POND 10/22/2003 G 0.2 ECLEAGLE LAKE 6/18/2003 G ANPEAGLE LAKE 7/17/2003 G 0.2 ANPEAGLE LAKE 8/20/2003 G 0.2 ANPEAGLE LAKE 9/17/2003 G 0.2 ANPECHO LAKE 5/30/2003 G 0.2 ANPECHO LAKE 6/16/2003 G 0.2 ANPECHO LAKE 6/16/2003 G 0.2 ECLECHO LAKE 7/8/2003 C 6 ANPECHO LAKE 8/15/2003 C 4 ECLECHO LAKE 8/15/2003 C 4 ANPECHO LAKE 9/17/2003 G 0.2 ANPHODGDON POND 8/21/2003 G 0.2 ANPJORDAN POND 5/14/2003 G 0.2 ECLJORDAN POND 5/14/2003 G 0.2 ANPJORDAN POND 6/24/2003 C 3 ECLJORDAN POND 6/24/2003 C 3 ANPJORDAN POND 7/25/2003 G 0.2 ANPJORDAN POND 8/12/2003 C 7 ECLJORDAN POND 8/12/2003 C 7 ANPJORDAN POND 9/9/2003 G 0.2 ANPJORDAN POND 10/28/2003 G 0.2 ECLJORDAN POND 10/28/2003 G 0.2 ANPLAKE WOOD 8/14/2003 G 0.2 ANPLONG POND (MDI) 6/25/2003 G 0.2 ANPLONG POND (MDI) 7/17/2003 G 0.2 ANPLONG POND (MDI) 8/15/2003 G 0.2 ANPLONG POND (MDI) 9/17/2003 G 0.2 ANPLOWER BREAKNECK 8/22/2003 G 0.2 ANPLOWER HADLOCK 8/11/2003 G 0.2 ANPSARGENT MTN POND 5/6/2003 G 0.2 ANPSARGENT MTN POND 5/6/2003 G 0.2 ECLSARGENT MTN POND 8/18/2003 G 0.2 ANPSARGENT MTN POND 10/28/2003 G 0.2 ECL
Mg (µeq/L)
K (µeq/L)
Na (µeq/L)
Cl (µeq/L)
NO3 (µeq/L)
SO4 (µeq/L)
NH4 (mg/L)
Si (mg/L)
Al (µg/L)
Sample Event Code
38.66 5.63 158.34 140 0.5 72.3 0.05 1.5 11.5 1663164716411629166916591646164616371627162716681630
41.95 6.648 146.6 152 1 75.7 0.05 2 14.3 16551655164916491643162116211666
46.07 6.39 145.73 156 0.5 76.8 0.05 0.84 10 1665166516251650164016261670163216191652
21.39 8.95 113.1 107 1 55.1 0.05 1.8 173 16521628
26.32 8.18 127.02 141 0.5 59.9 0.05 0.83 247 1664
Appendix A: Lake Chemistry 2002-2005 17

Description Start Date Sample Type
Depth (m)
Lab Code
QC Type
SARGENT MTN POND 10/28/2003 G 0.2 ANPSEAL COVE POND 5/21/2003 G 0.2 ANPSEAL COVE POND 6/26/2003 C 3 ECLSEAL COVE POND 6/26/2003 C 3 ANPSEAL COVE POND 7/18/2003 C 6 ANPSEAL COVE POND 8/14/2003 C 4 ANPSEAL COVE POND 8/14/2003 C 4 ECLSEAL COVE POND 9/12/2003 G 0.2 ANPTHE BOWL 5/14/2003 G 0.2 ANPTHE BOWL 5/14/2003 G 0.2 ECLTHE BOWL 8/12/2003 G 0.2 ANPTHE BOWL 10/20/2003 G 0.2 ANPTHE BOWL 10/20/2003 G 0.2 ECLTHE TARN 8/13/2003 G 0.2 ANPUPPER BREAKNECK 8/22/2003 G 0.2 ANPUPPER HADLOCK 5/29/2003 G 0.2 ANPUPPER HADLOCK 6/18/2003 G 0.2 ANPUPPER HADLOCK 6/18/2003 G 0.2 ECLUPPER HADLOCK 7/16/2003 G 0.2 ANPUPPER HADLOCK 8/11/2003 C 6 ANPUPPER HADLOCK 8/11/2003 C 6 ECLUPPER HADLOCK 9/22/2003 G 0.2 ANPWITCH HOLE POND 5/8/2003 G 0.2 ECLWITCH HOLE POND 5/8/2003 G 0.2 ANPWITCH HOLE POND 6/13/2003 G 0.2 ECLWITCH HOLE POND 6/13/2003 G 0.2 ANPWITCH HOLE POND 7/16/2003 G 0.2 ANPWITCH HOLE POND 8/22/2003 C 3 ANPWITCH HOLE POND 8/22/2003 C 3 ECLWITCH HOLE POND 9/18/2003 G 0.2 ANPWITCH HOLE POND 10/20/2003 G 0.2 ANPWITCH HOLE POND 10/20/2003 G 0.2 ECL
Mg (µeq/L)
K (µeq/L)
Na (µeq/L)
Cl (µeq/L)
NO3 (µeq/L)
SO4 (µeq/L)
NH4 (mg/L)
Si (mg/L)
Al (µg/L)
Sample Event Code
166416571651165116421624162416671654
40.31 6.137 180.53 177 1 72.5 0.05 0.5 24.3 165416201662
42.78 6.9 204.45 191 0.5 67.1 0.05 0.26 11.5 1662162216331658164816481638161816181672
29.61 5.625 124.41 119 1 37.2 0.05 2.4 35.8 165316531645164516391634163416711661
37.02 6.9 159.65 136 0.5 30.2 0.05 0.48 22.2 1661
Appendix A: Lake Chemistry 2002-2005 18

Description Start Date Sample Type
Depth (m)
Lab Code
QC Type
BUBBLE POND 4/24/2002 G 0.2 ECLBUBBLE POND 4/24/2002 G 0.2 ANPBUBBLE POND 6/13/2002 G 0.2 ANPBUBBLE POND 7/25/2002 G 0.2 ANPBUBBLE POND 9/11/2002 G 0.2 ANPBUBBLE POND 10/22/2002 G 0.2 ECLEAGLE LAKE 6/4/2002 G 0.2 ANPEAGLE LAKE 7/3/2002 G 0.2 ANPEAGLE LAKE 7/25/2002 G 0.2 ANPEAGLE LAKE 9/18/2002 G 0.2 ANPECHO LAKE 5/23/2002 G 0.2 ANPECHO LAKE 6/21/2002 C 7 ECLECHO LAKE 6/21/2002 C 7 ANPECHO LAKE 7/18/2002 G 0.2 ANPECHO LAKE 8/23/2002 C 9 ANPECHO LAKE 8/23/2002 C 9 ECLECHO LAKE 9/13/2002 G 0.2 ANPJORDAN POND 4/24/2002 G 0.2 ECLJORDAN POND 4/24/2002 G 0.2 ANPJORDAN POND 5/24/2002 G 0.2 ANPJORDAN POND 6/20/2002 C 4 ANPJORDAN POND 6/20/2002 C 4 ECLJORDAN POND 7/18/2002 G 0.2 ANPJORDAN POND 8/22/2002 C 9 ECLJORDAN POND 8/22/2002 C 9 ANPJORDAN POND 9/19/2002 G 0.2 ANPJORDAN POND 10/22/2002 G 0.2 ECLLONG POND (MDI) 5/24/2002 G 0.2 ANPLONG POND (MDI) 7/24/2002 G 0.2 ANPLONG POND (MDI) 9/18/2002 G 0.2 ANPSARGENT MTN POND 4/30/2002 G 0.2 ANPSARGENT MTN POND 4/30/2002 G 0.2 ECLSARGENT MTN POND 10/21/2002 G 0.2 ECLSEAL COVE POND 5/24/2002 G 0.2 ANP
Mg (µeq/L)
K (µeq/L)
Na (µeq/L)
Cl (µeq/L)
NO3 (µeq/L)
SO4 (µeq/L)
NH4 (mg/L)
Si (mg/L)
Al (µg/L)
Sample Event Code
37.02 5.88 173.1 150 1.2 78 0.05 1.59 38 14591459147014831492
42 6.1 163.6 160 0.01 78 0.05 1.2 10 150014691476148414931465147414741479148614861491
41.95 7.42 180.1 160 1.3 80 0.05 0.96 12 145814581466147214721477148514851495
46.1 6.9 156.6 160 0.01 79 0.05 0.62 10 14991468148214941462
26.32 7.16 165.3 131 0.4 78 0.05 0.47 245 146231.3 9.2 162.3 160 0.01 86 0.05 0.42 169 1498
1467
Appendix A: Lake Chemistry 2002-2005 19

Description Start Date Sample Type
Depth (m)
Lab Code
QC Type
SEAL COVE POND 6/21/2002 C 4 ANPSEAL COVE POND 6/21/2002 C 4 ECLSEAL COVE POND 7/24/2002 G 0.2 ANPSEAL COVE POND 8/28/2002 C 7 ECLSEAL COVE POND 8/28/2002 C 7 ANPSEAL COVE POND 9/13/2002 G 0.2 ANPTHE BOWL 4/29/2002 G 0.2 ANPTHE BOWL 4/29/2002 G 0.2 ECLTHE BOWL 10/28/2002 G 0.2 ECLUPPER HADLOCK 5/22/2002 G 0.2 ANPUPPER HADLOCK 6/20/2002 C 4 ANPUPPER HADLOCK 6/20/2002 C 4 ECLUPPER HADLOCK 7/18/2002 G 0.2 ANPUPPER HADLOCK 8/29/2002 C 6 ANPUPPER HADLOCK 8/29/2002 C 6 ECLUPPER HADLOCK 9/19/2002 G 0.2 ANPWITCH HOLE POND 4/24/2002 G 0.2 ANPWITCH HOLE POND 4/24/2002 G 0.2 ECLWITCH HOLE POND 5/21/2002 G 0.2 ANPWITCH HOLE POND 6/19/2002 C 3 ANPWITCH HOLE POND 6/19/2002 C 3 ECLWITCH HOLE POND 7/19/2002 G 0.2 ANPWITCH HOLE POND 8/29/2002 C 3 ECLWITCH HOLE POND 8/29/2002 C 3 ANPWITCH HOLE POND 9/26/2002 G 0.2 ANPWITCH HOLE POND 10/22/2002 G 0.2 ECL
Mg (µeq/L)
K (µeq/L)
Na (µeq/L)
Cl (µeq/L)
NO3 (µeq/L)
SO4 (µeq/L)
NH4 (mg/L)
Si (mg/L)
Al (µg/L)
Sample Event Code
1475147514811487148714901461
41.95 6.14 235.8 213 0.9 77 0.05 0.77 26 146148.5 6.9 228.4 240 0.01 75 0.05 0.29 27.9 1502
14641473147314781488148814961460
34.55 6.65 171.4 140 0.3 54 0.05 0.53 50 14601463147114711480148914891497
42.8 6.1 169.2 150 0.01 40 0.05 0.29 27.9 1501- In Sample Type field (G) = grab samples taken just below lake surface, (C) = core samples taken within the epilimnion; "Sample Depth" field indicates maximum sample depth.- Lab code indicates which lab performed chemical analysis. ECL = U. Maine Environmental Chemistry Lab; GMC = U. Maine George Mitchell Center lab; ANP = Acadia National Park.
Appendix A: Lake Chemistry 2002-2005 20

APPENDIX B Weekly Lake Stage and Precipitation Graphs: 2002-2005

Appendix B 1
* Measured with Belfort rain gauge at McFarland Hill NADP site. Lake levels were read on a weekly basis, though some weeks were skipped. Thus, precipitation bars represent amount of rainfall accumulated since previous date represented. The first bar indicates amount accumulated within preceding 7 days.
Weekly Lake Stage and PrecipitationMay- September 2002
5/17
5/31 6/7
6/14
6/28 7/5
7/12
7/19
7/26 8/9
8/16
8/23
8/30 9/6
9/13
9/20
0
0.5
1
1.5
-0.5
-1
-1.5
-2
-2.5
-3
Stag
e he
ight
from
dat
um (f
eet)
0
0.5
1
1.5
2
2.5
3
3.5
4
4.5
Precipitation (inches)*
ppt in Eagle Bubble Echo JordanSeal Cove U Hadlock Witch Hole Tarn
Stage height datum

Appendix B 2
Weekly Lake Stage and PrecipitationMay- October 2003
5/23
5/30 6/6
6/13
6/20
6/27 7/4
7/11
7/18
7/25 8/
1
8/8
8/15
8/22
8/29 9/5
9/12
9/19
9/26
10/3
10/2
4
0
0.5
1
1.5
-0.5
-1
-1.5
-2
-2.5
-3
Stag
e he
ight
from
dat
um (f
eet)
0
0.5
1
1.5
2
2.5
3
3.5
4
4.5Precipitation (inches)*
ppt in Eagle Bubble Echo JordanSeal Cove U Hadlock Witch Hole Tarn
Stage height datum
* Measured with Belfort rain gauge at McFarland Hill NADP site. Lake levels were read on a weekly basis, though some weeks were skipped. Thus, precipitation bars represent amount of rainfall accumulated since previous date represented. The first bar indicates amount accumulated within preceding 7 days.

Appendix B 3
Weekly Lake Stage and PrecipitationApril - October 2004
4/30
5/21
5/28 6/
4
6/11
6/18
6/25 7/
2
7/9
7/16
7/23
7/30 8/
6
8/13
8/20
8/27 9/
3
9/13
9/20
9/27
10/1
5
0
0.5
1
1.5
-0.5
-1
-1.5
-2
-2.5
-3
Stag
e he
ight
from
dat
um (f
eet)
0
0.5
1
1.5
2
2.5
3
3.5
4
4.5Precipitation (inches)*
ppt in Eagle Bubble Echo JordanSeal Cove U Hadlock Witch Hole Tarn
Stage height datum
* Measured with Belfort rain gauge at McFarland Hill NADP site. Lake levels were read on a weekly basis, though some weeks were skipped. Thus, precipitation bars represent amount of rainfall accumulated since previous date represented. The first bar indicates amount accumulated within preceding 7 days.

Appendix B 4
Weekly Lake Stage and PrecipitationApril - December 2005
4/22
4/29
5/13
5/20
5/27 6/
36/
106/
166/
23 7/1
7/7
7/15
7/22
7/29 8/
48/
118/
198/
25 9/2
9/8
9/16
9/23
9/30
10/7
10/1
410
/21
10/2
811
/411
/10
11/1
712
/1
0
0.5
1
1.5
2
-0.5
-1
-1.5
-2
-2.5
-3
Stag
e he
ight
from
dat
um (f
eet)
0
1
2
3
4
5
6
7
8
9
10
11
12Precipitation (inches)*
ppt in Eagle Bubble Echo JordanSeal Cove U Hadlock Witch Hole Tarn
Stage height datum
* Measured with Belfort rain gauge at McFarland Hill NADP site. Lake levels were read on a weekly basis, though some weeks were skipped. Thus, precipitation bars represent amount of rainfall accumulated since previous date represented. The first bar indicates amount accumulated within preceding 7 days.

APPENDIX C Transparency Graphs: 1980-2005

TRANSPARENCY GRAPHS
Explanation of the Trophic State Index (TSI) (from Heiskary and Lindbloom, 1993) The trophic state index, developed by limnologist Dr.Robert Carlson, is one means to evaluate the trophic status of a lake and to interpret the relationship between total phosphorus, chlorophyll a, and Secchi transparency. TSI values are calculated as follows:
Secchi disk TSI = 60-14.41 ln(Secchi depth in meters)
Interpretation: TSI < 30: Classic oligotrophic lake- clear water, hypolimnion well-oxygenated throughout the year. TSI 30-40: Deeper lakes exhibit classical oligotrophy, shallower lakes may become anoxic in the hypolimnion during the summer. TSI 40-50: Water relatively clear, but increasing probability of anoxia in hypolimnion during summer. TSI 50-60: Lower boundary of classic eutrophy: Decreased transparency, anoxic hypolimnia duning the summer, macrophyte problems evident, warm-water fisheries only. TSI 60-70: Dominance of blue-green algae, algal scums probable, extensive macrophyte problems. TSI 70-80: Heavy algal blooms possible throughout the summer, dense macrophyte beds, but extent limited by light penetration. Often would be classified as hypertrophic. TSI >80: Algal scums, summer fish kills, few macrophytes, dominance of rough fish. An increase of ten units represents a doubling of algal biomass
Trophic State Index (TSI) 1996-2005
0
5
10
15
20
25
30
35
40
45
Bubble Eagle Echo Jordan Long (MDI) Seal Cove U. Hadlock Witch Hole
TSI
Mean Secchi Depth 1996-2005
0
2
4
6
8
10
12
14
16
Bubble Eagle Echo Jordan Long (MDI) Seal Cove U. Hadlock Witch Hole
Secc
hi D
epth
(m)
(Error bars represent 95% confidence interval)

Appendix C 2
Annual Mean Transparency: Eagle Lake
0.0
2.0
4.0
6.0
8.0
10.0
12.0
14.0
16.0
18.0
20.0
22.0
24.0
1980
1981
1982
1983
1984
1985
1986
1987
1988
1989
1990
1991
1992
1993
1994
1995
1996
1997
1998
1999
2000
2001
2002
2003
2004
2005
Year
0
5
10
15
20
25
30
35
Annual Mean Secchi TSI
Secc
hi D
epth
(m)
(Error bars represent 95% confidence interval; Greater C.I. ranges are influenced by varying intra-annual sample frequencies;Points w ith no error bars were years with < 2 measurements)
Trop
hic
Stat
e In
dex
(TSI
)
Annual Mean Transparency: Bubble Pond
0.0
2.0
4.0
6.0
8.0
10.0
12.0
14.0
16.0
18.0
20.0
22.0
24.0
80 81 82 83 84 85 86 87 88 89 90 91 92 93 94 95 96 97 98 99 00 01 02 03 04 05
Year
0
5
10
15
20
25
30
35
Annual Mean Secchi TSI
(Error bars represent 95% confidence interval; Greater C.I. ranges are influenced by varying intra-annual sample frequencies;Points with no error bars were years with < 2 measurements)
Secc
hi D
epth
(m)
Trop
hic
Stat
e In
dex
(TSI
)

Appendix C 3
Annual Mean Transparency: Echo Lake
0.0
2.0
4.0
6.0
8.0
10.0
12.0
14.0
16.0
18.0
20.0
22.0
24.0
1980
1981
1982
1983
1984
1985
1986
1987
1988
1989
1990
1991
1992
1993
1994
1995
1996
1997
1998
1999
2000
2001
2002
2003
2004
2005
Year
0
5
10
15
20
25
30
35
Annual Mean Secchi TSI
(Error bars represent 95% confidence interval; Greater C.I. ranges are influenced by varying intra-annual sample frequencies;Points w ith no error bars were years with < 2 measurements)
Secc
hi D
epth
(m)
Trop
hic
Stat
e In
dex
(TSI
)
Annual Mean Transparency: Jordan Pond
02468
101214161820222426283032
1980
1981
1982
1983
1984
1985
1986
1987
1988
1989
1990
1991
1992
1993
1994
1995
1996
1997
1998
1999
2000
2001
2002
2003
2004
2005
Year
0
5
10
15
20
25
30
35
Annual Mean Secchi TSI
(Error bars represent 95% confidence interval; Greater C.I. ranges are influenced by varying intra-annual sample frequencies;Points with no error bars were years with < 2 measurements or, as in 1981 CI = 12.6 which was too large to display on graph.)
Secc
hi D
epth
(m)
Trop
hic
Stat
e In
dex
(TSI
)

Appendix C 4
Annual Mean Transparency: Long Pond
0.0
2.0
4.0
6.0
8.0
10.0
12.0
14.0
16.0
18.0
20.0
22.0
24.0
1980
1981
1982
1983
1984
1985
1986
1987
1988
1989
1990
1991
1992
1993
1994
1995
1996
1997
1998
1999
2000
2001
2002
2003
2004
2005
Year
0
5
10
15
20
25
30
35
Annual Mean Secchi TSI
(Error bars represent 95% confidence interval; Greater C.I. ranges are influenced by varying intra-annual sample frequencies;Points with no error bars were years with < 2 measurements)
Secc
hi D
epth
(m)
Trop
hic
Stat
e In
dex
(TSI
)
Annual Mean Transparency: Seal Cove Pond
0.0
2.0
4.0
6.0
8.0
10.0
12.0
14.0
16.0
18.0
20.0
22.0
24.0
1980
1981
1982
1983
1984
1985
1986
1987
1988
1989
1990
1991
1992
1993
1994
1995
1996
1997
1998
1999
2000
2001
2002
2003
2004
2005
Year
0
5
10
15
20
25
30
35
40
Annual Mean Secchi TSI
(Error bars represent 95% confidence interval; Greater C.I. ranges are influenced by varying intra-annual sample frequencies;Points w ith no error bars were years w ith < 2 measurements)
Secc
hi D
epth
(m)
Trop
hic
Stat
e In
dex
(TSI
)
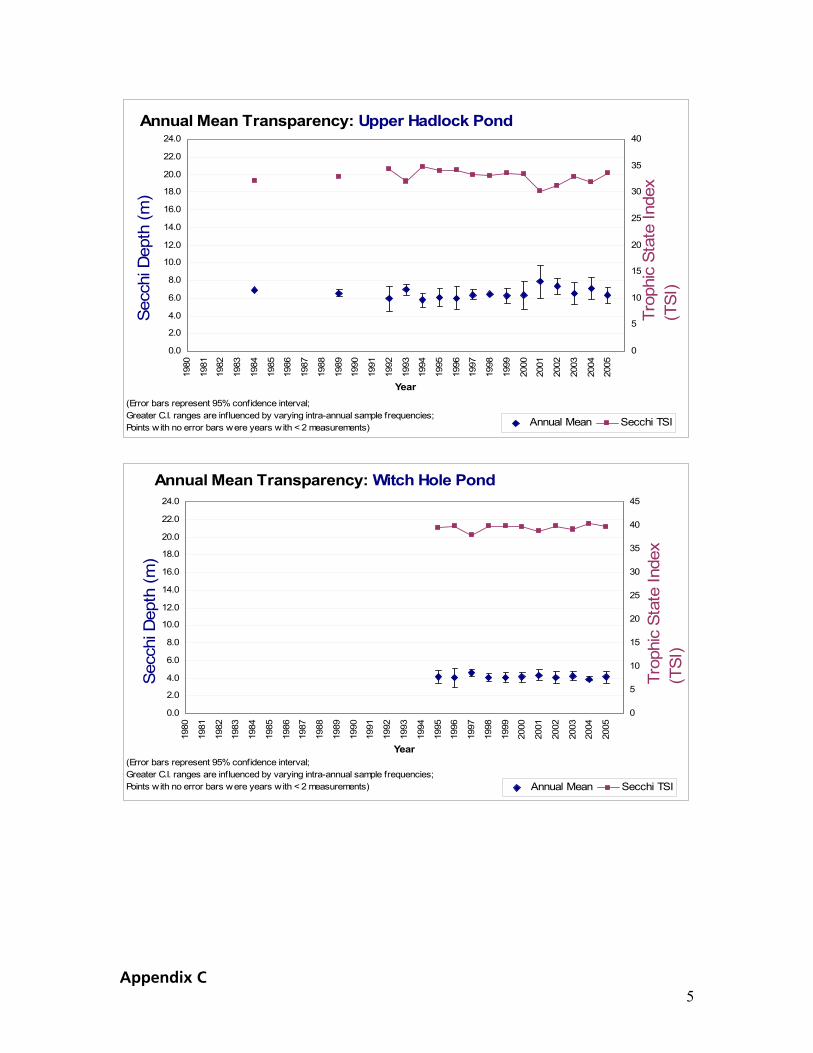
Appendix C 5
Annual Mean Transparency: Upper Hadlock Pond
0.0
2.0
4.0
6.0
8.0
10.0
12.0
14.0
16.0
18.0
20.0
22.0
24.0
1980
1981
1982
1983
1984
1985
1986
1987
1988
1989
1990
1991
1992
1993
1994
1995
1996
1997
1998
1999
2000
2001
2002
2003
2004
2005
Year
0
5
10
15
20
25
30
35
40
Annual Mean Secchi TSI
(Error bars represent 95% confidence interval; Greater C.I. ranges are influenced by varying intra-annual sample frequencies;Points w ith no error bars were years w ith < 2 measurements)
Secc
hi D
epth
(m)
Trop
hic
Stat
e In
dex
(TSI
)
Annual Mean Transparency: Witch Hole Pond
0.0
2.0
4.0
6.0
8.0
10.0
12.0
14.0
16.0
18.0
20.0
22.0
24.0
1980
1981
1982
1983
1984
1985
1986
1987
1988
1989
1990
1991
1992
1993
1994
1995
1996
1997
1998
1999
2000
2001
2002
2003
2004
2005
Year
0
5
10
15
20
25
30
35
40
45
Annual Mean Secchi TSI
Secc
hi D
epth
(m)
Trop
hic
Stat
e In
dex
(TSI
)
(Error bars represent 95% confidence interval; Greater C.I. ranges are influenced by varying intra-annual sample frequencies;Points w ith no error bars were years with < 2 measurements)

APPENDIX D Dissolved Oxygen and Temperature Graphs: 1995-2005
Appendix D 1
Mean Hypolimnion Temperature (All Lakes)
0
2
4
6
8
10
12
1995 1996 1997 1998 1999 2000 2001 2002 2003 2004 2005
Year
Tem
pera
ture
(C)
Mean hypolimnion temperature
(Error bars represent 95% confidence interval; Greater C.I. ranges are influenced by varying intra-annual sample frequencies)
Mean Hypolimnion Depth and Dissolved Oxygen (All Lakes)
0
5
10
15
20
25
1995 1996 1997 1998 1999 2000 2001 2002 2003 2004 2005
Year
Dep
th (m
)
56789101112131415
Mean hypolimnion depth Mean hypolimnion DO
(Error bars represent 95% confidence interval; Greater C.I. ranges are influenced by varying intra-annual sample frequencies)

Appendix D 2
Mean Hypolimnion Temperature (Eagle Lake)
0
2
4
6
8
10
12
14
16
18
1995 1996 1997 1998 1999 2000 2001 2002 2003 2004 2005
Year
Tem
pera
ture
(C)
Mean hypolimnion temperature
(Error bars represent 95% confidence interval; Greater C.I. ranges are influenced by varying intra-annual sample frequencies)
Mean Hypolimnion Depth and Dissolved Oxygen (Eagle Lake)
0
5
10
15
20
25
30
1995 1996 1997 1998 1999 2000 2001 2002 2003 2004 2005
Year
Dep
th (m
)
0
2
4
6
8
10
12
14
16
18
20
Mean hypolimnion depth Mean hypolimnion DO
(Error bars represent 95% confidence interval; Greater C.I. ranges are influenced by varying intra-annual sample frequencies)

Appendix D 3
Mean Hypolimnion Depth and Dissolved Oxygen (Echo Lake)
0
5
10
15
20
1995 1996 1997 1998 1999 2000 2001 2002 2003 2004 2005
Year
Dep
th (m
)
0
2
4
6
8
10
12
14
16
Mean hypolimnion depth Mean hypolimnion DO
(Error bars represent 95% confidence interval; Greater C.I. ranges are influenced by varying intra-annual sample frequencies)
Mean Hypolimnion Temperature (Echo Lake)
0
2
4
6
8
10
12
14
16
1995 1996 1997 1998 1999 2000 2001 2002 2003 2004 2005
Year
Tem
pera
ture
(C)
Mean hypolimnion temperature
(Error bars represent 95% confidence interval; Greater C.I. ranges are influenced by varying intra-annual sample frequencies)

Appendix D 4
Mean Hypolimnion Depth and Dissolved Oxygen (Jordan Pond)
0
5
10
15
20
25
30
35
1995 1996 1997 1998 1999 2000 2001 2002 2003 2004 2005
Year
Dep
th (m
)
0
2
4
6
8
10
12
14
16
Mean hypolimnion depth Mean hypolimnion DO
(Error bars represent 95% confidence interval; Greater C.I. ranges are influenced by varying intra-annual sample frequencies)
Mean Hypolimnion Temperature (Jordan Pond)
0
1
2
3
4
5
6
7
8
9
1995 1996 1997 1998 1999 2000 2001 2002 2003 2004 2005
Year
Tem
pera
ture
(C)
Mean hypolimnion temperature
(Error bars represent 95% confidence interval; Greater C.I. ranges are influenced by varying intra-annual sample frequencies)

Appendix D 5
Mean Hypolimnion Depth and Dissolved Oxygen (Long Pond)
0
5
10
15
20
25
30
1997 1998 1999 2000 2001 2002 2003 2004 2005
Year
Dep
th (m
)
0
2
4
6
8
10
12
14
16
Mean hypolimnion depth Mean hypolimnion DO
(Error bars represent 95% confidence interval; Greater C.I. ranges are influenced by varying intra-annual sample frequencies)
Mean Hypolimnion Temperature (Long Pond)
0
2
4
6
8
10
12
14
1997 1998 1999 2000 2001 2002 2003 2004 2005
Year
Tem
pera
ture
(C)
Mean hypolimnion temperature
(Error bars represent 95% confidence interval; Greater C.I. ranges are influenced by varying intra-annual sample frequencies)

Appendix D 6
Mean Hypolimnion Depth and Dissolved Oxygen (Seal Cove Pond)
0
5
10
15
20
1995 1996 1997 1998 1999 2000 2001 2002 2003 2004 2005
Year
Dep
th (m
)
0
2
4
6
8
10
12
14
16
Mean hypolimnion depth Mean hypolimnion DO
(Error bars represent 95% confidence interval; Greater C.I. ranges are influenced by varying intra-annual sample frequencies)
Mean Hypolimnion Temperature (Seal Cove Pond)
0
2
4
6
8
10
12
14
16
18
1995 1996 1997 1998 1999 2000 2001 2002 2003 2004 2005
Year
Tem
pera
ture
(C)
Mean hypolimnion temperature
(Error bars represent 95% confidence interval; Greater C.I. ranges are influenced by varying intra-annual sample frequencies)

Appendix D 7
Mean Hypolimnion Depth and Dissolved Oxygen (U. Hadlock Pond)
0
5
10
15
20
1995 1996 1997 1998 1999 2000 2001 2002 2003 2004 2005
Year
Dep
th (m
)
02
46
810
1214
16
Mean hypolimnion depth Mean hypolimnion DO(Error bars represent 95% confidence interval; Greater C.I. ranges are influenced by varying intra-annual sample frequencies)
Mean Hypolimnion Temperature (U. Hadlock Pond)
0
2
4
6
8
10
12
14
1995 1996 1997 1998 1999 2000 2001 2002 2003 2004 2005
Year
Tem
pera
ture
(C)
Mean hypolimnion temperature
(Error bars represent 95% confidence interval; Greater C.I. ranges are influenced by varying intra-annual sample frequencies)

Appendix D 8
Mean Hypolimnion Depth and Dissolved Oxygen (Witch Hole Pond)
0
5
10
15
20
1995 1996 1997 1998 1999 2000 2001 2002 2003 2004 2005
Year
Dep
th (m
)
0246810121416
Mean hypolimnion depth Mean hypolimnion DO
Mean Hypolimnion Temperature (Witch Hole Pond)
0
2
4
6
8
10
12
14
1995 1996 1997 1998 1999 2000 2001 2002 2003 2004 2005
Year
Tem
pera
ture
(C)
Mean hypolimnion temperature

APPENDIX E Nutrient and Chlorophyll a Graphs: 1996-2005

Mean Total Phosphorus 1996-2005
0
2
4
6
8
10
12
Echo Jordan Seal Cove Upper Hadlock Witch Hole
Tota
l pho
spho
rus
(µg/
L)
Mean TP(Error bars represent 95% confidence interval)
Mean Total Nitrogen 1996-2005
0.000
0.050
0.100
0.150
0.200
0.250
0.300
0.350
0.400
0.450
Echo Jordan Seal Cove Upper Hadlock Witch Hole
Tota
l nitr
ogen
(mg/
L)
Mean TN(Error bars represent 95% confidence interval)
Mean Chlorophyll a 1996-2005
0
1
2
3
4
5
6
Echo Jordan Seal Cove Upper Hadlock Witch Hole
Chl
orop
hyll
a (µ
g/L)
Mean ChlA(Error bars represent 95% confidence interval)

Appendix E 2
Nutrient and Chlorophyll a concentrations: Jordan Pond
0
2
4
6
8
10
12
6/11
/97
8/27
/97
6/22
/98
8/20
/98
7/1/
99
8/23
/99
6/14
/00
8/17
/00
6/14
/01
8/20
/01
6/20
/02
8/22
/02
6/24
/03
8/12
/03
6/17
/04
8/9/
04
6/13
/05
8/16
/05
0
0.05
0.1
0.15
0.2
0.25
0.3
0.35
ChlA (ppb) Total P (ppb) Total N (mg/L)
Parts
Per
Bill
ion
(ppb
)
Mill
igra
ms
per L
iter (
mg/
L)
Nutrient and Chlorophyll a concentrations: Echo Lake
0
1
2
3
4
5
6
7
8
9
6/25
/96
8/29
/96
6/9/
97
8/28
/97
6/19
/98
8/21
/98
7/8/
99
8/25
/99
6/26
/00
8/18
/00
6/20
/01
8/22
/01
6/21
/02
8/23
/02
6/16
/03
8/15
/03
6/21
/04
8/25
/04
6/21
/05
8/18
/05
0
0.05
0.1
0.15
0.2
0.25
0.3
ChlA (ppb) Total P (ppb) Total N (mg/L)
Mill
igra
ms
per L
iter
(mg/
L)
Parts
Per
Bill
ion
(ppb
)

Appendix E 3
Nutrient and Chlorophyll a concentrations: Seal Cove Pond
0
2
4
6
8
10
12
146/
24/9
6
8/29
/96
6/9/
97
8/28
/97
6/19
/98
8/21
/98
7/8/
99
8/25
/99
6/23
/00
8/17
/00
6/25
/01
8/22
/01
6/21
/02
8/28
/02
6/26
/03
8/14
/03
6/23
/04
8/25
/04
6/20
/05
8/17
/05
0
0.05
0.1
0.15
0.2
0.25
0.3
0.35
0.4
0.45
ChlA (ppb) Total P (ppb) Total N (mg/L)
Parts
Per
Bill
ion
(ppb
)
Mill
igra
ms
per
Lite
r (m
g/L)
Nutrient and Chlorophyll a concentrations: Upper Hadlock Pond
0
2
4
6
8
10
12
14
6/25
/96
8/30
/96
6/9/
97
8/28
/97
6/22
/98
8/20
/98
7/1/
99
8/26
/99
6/21
/00
8/18
/00
6/18
/01
8/20
/01
6/20
/02
8/29
/02
6/18
/03
8/11
/03
6/17
/04
8/10
/04
6/13
/05
8/15
/05
0
0.05
0.1
0.15
0.2
0.25
0.3
ChlA (ppb) Total P (ppb) Total N (mg/L)
Parts
Per
Bill
ion
(ppb
)
Mill
igra
ms
per L
iter (
mg/
L)

Appendix E 4
Nutrient and Chlorophyll a concentrations: Witch Hole Pond
0
2
4
6
8
10
12
14
16
6/10
/97
8/28
/97
6/26
/98
8/24
/98
6/30
/99
8/23
/99
6/21
/00
8/21
/00
6/25
/01
8/16
/01
6/19
/02
8/29
/02
6/13
/03
8/22
/03
6/16
/04
8/10
/04
6/20
/05
8/18
/05
0
0.1
0.2
0.3
0.4
0.5
0.6
0.7
ChlA (ppb) Total P (ppb) Total N (mg/L)
Part
s P
er B
illio
n (p
pb)
Mill
igra
ms
per L
iter
(mg/
L)

APPENDIX F Light Penetration and Attenuation Graphs: 2002-2005

Appendix F 1
2002 Light Penetration: Echo Lake
0
2
4
6
8
10
12
14
16
0% 20% 40% 60% 80% 100%
Dept
h (m
)
June July August September
2003 Light Penetration: Echo Lake
0
2
4
6
8
10
12
14
16
0% 20% 40% 60% 80% 100%
Dep
th (m
)
May June July August September
2004 Light Penetration: Echo Lake
0
2
4
6
8
10
12
14
16
0% 20% 40% 60% 80% 100%
Dept
h (m
)
June August
Light Attenuation Coefficients: Echo Lake
00.050.1
0.150.2
0.250.3
0.350.4
0.450.5
2002 2003 2004
Atte
nuat
ion
Coef
ficie
nt
Attenuation CoefficientMeanWarning limit*
* w arning limit equivalent to mean minus 1.0m in Secchi depth.

Appendix F 2
2002 Light Penetration: Jordan Pond
0
5
10
15
20
25
30
35
40
0% 20% 40% 60% 80% 100%
Dept
h (m
)
May June July August September
2003 Light Penetration: Jordan Pond
0
5
10
15
20
25
0% 20% 40% 60% 80% 100%
Dept
h (m
)
June August September
2004 Light Penetration: Jordan Pond
0
5
10
15
20
25
0% 20% 40% 60% 80% 100%
Dep
th (m
)
June July August September
Light Attenuation Coefficient: Jordan Pond
0
0.05
0.1
0.15
0.2
0.25
0.3
2002 2003 2004
Atte
nuat
ion
Coef
ficie
nt
Attenuation Coefficient Mean Warning limit*
* w arning limit equivalent to mean minus 1.0m in Secchi depth.

Appendix F 3
2002 Light Penetration: Seal Cove Pond
0
2
4
6
8
10
12
0% 20% 40% 60% 80% 100%
Dept
h (m
)
May June July August September
2003 Light Penetration: Seal Cove Pond
0
2
4
6
8
10
12
0% 20% 40% 60% 80% 100%
Dep
th (m
)
May June July August September
2004 Light Penetration: Seal Cove Pond
0
2
4
6
8
10
12
0% 20% 40% 60% 80% 100%
Dep
th (m
)
June August September
Light Attenuation Coefficients: Seal Cove Pond
0
0.1
0.2
0.3
0.4
0.5
0.6
0.7
0.8
2002 2003 2004
Atte
nuat
ion
Coef
ficie
nt
Attenuation CoefficientMeanWarning limit*
* w arning limit equivalent to mean minus 1.0m in Secchi depth.

Appendix F 4
2002 Light Penetration: Upper Hadlock Pond
0
2
4
6
8
10
12
0% 20% 40% 60% 80% 100%
Dept
h (m
)
May June July September
2003 Light Penetration: Upper Hadlock Pond
0
2
4
6
8
10
12
0% 20% 40% 60% 80% 100%
Dep
th (m
)
June July August September
2004 Light Penetration: Upper Hadlock Pond
0
2
4
6
8
10
12
0% 20% 40% 60% 80% 100%
Dep
th (m
)
June July August September
Light Attenuation Coefficients: Upper Hadlock Pond
0
0.1
0.2
0.3
0.4
0.5
0.6
0.7
2002 2003 2004
Atte
nuat
ion
Coef
ficie
nt
Attenuation CoefficientMeanWarning limit*
* w arning limit equivalent to mean minus 1.0m in Secchi depth.

Appendix F 5
2002 Light Penetration: Witch Hole Pond
0
1
2
3
4
5
6
7
0% 20% 40% 60% 80% 100%
Dept
h (m
)
June July August
2003 Light Penetration: Witch Hole Pond
0
1
2
3
4
5
6
7
0% 20% 40% 60% 80% 100%
Dep
th (m
)
June July August September
2004 Light Penetration: Witch Hole Pond
0
1
2
3
4
5
6
7
8
0% 20% 40% 60% 80% 100%
Dep
th (m
)
June August
Light Attenuation Coefficients: Witch Hole Pond
0
0.5
1
1.5
2
2.5
2002 2003 2004
Atte
nuat
ion
Coef
ficie
nt
Attenuation CoefficientMeanWarning limit*
* w arning limit equivalent to mean minus 1.0m in Secchi depth.

Appendix F 6
2005 Light Penetration Profiles
* attenuation coefficient calculated using methods from Kopp and Neckles, 2004.
Lake Name Date Time Depth Deck Light % Transmitted
Attenuation Coeff.*
8/25/2005 14:34:02 0.1 804.71 630.5 78.52% 8/25/2005 14:34:02 0.5 964.25 408.41 42.11% 8/25/2005 14:34:02 1 775.99 212.8 27.42% 8/25/2005 14:34:02 2 1649.4 194.72 11.79%
Bear Brook Pond
8/25/2005 14:34:02 3 2266.2 209.73 9.25%
0.73
8/4/2005 15:10:50 0.1 1521.7 1362.8 89.57% 8/4/2005 15:12:23 0.5 1578 595.07 37.71%
Duck Pond
8/4/2005 15:15:38 1 1474.9 78.619 5.34% 3.17
8/24/2005 10:59:14 0.1 1145.7 594.68 51.96% 8/24/2005 11:01:46 0.5 1070 248 23.00% 8/24/2005 11:01:47 1 1120.9 138.57 12.36% 8/24/2005 11:03:09 2 1004.5 95.406 9.49% 8/24/2005 11:04:28 3 1145.3 59.598 5.20% 8/24/2005 11:05:56 4 1082.3 22.541 2.08%
Halfmoon Pond
8/24/2005 11:07:07 5 1513.5 11.827 0.78%
0.76
9/2/2005 11:41:17 0.5 1650.9 678.73 41.48% 9/2/2005 11:43:45 1 1638.3 534.02 32.74% 9/2/2005 11:44:55 2 1621.9 434.7 26.81%
Lake Wood
9/2/2005 11:46:19 3 1634.5 229.53 14.05%
0.41
8/24/2005 10:17:32 0.1 691.12 425.77 61.61% 8/24/2005 10:20:05 0.5 712.37 273.78 38.44% 8/24/2005 10:24:01 1 748 299.07 39.98% 8/24/2005 10:25:08 2 865.62 211.94 24.48% 8/24/2005 10:26:03 3 875.03 117.67 13.45% 8/24/2005 10:27:01 4 795.52 58.076 7.30%
Lower Breakneck
8/24/2005 10:27:56 5 769.79 18.555 2.41%
0.60
8/25/2005 12:10:06 0.1 507.89 415.66 81.85% The Tarn
8/25/2005 12:11:04 0.5 547.6 238.23 43.51% 1.58
8/24/2005 9:32:45 0.1 672.29 451.93 67.24% 8/24/2005 9:34:18 0.5 662.74 276.15 41.68% 8/24/2005 9:35:57 1 551.16 142.58 25.88% 8/24/2005 9:37:30 2 529.1 55.637 10.52% 8/24/2005 9:39:07 3 506.68 20.497 4.05%
Upper Breakneck
8/24/2005 9:41:24 4 548.78 13.921 2.54%
0.86

APPENDIX G pH and Acid Neutralizing Capacity Graphs: 1996-2005

Mean Air Equilibrated pH 1996-2005
4.00
4.50
5.00
5.50
6.00
6.50
7.00
7.50
The Bowl Bubble Jordan Sargent Mtn. Witch Hole
Air
equ
ilibr
ated
pH
Mean EQpH(Error bars represent 95% confidence interval)
Mean Acid Neutralizing Capacity 1996-2005
-15.0
-5.0
5.0
15.0
25.0
35.0
45.0
55.0
65.0
75.0
The Bowl Bubble Jordan Sargent Mtn. Witch Hole
ANC
(µeq
/L)
Mean ANC(Error bars represent 95% confidence interval)
Mean Specific Conductance 1996-2005
4.0
9.0
14.0
19.0
24.0
29.0
34.0
39.0
44.0
The Bowl Bubble Jordan Sargent Mtn. Witch Hole
Spec
ific
Cond
ucta
nce
(µS/
cm2)
Mean Specific Conductance(Error bars represent 95% confidence interval)

Appendix G 2
Equilibrated pH and Acid Neutralizing Capacity: The Bowl
5.60
5.80
6.00
6.20
6.40
6.60
6.80
7.008/
30/9
6
5/15
/97
11/1
8/97
5/5/
98
12/1
0/98
4/21
/99
10/2
1/99
5/5/
00
10/2
6/00
5/23
/01
11/2
/01
4/29
/02
10/2
8/02
5/14
/03
10/2
0/03
4/14
/04
10/1
9/04
4/26
/05
10/1
8/05
pH
0
5
10
15
20
25
30
35
40
ANC
(ueq
/L)
pH ANC (ueq/L)
Equilibrated pH and Acid Neutralizing Capacity: Bubble Pond
6.2
6.4
6.6
6.8
7
7.2
7.4
6/27
/96
8/29
/96
5/14
/97
11/5
/97
5/14
/98
10/2
3/98
4/6/
99
10/2
7/99
5/5/
00
10/2
4/00
5/21
/01
10/2
4/01
4/24
/02
10/2
2/02
5/14
/03
10/2
2/03
5/5/
04
10/2
0/04
4/21
/05
10/1
8/05
pH
0
10
20
30
40
50
60
70
80
ANC
(ueq
/L)
pH ANC (ueq/L)

Appendix G 3
Equilibrated pH and Acid Neutralizing Capacity: Jordan Pond
6.2
6.3
6.4
6.5
6.6
6.7
6.8
6.9
7
7.1
7.26/
26/9
6
8/28
/96
5/14
/97
11/5
/97
5/13
/98
12/7
/98
4/6/
99
10/2
7/99
5/3/
00
10/2
3/00
5/17
/01
10/2
9/01
4/24
/02
10/2
2/02
5/14
/03
10/2
8/03
5/5/
04
10/2
0/04
4/21
/05
10/1
8/05
pH
0
10
20
30
40
50
60
70
80
AN
C (u
eq/L
)
pH ANC (ueq/L)
Equilibrated pH and Acid Neutralizing Capacity: Sargent Mountain Pond
4
4.2
4.4
4.6
4.8
5
5.2
5.4
5/14
/97
11/1
9/97
5/14
/98
10/2
7/98
4/22
/99
10/2
5/99
5/4/
00
10/2
7/00
5/24
/01
10/2
5/01
4/30
/02
10/2
1/02
5/6/
03
10/2
8/03
5/4/
04
10/2
0/04
5/2/
05
10/1
9/05
pH
-25
-20
-15
-10
-5
0
AN
C (u
eq/L
)
pH ANC (ueq/L)

Appendix G 4
Equilibrated pH and Acid Neutralizing Capacity: Witch Hole Pond
0
1
2
3
4
5
6
7
86/
26/9
6
8/30
/96
5/14
/97
11/5
/97
5/13
/98
10/2
6/98
4/9/
99
10/2
7/99
5/3/
00
10/2
4/00
5/21
/01
10/2
2/01
4/24
/02
10/2
2/02
5/8/
03
10/2
0/03
5/6/
04
10/1
9/04
4/26
/05
10/1
9/05
pH
0
10
20
30
40
50
60
70
80
AN
C (u
eq/L
)
pH ANC (ueq/L)