Embed Size (px)
Citation preview
Lake Survey Data for the Kuparuk Foothills Region: Spring 2006
Sampling lake water chemistry, D. White
by
Molly Chambers, Michael Lilly, Daniel White,
Kristie Hilton, and Peter Prokein
July 2006
Kuparuk Foothills Hydrology Project
Report No. INE/WERC 06.05
Lake Survey Data for the Kuparuk Foothills Region: Spring 2006
by
Molly Chambers1, Michael Lilly2, Daniel White 1, Kristie Hilton2, and Peter Prokein1
A report on research sponsored by the
Alaska Department of Transportation and Public Facilities
July 2006
Kuparuk Foothills Hydrology Project
Report Number INE/WERC 06.05
1University of Alaska Fairbanks, Water and Environmental Research Center 2Geo-Watersheds Scientific, Fairbanks, Alaska
Recommended Citation:
Chambers, M.K., Lilly, M.R., White, D.M., Hilton, K.M., and Prokein, P., 2006. Lake survey
data for the Kuparuk foothills region: Spring 2006. July 2006, University of Alaska Fairbanks,
Water and Environmental Research Center, Report INE/WERC 06-05, Fairbanks, Alaska, 7 pp.
Fairbanks, Alaska July 2006
For additional information write to: Publications, Water and Environmental Research Center University of Alaska Fairbanks Fairbanks, Alaska 99775 www.uaf.edu/water/
i
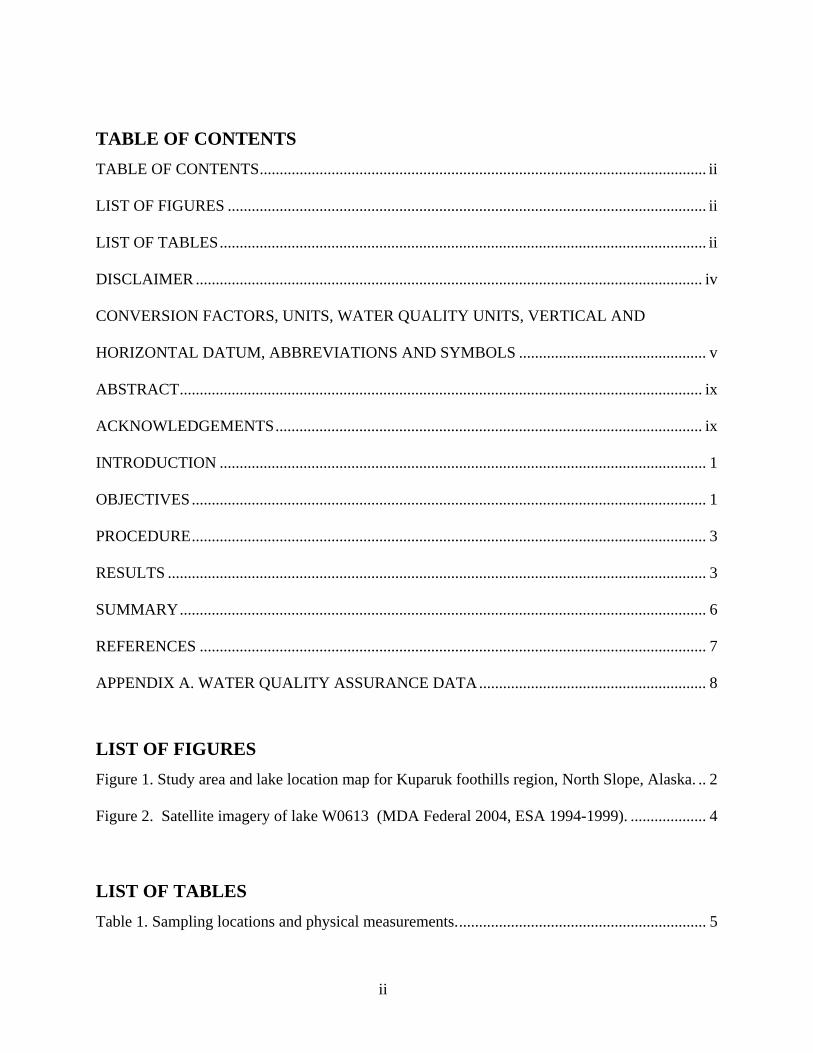
TABLE OF CONTENTS TABLE OF CONTENTS................................................................................................................ ii
LIST OF FIGURES ........................................................................................................................ ii
LIST OF TABLES.......................................................................................................................... ii
DISCLAIMER ............................................................................................................................... iv
CONVERSION FACTORS, UNITS, WATER QUALITY UNITS, VERTICAL AND
HORIZONTAL DATUM, ABBREVIATIONS AND SYMBOLS ............................................... v
ABSTRACT................................................................................................................................... ix
ACKNOWLEDGEMENTS........................................................................................................... ix
INTRODUCTION .......................................................................................................................... 1
OBJECTIVES................................................................................................................................. 1
PROCEDURE................................................................................................................................. 3
RESULTS ....................................................................................................................................... 3
SUMMARY.................................................................................................................................... 6
REFERENCES ............................................................................................................................... 7
APPENDIX A. WATER QUALITY ASSURANCE DATA......................................................... 8
LIST OF FIGURES
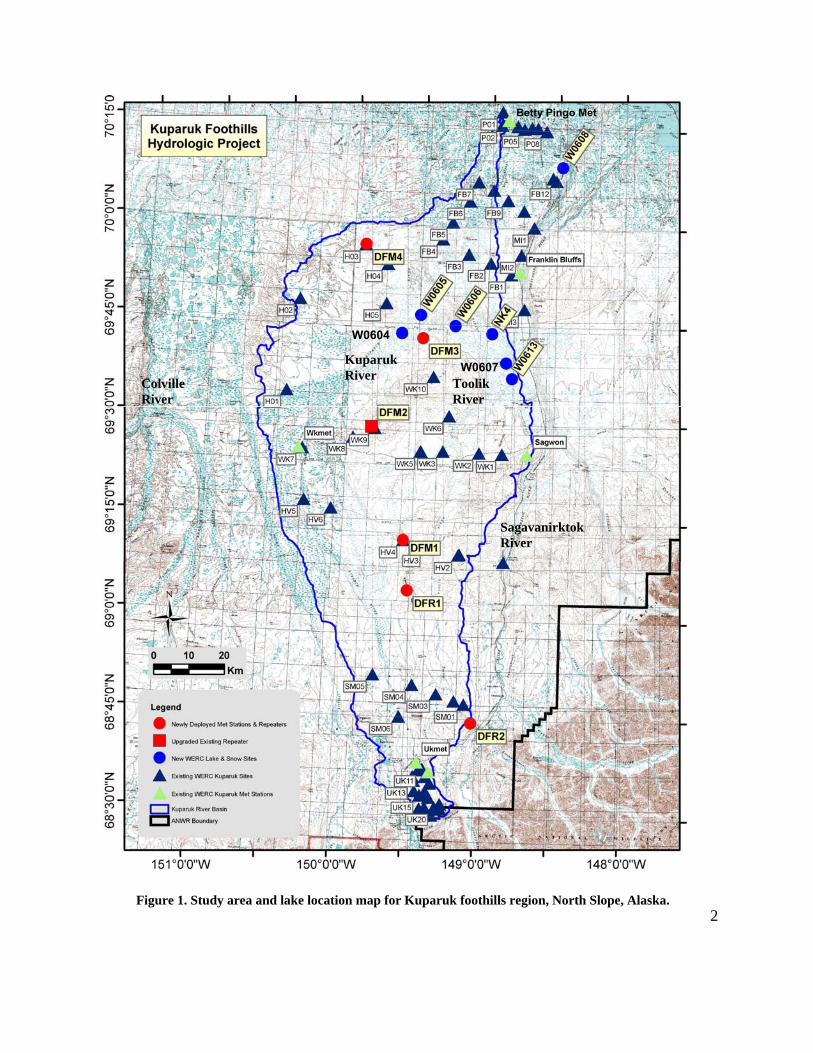
Figure 1. Study area and lake location map for Kuparuk foothills region, North Slope, Alaska. .. 2
Figure 2. Satellite imagery of lake W0613 (MDA Federal 2004, ESA 1994-1999). ................... 4
LIST OF TABLES
Table 1. Sampling locations and physical measurements............................................................... 5
ii
Table 2. Lake W0613 chemistry data. ............................................................................................ 6
iii
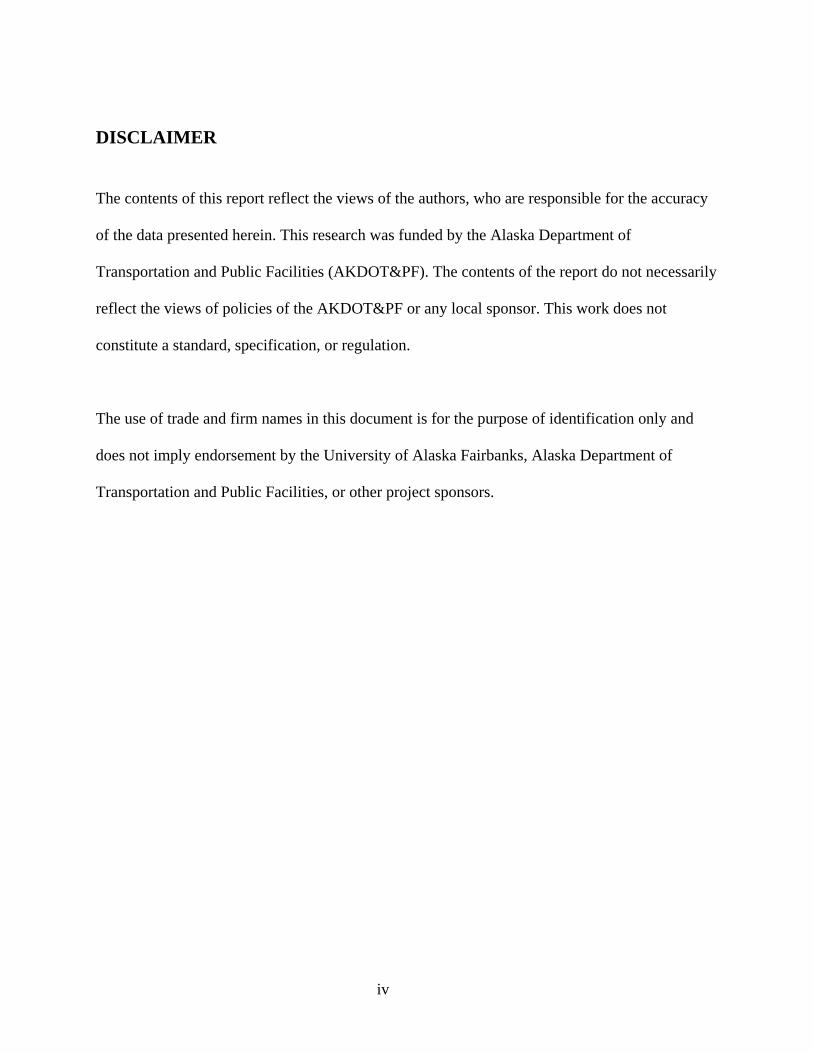
DISCLAIMER
The contents of this report reflect the views of the authors, who are responsible for the accuracy
of the data presented herein. This research was funded by the Alaska Department of
Transportation and Public Facilities (AKDOT&PF). The contents of the report do not necessarily
reflect the views of policies of the AKDOT&PF or any local sponsor. This work does not
constitute a standard, specification, or regulation.
The use of trade and firm names in this document is for the purpose of identification only and
does not imply endorsement by the University of Alaska Fairbanks, Alaska Department of
Transportation and Public Facilities, or other project sponsors.
iv
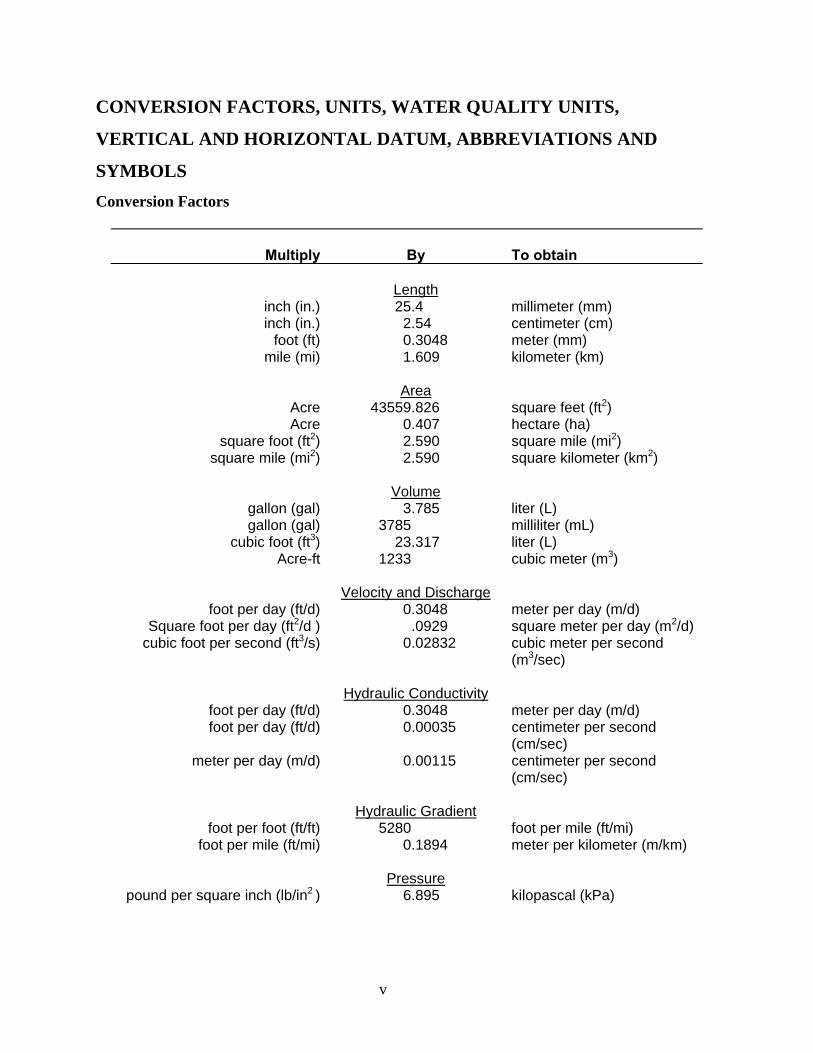
CONVERSION FACTORS, UNITS, WATER QUALITY UNITS,
VERTICAL AND HORIZONTAL DATUM, ABBREVIATIONS AND
SYMBOLS Conversion Factors
Multiply
By To obtain
Length
inch (in.) 25.4 millimeter (mm) inch (in.) 2.54 centimeter (cm)
foot (ft) 0.3048 meter (mm) mile (mi) 1.609 kilometer (km)
Area
Acre 43559.826 square feet (ft2) Acre 0.407 hectare (ha)
square foot (ft2) 2.590 square mile (mi2) square mile (mi2) 2.590 square kilometer (km2)
Volume
gallon (gal) 3.785 liter (L) gallon (gal) 3785 milliliter (mL)
cubic foot (ft3) 23.317 liter (L) Acre-ft 1233 cubic meter (m3)
Velocity and Discharge
foot per day (ft/d) 0.3048 meter per day (m/d) Square foot per day (ft2/d ) .0929 square meter per day (m2/d)
cubic foot per second (ft3/s) 0.02832 cubic meter per second (m3/sec)
Hydraulic Conductivity
foot per day (ft/d) 0.3048 meter per day (m/d) foot per day (ft/d) 0.00035 centimeter per second
(cm/sec) meter per day (m/d) 0.00115 centimeter per second
(cm/sec)
Hydraulic Gradient foot per foot (ft/ft) 5280 foot per mile (ft/mi)
foot per mile (ft/mi) 0.1894 meter per kilometer (m/km)
Pressure pound per square inch (lb/in2 ) 6.895 kilopascal (kPa)
v
Units
For the purposes of this report, both English and Metric (SI) units were employed. The choice of
“primary” units employed depended on common reporting standards for a particular property or
parameter measured. Whenever possible, the approximate value in the “secondary” units was
also provided in parentheses. Thus, for instance, stream flow was reported in cubic feet per
second (cfs) followed by the approximate value in cubic meters per second (m3/s) in parentheses.
Physical and Chemical Water-Quality Units:
Temperature:
Water and air temperature are given in degrees Celsius (°C) and in degrees Fahrenheit (°F).
Degrees Celsius can be converted to degrees Fahrenheit by use of the following equation:
°F = 1.8(°C) + 32
Specific electrical conductance (conductivity):
Conductivity of water is expressed in microsiemens per centimeter at 25°C (μS/cm). This unit is
equivalent to micromhos per centimeter at 25°C.
Milligrams per liter (mg/L) or micrograms per liter (μg/L):
Milligrams per liter is a unit of measurement indicating the concentration of chemical
constituents in solution as weight (milligrams) of solute per unit volume (liter) of water. One
thousand micrograms per liter is equivalent to one milligram per liter. For concentrations less
than 7,000 mg/L, the numerical value is the same as for concentrations in parts per million.
vi
Millivolt (mV):
A unit of electromotive force equal to one thousandth of a volt.
Vertical Datum:
In this report, "sea level" refers to the National Geodetic Vertical Datum of 1929 (NGVD of
1929), a geodetic datum derived from a general adjustment of the first-order level nets of both
the United States and Canada, formerly called Sea Level Datum of 1929.
Horizontal Datum:
The horizontal datum for all locations in this report is the North American Datum of 1983.
vii
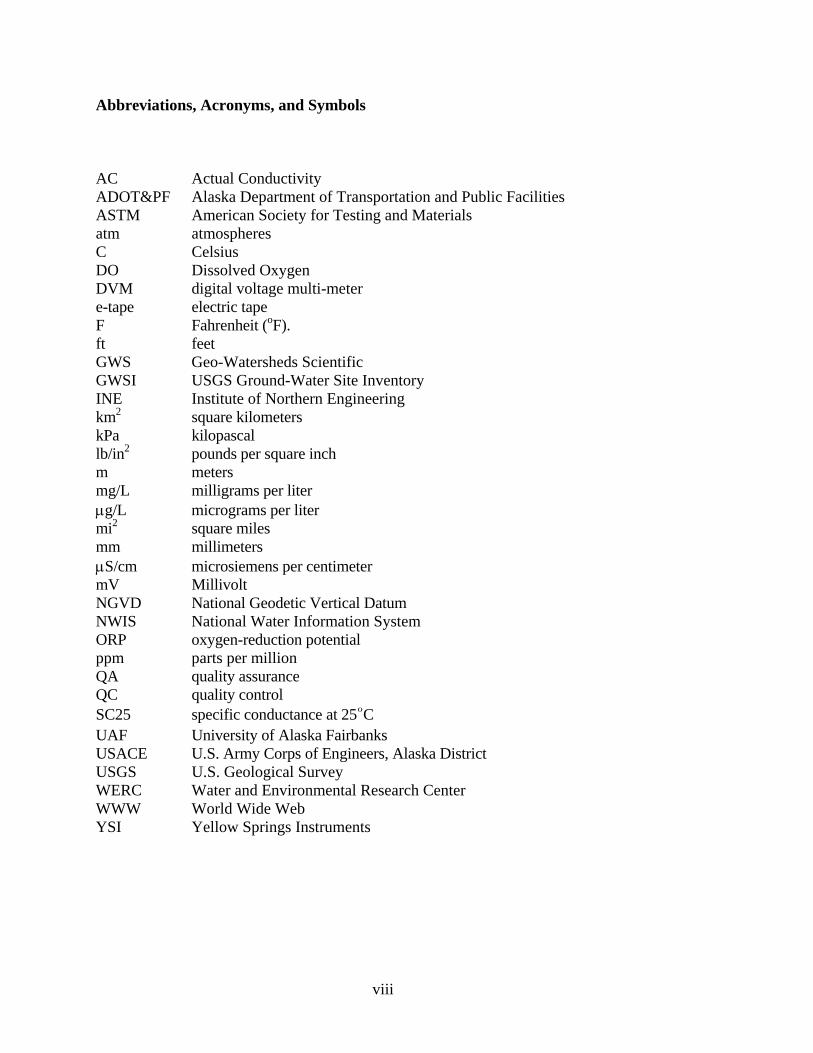
Abbreviations, Acronyms, and Symbols
AC Actual Conductivity ADOT&PF Alaska Department of Transportation and Public Facilities ASTM American Society for Testing and Materials atm atmospheres C Celsius DO Dissolved Oxygen DVM digital voltage multi-meter e-tape electric tape F Fahrenheit (oF). ft feet GWS Geo-Watersheds Scientific GWSI USGS Ground-Water Site Inventory INE Institute of Northern Engineering km2 square kilometers kPa kilopascal lb/in2 pounds per square inch m meters mg/L milligrams per liter μg/L micrograms per liter mi2 square miles mm millimeters μS/cm microsiemens per centimeter mV Millivolt NGVD National Geodetic Vertical Datum NWIS National Water Information System ORP oxygen-reduction potential ppm parts per million QA quality assurance QC quality control SC25 specific conductance at 25°C UAF University of Alaska Fairbanks USACE U.S. Army Corps of Engineers, Alaska District USGS U.S. Geological Survey WERC Water and Environmental Research Center WWW World Wide Web YSI Yellow Springs Instruments
viii
ABSTRACT The abundance of natural lakes is limited in the foothills region of the North Slope, Alaska,
which affects the available water resources needed during mid-winter operations periods. Water
is needed for ice road construction and maintenance, drilling and facility operations, and potable
water supplies. The foothills region area between the Sagavanirktok River and the Kuparuk
River has numerous shallow lakes on the north side of the White Hills. Identifying potential
water sources for this region will help both industry and resource-management agencies.
Sampling conducted in spring 2006 was a preliminary study of lakes. Field chemistry
measurements, lake depth, ice thickness, and snow measurements were collected at each site.
Lakes with a potential for unfrozen water in mid-winter were pre-selected for field sampling.
The natural lakes sampled were generally found to have little under-ice water available. Data
from this project will also be used for analysis in the North Slope Lakes project, sponsored by
the US Department of Energy.
ACKNOWLEDGEMENTS This project was funded by grant ADN #2562123, Alaska Department of Transportation and
Public Facilities. Alaska Department of Natural Resources provided background data for lakes in
the study area. Information was also provided by Kuparuk Watershed projects funded by the
National Science Foundation.
ix
Lake Survey Data for the Kuparuk Foothills Region: Spring 2006
INTRODUCTION Water resources are essential to construction and maintenance of gravel road, and ice road / pad
construction on the North Slope of Alaska. Yet many natural lakes are too shallow to provide
significant freshwater throughout the winter operations period. The area between the
Sagavanirktok River and the Kuparuk River has numerous, but shallow, lakes in the White Hills
region. Future development in this area will need a network of natural lakes, or gravel-mine sites
to provide water. In planning transportation networks, an opportunity for concurrent gravel
procurement and water resource development exists. Physical and chemical measurements show
that many natural lakes are insufficient for use as winter water resources or overwintering fish
habitat. Although not monitored, the larger rivers in the area (Kuparuk and Toolik) have low
winter baseflows and are not generally considered potential sites for obtaining water in the
winter months.
OBJECTIVES The objectives of this report are to make available lake data collected in the early spring of 2006.
Spring snowmelt had not started and lake ice conditions were at a winter maximum. Snow depth
measurements on and adjacent to lakes were also collected to help with regional hydrologic
analysis. This data will help resource developers and management agencies evaluate potential
water sources in the region, and areas where future water sources are needed.
1
Betty Pingo Met
W0604
Kuparuk River Toolik
River
W0607Colville River
Sagavanirktok River
2Figure 1. Study area and lake location map for Kuparuk foothills region, North Slope, Alaska.
PROCEDURE Lakes selected for the study fell between 50 and 60 miles south of the arctic coast, and within 25
miles to the west of the Dalton Highway (Figure 1). As seen in figure 1, few lakes are present in
the foothills relative to the coastal plain. There is no current road access to the lakes and all lakes
were accessed by helicopter. At each lake, the ice was drilled with a 2-inch ice auger powered by
a cordless drill. Physical measurements of depth (lake bottom to water surface), freeboard (water
surface to top of ice), ice thickness (bottom of ice to top of ice), and snow depth (top of ice to top
of snow, measured at hole where snow was cleared to drill) were taken with a folding measure
with a hook for feeling the bottom of ice or a weighted flexible measuring tape. The precision
with which physical measurements are reported takes into account field conditions.
Temperature, pH, oxidation-reduction potential (ORP), dissolved oxygen (DO), and electrical
conductivity were measured with a Yellow Springs Instruments (YSI) 556 multi-parameter
meter. The calibration of each parameter was checked before and after each day of sampling.
To pass the calibration check, pH had to be within 0.2 pH units and ORP, DO, and conductivity
had to be within 10% of the calibration standard value. All parameters passed each check and
DO and conductivity checks had error less than 5% (Appendix A). Actual conductivity (AC)
was temperature compensated to specific conductivity at 25°C (SC25) by 2% per degree Celsius
(Hem 1985).
RESULTS
3
Four lakes were visited along the potential in the Kuparuk foothills region (Table 1). Of
these, W0613 had enough sub-ice water for chemistry measurements. Lake W0613 had limited
unfrozen water at the sample sites. Dissolved oxygen and oxidation-reduction potential were
low, indicating a reducing environment with insufficient end of winter oxygen for fish (Table 2).
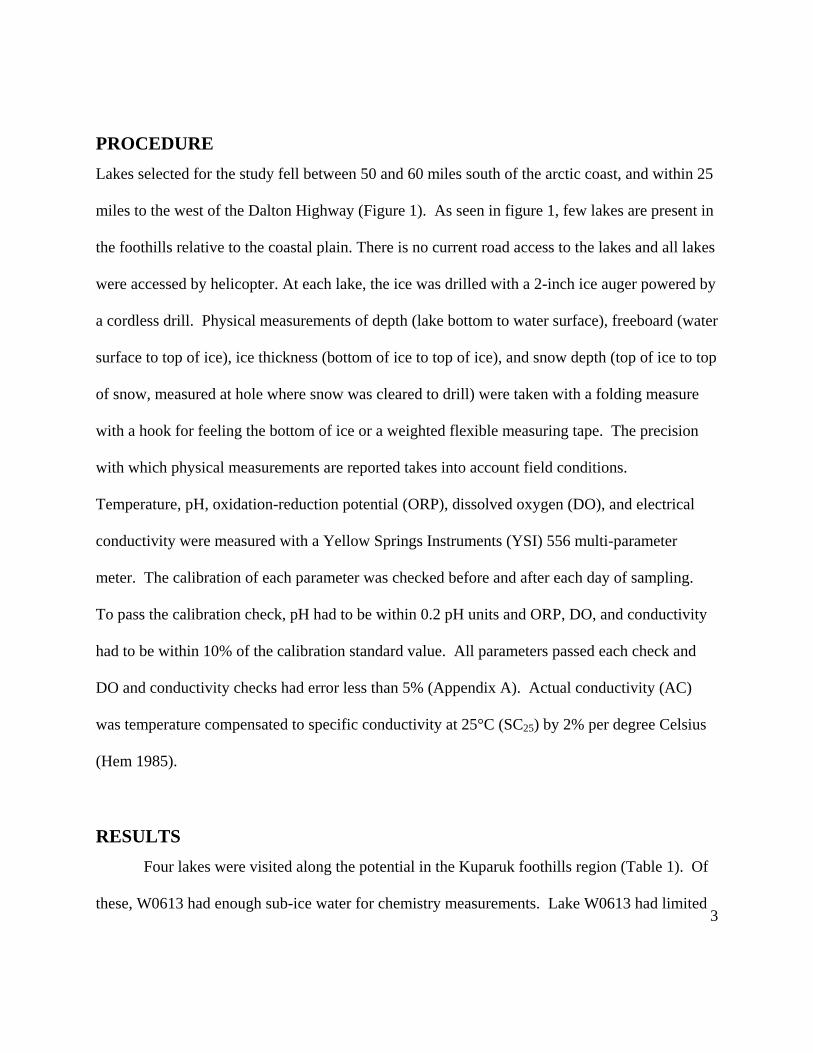
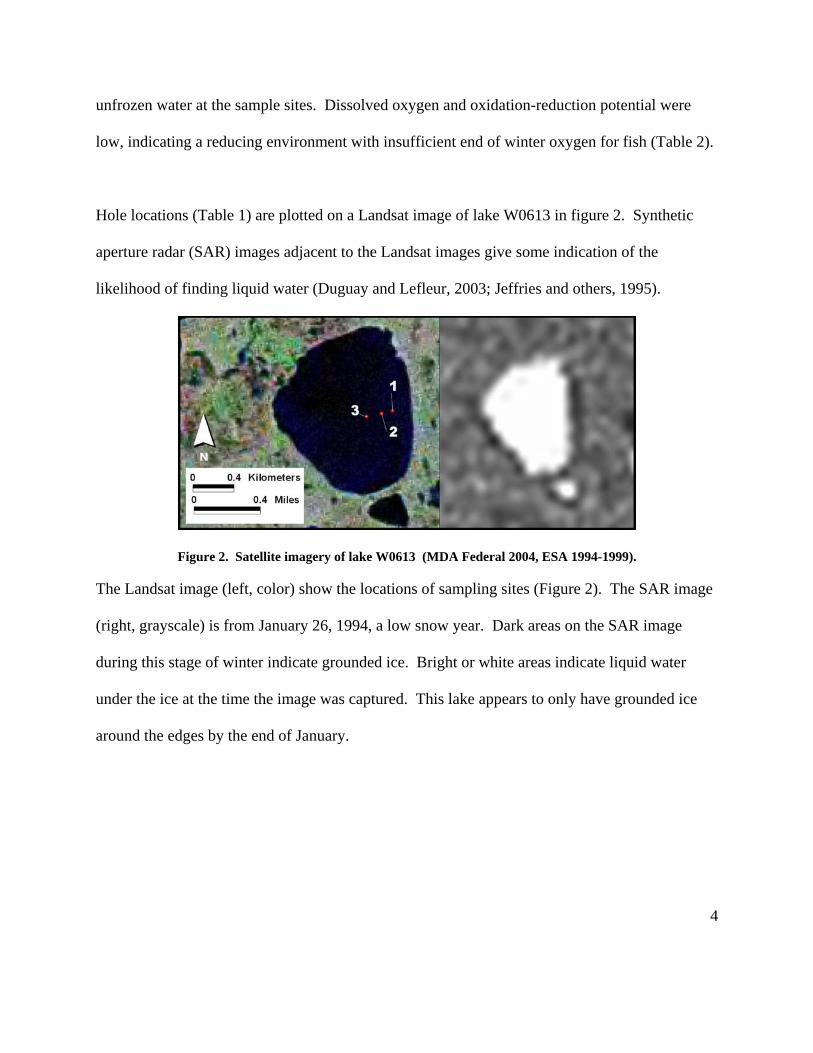
Hole locations (Table 1) are plotted on a Landsat image of lake W0613 in figure 2. Synthetic
aperture radar (SAR) images adjacent to the Landsat images give some indication of the
likelihood of finding liquid water (Duguay and Lefleur, 2003; Jeffries and others, 1995).
Figure 2. Satellite imagery of lake W0613 (MDA Federal 2004, ESA 1994-1999).
The Landsat image (left, color) show the locations of sampling sites (Figure 2). The SAR image
(right, grayscale) is from January 26, 1994, a low snow year. Dark areas on the SAR image
during this stage of winter indicate grounded ice. Bright or white areas indicate liquid water
under the ice at the time the image was captured. This lake appears to only have grounded ice
around the edges by the end of January.
4
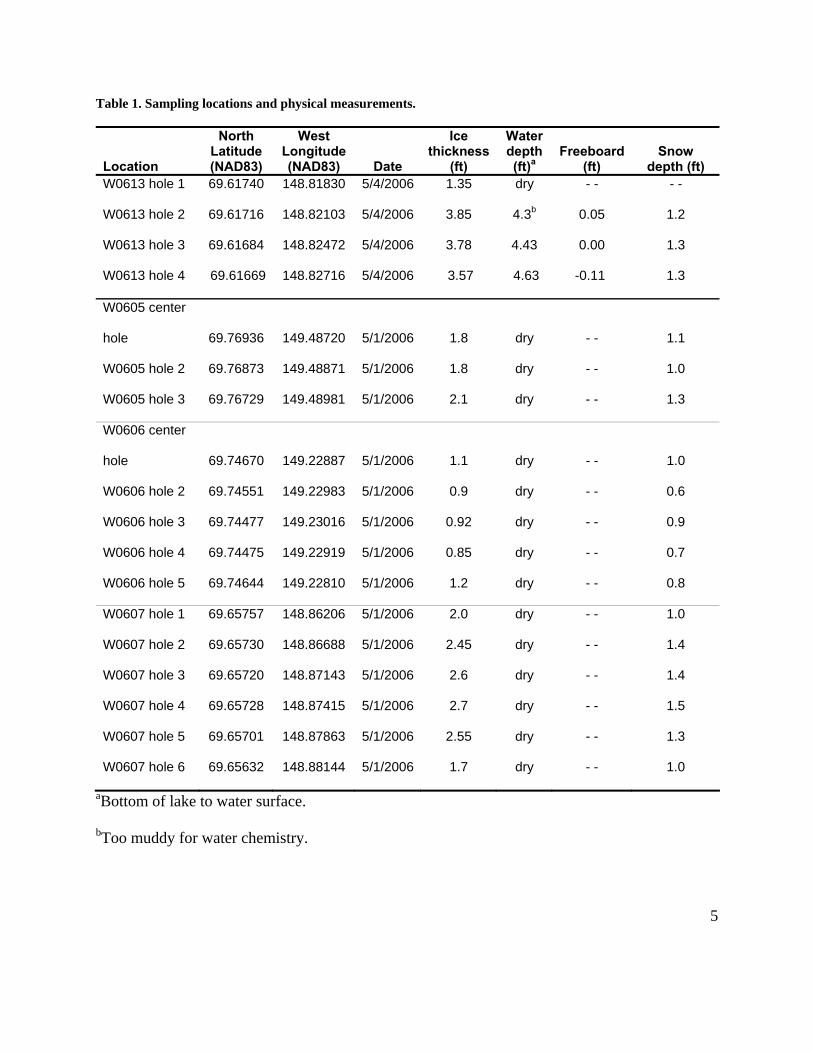
Table 1. Sampling locations and physical measurements.
Location
North Latitude (NAD83)
West Longitude (NAD83) Date
Ice thickness
(ft)
Water depth (ft)a
Freeboard (ft)
Snow depth (ft)
W0613 hole 1 69.61740 148.81830 5/4/2006 1.35 dry - - - -
W0613 hole 2 69.61716 148.82103 5/4/2006 3.85 4.3b 0.05 1.2
W0613 hole 3 69.61684 148.82472 5/4/2006 3.78 4.43 0.00 1.3
W0613 hole 4 69.61669 148.82716 5/4/2006 3.57 4.63 -0.11 1.3
W0605 center
hole 69.76936 149.48720 5/1/2006 1.8 dry - - 1.1
W0605 hole 2 69.76873 149.48871 5/1/2006 1.8 dry - - 1.0
W0605 hole 3 69.76729 149.48981 5/1/2006 2.1 dry - - 1.3
W0606 center
hole 69.74670 149.22887 5/1/2006 1.1 dry - - 1.0
W0606 hole 2 69.74551 149.22983 5/1/2006 0.9 dry - - 0.6
W0606 hole 3 69.74477 149.23016 5/1/2006 0.92 dry - - 0.9
W0606 hole 4 69.74475 149.22919 5/1/2006 0.85 dry - - 0.7
W0606 hole 5 69.74644 149.22810 5/1/2006 1.2 dry - - 0.8
W0607 hole 1 69.65757 148.86206 5/1/2006 2.0 dry - - 1.0
W0607 hole 2 69.65730 148.86688 5/1/2006 2.45 dry - - 1.4
W0607 hole 3 69.65720 148.87143 5/1/2006 2.6 dry - - 1.4
W0607 hole 4 69.65728 148.87415 5/1/2006 2.7 dry - - 1.5
W0607 hole 5 69.65701 148.87863 5/1/2006 2.55 dry - - 1.3
W0607 hole 6 69.65632 148.88144 5/1/2006 1.7 dry - - 1.0
aBottom of lake to water surface.
bToo muddy for water chemistry.
5
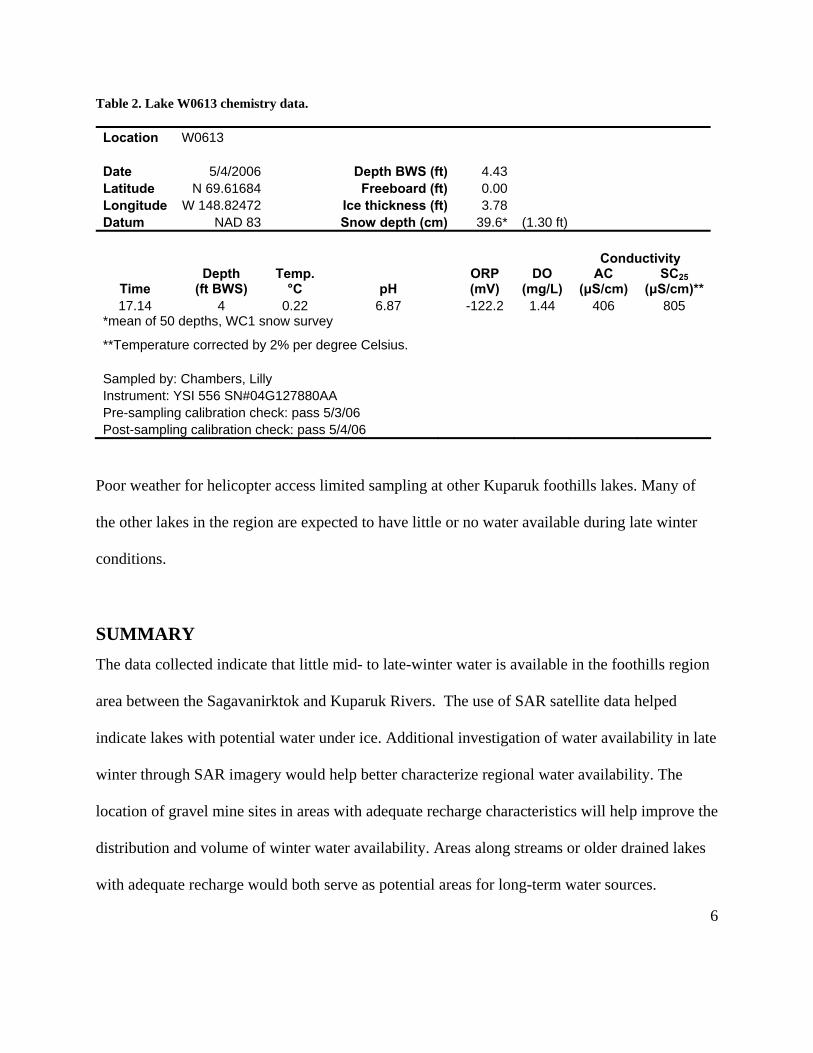
Table 2. Lake W0613 chemistry data.
Location W0613 Date 5/4/2006 Depth BWS (ft) 4.43 Latitude N 69.61684 Freeboard (ft) 0.00 Longitude W 148.82472 Ice thickness (ft) 3.78 Datum NAD 83 Snow depth (cm) 39.6* (1.30 ft) Conductivity
Time Depth
(ft BWS) Temp.
°C pH ORP (mV)
DO (mg/L)
AC (μS/cm)
SC25 (μS/cm)**
17.14 4 0.22 6.87 -122.2 1.44 406 805 *mean of 50 depths, WC1 snow survey **Temperature corrected by 2% per degree Celsius.
Sampled by: Chambers, Lilly Instrument: YSI 556 SN#04G127880AA Pre-sampling calibration check: pass 5/3/06 Post-sampling calibration check: pass 5/4/06
Poor weather for helicopter access limited sampling at other Kuparuk foothills lakes. Many of
the other lakes in the region are expected to have little or no water available during late winter
conditions.
SUMMARY The data collected indicate that little mid- to late-winter water is available in the foothills region
area between the Sagavanirktok and Kuparuk Rivers. The use of SAR satellite data helped
indicate lakes with potential water under ice. Additional investigation of water availability in late
winter through SAR imagery would help better characterize regional water availability. The
location of gravel mine sites in areas with adequate recharge characteristics will help improve the
distribution and volume of winter water availability. Areas along streams or older drained lakes
with adequate recharge would both serve as potential areas for long-term water sources.
6
REFERENCES Duguay, C.R. and Lafleur, P.M., 2003. Determining depth and ice thickness of shallow sub-
Arctic lakes using space-borne optical and SAR data. Int. J. Remote Sensing 24(3): 475-
489.
Hem, J.D., 1985. Study and interpretation of the chemical characteristics of natural water 3rd ed.
USGS Report 2254.
ESA 1994-1999. ERS-1/ERS-2 Standard Beam Full Resolution. Fairbanks, Alaska: Alaska SAR
Facility
Jeffries, M.O., Morris, K., and Liston, G.E., 1995. A method to determine lake depth and water
availability on the North Slope of Alaska with Spaceborne Imaging Radar and Numerical
Ice Growth Modeling. Arctic vol. 48, no.4, p.367-374.
MDA Federal 2004. Landcover 2000/ETM+ Edition Mosaics. Tile N-06-65, N-06-70. Sioux
Falls, Dakota: USGS
7
APPENDIX A. WATER QUALITY ASSURANCE DATA
The following table reports the pre- and post-calibration checks for water quality meters used
during field sampling.
8

Appendix A Instrument Calibration Checks
Instrument: YSI 556 SN# 04G127880AA Rented from TTT, Anchorage Date Conductivity pH DO ORP
pass/fail By standard* reading error (%) standard* reading difference standard* reading
error (%) standard* reading
error (%)
4/19/2006 TT 1.413 mS 1.413 mS 0 7.000 7.02 0.02 100 99.4 -0.6 220 228 3.6 pass 4.01 4.00 -0.01 10.000 10.04 0.04 4/21/2006 MC 338 346 2.4 4.01 3.95 -0.06 100 99.2 -0.8 251 236.3 -5.9 pass 7.00 7.02 0.02 10.00 10.03 0.03 4/29/2006 MC 252 264 4.8 4.01 4.11 0.10 100 104.6 4.6 246 232.9 -5.3 pass 7.00 7.09 0.09 10.00 10.08 0.08 4/30/2006 MC 285 296 3.9 4.01 4.07 0.06 100 103.9 3.9 238 217.6 -8.6 pass 7.00 7.11 0.11 10.00 10.16 0.16
5/1/2006 MC 100 102.5 2.5 pass
5/2/2006 MC 315 326 3.5 4.01 4.06 0.05 100 102.1 2.1 233 212.2 -8.9 pass 7.00 7.07 0.07 0 1.8 n/a 10.00 10.05 0.05
5/3/2006 MC 319 328 2.8 4.01 4.09 0.08 100 104.1 4.1 232 211.0 -9.1 pass 7.00 7.08 0.08 0 0.15 n/a 10.00 10.07 0.07
5/4/2006 MC 316 330 4.4 4.01 4.07 0.06 100 101.7 1.7 231 213.5 -7.6 pass 7.00 7.09 0.09 0 0.20 n/a 10.00 10.05 0.05 max error: 4.8% max. difference: 0.16 max error: 4.6% max error: -9.1% *Standard values were temperature compensated. Saturated DO standard was chilled, bubbled nanopure water. The conductivity standard was also chilled. Conductivity was measured as actual conductance, and results must be temperature compensated to specific conductance. A 2% per degree to 25°C compensation is recommended. Units--conductivity: μS/cm unless otherwise noted; pH: pH units; DO: % of saturation for temperature, barometric pressure; ORP: mV Error/recalibration cut-offs: recalibration was deemed necessary when error exceeded 10% or 0.2 pH units.
A-1