Embed Size (px)
Citation preview

4Q and FY 2014 Results
13 February 2015
Lakshmi N Mittal, Chairman and Chief Executive Officer
Aditya Mittal, Chief Financial Officer
Disclaimer
Forward-Looking Statements
This document may contain forward-looking information and statements about ArcelorMittal and its
subsidiaries. These statements include financial projections and estimates and their underlying
assumptions, statements regarding plans, objectives and expectations with respect to future operations,
products and services, and statements regarding future performance. Forward-looking statements may be
identified by the words “believe,” “expect,” “anticipate,” “target” or similar expressions. Although
ArcelorMittal’s management believes that the expectations reflected in such forward-looking statements
are reasonable, investors and holders of ArcelorMittal’s securities are cautioned that forward-looking
information and statements are subject to numerous risks and uncertainties, many of which are difficult to
predict and generally beyond the control of ArcelorMittal, that could cause actual results and
developments to differ materially and adversely from those expressed in, or implied or projected by, the
forward-looking information and statements. These risks and uncertainties include those discussed or
identified in the filings with the Luxembourg Stock Market Authority for the Financial Markets (Commission
de Surveillance du Secteur Financier) and the United States Securities and Exchange Commission (the
“SEC”) made or to be made by ArcelorMittal, including ArcelorMittal’s Annual Report on Form 20-F for the
year ended December 31, 2013 filed with the SEC and with respect to Items 3, 4, 5, 6 and 18 of such
Annual Report on Form 20-F, such Items have been retrospectively adjusted to reflect the retrospective
application of changes in its segment information, which can be found in the current report on Form 6-K
filed with the SEC on August 5, 2014. ArcelorMittal undertakes no obligation to publicly update its forward-
looking statements, whether as a result of new information, future events, or otherwise.
1
Agenda
• Results overview and market outlook
• Results analysis
• Outlook and guidance
2
0.850.85
2014 2009
1.9
2008
2.5
2007
3.1
2013 2012
1.0
2011
1.4
2010
1.8
3
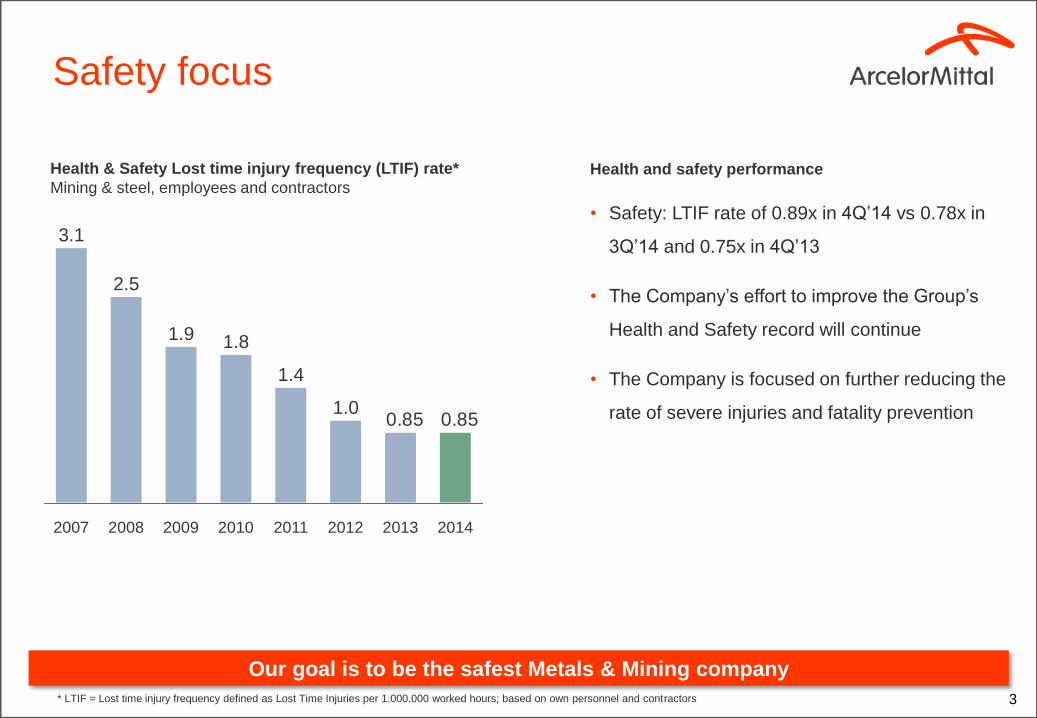
Health & Safety Lost time injury frequency (LTIF) rate*
Mining & steel, employees and contractors
* LTIF = Lost time injury frequency defined as Lost Time Injuries per 1.000.000 worked hours; based on own personnel and contractors
Safety focus
Our goal is to be the safest Metals & Mining company
Health and safety performance
• Safety: LTIF rate of 0.89x in 4Q’14 vs 0.78x in
3Q’14 and 0.75x in 4Q’13
• The Company’s effort to improve the Group’s
Health and Safety record will continue
• The Company is focused on further reducing the
rate of severe injuries and fatality prevention
4
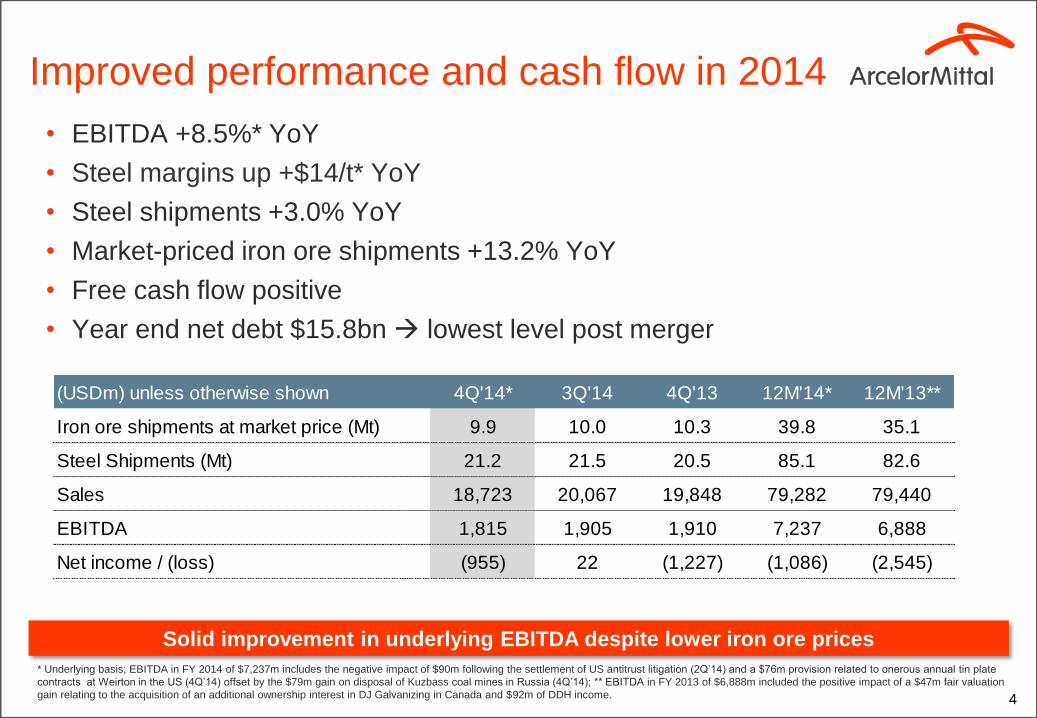
• EBITDA +8.5%* YoY
• Steel margins up +$14/t* YoY
• Steel shipments +3.0% YoY
• Market-priced iron ore shipments +13.2% YoY
• Free cash flow positive
• Year end net debt $15.8bn lowest level post merger
Solid improvement in underlying EBITDA despite lower iron ore prices
* Underlying basis; EBITDA in FY 2014 of $7,237m includes the negative impact of $90m following the settlement of US antitrust litigation (2Q’14) and a $76m provision related to onerous annual tin plate
contracts at Weirton in the US (4Q’14) offset by the $79m gain on disposal of Kuzbass coal mines in Russia (4Q’14); ** EBITDA in FY 2013 of $6,888m included the positive impact of a $47m fair valuation
gain relating to the acquisition of an additional ownership interest in DJ Galvanizing in Canada and $92m of DDH income.
Improved performance and cash flow in 2014
(USDm) unless otherwise shown 4Q'14* 3Q'14 4Q'13 12M'14* 12M'13**
Iron ore shipments at market price (Mt) 9.9 10.0 10.3 39.8 35.1
Steel Shipments (Mt) 21.2 21.5 20.5 85.1 82.6
Sales 18,723 20,067 19,848 79,282 79,440
EBITDA 1,815 1,905 1,910 7,237 6,888
Net income / (loss) (955) 22 (1,227) (1,086) (2,545)
5
Recap
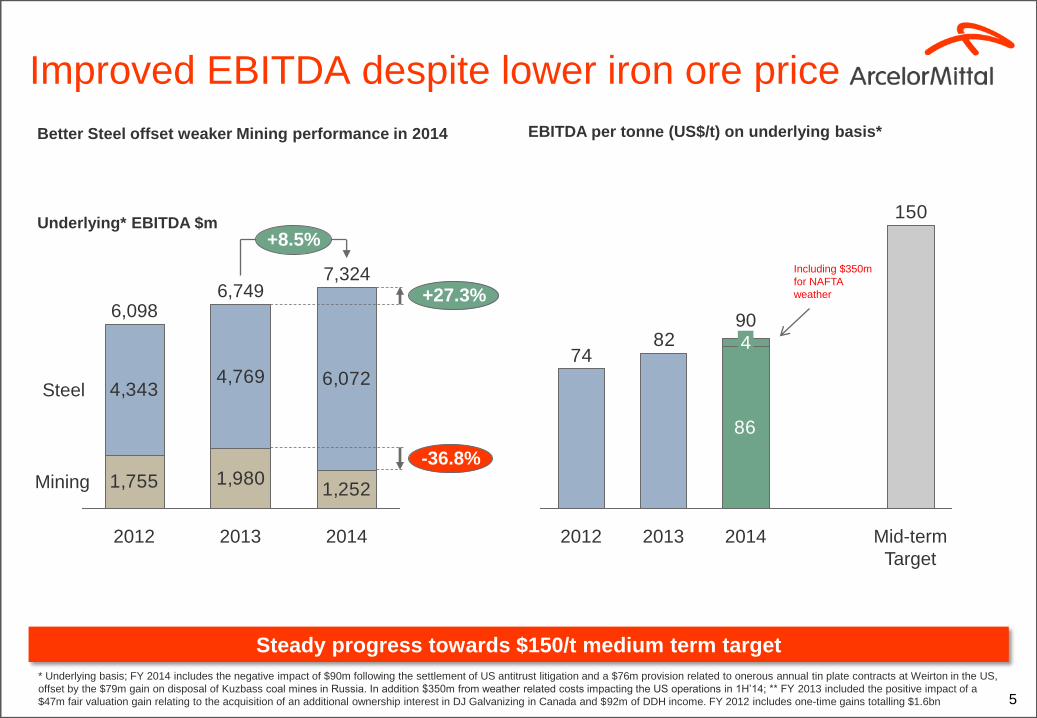
Steady progress towards $150/t medium term target
Better Steel offset weaker Mining performance in 2014
Improved EBITDA despite lower iron ore price
EBITDA per tonne (US$/t) on underlying basis*
* Underlying basis; FY 2014 includes the negative impact of $90m following the settlement of US antitrust litigation and a $76m provision related to onerous annual tin plate contracts at Weirton in the US,
offset by the $79m gain on disposal of Kuzbass coal mines in Russia. In addition $350m from weather related costs impacting the US operations in 1H’14; ** FY 2013 included the positive impact of a
$47m fair valuation gain relating to the acquisition of an additional ownership interest in DJ Galvanizing in Canada and $92m of DDH income. FY 2012 includes one-time gains totalling $1.6bn
150
8274
86
2013 2012 Mid-term
Target
4
90
2014
Including $350m
for NAFTA
weather
1,755 1,9801,252
4,3434,769 6,072
-36.8%
7,324 +27.3%
+8.5%
Mining
Steel
2014 2013
6,749
2012
6,098
Underlying* EBITDA $m

6
Recap
Notable improvement in Europe and ACIS segments
• Group steel-only EBITDA/t
increased $14/t* YoY in 2014 and
$13/t* in 4Q’14
NAFTA margins higher in 2014 excluding
adverse weather impacts on 1H’14 costs
Particular progress in Europe given
improved market fundamentals and
results of cost optimization
Evidence of turnaround in ACIS margins
Brazil per tonne margin declined due to
increased slab exports (lower margin than
domestic); but 4Q’14 total EBITDA above
4Q’13 level
Brazil
Europe
ACIS
NAFTA
Steel segment EBITDA per tonne* (US$)
7560
+24%
Steel margin expansion
7271
+2%
193
-8%
178
-11%
189 212
5840
+46%
5843
+35%
4825
+92%
FY’14* FY’13*
4718
+165%
4Q’14* 4Q’13
* Underlying basis; FY 2014 includes the negative impact of $90m following the settlement of US antitrust litigation and a $76m provision related to onerous annual tin plate contracts at Weirton in the US,
offset by the $79m gain on disposal of Kuzbass coal mines in Russia. In addition $350m from weather related costs impacting the US operations in 1H’14; ** FY 2013 included the positive impact of a
$47m fair valuation gain relating to the acquisition of an additional ownership interest in DJ Galvanizing in Canada and $92m of DDH income.
EBITDA in
Brazil up
+9.9% 4Q’14
Vs 4Q’13
EBITDA in
Brazil down
-2.6% YoY
7
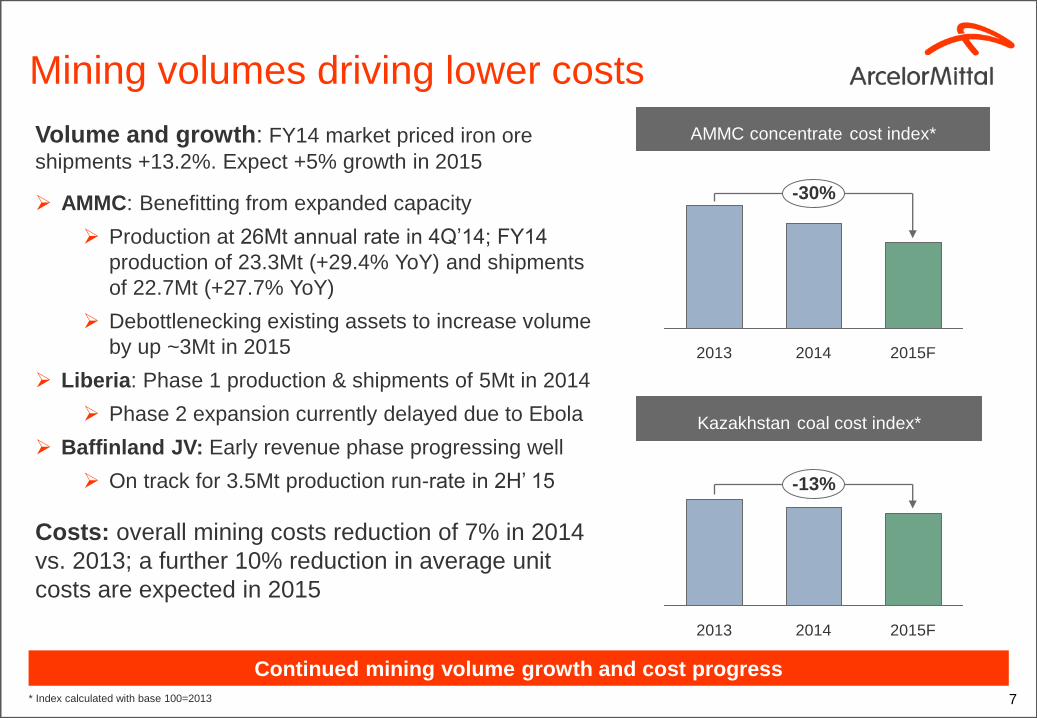
Mining volumes driving lower costs
Volume and growth: FY14 market priced iron ore
shipments +13.2%. Expect +5% growth in 2015
AMMC: Benefitting from expanded capacity
Production at 26Mt annual rate in 4Q’14; FY14
production of 23.3Mt (+29.4% YoY) and shipments
of 22.7Mt (+27.7% YoY)
Debottlenecking existing assets to increase volume
by up ~3Mt in 2015
Liberia: Phase 1 production & shipments of 5Mt in 2014
Phase 2 expansion currently delayed due to Ebola
Baffinland JV: Early revenue phase progressing well
On track for 3.5Mt production run-rate in 2H’ 15
Costs: overall mining costs reduction of 7% in 2014
vs. 2013; a further 10% reduction in average unit
costs are expected in 2015
Continued mining volume growth and cost progress
-13%
2015F 2014 2013
Kazakhstan coal cost index*
AMMC concentrate cost index*
2014
-30%
2015F 2013
* Index calculated with base 100=2013
8
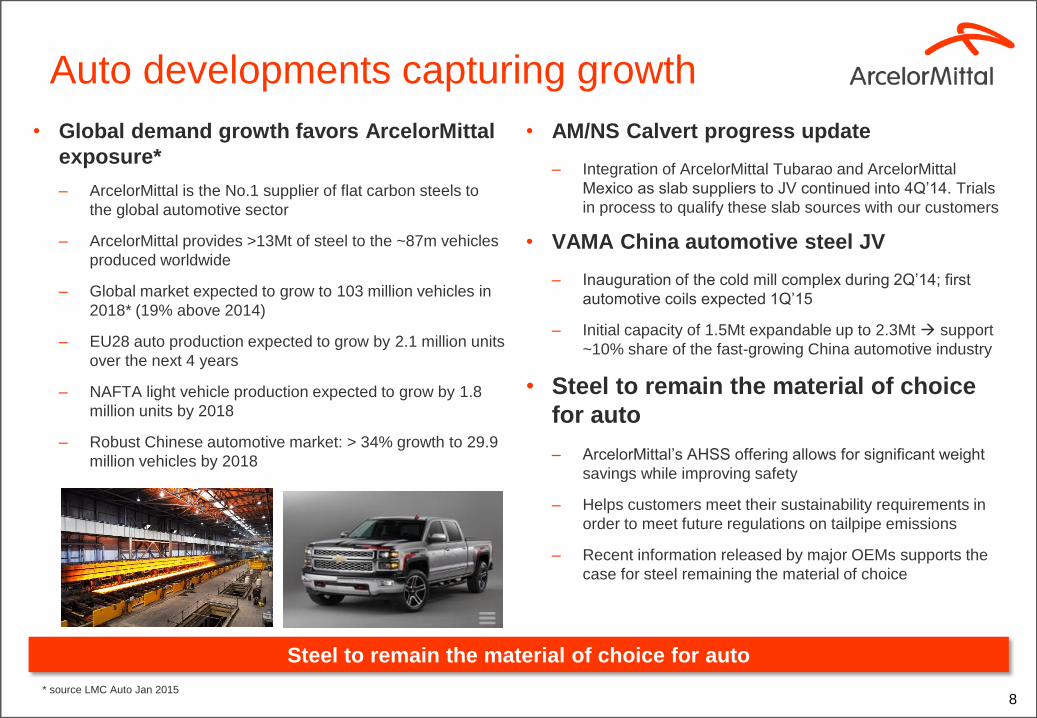
Auto developments capturing growth
• Global demand growth favors ArcelorMittal
exposure*
– ArcelorMittal is the No.1 supplier of flat carbon steels to
the global automotive sector
– ArcelorMittal provides >13Mt of steel to the ~87m vehicles
produced worldwide
– Global market expected to grow to 103 million vehicles in
2018* (19% above 2014)
– EU28 auto production expected to grow by 2.1 million units
over the next 4 years
– NAFTA light vehicle production expected to grow by 1.8
million units by 2018
– Robust Chinese automotive market: > 34% growth to 29.9
million vehicles by 2018
• AM/NS Calvert progress update
– Integration of ArcelorMittal Tubarao and ArcelorMittal
Mexico as slab suppliers to JV continued into 4Q’14. Trials
in process to qualify these slab sources with our customers
• VAMA China automotive steel JV
– Inauguration of the cold mill complex during 2Q’14; first
automotive coils expected 1Q’15
– Initial capacity of 1.5Mt expandable up to 2.3Mt support
~10% share of the fast-growing China automotive industry
• Steel to remain the material of choice
for auto
– ArcelorMittal’s AHSS offering allows for significant weight
savings while improving safety
– Helps customers meet their sustainability requirements in
order to meet future regulations on tailpipe emissions
– Recent information released by major OEMs supports the
case for steel remaining the material of choice
Steel to remain the material of choice for auto
* source LMC Auto Jan 2015

Capex discipline to continue into 2015
• Average of 2013 and 2014
was ~$3.6 billion
• 2015 growth capex continues
to decline with lower Mining
spend
Capex discipline – lower spend in 2015
9
Capex split ($ billions)
3.32.9
2.42.8
1.61.8
1.10.9
3.4 -8%
2015F 2014
3.7
2013
3.5
2012
4.7
2011
4.9
Maintenance
Growth
2014 capex included some carry over
from 2013 as well as extensive blast
furnace relines including:
• Newcastle BF#5 (South Africa);
• Kryviy Rih BF#6 (Ukraine);
• Temirtau BF#3 (Kazakhstan);
• Indiana BF#7 (US)
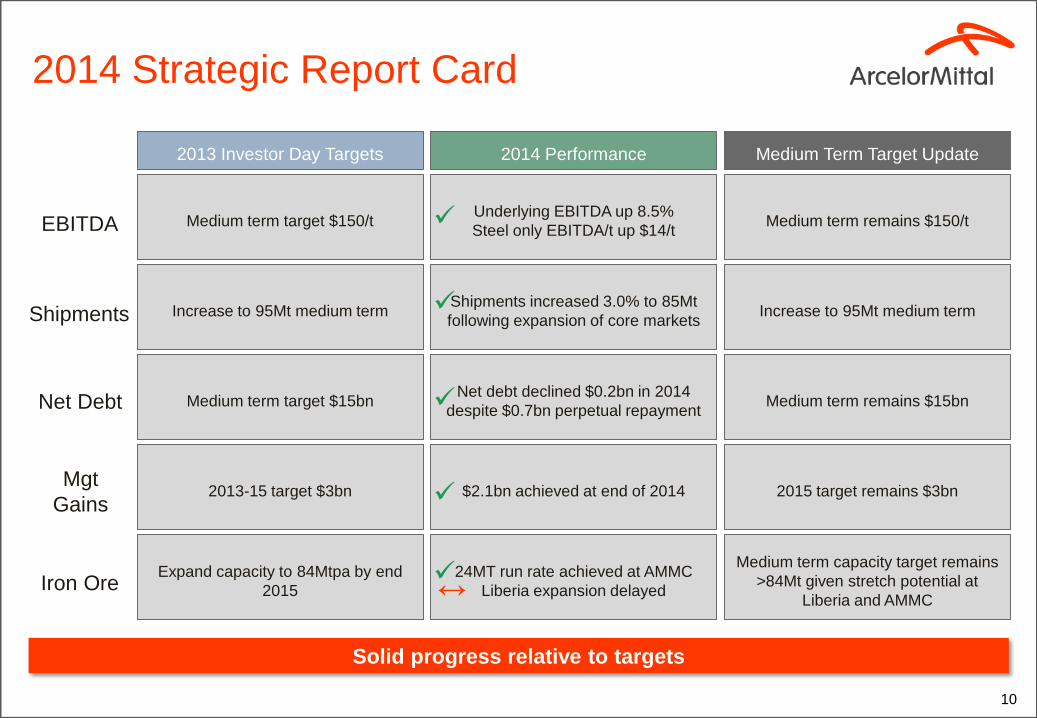
2014 Strategic Report Card
EBITDA
2013 Investor Day Targets 2014 Performance
Medium term target $150/t Underlying EBITDA up 8.5%
Steel only EBITDA/t up $14/t
Medium Term Target Update
Medium term remains $150/t
Net Debt Medium term target $15bn Net debt declined $0.2bn in 2014
despite $0.7bn perpetual repayment Medium term remains $15bn
Mgt
Gains 2013-15 target $3bn $2.1bn achieved at end of 2014 2015 target remains $3bn
10
Iron Ore Expand capacity to 84Mtpa by end
2015
24MT run rate achieved at AMMC
Liberia expansion delayed
Medium term capacity target remains
>84Mt given stretch potential at
Liberia and AMMC
Shipments Increase to 95Mt medium term Shipments increased 3.0% to 85Mt
following expansion of core markets Increase to 95Mt medium term
Solid progress relative to targets
↔
3536373839404142434445464748495051525354555657585960
Jan-0
6
Jul-06
Jan-0
7
Jul-07
Jan-0
8
Jul-08
Jan-0
9
Jul-09
Jan-1
0
Jul-10
Jan-1
1
Jul-11
Jan-1
2
Jul-12
Jan-1
3
Jul-13
Jan-1
4
Jul-14
Jan-1
5
Exp
ansio
nC
ontr
actio
n
11
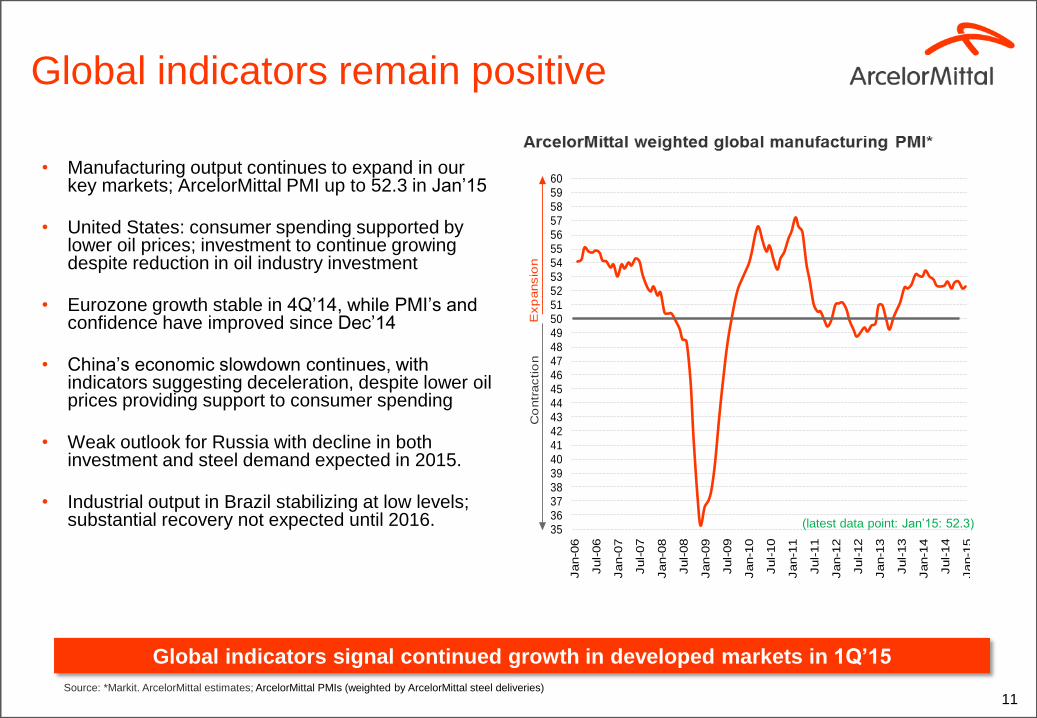
• Manufacturing output continues to expand in our key markets; ArcelorMittal PMI up to 52.3 in Jan’15
• United States: consumer spending supported by lower oil prices; investment to continue growing despite reduction in oil industry investment
• Eurozone growth stable in 4Q’14, while PMI’s and confidence have improved since Dec’14
• China’s economic slowdown continues, with indicators suggesting deceleration, despite lower oil prices providing support to consumer spending
• Weak outlook for Russia with decline in both investment and steel demand expected in 2015.
• Industrial output in Brazil stabilizing at low levels; substantial recovery not expected until 2016.
Global indicators remain positive
Source: *Markit. ArcelorMittal estimates; ArcelorMittal PMIs (weighted by ArcelorMittal steel deliveries)
Global indicators signal continued growth in developed markets in 1Q’15
(latest data point: Jan’15: 52.3)
12
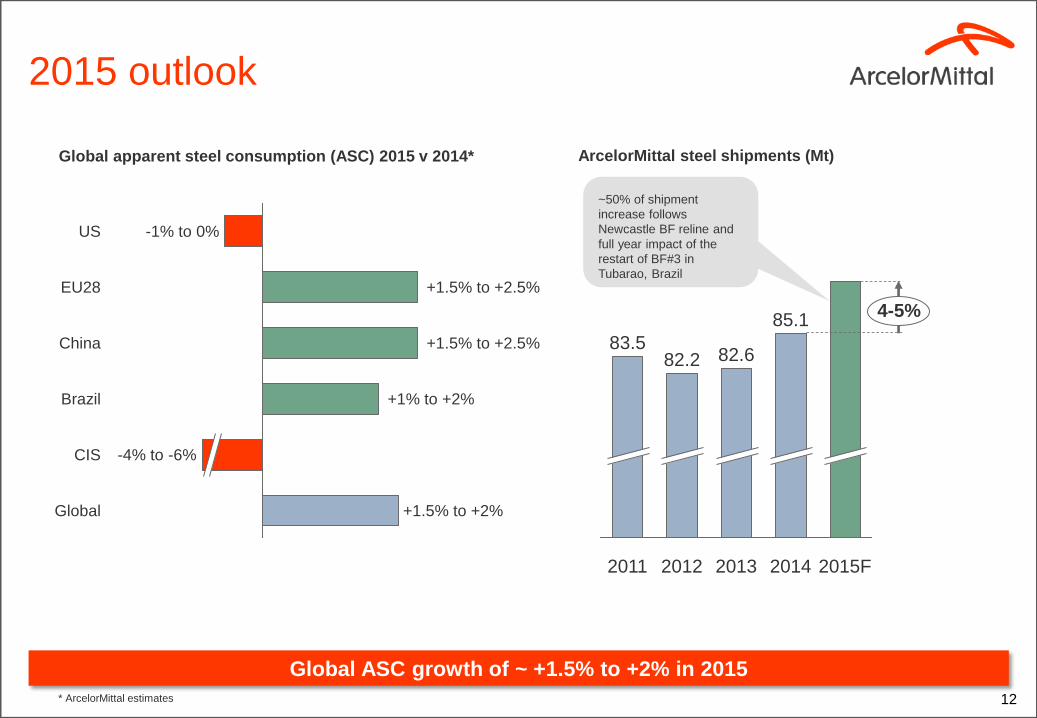
Global apparent steel consumption (ASC) 2015 v 2014*
* ArcelorMittal estimates
Global +1.5% to +2%
CIS -4% to -6%
Brazil +1% to +2%
China +1.5% to +2.5%
EU28 +1.5% to +2.5%
US -1% to 0%
Global ASC growth of ~ +1.5% to +2% in 2015
2015 outlook
ArcelorMittal steel shipments (Mt)
4-5%
2015F
83.5
2014
85.1
2013
82.6
2012
82.2
2011
~50% of shipment
increase follows
Newcastle BF reline and
full year impact of the
restart of BF#3 in
Tubarao, Brazil
Financial results
14
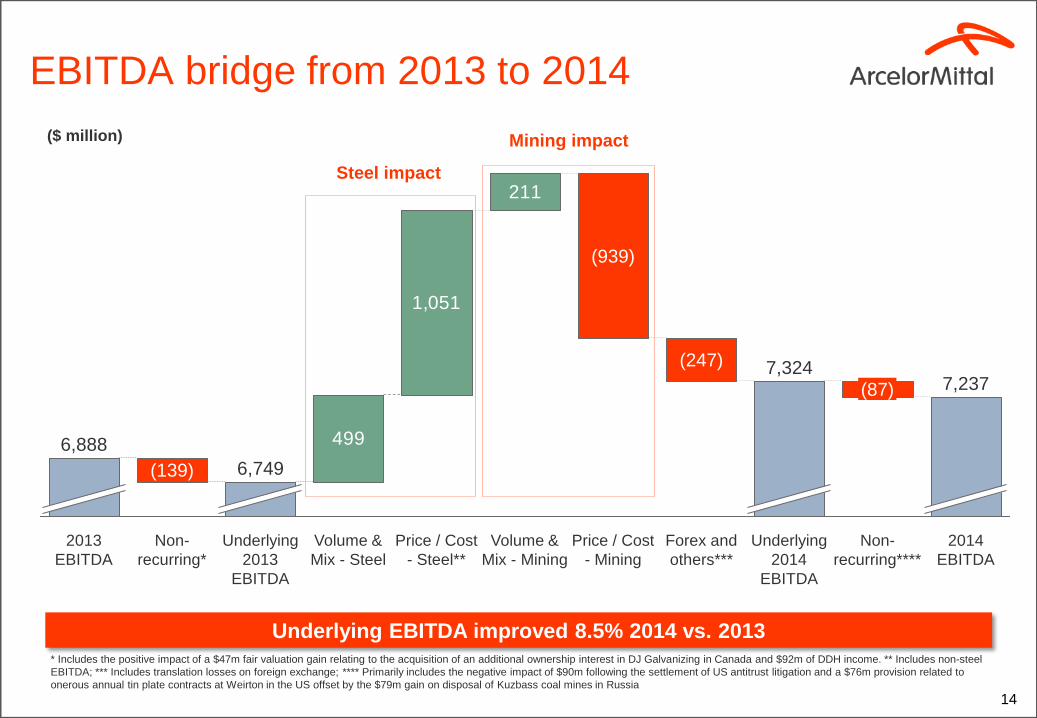
EBITDA bridge from 2013 to 2014
* Includes the positive impact of a $47m fair valuation gain relating to the acquisition of an additional ownership interest in DJ Galvanizing in Canada and $92m of DDH income. ** Includes non-steel
EBITDA; *** Includes translation losses on foreign exchange; **** Primarily includes the negative impact of $90m following the settlement of US antitrust litigation and a $76m provision related to
onerous annual tin plate contracts at Weirton in the US offset by the $79m gain on disposal of Kuzbass coal mines in Russia
($ million)
211
1,051
499
(247) 7,324
Underlying
2014
EBITDA
Forex and
others***
(87)
Non-
recurring****
7,237
2014
EBITDA
Price / Cost
- Mining
(939)
Volume &
Mix - Mining
Price / Cost
- Steel**
Volume &
Mix - Steel
Underlying
2013
EBITDA
6,749
Non-
recurring*
(139)
2013
EBITDA
6,888
Underlying EBITDA improved 8.5% 2014 vs. 2013
Mining impact
Steel impact
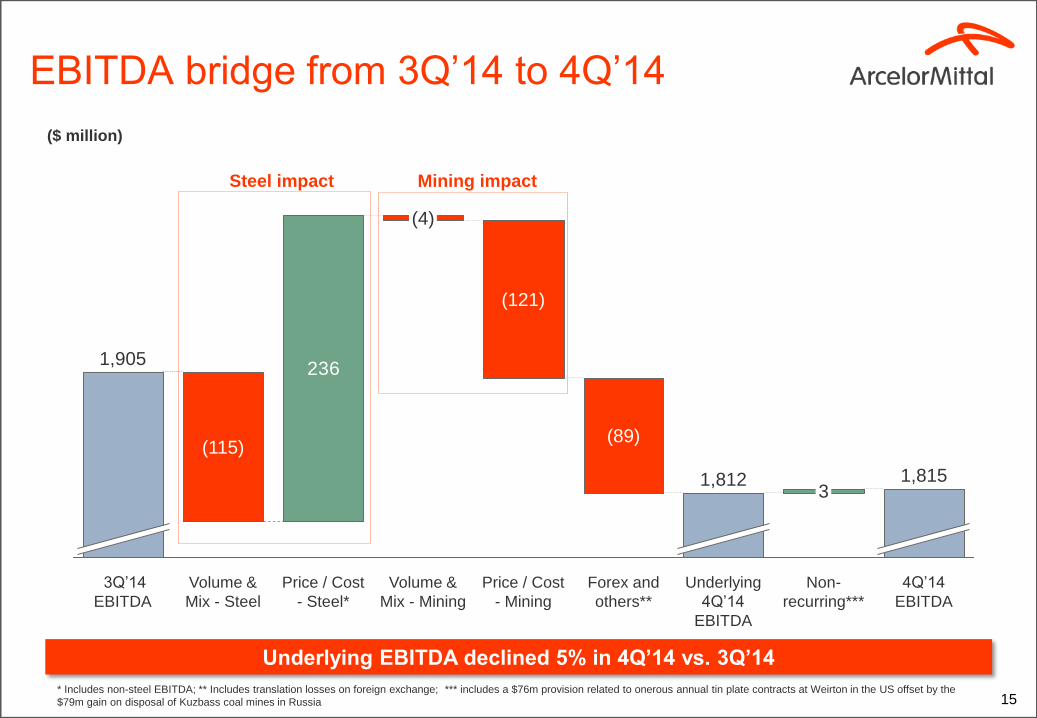
15 * Includes non-steel EBITDA; ** Includes translation losses on foreign exchange; *** includes a $76m provision related to onerous annual tin plate contracts at Weirton in the US offset by the
$79m gain on disposal of Kuzbass coal mines in Russia
EBITDA bridge from 3Q’14 to 4Q’14
($ million)
236
Underlying
4Q’14
EBITDA
1,812
Forex and
others**
3 1,815
Non-
recurring***
4Q’14
EBITDA
(89)
Price / Cost
- Mining
(121)
Volume &
Mix - Mining
(4)
Price / Cost
- Steel*
Volume &
Mix - Steel
(115)
3Q’14
EBITDA
1,905
Underlying EBITDA declined 5% in 4Q’14 vs. 3Q’14
Mining impact Steel impact
16
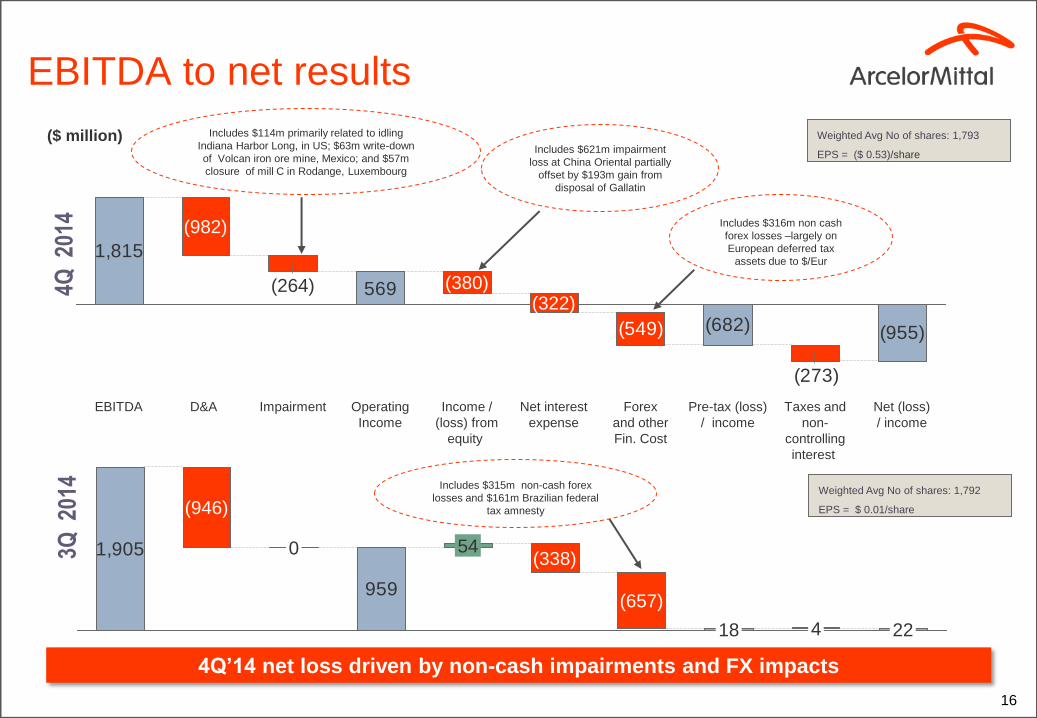
EBITDA to net results 3Q
201
4
Weighted Avg No of shares: 1,792
EPS = $ 0.01/share
4Q’14 net loss driven by non-cash impairments and FX impacts
4Q 2
014
Includes $114m primarily related to idling
Indiana Harbor Long, in US; $63m write-down
of Volcan iron ore mine, Mexico; and $57m
closure of mill C in Rodange, Luxembourg
1,815
(682) (955)
(273)
569
(549)
Net (loss)
/ income
Taxes and
non-
controlling
interest
Pre-tax (loss)
/ income
Forex
and other
Fin. Cost
Net interest
expense
(322)
Income /
(loss) from
equity
(380)
Operating
Income
Impairment
(264)
D&A
(982)
EBITDA
Weighted Avg No of shares: 1,793
EPS = ($ 0.53)/share
959
1,905 54
18 4
(657)
22
(338) 0
(946)
Includes $315m non-cash forex
losses and $161m Brazilian federal
tax amnesty
Includes $621m impairment
loss at China Oriental partially
offset by $193m gain from
disposal of Gallatin
($ million)
Includes $316m non cash
forex losses –largely on
European deferred tax
assets due to $/Eur

Solid cash flow performance in 2014
17
Net debt bridge FY13 v FY14 ($bn)
Recovering the investment grade credit rating remains a strategic priority
• Lowest level of net debt since the
merger in 2006
• Medium term net debt target remains
$15bn
0.70.5
3.7
2014 FY
15.8
Forex &
Others
(0.6)
M&A
proceeds
(0.6)
Perpetual
bond
Dividend Capex Cashflow
from
operations
(3.9)
2013 FY
16.1
* Net debt refers to long-term debt, plus short term debt, less cash and cash equivalents, restricted cash and short-term investments (including those held as part of asset/liabilities held for sale)
• Improved cash flow through lower
capex, working capital efficiency and
reduced net interest
• $1.1bn total dividends / perpetual bond
repayment in 2014
26.5
18.8 19.722.5 21.8
16.1 15.8
22.5
2014
15.8
2013 2012 2011 2010 2009 2008 2007
Net debt* (“NFD”) progression ($bn)
Includes Senegal payment $150m
and $90m US litigation costs
18
Outlook and guidance
• Group EBITDA is expected within the range of $6.5 billion to $7 billion in 2015
• Steel segments: Overall, steel markets continue to grow, in particular for our high value-added
products; a forecast 4-5% increase in shipment volumes (approximately half of which follows the
Newcastle reline completion and full year impact of the restart of BF#3 in Tubarao, Brazil)
together with improved cost performance are expected to offset the impact of lower transaction
prices and the impacts of translation
• Mining segment: Assuming current market conditions, in excess of one-third of the impact of
lower iron ore prices on revenues will be offset by improved cost performance including the
benefits of foreign exchange, energy and freight as well as higher volumes
• Additionally in 2015, the Company expects net interest expense to decline to approximately $1.4
billion and Capital expenditure to decline to approximately $3.4 billion
• As a result, at the bottom end of the guidance range the Company would expect to be free cash
flow positive
• While net debt is expected to follow a normal seasonal pattern, overall progress towards the
medium term net debt target of $15 billion is anticipated during the course of 2015
The Company expects EBITDA to be within the range of $6.5-$7.0 billion in 2015
Appendix
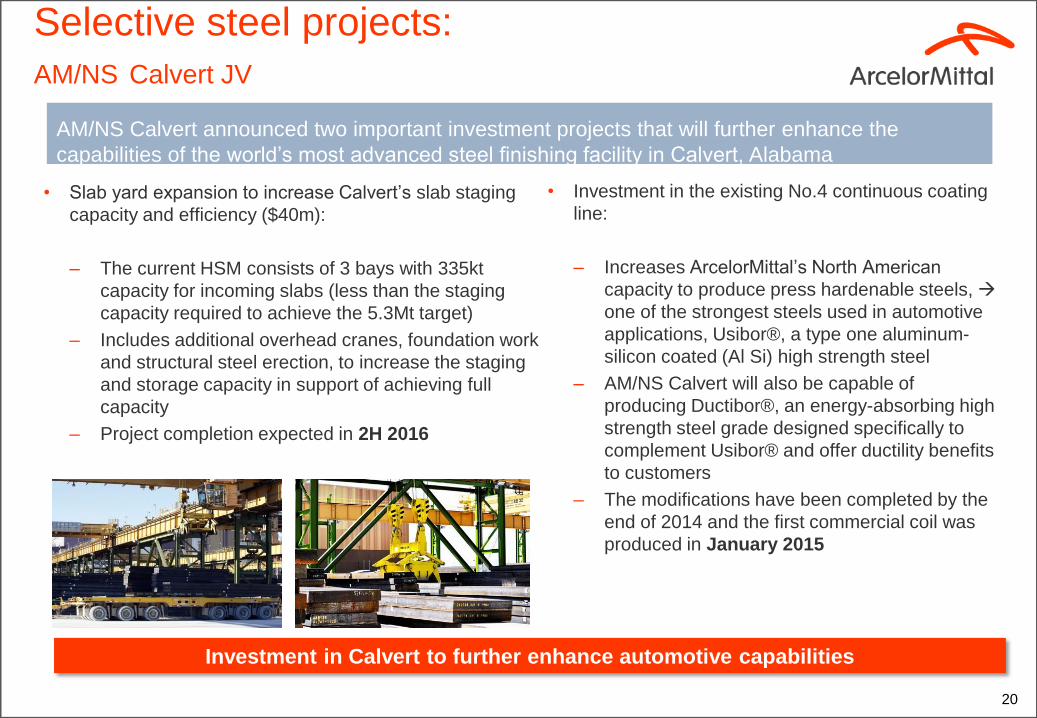
Selective steel projects:
AM/NS Calvert JV
• Slab yard expansion to increase Calvert’s slab staging
capacity and efficiency ($40m):
– The current HSM consists of 3 bays with 335kt
capacity for incoming slabs (less than the staging
capacity required to achieve the 5.3Mt target)
– Includes additional overhead cranes, foundation work
and structural steel erection, to increase the staging
and storage capacity in support of achieving full
capacity
– Project completion expected in 2H 2016
• Investment in the existing No.4 continuous coating
line:
– Increases ArcelorMittal’s North American
capacity to produce press hardenable steels,
one of the strongest steels used in automotive
applications, Usibor®, a type one aluminum-
silicon coated (Al Si) high strength steel
– AM/NS Calvert will also be capable of
producing Ductibor®, an energy-absorbing high
strength steel grade designed specifically to
complement Usibor® and offer ductility benefits
to customers
– The modifications have been completed by the
end of 2014 and the first commercial coil was
produced in January 2015
20 20
Investment in Calvert to further enhance automotive capabilities
AM/NS Calvert announced two important investment projects that will further enhance the
capabilities of the world’s most advanced steel finishing facility in Calvert, Alabama
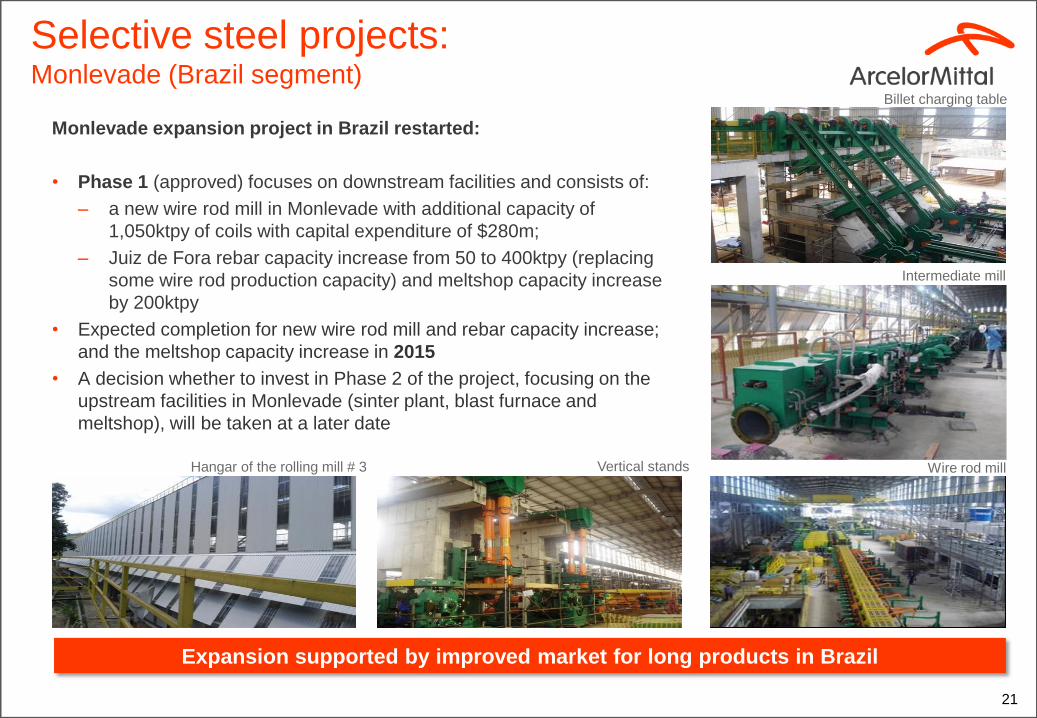
Monlevade expansion project in Brazil restarted:
• Phase 1 (approved) focuses on downstream facilities and consists of:
– a new wire rod mill in Monlevade with additional capacity of
1,050ktpy of coils with capital expenditure of $280m;
– Juiz de Fora rebar capacity increase from 50 to 400ktpy (replacing
some wire rod production capacity) and meltshop capacity increase
by 200ktpy
• Expected completion for new wire rod mill and rebar capacity increase;
and the meltshop capacity increase in 2015
• A decision whether to invest in Phase 2 of the project, focusing on the
upstream facilities in Monlevade (sinter plant, blast furnace and
meltshop), will be taken at a later date
21
Selective steel projects: Monlevade (Brazil segment)
Expansion supported by improved market for long products in Brazil
Vertical stands Hangar of the rolling mill # 3
Intermediate mill
Wire rod mill
Billet charging table
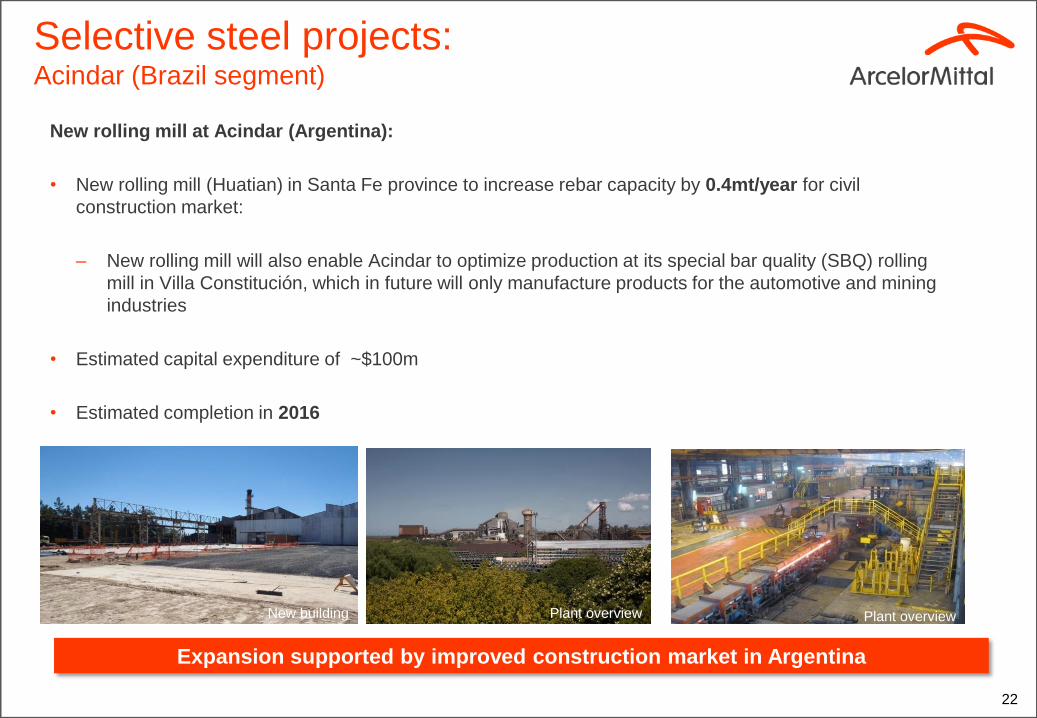
New rolling mill at Acindar (Argentina):
• New rolling mill (Huatian) in Santa Fe province to increase rebar capacity by 0.4mt/year for civil
construction market:
– New rolling mill will also enable Acindar to optimize production at its special bar quality (SBQ) rolling
mill in Villa Constitución, which in future will only manufacture products for the automotive and mining
industries
• Estimated capital expenditure of ~$100m
• Estimated completion in 2016
22 22
Selective steel projects: Acindar (Brazil segment)
Expansion supported by improved construction market in Argentina
New building Plant overview Plant overview
Selective steel projects: Dofasco (NAFTA)
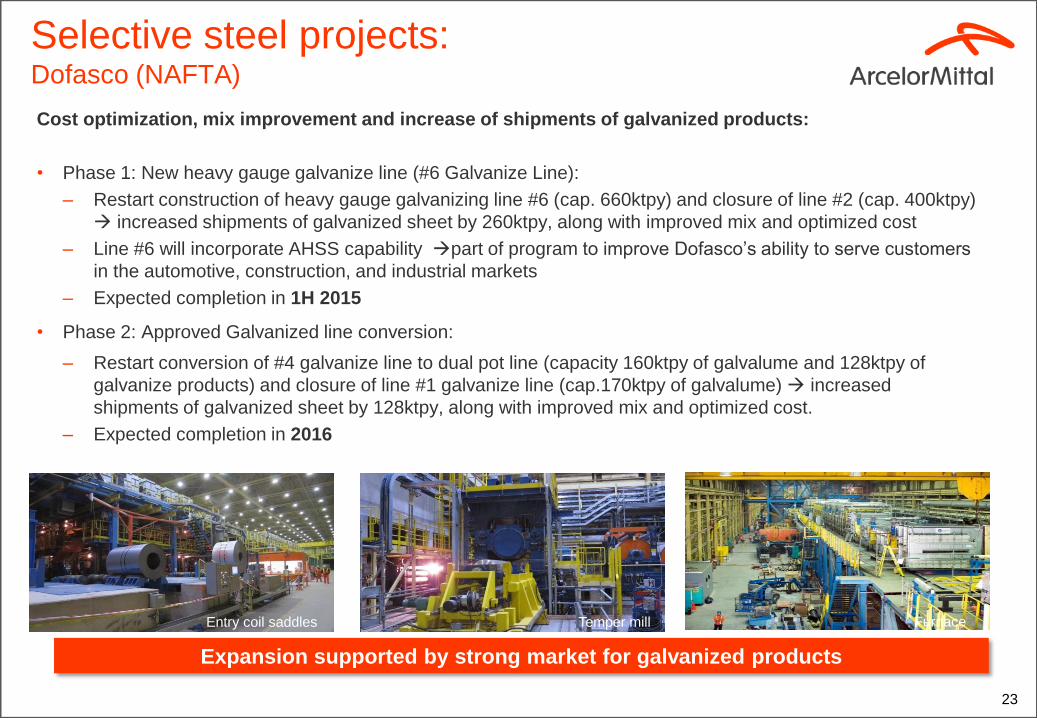
Cost optimization, mix improvement and increase of shipments of galvanized products:
• Phase 1: New heavy gauge galvanize line (#6 Galvanize Line):
– Restart construction of heavy gauge galvanizing line #6 (cap. 660ktpy) and closure of line #2 (cap. 400ktpy)
increased shipments of galvanized sheet by 260ktpy, along with improved mix and optimized cost
– Line #6 will incorporate AHSS capability part of program to improve Dofasco’s ability to serve customers
in the automotive, construction, and industrial markets
– Expected completion in 1H 2015
• Phase 2: Approved Galvanized line conversion:
– Restart conversion of #4 galvanize line to dual pot line (capacity 160ktpy of galvalume and 128ktpy of
galvanize products) and closure of line #1 galvanize line (cap.170ktpy of galvalume) increased
shipments of galvanized sheet by 128ktpy, along with improved mix and optimized cost.
– Expected completion in 2016
23 23
Expansion supported by strong market for galvanized products
Entry coil saddles Temper mill Furnace
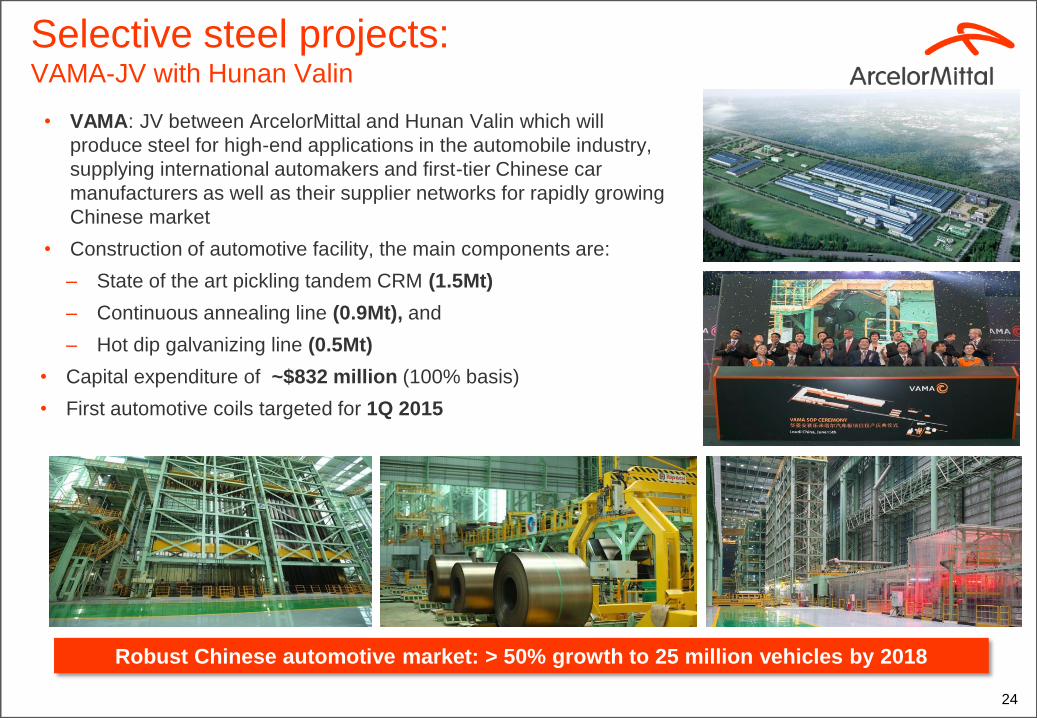
Selective steel projects: VAMA-JV with Hunan Valin
• VAMA: JV between ArcelorMittal and Hunan Valin which will
produce steel for high-end applications in the automobile industry,
supplying international automakers and first-tier Chinese car
manufacturers as well as their supplier networks for rapidly growing
Chinese market
• Construction of automotive facility, the main components are:
– State of the art pickling tandem CRM (1.5Mt)
– Continuous annealing line (0.9Mt), and
– Hot dip galvanizing line (0.5Mt)
• Capital expenditure of ~$832 million (100% basis)
• First automotive coils targeted for 1Q 2015
24 24
Robust Chinese automotive market: > 50% growth to 25 million vehicles by 2018
3
5
7
9
11
13
15
17
19
Jan-0
7
May-0
7
Sep
-07
Jan-0
8
May-0
8
Sep
-08
Jan-0
9
May-0
9
Sep
-09
Jan-1
0
May-1
0
Sep
-10
Jan-1
1
May-1
1
Sep
-11
Jan-1
2
May-1
2
Sep
-12
Jan-1
3
May-1
3
Sep
-13
Jan-1
4
May-1
4
Sep
-14
EU28
USA
15
25
35
45
55
65
Jan-0
7
May-0
7
Sep
-07
Jan-0
8
May-0
8
Sep
-08
Jan-0
9
May-0
9
Sep
-09
Jan-1
0
May-1
0
Sep
-10
Jan-1
1
May-1
1
Sep
-11
Jan-1
2
May-1
2
Sep
-12
Jan-1
3
May-1
3
Sep
-13
Jan-1
4
May-1
4
Sep
-14
Developing ex China
China
Developed
25
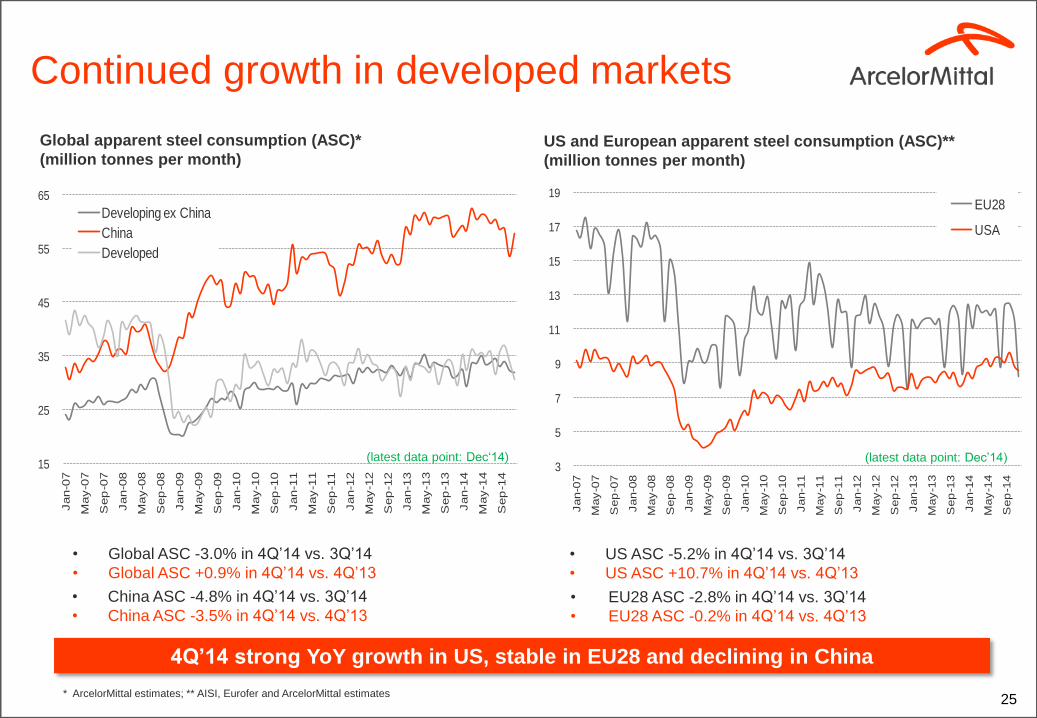
Continued growth in developed markets
Global apparent steel consumption (ASC)*
(million tonnes per month) US and European apparent steel consumption (ASC)**
(million tonnes per month)
* ArcelorMittal estimates; ** AISI, Eurofer and ArcelorMittal estimates
• China ASC -4.8% in 4Q’14 vs. 3Q’14
• China ASC -3.5% in 4Q’14 vs. 4Q’13 • EU28 ASC -2.8% in 4Q’14 vs. 3Q’14
• EU28 ASC -0.2% in 4Q’14 vs. 4Q’13
• Global ASC -3.0% in 4Q’14 vs. 3Q’14
• Global ASC +0.9% in 4Q’14 vs. 4Q’13
• US ASC -5.2% in 4Q’14 vs. 3Q’14
• US ASC +10.7% in 4Q’14 vs. 4Q’13
4Q’14 strong YoY growth in US, stable in EU28 and declining in China
(latest data point: Dec‘14) (latest data point: Dec’14)

30
35
40
45
50
55
60
65
Jan-0
6
Ap
r-06
Jul-06
Oct-
06
Jan-0
7
Ap
r-07
Jul-07
Oct-
07
Jan-0
8
Ap
r-08
Jul-08
Oct-
08
Jan-0
9
Ap
r-09
Jul-09
Oct-
09
Jan-1
0
Ap
r-10
Jul-10
Oct-
10
Jan-1
1
Ap
r-11
Jul-11
Oct-
11
Jan-1
2
Ap
r-12
Jul-12
Oct-
12
Jan-1
3
Ap
r-13
Jul-13
Oct-
13
Jan-1
4
Ap
r-14
Jul-14
Oct-
14
Eurozone construction PMI
USA Architectural Billings Index
200
250
300
350
400
450
500
550
600
650
700
750
Jan-0
2
Jul-02
Jan-0
3
Jul-03
Jan-0
4
Jul-04
Jan-0
5
Jul-05
Jan-0
6
Jul-06
Jan-0
7
Jul-07
Jan-0
8
Jul-08
Jan-0
9
Jul-09
Jan-1
0
Jul-10
Jan-1
1
Jul-11
Jan-1
2
Jul-12
Jan-1
3
Jul-13
Jan-1
4
Jul-14
Residential
Non-residential
US construction growth continues;
Europe picking up but growth remains weak • In the United states:
– Improvements in labour markets and easing of credit provide further support for a recovery of construction demand in 2015.
– Non-residential construction is growing strongly (6% y-o-y) and the Architecture Billings Index has been above 50, indicating expansion, since May 2014.
• In Europe:
– Following a strong decline in 2012 and 2013, European construction output in 2014 grew around 2% y-o-y
– Indicators point to a further mild pick-up in 2015 growth
US residential and non-residential construction indicators
(SAAR) $bn*
26 * Source: US Census Bureau; ** Source: Markit and The American Institute of Architects
Eurozone and US construction indicators**
(latest data point: Dec’14)
(latest data point: Dec’14)
Construction gradually improving
0
3
6
9
12
15
18
21
0
20
40
60
80
100
120
Jan-0
7A
pr-
07
Jul-07
Oct-
07
Jan-0
8A
pr-
08
Jul-08
Oct-
08
Jan-0
9A
pr-
09
Jul-09
Oct-
09
Jan-1
0A
pr-
10
Jul-10
Oct-
10
Jan-1
1A
pr-
11
Jul-11
Oct-
11
Jan-1
2A
pr-
12
Jul-12
Oct-
12
Jan-1
3A
pr-
13
Jul-13
Oct-
13
Jan-1
4A
pr-
14
Jul-14
Oct-
14
Jan-1
5
Steel inventory at warehouses (RHS)
Finished steel production (LHS)
Steel inventory at mills (RHS)
-15%
0%
15%
30%
45%
60%
75%
Jan-0
7
Ap
r-07
Jul-07
Oct-
07
Jan-0
8
Ap
r-08
Jul-08
Oct-
08
Jan-0
9
Ap
r-09
Jul-09
Oct-
09
Jan-1
0
Ap
r-10
Jul-10
Oct-
10
Jan-1
1
Ap
r-11
Jul-11
Oct-
11
Jan-1
2
Ap
r-12
Jul-12
Oct-
12
Jan-1
3
Ap
r-13
Jul-13
Oct-
13
Jan-1
4
Ap
r-14
Jul-14
Oct-
14
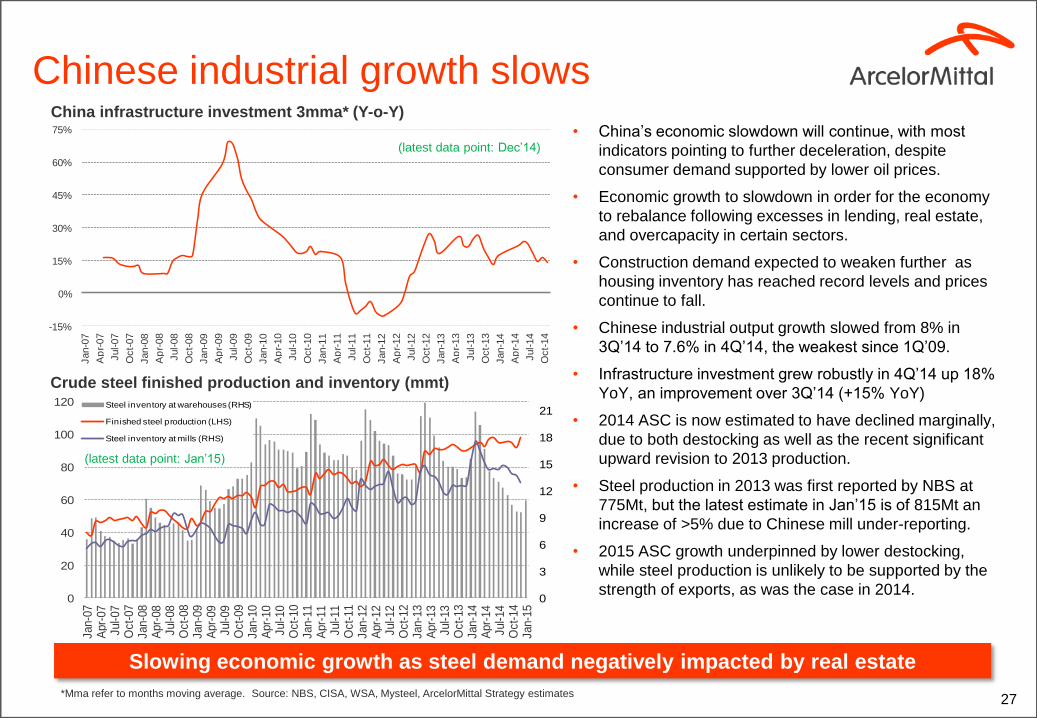
Chinese industrial growth slows
• China’s economic slowdown will continue, with most
indicators pointing to further deceleration, despite
consumer demand supported by lower oil prices.
• Economic growth to slowdown in order for the economy
to rebalance following excesses in lending, real estate,
and overcapacity in certain sectors.
• Construction demand expected to weaken further as
housing inventory has reached record levels and prices
continue to fall.
• Chinese industrial output growth slowed from 8% in
3Q’14 to 7.6% in 4Q’14, the weakest since 1Q’09.
• Infrastructure investment grew robustly in 4Q’14 up 18%
YoY, an improvement over 3Q’14 (+15% YoY)
• 2014 ASC is now estimated to have declined marginally,
due to both destocking as well as the recent significant
upward revision to 2013 production.
• Steel production in 2013 was first reported by NBS at
775Mt, but the latest estimate in Jan’15 is of 815Mt an
increase of >5% due to Chinese mill under-reporting.
• 2015 ASC growth underpinned by lower destocking,
while steel production is unlikely to be supported by the
strength of exports, as was the case in 2014.
27
Crude steel finished production and inventory (mmt)
*Mma refer to months moving average. Source: NBS, CISA, WSA, Mysteel, ArcelorMittal Strategy estimates
China infrastructure investment 3mma* (Y-o-Y)
Slowing economic growth as steel demand negatively impacted by real estate
(latest data point: Jan’15)
(latest data point: Dec’14)
1.5
2.0
2.5
3.0
3.5
4.0
4.5
5.0
0100200300400500600700800900
1,0001,1001,2001,3001,400
Ja
n-0
7A
pr-
07
Ju
l-0
7O
ct-
07
Ja
n-0
8A
pr-
08
Ju
l-0
8O
ct-
08
Ja
n-0
9A
pr-
09
Ju
l-0
9O
ct-
09
Ja
n-1
0A
pr-
10
Ju
l-1
0O
ct-
10
Ja
n-1
1A
pr-
11
Ju
l-11
Oct-
11
Ja
n-1
2A
pr-
12
Ju
l-1
2O
ct-
12
Ja
n-1
3A
pr-
13
Ju
l-1
3O
ct-
13
Ja
n-1
4A
pr-
14
Ju
l-1
4O
ct-
14
Flat stocks at service centres
Months of supply (RHS)
0%
5%
10%
15%
20%
25%
30%
35%
40%
45%
50%
2
4
6
8
10
12
14
16
18
20
22
Ja
n-0
7A
pr-
07
Ju
l-0
7O
ct-
07
Ja
n-0
8A
pr-
08
Ju
l-0
8O
ct-
08
Ja
n-0
9A
pr-
09
Ju
l-0
9O
ct-
09
Ja
n-1
0A
pr-
10
Ju
l-1
0O
ct-
10
Ja
n-1
1A
pr-
11
Ju
l-11
Oct-
11
Ja
n-1
2A
pr-
12
Ju
l-1
2O
ct-
12
Ja
n-1
3A
pr-
13
Ju
l-1
3O
ct-
13
Ja
n-1
4A
pr-
14
Ju
l-1
4O
ct-
14
Ja
n-1
5
Flat and Long
% of ASC (RHS)
0.0
1.0
2.0
3.0
4.0
5.0
0
500
1,000
1,500
2,000
2,500
Ja
n-0
7A
pr-
07
Ju
l-0
7O
ct-
07
Ja
n-0
8A
pr-
08
Ju
l-0
8O
ct-
08
Ja
n-0
9A
pr-
09
Ju
l-0
9O
ct-
09
Ja
n-1
0A
pr-
10
Ju
l-1
0O
ct-
10
Ja
n-1
1A
pr-
11
Ju
l-11
Oct-
11
Ja
n-1
2A
pr-
12
Ju
l-1
2O
ct-
12
Ja
n-1
3A
pr-
13
Ju
l-1
3O
ct-
13
Ja
n-1
4A
pr-
14
Ju
l-1
4O
ct-
14
Germany Flat Stocks
Months Supply (RHS)
2.0
2.2
2.4
2.6
2.8
3.0
3.2
3.4
3.6
0
2,000
4,000
6,000
8,000
10,000
12,000
14,000
Jan
-07
Ap
r-0
7Ju
l-0
7O
ct-0
7Ja
n-0
8A
pr-
08
Jul-
08
Oct
-08
Jan
-09
Ap
r-0
9Ju
l-0
9O
ct-0
9Ja
n-1
0A
pr-
10
Jul-
10
Oct
-10
Jan
-11
Ap
r-11
Jul-
11O
ct-1
1Ja
n-1
2A
pr-
12
Jul-
12
Oct
-12
Jan
-13
Ap
r-1
3Ju
l-1
3O
ct-1
3Ja
n-1
4A
pr-
14
Jul-
14
Oct
-14
USA (MSCI)
Months Supply
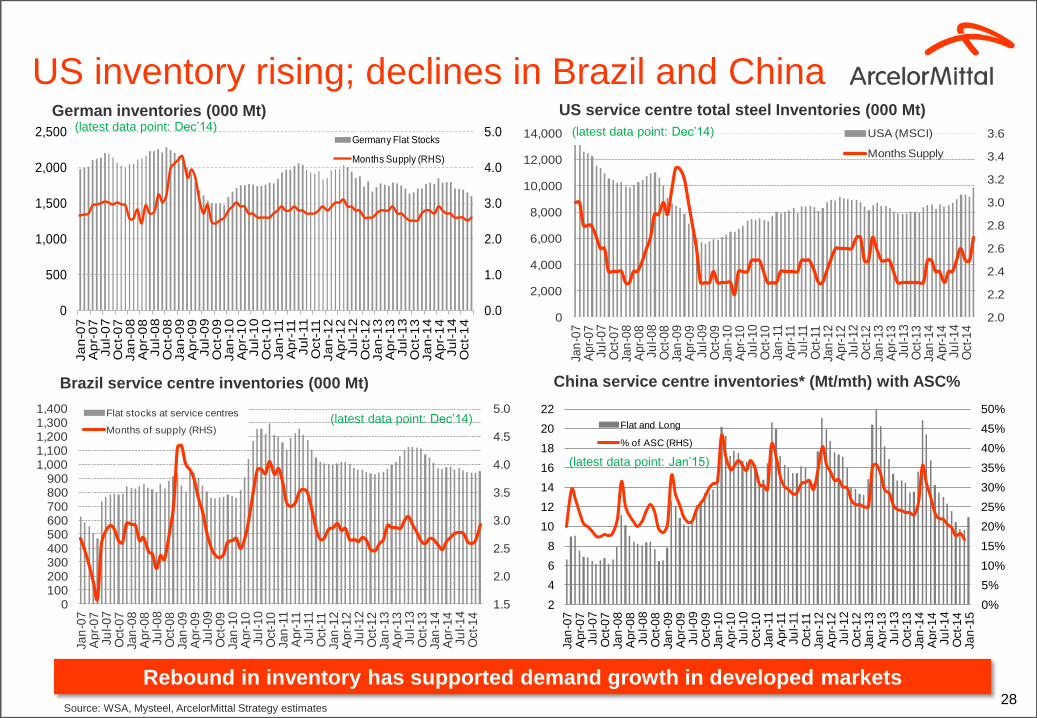
US inventory rising; declines in Brazil and China German inventories (000 Mt)
28
China service centre inventories* (Mt/mth) with ASC% Brazil service centre inventories (000 Mt)
US service centre total steel Inventories (000 Mt)
Source: WSA, Mysteel, ArcelorMittal Strategy estimates
Rebound in inventory has supported demand growth in developed markets
(latest data point: Dec’14)
(latest data point: Dec’14)
(latest data point: Jan’15)
(latest data point: Dec’14)
20
30
40
50
60
70
80
90
100
110
120
130
Ja
n 0
8
Ap
r 0
8
Ju
l 0
8
Oct 0
8
Ja
n 0
9
Ap
r 0
9
Ju
l 0
9
Oct 0
9
Ja
n 1
0
Ap
r 1
0
Ju
l 1
0
Oct 1
0
Ja
n 1
1
Ap
r 11
Ju
l 11
Oct 11
Ja
n 1
2
Ap
r 1
2
Ju
l 1
2
Oct 1
2
Ja
n 1
3
Ap
r 1
3
Ju
l 1
3
Oct 1
3
Ja
n 1
4
Ap
r 1
4
Ju
l 1
4
Oct 1
4
Ja
n-1
5
Spot Iron Ore
Coking Coal
Scrap
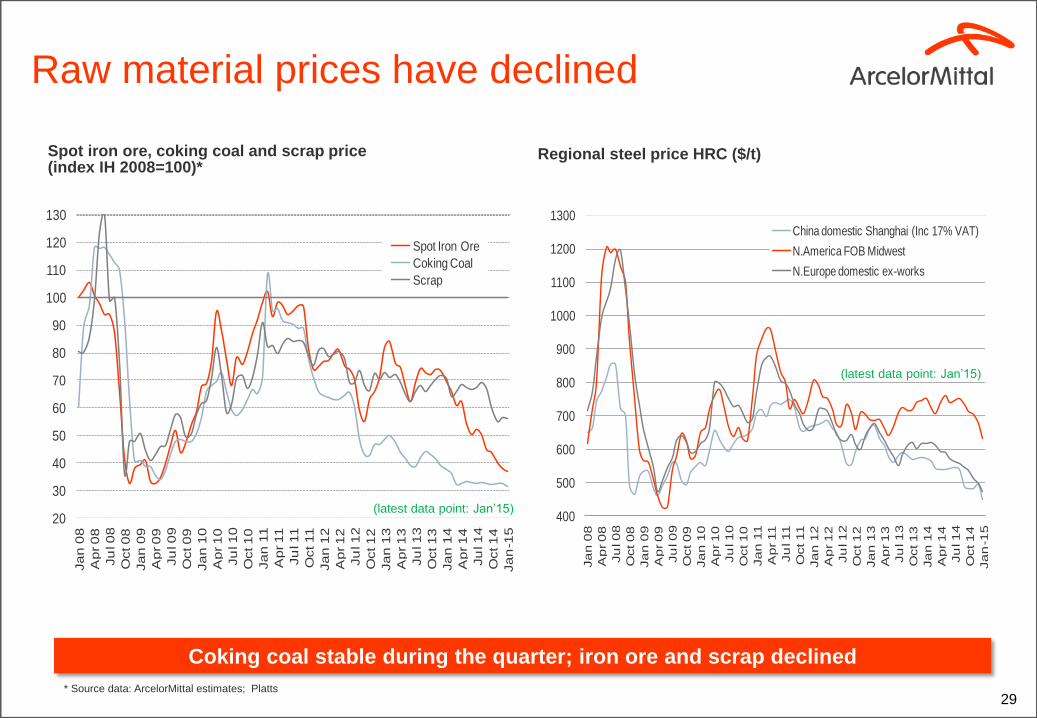
Raw material prices have declined
Spot iron ore, coking coal and scrap price (index IH 2008=100)*
Regional steel price HRC ($/t)
29
Coking coal stable during the quarter; iron ore and scrap declined
* Source data: ArcelorMittal estimates; Platts
(latest data point: Jan’15) 400
500
600
700
800
900
1000
1100
1200
1300
Ja
n 0
8
Ap
r 0
8
Ju
l 0
8
Oct 0
8
Ja
n 0
9
Ap
r 0
9
Ju
l 0
9
Oct 0
9
Ja
n 1
0
Ap
r 1
0
Ju
l 1
0
Oct 1
0
Ja
n 1
1
Ap
r 11
Ju
l 11
Oct 11
Ja
n 1
2
Ap
r 1
2
Ju
l 1
2
Oct 1
2
Ja
n 1
3
Ap
r 1
3
Ju
l 1
3
Oct 1
3
Ja
n 1
4
Ap
r 1
4
Ju
l 1
4
Oct 1
4
Ja
n-1
5
China domestic Shanghai (Inc 17% VAT)
N.America FOB Midwest
N.Europe domestic ex-works
(latest data point: Jan’15)
30
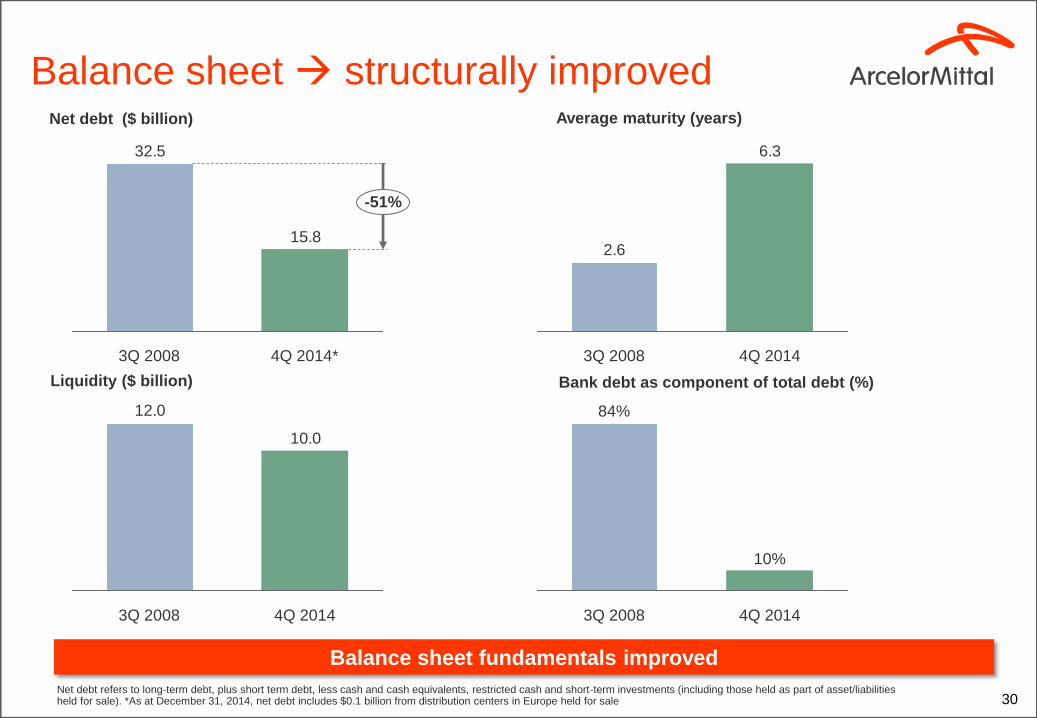
Net debt ($ billion) Average maturity (years)
Liquidity ($ billion) Bank debt as component of total debt (%)
Balance sheet structurally improved
15.8
32.5
-51%
4Q 2014* 3Q 2008
6.3
2.6
4Q 2014 3Q 2008
10.0
12.0
4Q 2014 3Q 2008 4Q 2014
10%
3Q 2008
84%
Balance sheet fundamentals improved
Net debt refers to long-term debt, plus short term debt, less cash and cash equivalents, restricted cash and short-term investments (including those held as part of asset/liabilities held for sale). *As at December 31, 2014, net debt includes $0.1 billion from distribution centers in Europe held for sale
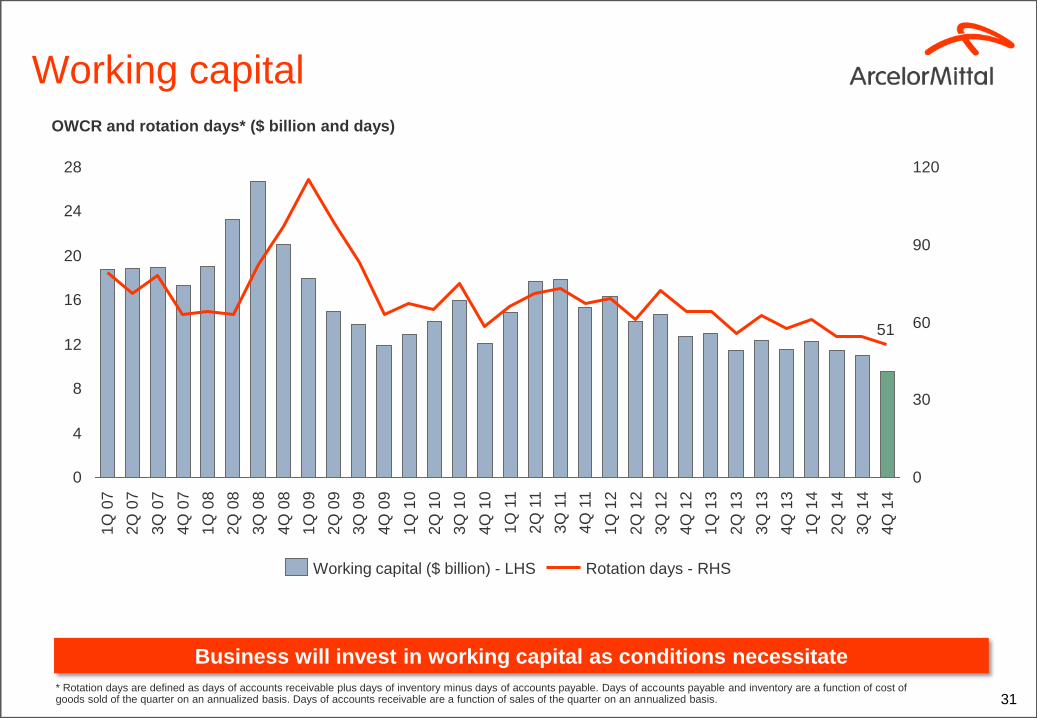
Working capital
31
OWCR and rotation days* ($ billion and days)
Business will invest in working capital as conditions necessitate
* Rotation days are defined as days of accounts receivable plus days of inventory minus days of accounts payable. Days of accounts payable and inventory are a function of cost of goods sold of the quarter on an annualized basis. Days of accounts receivable are a function of sales of the quarter on an annualized basis.
51
0
4
8
12
16
20
24
28
0
30
60
90
120
3Q
08
2Q
08
1Q
08
4Q
07
3Q
07
2Q
07
1Q
07
4Q
14
3Q
14
2Q
14
1Q
14
4Q
13
3Q
13
2Q
13
1Q
13
4Q
12
3Q
12
2Q
12
1Q
12
4Q
11
3Q
11
2Q
11
1Q
11
4Q
10
3Q
10
2Q
10
1Q
10
4Q
09
3Q
09
2Q
09
1Q
09
4Q
08
Rotation days - RHS Working capital ($ billion) - LHS
32
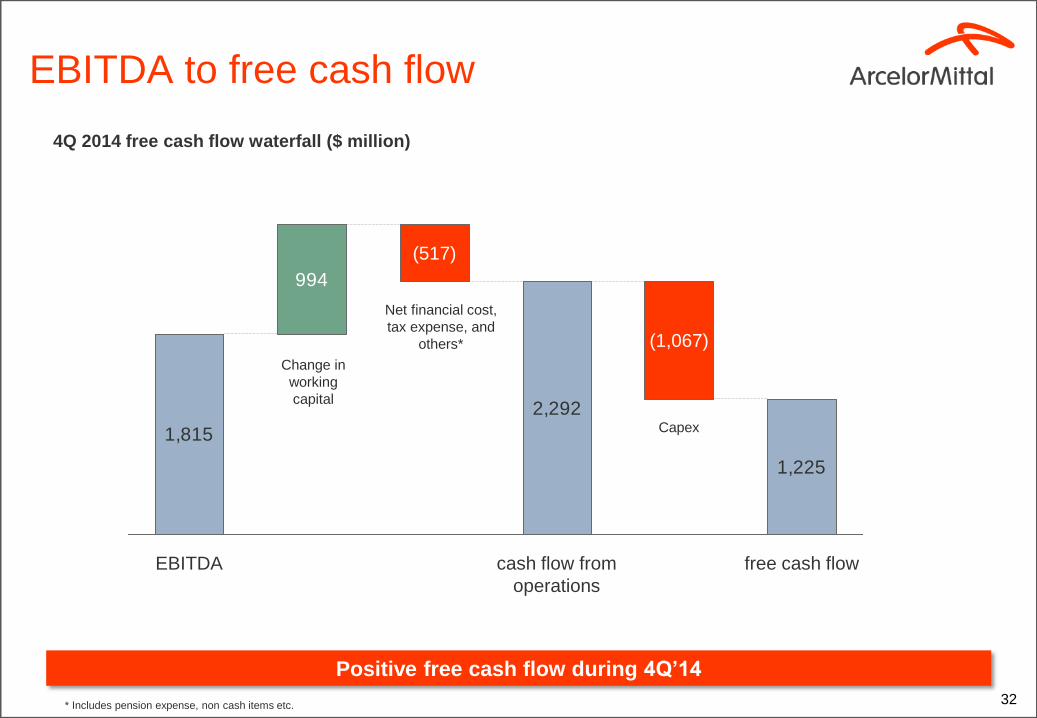
EBITDA to free cash flow
4Q 2014 free cash flow waterfall ($ million)
1,815
2,292
1,225
994
free cash flow
(517)
cash flow from
operations
(1,067)
EBITDA
Change in
working
capital
Net financial cost,
tax expense, and
others*
Capex
* Includes pension expense, non cash items etc.
Positive free cash flow during 4Q’14
33
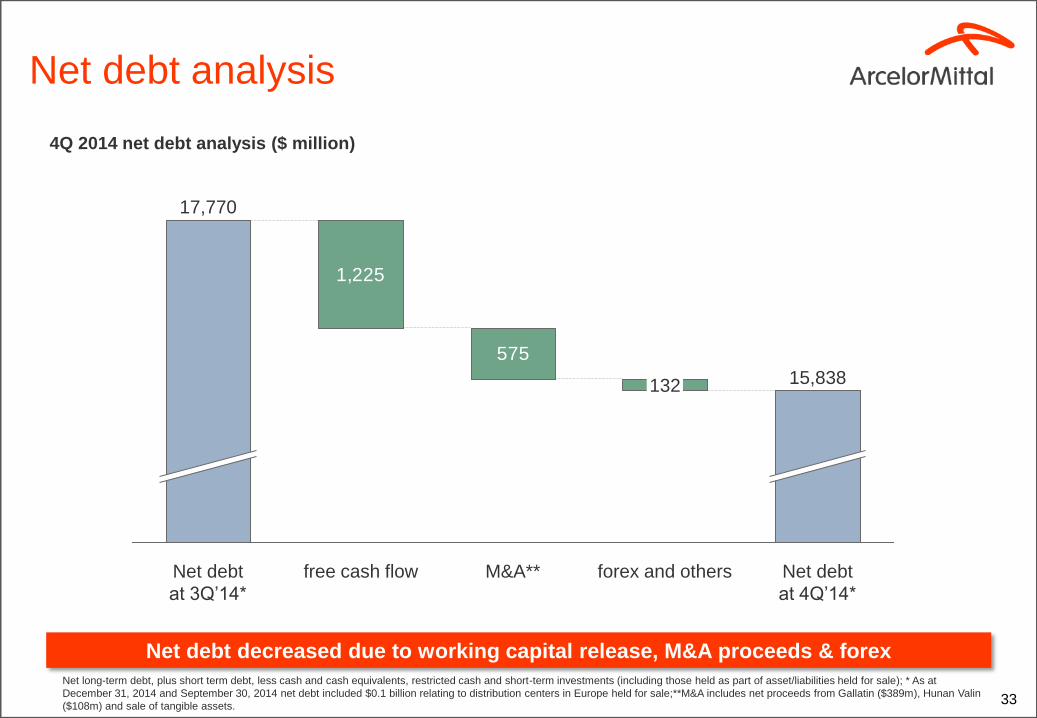
Net debt analysis
4Q 2014 net debt analysis ($ million)
575
1,225
Net debt
at 4Q’14*
15,838
forex and others
132
M&A** free cash flow Net debt
at 3Q’14*
17,770
Net long-term debt, plus short term debt, less cash and cash equivalents, restricted cash and short-term investments (including those held as part of asset/liabilities held for sale); * As at
December 31, 2014 and September 30, 2014 net debt included $0.1 billion relating to distribution centers in Europe held for sale;**M&A includes net proceeds from Gallatin ($389m), Hunan Valin
($108m) and sale of tangible assets.
Net debt decreased due to working capital release, M&A proceeds & forex
34
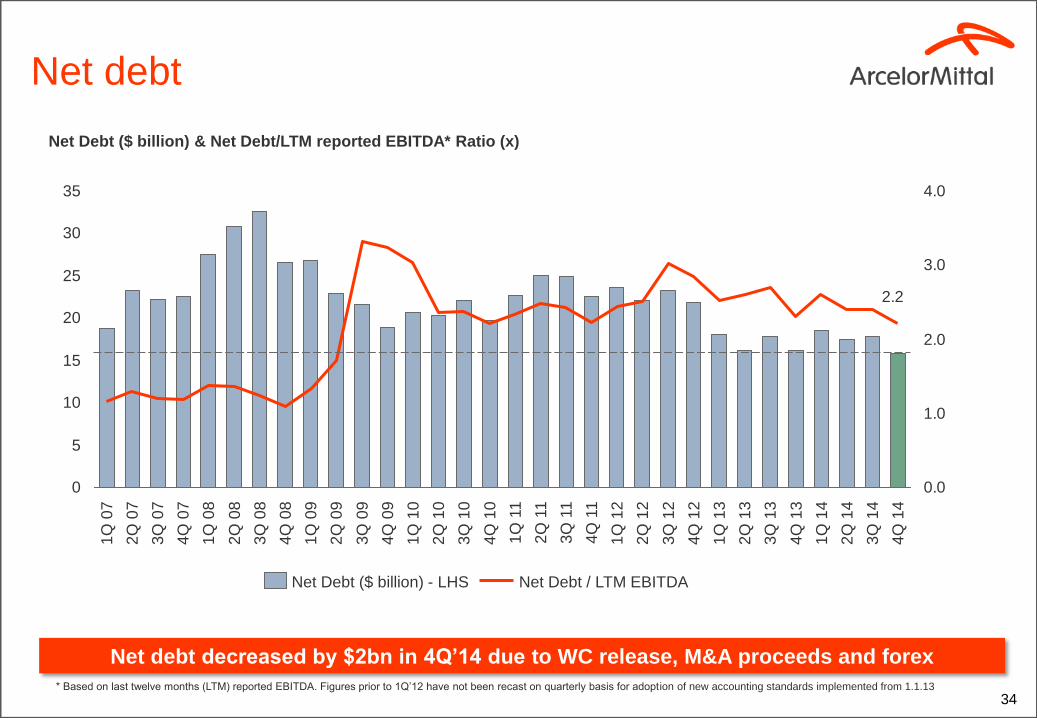
Net debt
Net Debt ($ billion) & Net Debt/LTM reported EBITDA* Ratio (x)
* Based on last twelve months (LTM) reported EBITDA. Figures prior to 1Q’12 have not been recast on quarterly basis for adoption of new accounting standards implemented from 1.1.13
2.2
0
5
10
15
20
25
30
35
0.0
1.0
2.0
3.0
4.0
4Q
14
3Q
14
2Q
14
1Q
14
4Q
13
3Q
13
2Q
13
1Q
13
4Q
12
3Q
12
2Q
12
1Q
12
4Q
11
2Q
11
1Q
11
4Q
10
3Q
10
2Q
10
1Q
10
4Q
09
3Q
09
2Q
09
1Q
09
4Q
08
3Q
08
2Q
08
1Q
08
4Q
07
3Q
07
2Q
07
1Q
07
3Q
11
Net Debt / LTM EBITDA Net Debt ($ billion) - LHS
Net debt decreased by $2bn in 4Q’14 due to WC release, M&A proceeds and forex
35
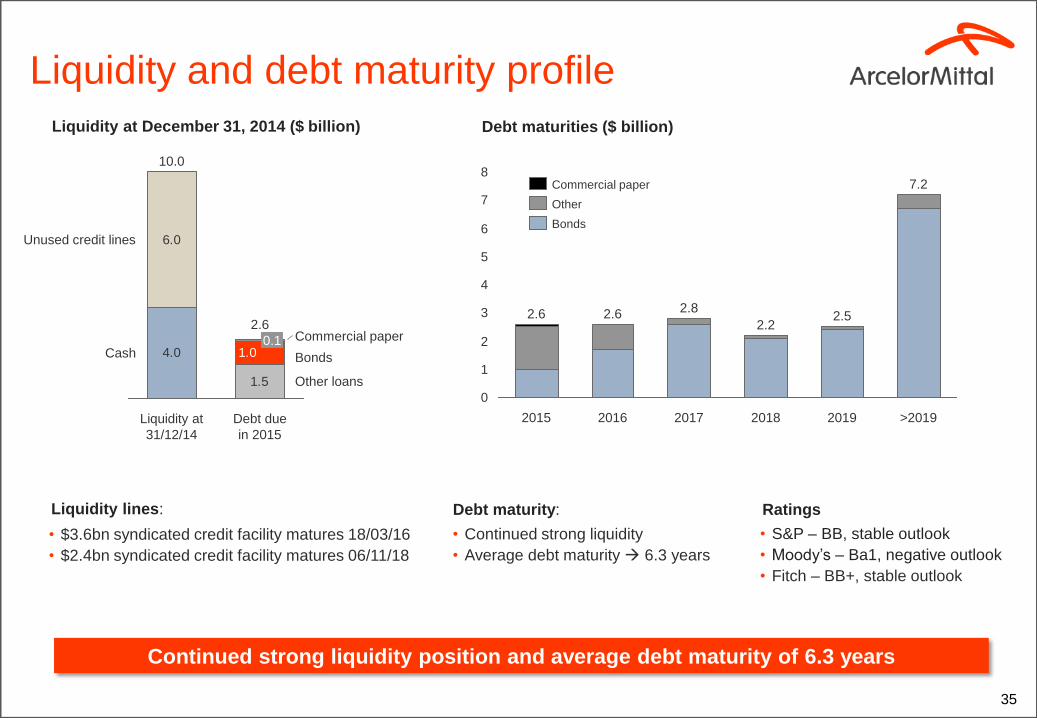
Liquidity and debt maturity profile
Debt maturities ($ billion) Liquidity at December 31, 2014 ($ billion)
Liquidity lines:
• $3.6bn syndicated credit facility matures 18/03/16
• $2.4bn syndicated credit facility matures 06/11/18
• Continued strong liquidity
• Average debt maturity 6.3 years
Debt maturity: Ratings
• S&P – BB, stable outlook
• Moody’s – Ba1, negative outlook
• Fitch – BB+, stable outlook
0
1
2
3
4
5
6
7
8
>2019
7.2
2019
2.5
2018
2.2
2017
2.8
2016
2.6
2015
2.6
Bonds
Other
Commercial paper
1.5
1.04.0
6.0Unused credit lines
Debt due
in 2015
2.6
0.1
Liquidity at
31/12/14
10.0
Other loans
Cash Bonds
Commercial paper
Continued strong liquidity position and average debt maturity of 6.3 years
36
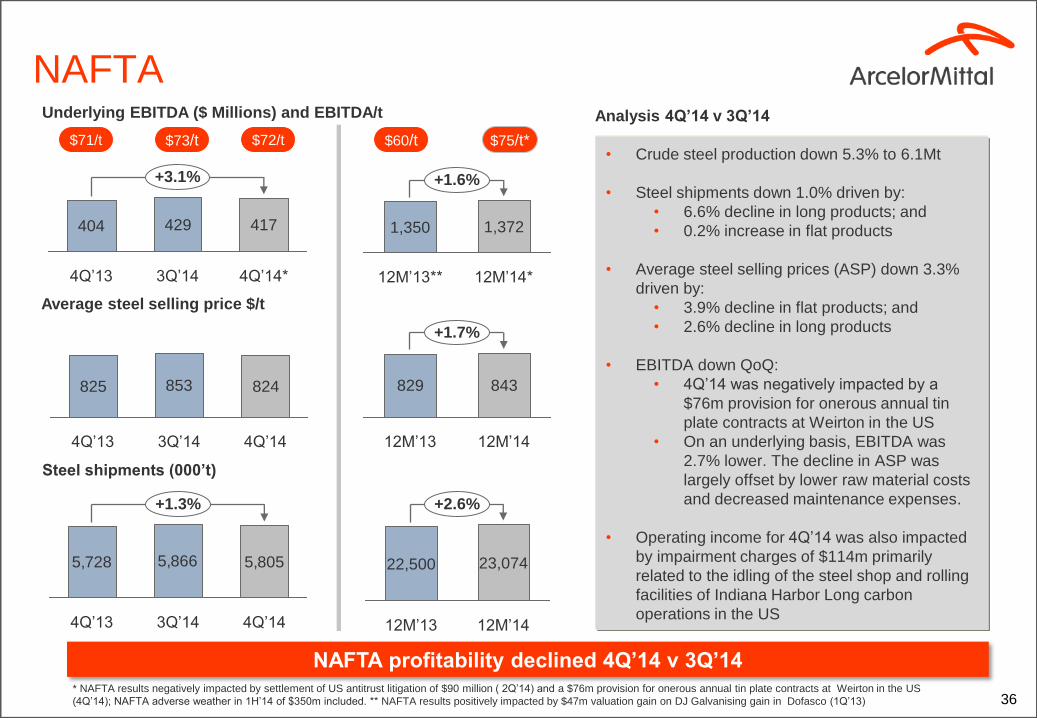
NAFTA
Average steel selling price $/t
* NAFTA results negatively impacted by settlement of US antitrust litigation of $90 million ( 2Q’14) and a $76m provision for onerous annual tin plate contracts at Weirton in the US
(4Q’14); NAFTA adverse weather in 1H’14 of $350m included. ** NAFTA results positively impacted by $47m valuation gain on DJ Galvanising gain in Dofasco (1Q’13)
• Crude steel production down 5.3% to 6.1Mt
• Steel shipments down 1.0% driven by:
• 6.6% decline in long products; and
• 0.2% increase in flat products
• Average steel selling prices (ASP) down 3.3%
driven by:
• 3.9% decline in flat products; and
• 2.6% decline in long products
• EBITDA down QoQ:
• 4Q’14 was negatively impacted by a
$76m provision for onerous annual tin
plate contracts at Weirton in the US
• On an underlying basis, EBITDA was
2.7% lower. The decline in ASP was
largely offset by lower raw material costs
and decreased maintenance expenses.
• Operating income for 4Q’14 was also impacted
by impairment charges of $114m primarily
related to the idling of the steel shop and rolling
facilities of Indiana Harbor Long carbon
operations in the US
Analysis 4Q’14 v 3Q’14
Steel shipments (000’t)
Underlying EBITDA ($ Millions) and EBITDA/t
825 853 824
4Q’14 3Q’14 4Q’13
5,728 5,866 5,805
+1.3%
4Q’14 3Q’14 4Q’13
404 429 417
+3.1%
4Q’14* 3Q’14 4Q’13
NAFTA profitability declined 4Q’14 v 3Q’14
$71/t
+2.6%
12M’14 12M’13
22,500 23,074
+1.6%
12M’14*
1,372
12M’13**
1,350
829 843
+1.7%
12M’14 12M’13
$73/t $60/t $75/t* $72/t
37
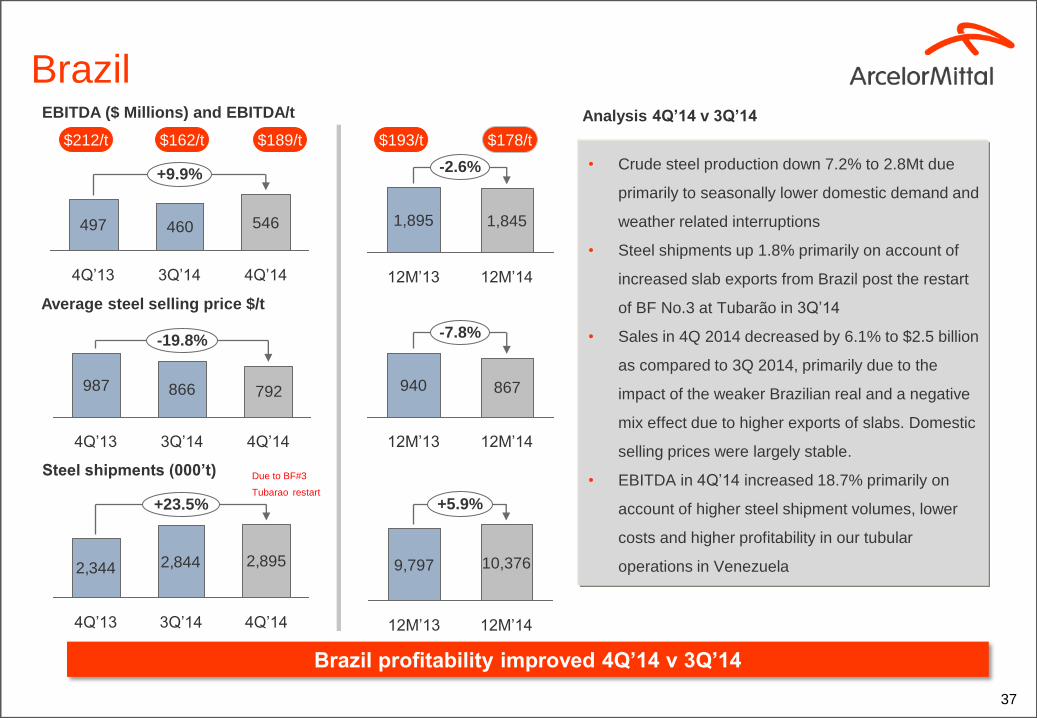
Brazil
Average steel selling price $/t
• Crude steel production down 7.2% to 2.8Mt due
primarily to seasonally lower domestic demand and
weather related interruptions
• Steel shipments up 1.8% primarily on account of
increased slab exports from Brazil post the restart
of BF No.3 at Tubarão in 3Q’14
• Sales in 4Q 2014 decreased by 6.1% to $2.5 billion
as compared to 3Q 2014, primarily due to the
impact of the weaker Brazilian real and a negative
mix effect due to higher exports of slabs. Domestic
selling prices were largely stable.
• EBITDA in 4Q’14 increased 18.7% primarily on
account of higher steel shipment volumes, lower
costs and higher profitability in our tubular
operations in Venezuela
Analysis 4Q’14 v 3Q’14
Steel shipments (000’t)
EBITDA ($ Millions) and EBITDA/t
987 866 792
-19.8%
4Q’14 3Q’14 4Q’13
2,344 2,844 2,895
4Q’13 3Q’14 4Q’14
+23.5%
497 460 546
+9.9%
4Q’14 3Q’14 4Q’13
Brazil profitability improved 4Q’14 v 3Q’14
$212/t
10,376
12M’13 12M’14
+5.9%
9,797
1,845
-2.6%
12M’14 12M’13
1,895
940 867
12M’13
-7.8%
12M’14
$162/t $193/t $178/t $189/t
Due to BF#3
Tubarao restart
38
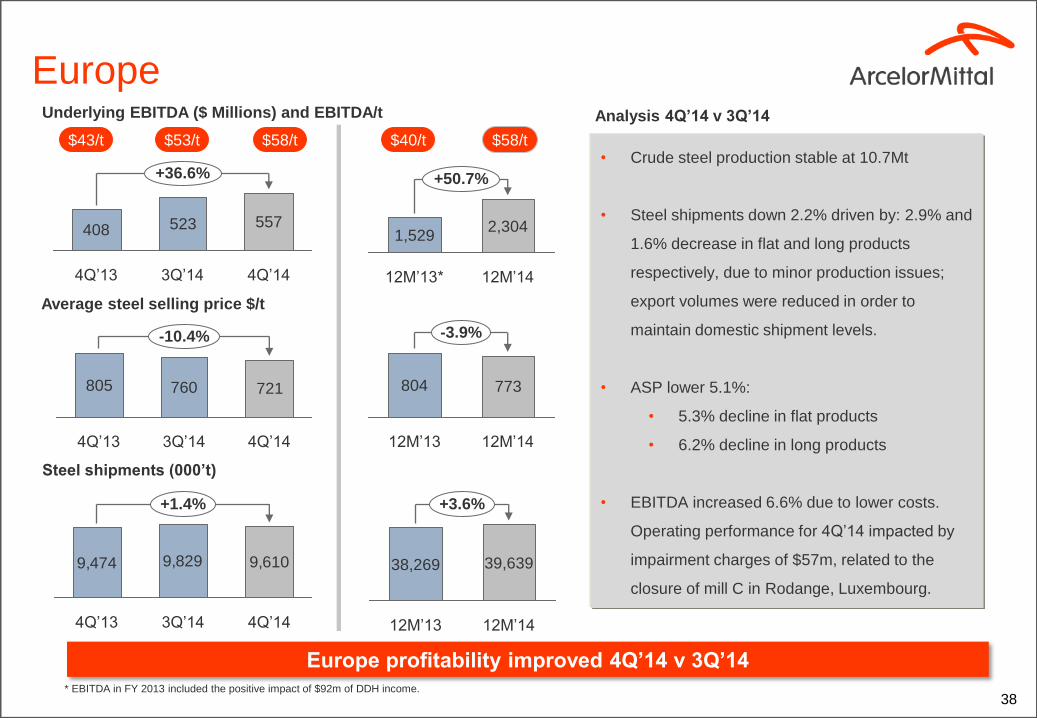
Europe
Average steel selling price $/t
• Crude steel production stable at 10.7Mt
• Steel shipments down 2.2% driven by: 2.9% and
1.6% decrease in flat and long products
respectively, due to minor production issues;
export volumes were reduced in order to
maintain domestic shipment levels.
• ASP lower 5.1%:
• 5.3% decline in flat products
• 6.2% decline in long products
• EBITDA increased 6.6% due to lower costs.
Operating performance for 4Q’14 impacted by
impairment charges of $57m, related to the
closure of mill C in Rodange, Luxembourg.
Analysis 4Q’14 v 3Q’14
Steel shipments (000’t)
Underlying EBITDA ($ Millions) and EBITDA/t
805 760 721
-10.4%
4Q’14 3Q’14 4Q’13
9,474 9,829 9,610
+1.4%
4Q’14 3Q’14 4Q’13
408 523 557
+36.6%
4Q’14 3Q’14 4Q’13
Europe profitability improved 4Q’14 v 3Q’14
$43/t
+3.6%
12M’14
39,639
12M’13
38,269
+50.7%
12M’14
2,304
12M’13*
1,529
804 773
-3.9%
12M’14 12M’13
$53/t $40/t $58/t $58/t
* EBITDA in FY 2013 included the positive impact of $92m of DDH income.
39
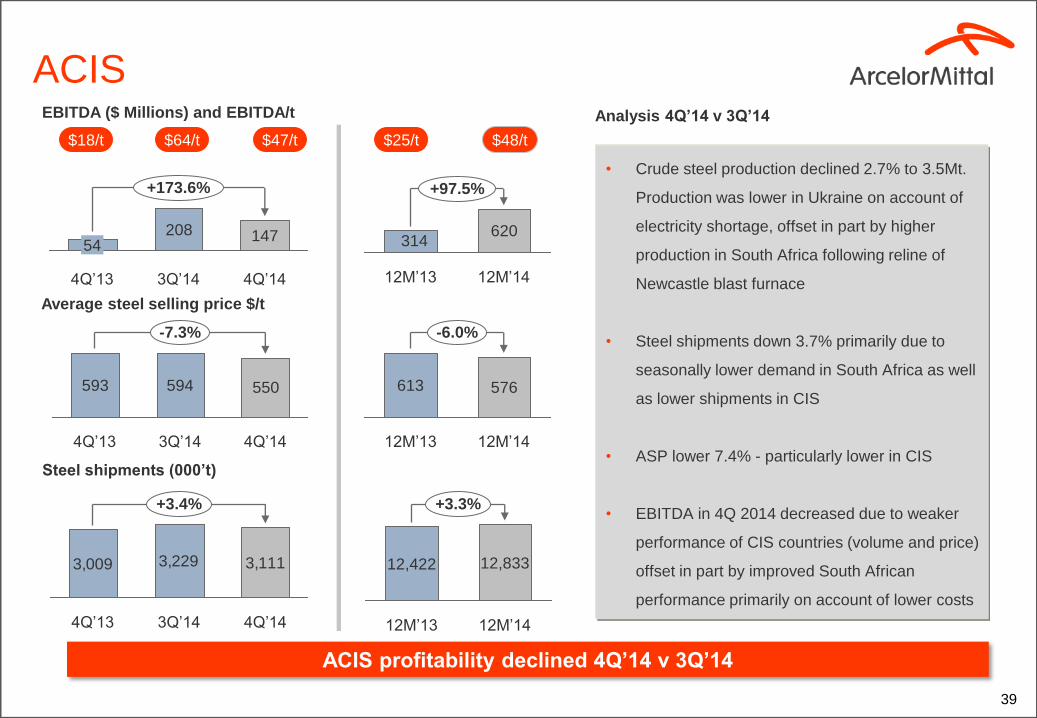
ACIS
Average steel selling price $/t
• Crude steel production declined 2.7% to 3.5Mt.
Production was lower in Ukraine on account of
electricity shortage, offset in part by higher
production in South Africa following reline of
Newcastle blast furnace
• Steel shipments down 3.7% primarily due to
seasonally lower demand in South Africa as well
as lower shipments in CIS
• ASP lower 7.4% - particularly lower in CIS
• EBITDA in 4Q 2014 decreased due to weaker
performance of CIS countries (volume and price)
offset in part by improved South African
performance primarily on account of lower costs
Analysis 4Q’14 v 3Q’14
Steel shipments (000’t)
EBITDA ($ Millions) and EBITDA/t
593 594 550
-7.3%
4Q’14 3Q’14 4Q’13
3,009 3,229 3,111
+3.4%
4Q’14 3Q’14 4Q’13
208 147
+173.6%
4Q’14 3Q’14 4Q’13
54
ACIS profitability declined 4Q’14 v 3Q’14
$18/t
+3.3%
12M’14
12,833
12M’13
12,422
620314
12M’13
+97.5%
12M’14
613 576
12M’13
-6.0%
12M’14
$64/t $25/t $48/t $47/t
40
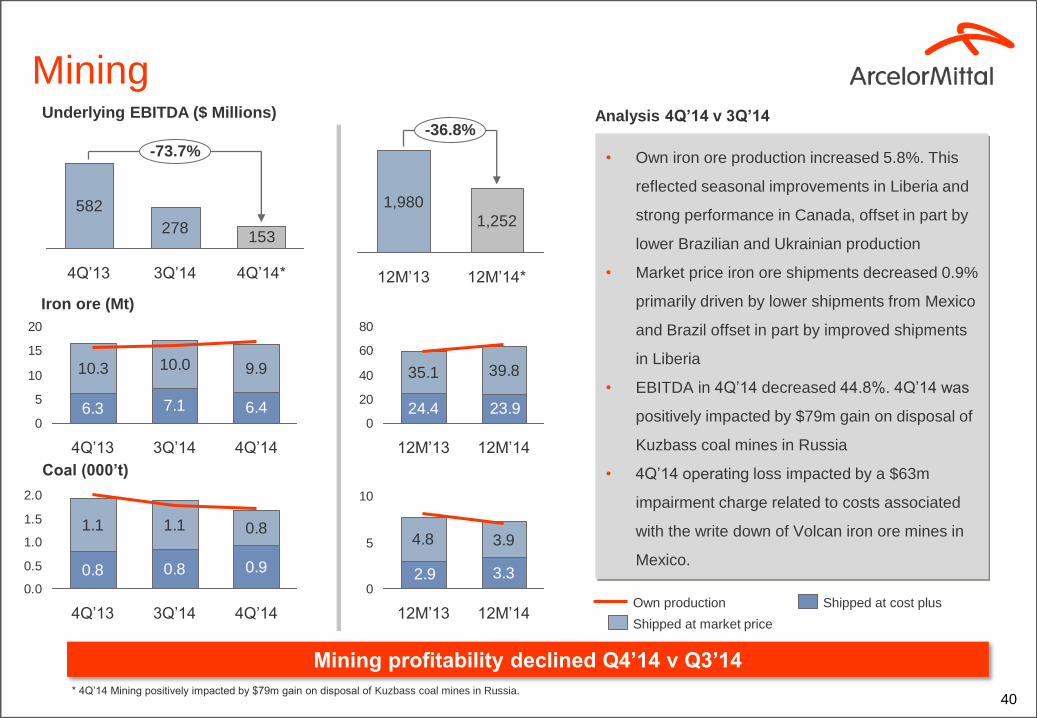
Mining
Iron ore (Mt)
• Own iron ore production increased 5.8%. This
reflected seasonal improvements in Liberia and
strong performance in Canada, offset in part by
lower Brazilian and Ukrainian production
• Market price iron ore shipments decreased 0.9%
primarily driven by lower shipments from Mexico
and Brazil offset in part by improved shipments
in Liberia
• EBITDA in 4Q’14 decreased 44.8%. 4Q’14 was
positively impacted by $79m gain on disposal of
Kuzbass coal mines in Russia
• 4Q’14 operating loss impacted by a $63m
impairment charge related to costs associated
with the write down of Volcan iron ore mines in
Mexico.
Analysis 4Q’14 v 3Q’14
Coal (000’t)
Underlying EBITDA ($ Millions)
582
278153
-73.7%
4Q’14* 3Q’14 4Q’13
Mining profitability declined Q4’14 v Q3’14
-36.8%
12M’14*
1,252
12M’13
1,980
6.3 7.1 6.4
10.3 10.0 9.9
0
5
10
15
20
4Q’14 3Q’14 4Q’13
24.4
35.1 39.8
23.90
20
40
60
80
12M’14 12M’13
0.8 0.8 0.9
1.1 1.1 0.8
0.0
0.5
1.0
1.5
2.0
4Q’14 3Q’14 4Q’13
3.3
4.8 3.9
2.90
5
10
12M’14 12M’13 Shipped at cost plus Own production
Shipped at market price
* 4Q’14 Mining positively impacted by $79m gain on disposal of Kuzbass coal mines in Russia.

Contacts
Daniel Fairclough – Global Head Investor Relations
+44 207 543 1105
Hetal Patel – UK/European Investor Relations
+44 207 543 1128
Valérie Mella – European and Retail Investor Relations
+44 207 543 1156
Maureen Baker – Fixed Income/Debt Investor Relations
+33 1 71 92 10 26
Lisa Fortuna – US Investor Relations
+312 899 3985