Embed Size (px)
Citation preview

LAMBERT-ST. LOUIS INTERNATIONAL AIRPORT
AIR TRAFFIC ACTIVITY REPORT Fiscal Year As of December, 2007
Confid
entia
l
garvi
nm@
stlou
is-mo.g
ov
2020
-01-15
17:11
:05 +0
000

LAMBERT-ST. LOUIS INTERNATIONAL AIRPORT AIR TRAFFIC ACTIVITY REPORT List of Summary Tables and Charts: Summary of Air Traffic Activity Key Air Traffic Activity Relationships Monthly Enplaned Passengers Summary of Enplaned Passengers by Airline Breakdown of Enplaned Passengers by Airline Airline Market Shares Summary of Deplaned Passengers by Airline Originating and Connecting Enplaned Passengers by Airline Originating Connecting Enplaned Passengers Originating Enplaned Passengers-Airline Market Shares Connecting Enplaned Passengers-Airline Market Shares Domestic and International Enplaned Passengers by Airline Domestic and International Enplaned Passengers International Enplaned Passengers-Airline Market Shares Monthly Commercial Aircraft Departures Summary of Aircraft Departures by Airline Monthly Aircraft Operations Breakdown of Aircraft Operations Monthly Aircraft Landed Weight Summary of Aircraft Landed Weight by Airline Monthly Enplaned and Deplaned Cargo Cargo Breakdown between Belly and All-Cargo Carriers Summary of Enplaned and Deplaned Mail by Airline Summary of Enplaned and Deplaned Freight by Airline
Confid
entia
l
garvi
nm@
stlou
is-mo.g
ov
2020
-01-15
17:11
:05 +0
000

Dec-07
Page 1 of 2Percent Percent
Dec-07 Dec-06 Change FY2008 FY2007 ChangeEnplaned passengers (EP)
DomesticMajor/national*American 189,043 202,901 -6.8% 1,311,391 1,282,261 2.3% *Southwest 155,084 149,906 3.5% 999,301 957,749 4.3% Other 71,897 58,134 23.7% 522,865 397,000 31.7% Subtotal-Major/national 416,024 410,941 1.2% 2,833,557 2,637,010 7.5%
Regional/commuter*AA Conn/ Am. Eagle 1,861 3,378 -44.9% 12,085 21,567 -44.0% *AA Conn/ Chautauqua 35,739 36,645 -2.5% 240,612 233,972 2.8% *AA Conn/ RegionsAir 0 5,748 -100.0% 0 36,162 -100.0% *AA Conn/ Tr States 46,324 47,273 -2.0% 328,362 313,514 4.7% Other 73,465 70,222 4.6% 447,638 440,990 1.5% Subtotal-Regional/commuter 157,389 163,266 -3.6% 1,028,697 1,046,205 -1.7%
Charter 211 1,520 -86.1% 6,312 12,809 -50.7%
Subtotal-Domestic 573,624 575,727 -0.4% 3,868,566 3,696,024 4.7%
InternationalMajor/national*American 0 371 -100.0% 112 371 -69.8% Other 3,455 3,630 -4.8% 19,004 17,237 10.3% Subtotal-Major/national 3,455 4,001 -13.6% 19,116 17,608 8.6%
Regional/commuterAir Canada 0 0 - 0 0 - Jazz Air 1,384 1,450 -4.6% 10,759 10,009 7.5% Other 0 0 - 0 0 - Subtotal-Regional/commuter 1,384 1,450 -4.6% 10,759 10,009 7.5%
Charter 3,236 4,067 -20.4% 18,338 21,067 -13.0%
Subtotal-International 8,075 9,518 -15.2% 48,213 48,684 -1.0%
Total Enplaned Passengers 581,699 585,245 -0.6% 3,916,779 3,744,708 4.6% Subtotal Originating EP 444,232 440,105 0.9% 2,970,813 2,856,602 4.0% Subtotal Connecting EP 137,467 145,140 -5.3% 945,966 888,106 6.5%
Aircraft departuresDomesticMajor/national*American 1,513 1,634 -7.4% 9,748 10,154 -4.0% *Southwest 2,105 1,992 5.7% 12,610 11,945 5.6% Other 843 694 21.5% 5,607 4,451 26.0% Subtotal-Major/national 4,461 4,320 3.3% 27,965 26,550 5.3%
Regional/commuter*AA Conn/ Am. Eagle 85 126 -32.5% 537 856 -37.3% *AA Conn/ Chautauqua 1,182 1,219 -3.0% 7,192 7,451 -3.5% *AA Conn/ RegionsAir 0 565 -100.0% 0 4,234 -100.0% *AA Conn/ Tr States 1,491 1,481 0.7% 9,549 9,603 -0.6% Other 2,067 1,810 14.2% 11,477 10,866 5.6% Subtotal-Regional/commuter 4,825 5,201 -7.2% 28,755 33,010 -12.9%
Charter 11 20 -45.0% 99 159 -37.7%
Subtotal-Domestic 9,297 9,541 -2.6% 56,819 59,719 -4.9%
InternationalMajor/national*American 0 3 -100.0% 1 3 -66.7% Other 24 35 -31.4% 144 149 -3.4% Subtotal-Major/national 24 38 -36.8% 145 152 -4.6%
Regional/commuterAir Canada 0 0 - 0 0 - Jazz Air 46 48 -4.2% 332 294 12.9% Other 0 0 - 0 0 - Subtotal-Regional/commuter 46 48 -4.2% 332 294 12.9%
Charter 27 35 -22.9% 160 179 -10.6%
Subtotal-International 97 121 -19.8% 637 625 1.9%
Subtotal Passenger Carriers 9,394 9,662 -2.8% 57,456 60,344 -4.8% Subtotal Cargo Carriers 136 149 -8.7% 816 844 -3.3% Total Aircraft Departures 9,530 9,811 -2.9% 58,272 61,188 -4.8%
STL SUMMARY OF AIR TRAFFIC ACTIVITYLambert-St. Louis International Airport
Month Year-to-Date
Dec-07 vs Dec-06 and FYTD 08 vs FYTD 07
Confid
entia
l
garvi
nm@
stlou
is-mo.g
ov
2020
-01-15
17:11
:05 +0
000
Dec-07
Page 2 of 2Percent Percent
Dec-07 Dec-06 Change FY2008 FY2007 ChangeLanded Weight (1,000-lbs.)
Scheduled Passenger Carrier Major/national*American 207,414 226,376 -8.4% 1,344,814 1,395,137 -3.6% *Southwest 248,794 235,740 5.5% 1,485,704 1,408,052 5.5% Other 105,178 91,048 15.5% 689,118 570,092 20.9% Subtotal-Major/national 561,386 553,164 1.5% 3,519,636 3,373,281 4.3%
Regional/commuter*AA Conn/ Am. Eagle 3,467 5,166 -32.9% 22,110 35,306 -37.4% *AA Conn/ Chautauqua 48,746 49,892 -2.3% 299,019 307,060 -2.6% *AA Conn/ RegionsAir 0 8,757 -100.0% 0 65,730 -100.0% *AA Conn/ Tr States 62,802 60,479 3.8% 403,889 389,623 3.7% Other 98,830 91,922 7.5% 570,291 552,758 3.2% Subtotal-Regional/commuter 213,845 216,214 -1.1% 1,295,309 1,350,476 -4.1%
Subtotal Sched. Passenger Carriers 775,232 769,378 0.8% 4,814,945 4,723,757 1.9%
Subtotal Charter 4,844 7,352 -34.1% 35,423 45,809 -22.7%
Subtotal Cargo Carriers 36,964 40,760 -9.3% 213,718 224,652 -4.9%
Total Landed Weight 817,039 817,491 -0.1% 5,064,086 4,994,219 1.4% Participating Airlines1 765,067 765,743 -0.1% 4,759,473 4,710,115 1.0% Non-Participating Airlines 51,972 51,747 0.4% 304,614 284,103 7.2%
Aircraft OperationsAir Carrier 10,412 10,998 -5.3% 64,388 67,304 -4.3% Regional/Commuter 9,410 6,667 41.1% 56,360 46,954 20.0% General Aviation 827 674 22.7% 6,064 5,300 14.4% Military 83 2,874 -97.1% 1,258 14,361 -91.2%
Total Aircraft Operations 20,732 21,213 -2.3% 128,070 133,919 -4.4%
Air Cargo (lbs.)Mail Passenger/Belly 649,505 733,727 -11.5% 3,162,018 5,076,822 -37.7% Cargo 3,266,632 3,565,705 -8.4% 20,840,938 21,887,443 -4.8% Subtotal-Mail 3,916,137 4,299,432 -8.9% 24,002,956 26,964,265 -11.0%
Freight Passenger/Belly 940,469 877,790 7.1% 6,008,936 5,990,472 0.3% Cargo 9,492,962 10,642,723 -10.8% 63,389,644 65,335,590 -3.0% Subtotal-Freight 10,433,431 11,520,513 -9.4% 69,398,580 71,326,062 -2.7%
Total Air Cargo 14,349,568 15,819,945 -9.3% 93,401,536 98,290,327 -5.0%
* Participating airlines
Month Year-to-Date
Confid
entia
l
garvi
nm@
stlou
is-mo.g
ov
2020
-01-15
17:11
:05 +0
000

Dec-07
Percent PercentDec-07 Dec-06 Change FY2008 FY2007 Change
EP per departureDomestic 61.7 60.3 2.2% 68.1 61.9 10.0%
Major/national 93.3 95.1 -2.0% 101.3 99.3 2.0% *American 124.9 124.2 0.6% 134.5 126.3 6.5% *Southwest 73.7 75.3 -2.1% 79.2 80.2 -1.2% Other 85.3 83.8 1.8% 93.3 89.2 4.6%
Regional/commuter 32.6 31.4 3.9% 35.8 31.7 12.9% *AA Conn/ Am. Eagle 21.9 26.8 -18.3% 22.5 25.2 -10.7% *AA Conn/ Chautauqua 30.2 30.1 0.6% 33.5 31.4 6.5% *AA Conn/ RegionsAir - 10.2 - - 8.5 - *AA Conn/ Tr States 31.1 31.9 -2.7% 34.4 32.6 5.3% Other 35.5 38.8 -8.4% 39.0 40.6 -3.9%
Charter 19.2 76.0 -74.8% 63.8 80.6 -20.9%
International 83.2 78.7 5.8% 75.7 77.9 -2.8% Major/national 144.0 105.3 36.7% 131.8 115.8 13.8% *American - 123.7 - 112.0 123.7 -9.4% Other 144.0 103.7 38.8% 132.0 115.7 14.1%
Regional/commuter 30.1 30.2 -0.4% 32.4 34.0 -4.8% Air Canada - - - - - - Jazz Air 30.1 30.2 -0.4% 32.4 34.0 -4.8% Other - - - - - -
Charter 119.9 116.2 3.1% 114.6 117.7 -2.6%
Total Passenger Carriers 61.9 60.6 2.2% 68.2 62.1 9.9%
Avg. weight (lbs.) per landingScheduled Passenger Carrier
Major/national 125,170 126,756 -1.3% 125,143 126,231 -0.9% *American 137,088 138,287 -0.9% 137,944 137,357 0.4% *Southwest 118,192 118,284 -0.1% 117,754 117,868 -0.1% Other 121,313 124,044 -2.2% 119,659 123,397 -3.0%
Regional/commuter 44,046 41,428 6.3% 44,500 40,607 9.6% *AA Conn/ Am. Eagle 40,785 40,999 -0.5% 41,021 41,198 -0.4% *AA Conn/ Chautauqua 41,241 41,267 -0.1% 41,244 41,271 -0.1% *AA Conn/ RegionsAir - 15,609 - - 15,609 #VALUE!*AA Conn/ Tr States 42,377 41,226 2.8% 42,350 40,641 4.2% Other 46,928 49,527 -5.2% 48,404 49,521 -2.3%
Subtotal Sched. Passenger Carriers 83,001 80,286 3.4% 84,129 78,756 6.8% Subtotal Charter Carriers 127,474 136,148 -6.4% 137,298 134,732 1.9% Subtotal Cargo Carriers 271,791 273,559 -0.6% 261,910 266,176 -1.6% Total Air Carriers 85,878 83,537 2.8% 86,852 81,653 6.4%
KEY AIR TRAFFIC ACTIVITY RELATIONSHIPSLambert-St. Louis International Airport
Month Year-to-Date
Dec-07 vs Dec-06 and FYTD 08 vs FYTD 07
Confid
entia
l
garvi
nm@
stlou
is-mo.g
ov
2020
-01-15
17:11
:05 +0
000

Dec-07
MONTHLY ENPLANED PASSENGERS
FYTD 08 vs FYTD 07Lambert-St. Louis International Airport
0.0
0.1
0.2
0.3
0.4
0.5
0.6
0.7
0.8
Enpl
aned
Pas
seng
ers
(In M
illio
ns)
Jul Aug Sep Oct Nov Dec Jan Feb Mar Apr May Jun
FY2007 FY2008
-1.0%
0.0%
1.0%
2.0%
3.0%
4.0%
5.0%
6.0%
7.0%
8.0%
9.0%
10.0%
Perc
ent C
hang
e fr
omPr
evio
us Y
ear
Jul Aug Sep Oct Nov Dec Jan Feb Mar Apr May Jun
Confid
entia
l
garvi
nm@
stlou
is-mo.g
ov
2020
-01-15
17:11
:05 +0
000

Dec-07
Percent PercentDec-07 Dec-06 Change FY2008 FY2007 Change
Enplaned passengers (EP)Major/national*Am. West 0 9,134 -100.0% 31,399 59,439 -47.2% *Air Tran 12,531 0 - 75,164 0 - *American 189,043 203,272 -7.0% 1,311,503 1,282,632 2.3% *Continental 0 0 - 0 0 - *Delta 10,474 12,745 -17.8% 92,105 90,169 2.1% *Frontier 10,192 8,613 18.3% 72,866 56,614 28.7% *Northwest 14,728 18,980 -22.4% 125,109 128,006 -2.3% *Southwest 155,084 149,906 3.5% 999,301 957,749 4.3% *United 8,122 6,423 26.5% 54,727 45,155 21.2% *US Airways 12,162 0 - 50,509 0 - USA 3000 7,143 5,869 21.7% 39,990 34,854 14.7% Subtotal-Major/national 419,479 414,942 1.1% 2,852,673 2,654,618 7.5%
Regional/commuterAir Canada 0 0 - 0 0 - Jazz Air 1,384 1,450 -4.6% 10,759 10,009 7.5% *AA Conn/ Am. Eagle 1,861 3,378 -44.9% 12,085 21,567 -44.0% *AA Conn/ Chautauqua 35,739 36,645 -2.5% 240,612 233,972 2.8% *AA Conn/ RegionsAir 0 5,748 -100.0% 0 36,162 -100.0% *AA Conn/ Tr States 46,324 47,273 -2.0% 328,362 313,514 4.7% *CO Exp/ Chautauqua 6,219 0 - 44,075 0 - *CO Exp/ Expressjet 9,286 15,966 -41.8% 54,896 99,037 -44.6% *Great Lakes 747 0 - 1,788 0 - *DL Conn/ ASA 2,552 2,213 15.3% 14,630 23,696 -38.3% *DL Conn/ Chautauqua 3,411 4,963 -31.3% 22,787 16,789 35.7% *DL Conn/ Comair 4,882 2,387 104.5% 32,766 26,761 22.4% *DL Conn/ Freedom 0 0 - 0 0 - *DL Conn/ Shuttle Am. 2,775 0 - 2,775 0 - DL Conn/ Skywest 2,510 3,520 -28.7% 20,565 11,615 77.1% MW Conn/ Skyway 826 766 7.8% 6,420 5,240 22.5% NW Airlink/ Compass 0 0 - 0 0 - *NW Airlink/ Mesaba 1,655 0 - 7,863 2,207 256.3% *NW Airlink/ Pinnacle 6,940 6,187 12.2% 33,377 36,482 -8.5% UA Exp/ Air Wisconsin 0 0 - 0 0 - *UA Exp/ Go Jet 7,739 10,064 -23.1% 55,554 62,662 -11.3% UA Exp/ Skywest 0 0 - 0 3,151 -100.0% *UA Exp/ Tr States 9,479 7,257 30.6% 56,515 50,501 11.9% UA Exp/ Mesa 0 0 - 0 0 - US Exp/ Air Midwest 0 390 -100.0% 51 1,186 -95.7% *US Exp/ Air Wisconsin 1,262 2,323 -45.7% 11,694 21,082 -44.5% *US Exp/ Chautuaqua 0 0 - 0 303 -100.0% *US Exp/ Mesa 2,975 7,823 -62.0% 21,954 48,138 -54.4% US Exp/ Republic 5,948 2,327 155.6% 31,181 7,273 328.7% *US Exp/ Tr States 2,489 3,220 -22.7% 19,902 20,894 -4.7% US Exp/ PSA 1,770 816 116.9% 8,845 3,973 122.6% Subtotal-Regional/commuter 158,773 164,716 -3.6% 1,039,456 1,056,214 -1.6%
Charter 3,447 5,587 -38.3% 24,650 33,876 -27.2%
Total Enplaned Passengers 581,699 585,245 -0.6% 3,916,779 3,744,708 4.6%
Year-to-date
Dec-07 vs Dec-06 and FYTD 08 vs FYTD 07
SUMMARY OF ENPLANED PASSENGERS BY AIRLINELambert-St. Louis International Airport
Month
Confid
entia
l
garvi
nm@
stlou
is-mo.g
ov
2020
-01-15
17:11
:05 +0
000

Dec-07
BREAKDOWN OF ENPLANED PASSENGERS BY AIRLINE CLASSLambert-St. Louis International Airport
Dec-07 vs Dec-06 and FYTD 08 vs FYTD 07
70.9%
28.1%
1.0%
72.1%
27.3%
0.6%
70.9%
28.2%
0.9%
72.8%
26.5%
0.6%
Dec-06 Dec-07 FYTD 2007 FYTD 2008
CharterReg'l/CommuterMajor/National
Confid
entia
l
garvi
nm@
stlou
is-mo.g
ov
2020
-01-15
17:11
:05 +0
000

Dec-07
FYTD 08 vs FYTD 07
AIRLINE MARKET SHARESLambert-St. Louis International Airport
FYTD 2007
Other20.9%
Northwest3.4%
Trans States8.4% Southwest
25.6%
Chautauqua6.2%
United1.2%
American34.3%
FYTD 2008
Other21.9%
Northwest3.2%
Southwest25.5%
Trans States8.4%
United1.4%
Chautauqua6.1%
American33.5%
Confid
entia
l
garvi
nm@
stlou
is-mo.g
ov
2020
-01-15
17:11
:05 +0
000

Dec-07
Percent PercentDec-07 Dec-06 Change FY2008 FY2007 Change
Deplaned passengers (DEP)Major/national*Am. West 0 9,388 -100.0% 32,079 60,091 -46.6% *Air Tran 11,602 0 - 74,902 0 - *American 182,503 191,754 -4.8% 1,292,191 1,257,949 2.7% *Continental 0 0 - 0 0 - *Delta 10,326 11,990 -13.9% 94,886 87,526 8.4% *Frontier 9,291 7,407 25.4% 69,223 55,888 23.9% *Northwest 14,103 18,113 -22.1% 126,250 128,974 -2.1% *Southwest 150,284 147,581 1.8% 985,780 949,155 3.9% *United 7,678 6,609 16.2% 55,510 48,670 14.1% *US Airways 11,544 0 - 50,008 0 - USA 3000 6,474 2,403 169.4% 39,827 66,284 -39.9% Subtotal-Major/national 403,805 395,245 2.2% 2,820,656 2,654,537 6.3%
Regional/commuterAir Canada 0 0 - 0 0 - Jazz Air 1,421 1,549 -8.3% 11,026 10,466 5.4% *AA Conn/ Am. Eagle 1,883 2,993 -37.1% 13,235 20,961 -36.9% *AA Conn/ Chautauqua 34,566 36,809 -6.1% 236,277 237,201 -0.4% *AA Conn/ RegionsAir 0 6,566 -100.0% 0 38,225 -100.0% *AA Conn/ Tr States 45,949 48,466 -5.2% 331,798 314,655 5.4% *CO Exp/ Chautauqua 6,335 0 - 45,753 0 - *CO Exp/ Expressjet 8,882 15,678 -43.3% 56,153 103,065 -45.5% *Great Lakes 769 0 - 2,019 0 - *DL Conn/ ASA 2,938 2,490 18.0% 16,328 25,846 -36.8% *DL Conn/ Chautauqua 3,024 4,703 -35.7% 21,374 16,649 28.4% *DL Conn/ Comair 4,498 2,774 62.1% 33,202 27,909 19.0% *DL Conn/ Freedom 0 0 - 0 0 - *DL Conn/ Shuttle Am. 2,384 0 - 2,384 0 - DL Conn/ Skywest 2,519 3,375 -25.4% 20,546 11,509 78.5% MW Conn/ Skyway 814 751 8.4% 6,837 5,625 21.5% NW Airlink/ Compass 0 0 - 0 0 - *NW Airlink/ Mesaba 1,475 0 - 8,995 2,837 217.1% *NW Airlink/ Pinnacle 7,260 0 - 34,151 88,886 -61.6% UA Exp/ Air Wisconsin 0 0 - 0 0 - *UA Exp/ Go Jet 8,150 10,687 -23.7% 59,770 64,211 -6.9% UA Exp/ Skywest 107 0 - 173 4,110 -95.8% *UA Exp/ Tr States 8,439 7,012 20.4% 56,346 52,499 7.3% UA Exp/ Mesa 0 0 - 0 0 - US Exp/ Air Midwest 0 492 -100.0% 70 1,469 -95.2% *US Exp/ Air Wisconsin 1,024 2,483 -58.8% 11,138 22,484 -50.5% *US Exp/ Chautuaqua 0 0 - 0 380 -100.0% *US Exp/ Mesa 3,235 7,653 -57.7% 23,512 46,580 -49.5% US Exp/ Republic 5,566 2,299 142.1% 31,464 7,633 312.2% *US Exp/ Tr States 2,625 3,393 -22.6% 20,575 23,030 -10.7% US Exp/ PSA 1,515 636 138.2% 7,478 4,143 80.5% Subtotal-Regional/commuter 155,378 160,809 -3.4% 1,050,604 1,130,373 -7.1%
Charter 2,638 4,791 -44.9% 24,670 34,716 -28.9%
Total Deplaned Passengers 561,821 560,845 0.2% 3,895,930 3,819,626 2.0%
Year-to-date
Dec-07 vs Dec-06 and FYTD 08 vs FYTD 07
SUMMARY OF DEPLANED PASSENGERS BY AIRLINELambert-St. Louis International Airport
Month
Confid
entia
l
garvi
nm@
stlou
is-mo.g
ov
2020
-01-15
17:11
:05 +0
000

Dec-07
Percent PercentDec-07 Dec-06 Change FY2008 FY2007 Change
Originating EPMajor/national*Am. West 0 9,134 -100.0% 31,399 59,439 -47.2% *Air Tran 12,531 0 - 75,164 0 - *American 158,144 167,936 -5.8% 1,087,409 1,065,919 2.0% *Continental 0 0 - 0 0 - *Delta 10,474 12,745 -17.8% 92,105 90,169 2.1% *Frontier 10,192 8,613 18.3% 72,866 56,614 28.7% *Northwest 14,728 18,980 -22.4% 125,109 128,006 -2.3% *Southwest 127,606 121,870 4.7% 816,910 811,196 0.7% *United 8,122 6,423 26.5% 54,727 45,155 21.2% *US Airways 12,162 0 - 50,509 0 - USA 3000 7,143 5,869 21.7% 39,990 34,854 14.7% Subtotal-Major/national 361,102 351,570 2.7% 2,446,188 2,291,352 6.8%
Regional/commuterAir Canada 0 0 - 0 0 - Jazz Air 1,384 1,450 -4.6% 10,759 10,009 7.5% *AA Conn/ Am. Eagle 1,861 3,378 -44.9% 12,085 21,567 -44.0% *AA Conn/ Chautauqua 715 733 -2.5% 4,625 4,680 -1.2% *AA Conn/ RegionsAir 0 440 -100.0% 0 3,297 -100.0% *AA Conn/ Tr States 8,087 9,005 -10.2% 56,796 57,958 -2.0% *CO Exp/ Chautauqua 6,219 0 - 44,075 0 - *CO Exp/ Expressjet 9,286 15,966 -41.8% 54,896 99,037 -44.6% *Great Lakes 747 0 - 747 0 - *DL Conn/ ASA 2,552 2,213 15.3% 14,630 23,696 -38.3% *DL Conn/ Chautauqua 3,411 4,963 -31.3% 22,787 16,789 35.7% *DL Conn/ Comair 4,882 2,387 104.5% 32,766 26,761 22.4% *DL Conn/ Freedom 0 0 - 0 0 - *DL Conn/ Shuttle Am. 2,775 0 - 2,775 0 - DL Conn/ Skywest 2,510 3,520 -28.7% 20,565 11,615 77.1% MW Conn/ Skyway 826 766 7.8% 6,420 5,240 22.5% NW Airlink/ Compass 0 0 - 0 0 - *NW Airlink/ Mesaba 1,655 0 - 7,863 2,207 256.3% *NW Airlink/ Pinnacle 6,940 6,187 12.2% 33,377 36,482 -8.5% UA Exp/ Air Wisconsin 0 0 - 0 0 - *UA Exp/ Go Jet 7,739 10,064 -23.1% 55,554 62,662 -11.3% UA Exp/ Skywest 0 0 - 0 3,151 -100.0% *UA Exp/ Tr States 9,479 7,257 30.6% 56,515 50,501 11.9% UA Exp/ Mesa 0 0 - 0 0 - US Exp/ Air Midwest 0 390 -100.0% 51 1,186 -95.7% *US Exp/ Air Wisconsin 1,262 2,323 -45.7% 11,694 21,082 -44.5% *US Exp/ Chautuaqua 0 0 - 0 303 -100.0% *US Exp/ Mesa 2,975 7,823 -62.0% 21,954 48,138 -54.4% US Exp/ Republic 119 47 153.2% 294 146 101.4% *US Exp/ Tr States 2,489 3,220 -22.7% 19,902 20,894 -4.7% US Exp/ PSA 1,770 816 116.9% 8,845 3,973 122.6% Subtotal-Regional/commuter 79,683 82,948 -3.9% 499,975 531,374 -5.9%
Charter 3,447 5,587 -38.3% 24,650 33,876 -27.2%
Subtotal Originating EP 444,232 440,105 0.9% 2,970,813 2,856,602 4.0%
Connecting EPMajor/national1
*American 30,899 35,336 -12.6% 224,094 216,713 3.4% *Southwest 27,478 28,036 -2.0% 182,391 146,553 24.5% Subtotal-Major/national 58,377 63,372 -7.9% 406,485 363,266 11.9%
Regional/commuter*AA Conn/ Chautauqua 35,024 35,912 -2.5% 235,987 229,292 2.9% *AA Conn/ RegionsAir 0 5,308 -100.0% 0 32,865 -100.0% *AA Conn/ Tr States 38,237 38,268 -0.1% 271,566 255,556 6.3% *Great Lakes 0 0 - 1,041 0 - US Exp/ Republic 5,829 2,280 155.7% 30,887 7,127 333.4% Subtotal-Regional/commuter 79,090 81,768 -3.3% 539,481 524,840 2.8%
Charter 0 0 - 0 0 -
Subtotal Connecting EP 137,467 145,140 -5.3% 945,966 888,106 6.5%
Total EP 581,699 585,245 -0.6% 3,916,779 3,744,708 4.6%
Month Year-to-date
ORIGINATING AND CONNECTING ENPLANED PASSENGERS BY AIRLINELambert-St. Louis International Airport
Dec-07 vs Dec-06 and FYTD 08 vs FYTD 07
Confid
entia
l
garvi
nm@
stlou
is-mo.g
ov
2020
-01-15
17:11
:05 +0
000

Dec-07
Dec-07 vs Dec-06 and FYTD 08 vs FYTD 07
ORIGINATING AND CONNECTING ENPLANED PASSENGERSLambert-St. Louis International Airport
75.2%
24.8%
76.4%
23.6%
76.3%
23.7%
75.8%
24.2%
Dec-06 Dec-07 FYTD 2007 FYTD 2008
ConnectingOriginating
Confid
entia
l
garvi
nm@
stlou
is-mo.g
ov
2020
-01-15
17:11
:05 +0
000

Dec-07
ORIGINATING ENPLANED PASSENGERS - AIRLINE MARKET SHARESLambert-St. Louis International Airport
FYTD 08 vs FYTD 07
FYTD 2008
American36.6%
Northwest4.2%
Delta3.1%
United1.8%
Southwest27.5%
Other26.7%
FYTD 2007
American37.3%
Northwest4.5%
Delta3.2%
United1.6%
Southwest28.4%
Other25.1%
Confid
entia
l
garvi
nm@
stlou
is-mo.g
ov
2020
-01-15
17:11
:05 +0
000

Dec-07
CONNECTING ENPLANED PASSENGERS - AIRLINE MARKET SHARELambert-St. Louis International Airport
FYTD 08 vs FYTD 07
FYTD 2007
Trans States29.0%
Chautauqua26.0%
Southwest16.6%
American24.6%
RegionsAir3.7%
FYTD 2008
American25%
Trans States29%
Chautauqua26%
Southwest20%
RegionsAir0%
Confid
entia
l
garvi
nm@
stlou
is-mo.g
ov
2020
-01-15
17:11
:05 +0
000

Dec-07
Percent PercentDec-07 Dec-06 Change FY2008 FY2007 Change
Domestic EPMajor/national*Am. West 0 9,134 -100.0% 31,399 59,439 -47.2% *Air Tran 12,531 0 - 75,164 0 - *American 189,043 202,901 -6.8% 1,311,391 1,282,261 2.3% *Continental 0 0 - 0 0 - *Delta 10,474 12,745 -17.8% 92,105 90,169 2.1% *Frontier 10,192 7,624 33.7% 72,866 54,927 32.7% *Northwest 14,728 18,980 -22.4% 125,109 128,006 -2.3% *Southwest 155,084 149,906 3.5% 999,301 957,749 4.3% *United 8,122 6,423 26.5% 54,727 45,155 21.2% *US Airways 12,162 0 - 50,509 0 - USA 3000 3,688 3,228 14.3% 20,986 19,304 8.7% Subtotal-Major/national 416,024 410,941 1.2% 2,833,557 2,637,010 7.5%
Regional/commuter*AA Conn/ Am. Eagle 1,861 3,378 -44.9% 12,085 21,567 -44.0% *AA Conn/ Chautauqua 35,739 36,645 -2.5% 240,612 233,972 2.8% *AA Conn/ RegionsAir 0 5,748 -100.0% 0 36,162 -100.0% *AA Conn/ Tr States 46,324 47,273 -2.0% 328,362 313,514 4.7% *CO Exp/ Chautauqua 6,219 0 - 44,075 0 - *CO Exp/ Expressjet 9,286 15,966 -41.8% 54,896 99,037 -44.6% *Great Lakes 747 0 - 1,788 0 - *DL Conn/ ASA 2,552 2,213 15.3% 14,630 23,696 -38.3% *DL Conn/ Chautauqua 3,411 4,963 -31.3% 22,787 16,789 35.7% *DL Conn/ Comair 4,882 2,387 104.5% 32,766 26,761 22.4% *DL Conn/ Freedom 0 0 - 0 0 - *DL Conn/ Shuttle Am. 2,775 0 - 2,775 0 - DL Conn/ Skywest 2,510 3,520 -28.7% 20,565 11,615 77.1% MW Conn/ Skyway 826 766 7.8% 6,420 5,240 22.5% NW Airlink/ Compass 0 0 - 0 0 - *NW Airlink/ Mesaba 1,655 0 - 7,863 2,207 256.3% *NW Airlink/ Pinnacle 6,940 6,187 12.2% 33,377 36,482 -8.5% UA Exp/ Air Wisconsin 0 0 - 0 0 - *UA Exp/ Go Jet 7,739 10,064 -23.1% 55,554 62,662 -11.3% UA Exp/ Skywest 0 0 - 0 3,151 -100.0% *UA Exp/ Tr States 9,479 7,257 30.6% 56,515 50,501 11.9% UA Exp/ Mesa 0 0 - 0 0 - US Exp/ Air Midwest 0 390 -100.0% 51 1,186 -95.7% *US Exp/ Air Wisconsin 1,262 2,323 -45.7% 11,694 21,082 -44.5% *US Exp/ Chautuaqua 0 0 - 0 303 -100.0% *US Exp/ Mesa 2,975 7,823 -62.0% 21,954 48,138 -54.4% US Exp/ Republic 5,948 2,327 155.6% 31,181 7,273 328.7% *US Exp/ Tr States 2,489 3,220 -22.7% 19,902 20,894 -4.7% US Exp/ PSA 1,770 816 116.9% 8,845 3,973 122.6% Subtotal-Regional/commuter 157,389 163,266 -3.6% 1,028,697 1,046,205 -1.7%
Charter 211 1,520 -86.1% 6,312 12,809 -50.7%
Subtotal Domestic EP 573,624 575,727 -0.4% 3,868,566 3,696,024 4.7%
International EPMajor/national*American 0 371 -100.0% 112 371 -69.8% *Frontier 0 989 -100.0% 0 1,687 -100.0% USA 3000 3,455 2,641 30.8% 19,004 15,550 22.2% Subtotal-Major/national 3,455 4,001 -13.6% 19,116 17,608 8.6%
Regional/commuterAir Canada 0 0 - 0 0 - Jazz Air 1,384 1,450 -4.6% 10,759 10,009 7.5% Subtotal-Regional/commuter 1,384 1,450 -4.6% 10,759 10,009 7.5%
Charter 3,236 4,067 -20.4% 18,338 21,067 -13.0%
Subtotal International EP 8,075 9,518 -15.2% 48,213 48,684 -1.0%
Total EP 581,699 585,245 -0.6% 3,916,779 3,744,708 4.6%
Year-to-date
Dec-07 vs Dec-06 and FYTD 08 vs FYTD 07
DOMESTIC AND INTERNATIONAL ENPLANED PASSENGERS BY AIRLINELambert-St. Louis International Airport
Month
Confid
entia
l
garvi
nm@
stlou
is-mo.g
ov
2020
-01-15
17:11
:05 +0
000

Dec-07
Dec-07 vs Dec-06 and FYTD 08 vs FYTD 07
DOMESTIC AND INTERNATIONAL ENPLANED PASSENGERSLambert-St. Louis International Airport
98.4%
1.6%
98.6%
1.4%
98.7%
1.3%
98.8%
1.2%
Dec-06 Dec-07 FYTD 2007 FYTD 2008
InternationalDomestic
Confid
entia
l
garvi
nm@
stlou
is-mo.g
ov
2020
-01-15
17:11
:05 +0
000

Dec-07
FYTD 08 vs FYTD 07
INTERNATIONAL ENPLANED PASSENGERS - AIRLINE MARKET SHARESLambert-St. Louis International Airport
FYTD 2007
Frontier6.1%
American1.3%
Air Canada/Jazz Air36.2%
USA 300056.3%
FYTD 2008
American0.4%
Frontier0.0%
USA 300063.6% Air Canada/Jazz Air
36.0%
Confid
entia
l
garvi
nm@
stlou
is-mo.g
ov
2020
-01-15
17:11
:05 +0
000

Dec-07
MONTHLY COMMERCIAL AIRCRAFT DEPARTURES
FYTD 08 vs FYTD 07Lambert-St. Louis International Airport
0.0
2.0
4.0
6.0
8.0
10.0
12.0
Airc
raft
Dep
artu
res
(In T
hous
ands
)
Jul Aug Sep Oct Nov Dec Jan Feb Mar Apr May Jun
FY2007 FY2008
-7.0%
-6.0%
-5.0%
-4.0%
-3.0%
-2.0%
-1.0%
0.0%
Perc
ent C
hang
e fr
omPr
evio
us Y
ear
Jul Aug Sep Oct Nov Dec Jan Feb Mar Apr May Jun
Confid
entia
l
garvi
nm@
stlou
is-mo.g
ov
2020
-01-15
17:11
:05 +0
000

Dec-07
Percent PercentDec-07 Dec-06 Change FY2008 FY2007 Change
Aircraft DeparturesMajor/national*Am. West 0 92 -100.0% 273 545 -49.9% *Air Tran 174 0 - 927 0 - *American 1,513 1,637 -7.6% 9,749 10,157 -4.0% *Continental 0 0 - 6 4 50.0% *Delta 109 143 -23.8% 918 999 -8.1% *Frontier 106 111 -4.5% 704 669 5.2% *Northwest 210 240 -12.5% 1,588 1,531 3.7% *Southwest 2,105 1,992 5.7% 12,610 11,945 5.6% *United 92 90 2.2% 557 544 2.4% *US Airways 120 0 - 464 2 23100.0% USA 3000 56 53 5.7% 314 306 2.6% Subtotal-Major/national 4,485 4,358 2.9% 28,110 26,702 5.3%
Regional/commuterAir Canada 0 0 - 0 0 - Jazz Air 46 48 -4.2% 332 294 12.9% *AA Conn/ Am. Eagle 85 126 -32.5% 537 856 -37.3% *AA Conn/ Chautauqua 1,182 1,219 -3.0% 7,192 7,451 -3.5% *AA Conn/ RegionsAir 0 565 -100.0% 0 4,234 -100.0% *AA Conn/ Tr States 1,491 1,481 0.7% 9,549 9,603 -0.6% *CO Exp/ Chautauqua 172 0 - 1,155 0 - *CO Exp/ Expressjet 256 417 -38.6% 1,502 2,560 -41.3% *Great Lakes 240 0 - 594 0 - *DL Conn/ ASA 60 51 17.6% 355 469 -24.3% *DL Conn/ Chautauqua 94 150 -37.3% 567 480 18.1% *DL Conn/ Comair 132 58 127.6% 848 635 33.5% *DL Conn/ Freedom 0 0 - 0 0 - *DL Conn/ Shuttle Am. 44 0 - 44 0 - DL Conn/ Skywest 45 59 -23.7% 347 202 71.8% MW Conn/ Skyway 65 71 -8.5% 449 423 6.1% NW Airlink/ Compass 0 0 - 0 0 - *NW Airlink/ Mesaba 31 0 - 157 52 201.9% *NW Airlink/ Pinnacle 166 157 5.7% 798 924 -13.6% UA Exp/ Air Wisconsin 0 0 - 0 0 - *UA Exp/ Go Jet 185 243 -23.9% 1,195 1,361 -12.2% UA Exp/ Skywest 2 0 - 3 67 -95.5% *UA Exp/ Tr States 252 207 21.7% 1,508 1,428 5.6% UA Exp/ Mesa 0 0 - 0 0 - US Exp/ Air Midwest 0 49 -100.0% 12 143 -91.6% *US Exp/ Air Wisconsin 31 64 -51.6% 267 518 -48.5% *US Exp/ Chautuaqua 0 0 - 0 9 -100.0% *US Exp/ Mesa 47 123 -61.8% 320 753 -57.5% US Exp/ Republic 106 46 130.4% 530 134 295.5% *US Exp/ Tr States 99 102 -2.9% 631 627 0.6% US Exp/ PSA 40 13 207.7% 195 81 140.7% Subtotal-Regional/commuter 4,871 5,249 -7.2% 29,087 33,304 -12.7%
Charter 38 55 -30.9% 259 338 -23.4%
Cargo 136 149 -8.7% 816 844 -3.3%
Total Aircraft Departures 9,530 9,811 -2.9% 58,272 61,188 -4.8%
SUMMARY OF AIRCRAFT DEPARTURES BY AIRLINELambert-St. Louis International Airport
Month Year-to-date
Dec-07 vs Dec-06 and FYTD 08 vs FYTD 07
Confid
entia
l
garvi
nm@
stlou
is-mo.g
ov
2020
-01-15
17:11
:05 +0
000

Dec-07
MONTHLY AIRCRAFT OPERATIONS
FYTD 08 vs FYTD 07Lambert-St. Louis International Airport
0.0
5.0
10.0
15.0
20.0
25.0
Airc
raft
Ope
ratio
ns(In
Tho
usan
ds)
Jul Aug Sep Oct Nov Dec Jan Feb Mar Apr May Jun
FY2007 FY2008
-7.0%
-6.0%
-5.0%
-4.0%
-3.0%
-2.0%
-1.0%
0.0%
1.0%
Perc
ent C
hang
e fr
omPr
evio
us Y
ear
Jul Aug Sep Oct Nov Dec Jan Feb Mar Apr May Jun
Confid
entia
l
garvi
nm@
stlou
is-mo.g
ov
2020
-01-15
17:11
:05 +0
000

Dec-07
BREAKDOWN OF AIRCRAFT OPERATIONSLambert-St. Louis International Airport
Dec-07 vs Dec-06 and FYTD 08 vs FYTD 07
51.8%
31.4%
3.2%
13.5%
50.2%
45.4%
4.0%
0.4%
50.3%
35.1%
4.0%
10.7%
50.3%
44.0%
4.7%
1.0%
Dec-06 Dec-07 FYTD 2007 FYTD 2008
MilitaryGeneral AviationRegional/CommuterAir Carrier
Confid
entia
l
garvi
nm@
stlou
is-mo.g
ov
2020
-01-15
17:11
:05 +0
000
Dec-07
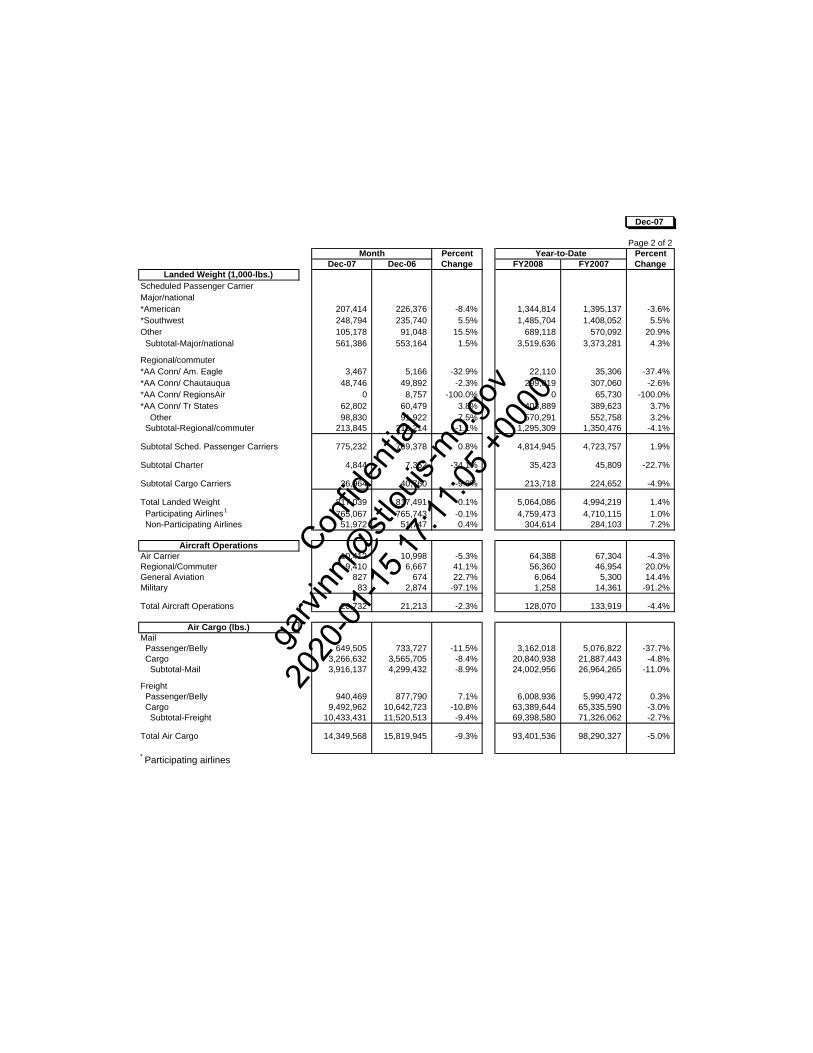
MONTHLY AIRCRAFT LANDED WEIGHT
FYTD 08 vs FYTD 07Lambert-St. Louis International Airport
0.0
0.1
0.2
0.3
0.4
0.5
0.6
0.7
0.8
0.9
Land
ed W
eigh
t(In
Bill
ion
Poun
ds)
Jul Aug Sep Oct Nov Dec Jan Feb Mar Apr May Jun
FY2007 FY2008
-0.5%
0.0%
0.5%
1.0%
1.5%
2.0%
2.5%
3.0%
3.5%
4.0%
Perc
ent C
hang
e fr
omPr
evio
us Y
ear
Jul Aug Sep Oct Nov Dec Jan Feb Mar Apr May Jun
Confid
entia
l
garvi
nm@
stlou
is-mo.g
ov
2020
-01-15
17:11
:05 +0
000

Dec-07
Percent PercentDec-07 Dec-06 Change FY2008 FY2007 Change
Aircraft Landed WeightMajor/nationa*Am. West 0 12,798,000 -100.0% 38,006,600 75,633,400 -49.7% *Air Tran 18,408,000 0 - 96,720,000 0 - *American 207,414,000 226,376,000 -8.4% 1,344,814,000 1,395,137,000 -3.6% *Continental 0 0 - 754,000 774,000 -2.6% *Delta 14,500,000 19,110,000 -24.1% 121,253,000 131,624,000 -7.9% *Frontier 14,208,584 15,054,060 -5.6% 93,732,968 90,750,840 3.3% *Northwest 23,028,700 24,751,000 -7.0% 168,971,200 160,934,000 5.0% *Southwest 248,794,000 235,740,000 5.5% 1,485,704,000 1,408,052,000 5.5% *United 10,822,464 11,798,396 -8.3% 64,674,998 66,411,850 -2.6% *US Airways 16,247,500 0 - 60,355,100 309,300 19413.4% USA 3000 7,963,088 7,536,494 5.7% 44,650,172 43,654,786 2.3% Subtotal-Major/nationa 561,386,336 553,163,950 1.5% 3,519,636,038 3,373,281,176 4.3%
Regional/commuterAir Canada 0 0 - 0 0 - Jazz Air 2,162,000 2,256,000 -4.2% 15,604,000 13,846,100 12.7% *AA Conn/ Am. Eagle 3,466,725 5,165,811 -32.9% 22,110,466 35,306,478 -37.4% *AA Conn/ Chautauqua 48,746,331 49,891,626 -2.3% 299,019,036 307,059,687 -2.6% *AA Conn/ RegionsAir 0 8,756,650 -100.0% 0 65,729,500 -100.0% *AA Conn/ Tr States 62,802,279 60,478,542 3.8% 403,888,662 389,622,824 3.7% *CO Exp/ Chautauqua 7,310,050 0 - 49,110,050 0 - *CO Exp/ Expressjet 10,915,690 17,864,610 -38.9% 64,209,040 109,641,160 -41.4% *Great Lakes 4,023,600 0 - 9,941,645 0 - *DL Conn/ ASA 3,200,000 2,617,000 22.3% 17,505,000 27,683,000 -36.8% *DL Conn/ Chautauqua 4,277,000 6,825,000 -37.3% 25,798,500 21,840,000 18.1% *DL Conn/ Comair 6,564,000 3,666,000 79.1% 43,457,000 34,825,000 24.8% *DL Conn/ Freedom 0 0 - 0 0 - *DL Conn/ Shuttle Am. 3,181,200 0 - 3,181,200 0 - DL Conn/ Skywest 3,031,000 4,313,000 -29.7% 23,725,000 14,766,000 60.7% MW Conn/ Skyway 2,158,000 1,178,600 83.1% 14,375,600 7,021,800 104.7% NW Airlink/ Compass 0 0 - 0 0 - *NW Airlink/ Mesaba 2,300,000 0 - 12,062,600 4,420,000 172.9% *NW Airlink/ Pinnacle 7,802,000 7,379,000 5.7% 37,506,000 43,428,000 -13.6% UA Exp/ Air Wisconsin 0 0 - 0 0 - *UA Exp/ Go Jet 12,663,000 16,281,000 -22.2% 79,931,000 91,120,000 -12.3% UA Exp/ Skywest 114,000 0 - 181,000 4,489,000 -96.0% *UA Exp/ Tr States 10,287,597 8,368,878 22.9% 63,097,734 58,664,598 7.6% UA Exp/ Mesa 0 0 - 0 0 - US Exp/ Air Midwest 0 813,400 -100.0% 199,200 2,373,800 -91.6% *US Exp/ Air Wisconsin 1,457,000 3,008,000 -51.6% 12,549,000 24,534,000 -48.9% *US Exp/ Chautuaqua 0 0 - 0 382,950 -100.0% *US Exp/ Mesa 3,454,500 9,114,000 -62.1% 23,520,085 54,829,500 -57.1% US Exp/ Republic 7,943,694 3,398,664 133.7% 39,210,584 9,834,432 298.7% *US Exp/ Tr States 4,005,537 3,900,534 2.7% 25,761,745 23,764,308 8.4% US Exp/ PSA 1,980,000 938,000 111.1% 9,365,000 5,294,000 76.9% Subtotal-Regional/commute 213,845,203 216,214,315 -1.1% 1,295,309,147 1,350,476,137 -4.1%
Charter 4,844,000 7,352,000 -34.1% 35,423,000 45,809,000 -22.7%
Cargo 36,963,620 40,760,300 -9.3% 213,718,250 224,652,320 -4.9%
Total Aircraft Landed Weigh 817,039,159 817,490,565 -0.1% 5,064,086,435 4,994,218,633 1.4% Participating Airlines* 765,067,077 765,743,107 -0.1% 4,759,472,829 4,710,115,415 1.0%
* Participating airlines
SUMMARY OF AIRCRAFT LANDED WEIGHT BY AIRLINELambert-St. Louis International Airport
Month Year-to-date
Dec-07 vs Dec-06 and FYTD 08 vs FYTD 07
Confid
entia
l
garvi
nm@
stlou
is-mo.g
ov
2020
-01-15
17:11
:05 +0
000
Dec-07
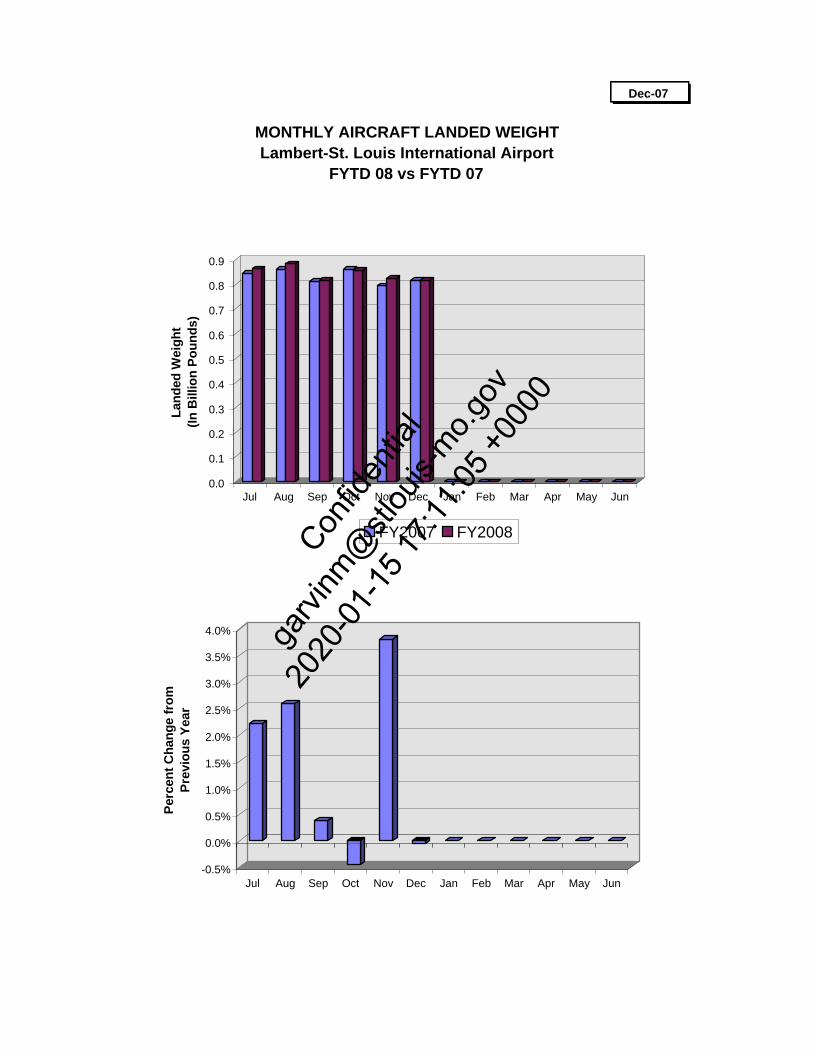
MONTHLY ENPLANED AND DEPLANED CARGO
FYTD 08 vs FYTD 07Lambert-St. Louis International Airport
0.0
2.0
4.0
6.0
8.0
10.0
12.0
14.0
16.0
18.0
20.0
Enpl
aned
and
Dep
lane
d C
argo
(In M
illio
n Po
unds
)
Jul Aug Sep Oct Nov Dec Jan Feb Mar Apr May Jun
FY2007 FY2008
-10.0%
-8.0%
-6.0%
-4.0%
-2.0%
0.0%
2.0%
Perc
ent C
hang
e fr
omPr
evio
us Y
ear
Jul Aug Sep Oct Nov Dec Jan Feb Mar Apr May Jun
Confid
entia
l
garvi
nm@
stlou
is-mo.g
ov
2020
-01-15
17:11
:05 +0
000

Dec-07
FYTD 08 vs FYTD 07
CARGO BREAKDOWN BETWEEN BELLY AND ALL-CARGO CARRIERSLambert-St. Louis International Airport
FYTD 2007
All-Cargo89%
Belly11%
FYTD 2008
All-Cargo90%
Belly10%
Confid
entia
l
garvi
nm@
stlou
is-mo.g
ov
2020
-01-15
17:11
:05 +0
000

Dec-07
Percent PercentDec-07 Dec-06 Change FY2008 FY2007 Change
MailMajor/nationalAmerica West 0 159,341 -100.0% 40,593 1,007,820 -96.0% Air Tran 0 0 - 0 0 - American 383,324 571,983 -33.0% 2,263,321 4,034,953 -43.9% Continental 0 0 - 0 0 - Delta 0 37 -100.0% 199 270 -26.3% Frontier 1,478 0 - 1,478 0 - Northwest 8 13 -38.5% 754 820 -8.0% Southwest 0 0 - 0 0 - United 2,823 0 - 4,642 0 - US Airways 261,112 0 - 839,949 0 - USA 3000 0 0 - 0 0 - Subtotal-Major/national 648,745 731,374 -11.3% 3,150,936 5,043,863 -37.5%
Regional/commuterAir Canada 0 0 - 0 0 - Jazz Air 0 0 - 0 0 - AA Conn/ Am. Eagle 0 0 - 0 0 - AA Conn/ Chautauqua 596 136 338.2% 10,244 15,361 -33.3% AA Conn/ RegionsAir 0 0 - 0 0 - AA Conn/ Tr States 0 0 - 0 0 - CO Exp/ Chautauqua 0 0 - 0 0 - CO Exp/ Expressjet 70 115 -39.1% 281 1,060 -73.5% Great Lakes 0 0 - 0 0 - DL Conn/ ASA 0 0 - 0 0 - DL Conn/ Chautauqua 0 0 - 0 0 - DL Conn/ Comair 0 0 - 0 0 - DL Conn/ Freedom 0 0 - 0 0 - DL Conn/ Shuttle Am. 0 0 - 0 0 - DL Conn/ Skywest 0 0 - 0 0 - MW Conn/ Skyway 0 0 - 0 0 - NW Airlink/ Compass 0 0 - 0 0 - NW Airlink/ Mesaba 10 0 - 41 0 - NW Airlink/ Pinnacle 50 0 - 62 13 376.9% UA Exp/ Air Wisconsin 0 0 - 0 0 - UA Exp/ Go Jet 0 0 - 0 0 - UA Exp/ Skywest 0 0 - 0 0 - UA Exp/ Tr States 0 0 - 0 0 - UA Exp/ Mesa 0 0 - 0 0 - US Exp/ Air Midwest 0 405 -100.0% 0 405 -100.0% US Exp/ Air Wisconsin 0 103 -100.0% 0 990 -100.0% US Exp/ Chautauqua 0 0 - 0 0 - US Exp/ Mesa 0 0 - 387 0 - US Exp/ Republic 0 120 -100.0% 0 135 -100.0% US Exp/ Tr States 34 1,474 -97.7% 34 10,356 -99.7% US Exp/ PSA 0 0 - 33 4,005 -99.2% Subtotal-Regional/commuter 760 2,353 -67.7% 11,082 32,325 -65.7%
Charter 0 0 - 0 0 -
CargoAirborne 0 0 - 0 0 - Am. Trans Intl 0 0 - 0 0 - ASTAR 0 0 - 0 0 - Capital Cargo 0 0 - 0 0 - UPS SCSI 0 0 - 0 0 - FedEx 0 0 - 0 0 - Mountain 0 0 - 0 0 - *UPS 3,266,632 3,565,705 -8.4% 20,840,938 21,887,443 -4.8% Subtotal-Cargo 3,266,632 3,565,705 -8.4% 20,840,938 21,887,443 -4.8%
Total Mail 3,916,137 4,299,432 -8.9% 24,002,956 26,963,631 -11.0%
SUMMARY OF ENPLANED AND DEPLANED MAIL BY AIRLINELambert-St. Louis International Airport
Month Year-to-date
Dec-07 vs Dec-06 and FYTD 08 vs FYTD 07
Confid
entia
l
garvi
nm@
stlou
is-mo.g
ov
2020
-01-15
17:11
:05 +0
000
Dec-07
Percent PercentDec-07 Dec-06 Change FY2008 FY2007 Change
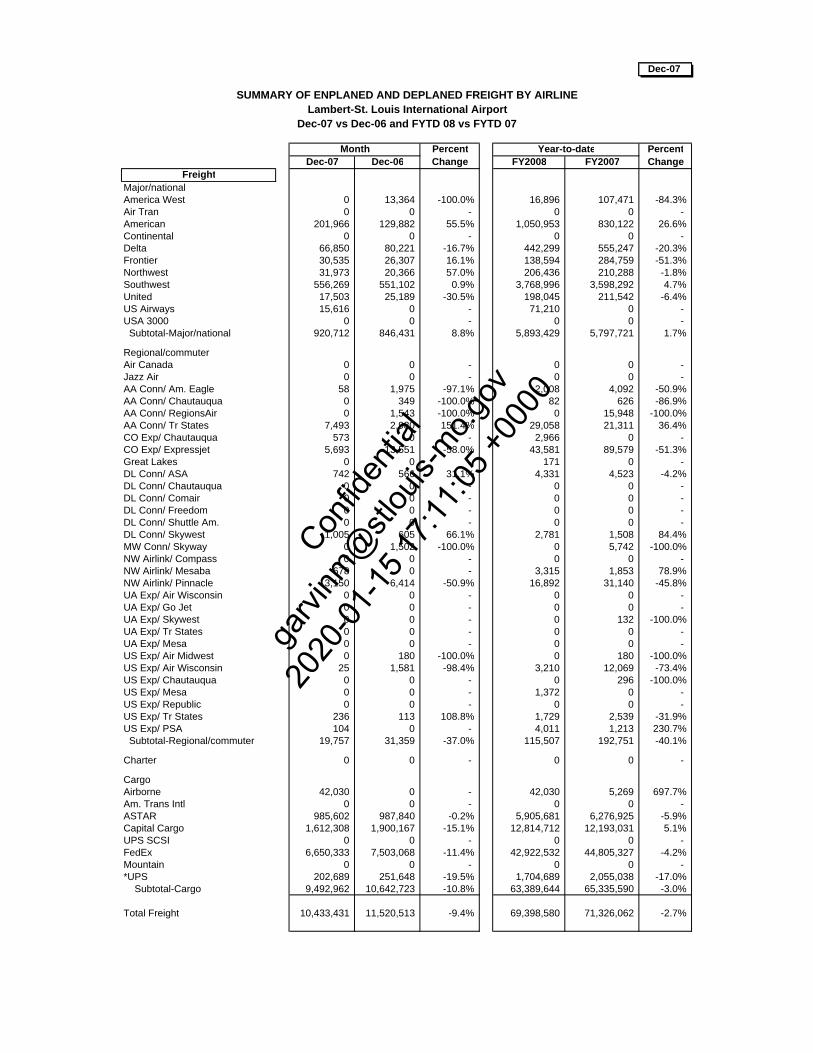
FreightMajor/nationalAmerica West 0 13,364 -100.0% 16,896 107,471 -84.3% Air Tran 0 0 - 0 0 - American 201,966 129,882 55.5% 1,050,953 830,122 26.6% Continental 0 0 - 0 0 - Delta 66,850 80,221 -16.7% 442,299 555,247 -20.3% Frontier 30,535 26,307 16.1% 138,594 284,759 -51.3% Northwest 31,973 20,366 57.0% 206,436 210,288 -1.8% Southwest 556,269 551,102 0.9% 3,768,996 3,598,292 4.7% United 17,503 25,189 -30.5% 198,045 211,542 -6.4% US Airways 15,616 0 - 71,210 0 - USA 3000 0 0 - 0 0 - Subtotal-Major/national 920,712 846,431 8.8% 5,893,429 5,797,721 1.7%
Regional/commuterAir Canada 0 0 - 0 0 - Jazz Air 0 0 - 0 0 - AA Conn/ Am. Eagle 58 1,975 -97.1% 2,008 4,092 -50.9% AA Conn/ Chautauqua 0 349 -100.0% 82 626 -86.9% AA Conn/ RegionsAir 0 1,543 -100.0% 0 15,948 -100.0% AA Conn/ Tr States 7,493 2,980 151.4% 29,058 21,311 36.4% CO Exp/ Chautauqua 573 0 - 2,966 0 - CO Exp/ Expressjet 5,693 13,551 -58.0% 43,581 89,579 -51.3% Great Lakes 0 0 - 171 0 - DL Conn/ ASA 742 566 31.1% 4,331 4,523 -4.2% DL Conn/ Chautauqua 0 0 - 0 0 - DL Conn/ Comair 0 0 - 0 0 - DL Conn/ Freedom 0 0 - 0 0 - DL Conn/ Shuttle Am. 0 0 - 0 0 - DL Conn/ Skywest 1,005 605 66.1% 2,781 1,508 84.4% MW Conn/ Skyway 0 1,502 -100.0% 0 5,742 -100.0% NW Airlink/ Compass 0 0 - 0 0 - NW Airlink/ Mesaba 678 0 - 3,315 1,853 78.9% NW Airlink/ Pinnacle 3,150 6,414 -50.9% 16,892 31,140 -45.8% UA Exp/ Air Wisconsin 0 0 - 0 0 - UA Exp/ Go Jet 0 0 - 0 0 - UA Exp/ Skywest 0 0 - 0 132 -100.0% UA Exp/ Tr States 0 0 - 0 0 - UA Exp/ Mesa 0 0 - 0 0 - US Exp/ Air Midwest 0 180 -100.0% 0 180 -100.0% US Exp/ Air Wisconsin 25 1,581 -98.4% 3,210 12,069 -73.4% US Exp/ Chautauqua 0 0 - 0 296 -100.0% US Exp/ Mesa 0 0 - 1,372 0 - US Exp/ Republic 0 0 - 0 0 - US Exp/ Tr States 236 113 108.8% 1,729 2,539 -31.9% US Exp/ PSA 104 0 - 4,011 1,213 230.7% Subtotal-Regional/commuter 19,757 31,359 -37.0% 115,507 192,751 -40.1%
Charter 0 0 - 0 0 -
CargoAirborne 42,030 0 - 42,030 5,269 697.7% Am. Trans Intl 0 0 - 0 0 - ASTAR 985,602 987,840 -0.2% 5,905,681 6,276,925 -5.9% Capital Cargo 1,612,308 1,900,167 -15.1% 12,814,712 12,193,031 5.1% UPS SCSI 0 0 - 0 0 - FedEx 6,650,333 7,503,068 -11.4% 42,922,532 44,805,327 -4.2% Mountain 0 0 - 0 0 - *UPS 202,689 251,648 -19.5% 1,704,689 2,055,038 -17.0% Subtotal-Cargo 9,492,962 10,642,723 -10.8% 63,389,644 65,335,590 -3.0%
Total Freight 10,433,431 11,520,513 -9.4% 69,398,580 71,326,062 -2.7%
SUMMARY OF ENPLANED AND DEPLANED FREIGHT BY AIRLINELambert-St. Louis International Airport
Month Year-to-date
Dec-07 vs Dec-06 and FYTD 08 vs FYTD 07
Confid
entia
l
garvi
nm@
stlou
is-mo.g
ov
2020
-01-15
17:11
:05 +0
000