Embed Size (px)
Citation preview
Reducing Your School’s Carbon Footprint CC5779© 3
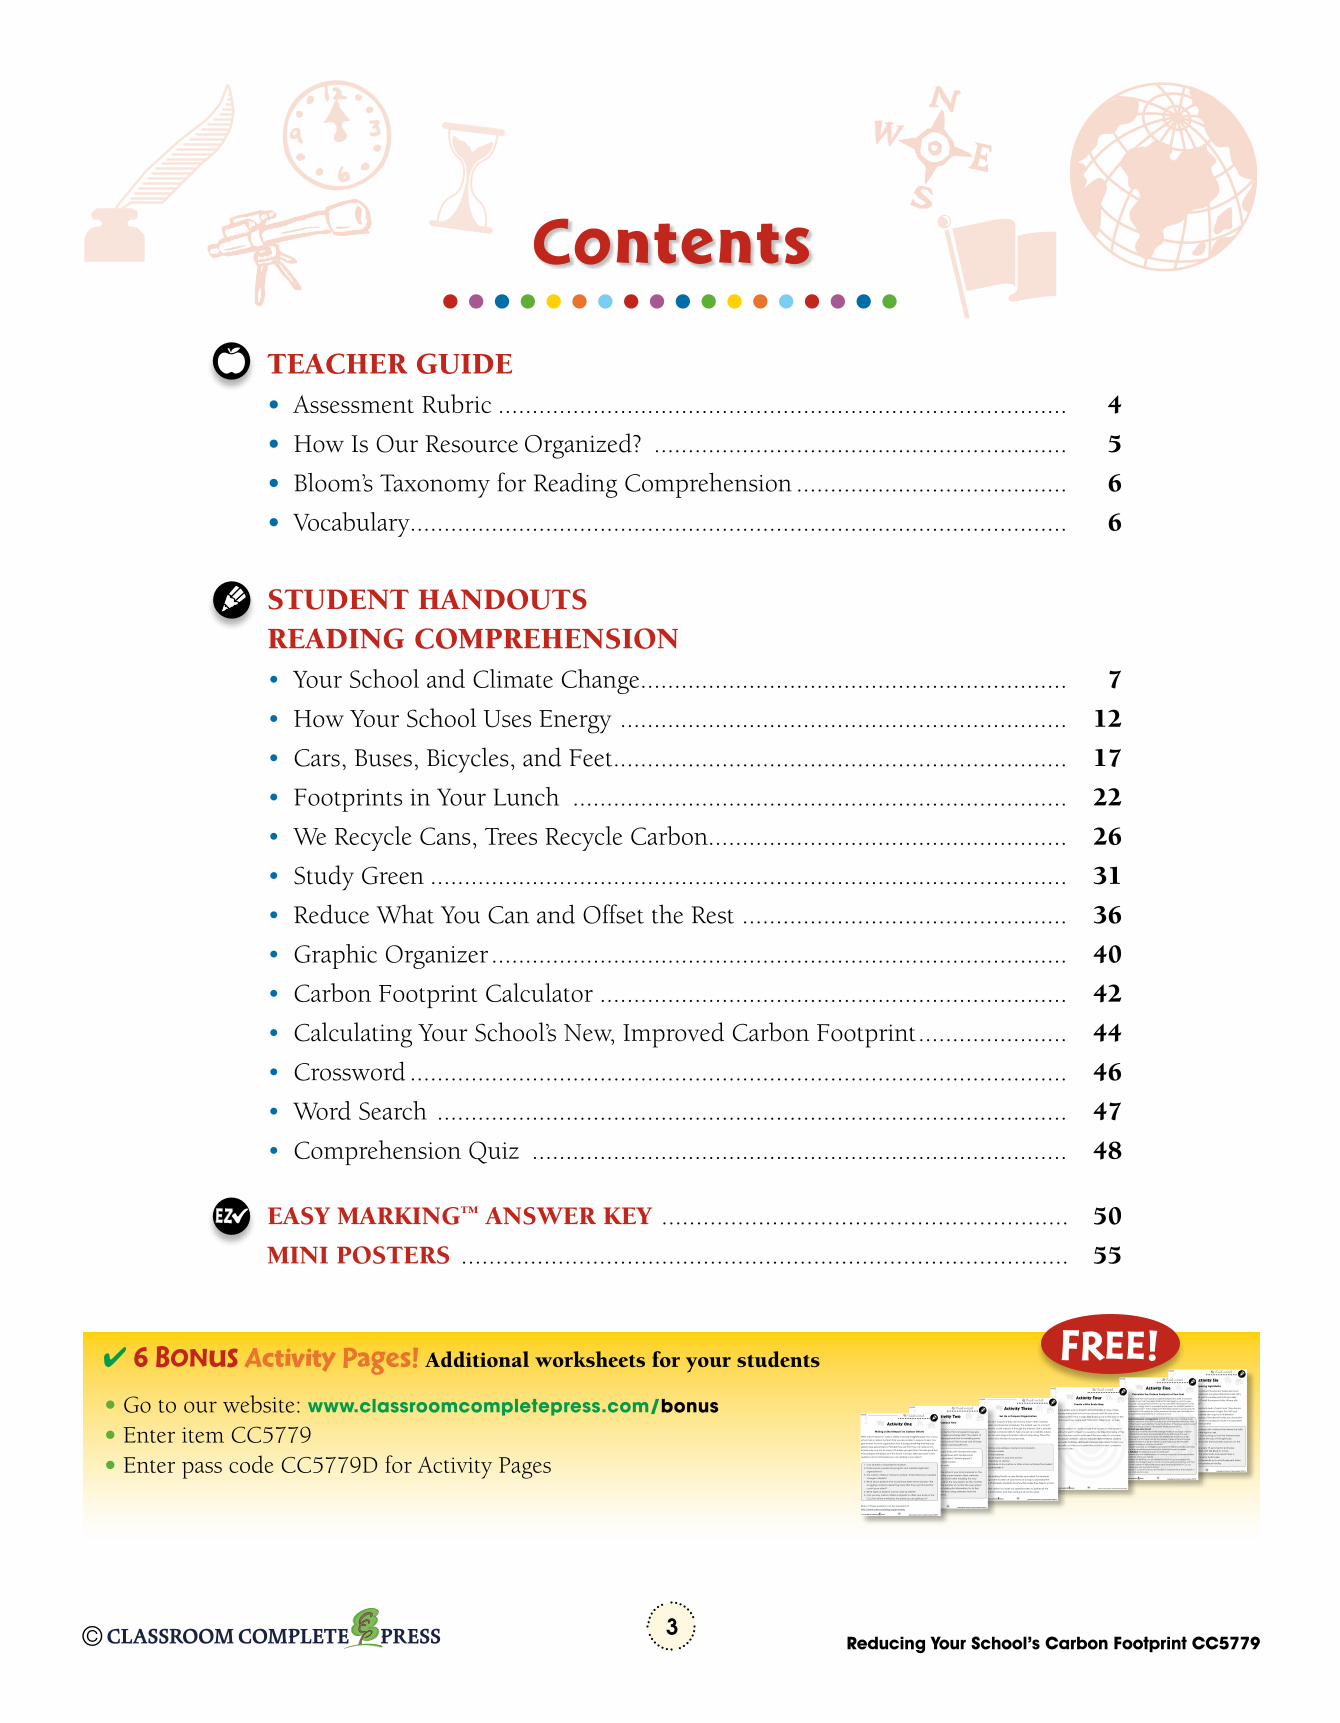
Contents
EZ
..................
• Go to our website: www.classroomcompletepress.com/bonus
• Enter item CC5779 • Enter pass code CC5779D for Activity Pages © Reducing Your School’s Carbon Footprint CC5779
NAME:
...................Student Worksheet
6A
Comparing Light Bulbs
You may remember that compact fl uorescent bulbs are much more effi cient than incandescent (tungsten fi lament) bulbs. Why do you think that is? A 100-watt incandescent bulb provides about as much light as a 25-watt fl uorescent bulb. Where did that 75-watt difference go?
For this activity you will need one bulb of each kind. They should be rated as providing the same amount of light. The 100 and 25-watt bulbs mentioned above are a good combination. Somewhere on the packaging of fl uorescent bulbs you should be able to fi nd a note as to which incandescent bulb it is equivalent to. You will also need a thermometer.
1. Put one of the bulbs in a lamp with a fi xture that allows the bulb to point up. Do not turn the light on yet.
2. Hang the thermometer from a string so that the thermometer bulb is about 6 inches above the top of the light bulb.
3. Record the temperature on the thermometer and turn on the lamp.
4. Record the temperature every 15 seconds for 2 minutes. 5. Turn the lamp off and WAIT FOR THE BULB TO COOL. 6. Replace the bulb with the other bulb and repeat step 4. 7. Graph temperature vs. time for both bulbs. 8. Draw a conclusion from the results as to why fl uorescent bulbs
are more effi cient than incandescent bulbs.
Activity Six
FREE!
TEACHER GUIDE• Assessment Rubric .................................................................................... 4
• How Is Our Resource Organized? ............................................................. 5
• Bloom’s Taxonomy for Reading Comprehension ........................................ 6
• Vocabulary ................................................................................................. 6
STUDENT HANDOUTSREADING COMPREHENSION• Your School and Climate Change ............................................................... 7
• How Your School Uses Energy .................................................................. 12
• Cars, Buses, Bicycles, and Feet ................................................................... 17
• Footprints in Your Lunch ......................................................................... 22
• We Recycle Cans, Trees Recycle Carbon..................................................... 26
• Study Green .............................................................................................. 31
• Reduce What You Can and Offset the Rest ................................................ 36
• Graphic Organizer ..................................................................................... 40
• Carbon Footprint Calculator ..................................................................... 42
• Calculating Your School’s New, Improved Carbon Footprint ...................... 44
• Crossword ................................................................................................. 46
• Word Search ............................................................................................. 47
• Comprehension Quiz ............................................................................... 48
EASY MARKING™ ANSWER KEY ........................................................... 50
MINI POSTERS ........................................................................................ 55
4 6 BONUS Activity Pages! Additional worksheets for your students
© Reducing Your School’s Carbon Footprint CC5779
NAME:
...................Student Worksheet
5A
Calculate the Carbon Footprint of Your Feet
You may have read that running has no carbon footprint. Not quite. It would be more accurate to say that the carbon footprint for running is too small to worry about. If you are curious just how small it is, do this calculation. The footprint comes from three places: Energy used to manufacture the shoes, the footprint related to the extra food you have to eat to make up for the extra calories you burn, and the CO2 you exhale. You will have to do a little guesswork, but you can calculate all of these. The result will be the footprint of running to school.
1. Manufacturing your running shoes: Multiply the cost of your running shoes when they were new times 0.50 and divide by what you think will be the total life of the shoes in years. Multiply this by the fraction of the shoes use that would be used for running to school. The answer will be pounds of CO2.
2. Extra food you have to eat: a. Assume you have the diet of the average American your age of about
2100 kilocalories (kcal) per day. Multiply this by 365 days in the year. b. Running burns about 100 kcal per mile. Multiply this by the round-trip
distance to school and then by the number of days in the school year. c. Divide the result in b. by the result in a. and multiply by 100. This is the
percent increase in your food footprint. d. Assume you have an average food footprint of 7500 pounds (lbs.) per year.
Use the percent increase from part c. to fi nd your yearly increase.3. CO2 Exhaled: This will be the least accurate part.
a. Assume that the added exertion of running causes you to exhale an extra 0.014 lbs. of CO2 per minute.
b. Multiply this by 60 min./hr. and divide by 6 mi./hr to get pounds per mile. c. Multiply the answer in part b. by the round-trip distance to school and then
by the number of days in the school year. This is the pounds of CO2 you exhale per year running to school.
4. Add parts 1. 2. and 3. This is your foot footprint. Compare this to the footprint of about 1.0 lb./mi. for a car.
Activity Five
© Reducing Your School’s Carbon Footprint CC5779
NAME:
...................Student Worksheet
4A
Create a Bike Route Map
Learn the safest ways to travel to school by bike. A map of bike
routes surrounding your school may already exist. Try one of the
following sources to fi nd a map: bike shops, book stores, and on-line
search for your town name and “bike lane,” “bike route,” or “bike
map.”
Use this information to create a map that focuses on the needs of
students who want to travel to your school by bike. Ride some of the
routes on the map you found to see if it is accurate. On your map
you should use different colors to indicate different levels of safety
for the routes. Defi nitely distinguish between bike lanes that put you
beside traffi c and the much safer bike routes that are completely
isolated from traffi c.
Activity Four
ys to travel to school by bike. A m
ding your school may already exist. Try one o
ources to fi nd a map: bike shops, book stores, and o
or your town name and “bike lane,” “bike route,” or “bike
this information to create a map that focuses on the needs of
dents who want to travel to your school by bike. Ride some of the
utes o
ou sh
or the routes. Defi nitely distinguish between bike lanes that put you
eside
olate
r school may already exist. T
to fi nd a map: bike shops, book stores
ur town name and “bike lane,” “bike route,” or
nformation to create a map that focuses on the needs o
ts who want to travel to your school by bike. Ride some of t
on the map you found to see if it is accurate. On your map
hould use different colors to indicate different levels of safety
e routes. Defi nitely distinguish between bike lanes that put you
e traffi c and the much safer bike routes that are completely
ed fro
a map: bike shops, book
n name and “bike lane,” “bike rout
mation to create a map that focuses on the nee
ho want to travel to your school by bike. Ride some
the map you found to see if it is accurate. On your m
d use different colors to indicate different levels of safe
utes. Defi nitely distinguish between bike lanes that put
affi c and the much safer bike routes that are complete
om tr
and “bike lane,” “
on to create a map that focuses on th
ant to travel to your school by bike. Ride s
map you found to see if it is accurate. On yo
e different colors to indicate different levels o
Defi nitely distinguish between bike lanes that
and the much safer bike routes that are com
raffi c.
create a map that focuses
o travel to your school by bike. R
you found to see if it is accurate. O
erent colors to indicate different lev
nitely distinguish between bike lanes
the much safer bike routes that are c
c.
a map that f
el to your school by b
found to see if it is accura
nt colors to indicate differen
y distinguish between bike la
much safer bike routes that
o your school
nd to see if it is acc
colors to indicate differ
distinguish between bike
uch safer bike routes th
© Reducing Your School’s Carbon Footprint CC5779
NAME:
...................Student Worksheet
3A
Set Up a Carpool Organization
People can’t carpool if they don’t know each other’s names,
addresses, and personal schedules. The easiest way to connect
people who could carpool is through the Internet. Ask a teacher
who teaches computer skills to help you set up a website where
people can exchange information about carpooling. This is the
information that the site should provide:
• Name and address of parents and students
• Phone number
• E-mail address
• Route taken to and from school
• Capacity of vehicle
• Schedule of any before or after school activities the student
participates in
Get help making the site as user-friendly as possible. For example,
clicking on the location of your home on a map could reveal the
homes of all nearby students and show the routes they take to school.
The other option is to pass out questionnaires to gather all the
above information and then sorting it all out by hand.
Activity Three
© Reducing Your School’s Carbon Footprint CC5779
NAME:
...................Student Worksheet
2A
Payback Time
How long does it take for a device that cuts greenhouse gas
emissions to pay for itself in reduced energy bills? The object of
this activity is to estimate the payback time for installing some
energy-saving devices at your school. First choose one of these
improvements that your school could benefi t from:
1. Replacing incandescent bulbs with fl uorescent bulbs.
2. Replacing single-pane windows with double-pane
windows. (These are also called “double-glazed”)
3. Installing a solar hot water heater.
4. Installing photovoltaic cells.
First you will need to fi nd the amount your school spends on the
electricity or fuel to power the current system. Next, estimate
the amount of savings each month after installing the new
system. Finally, divide the cost of the new system by the monthly
savings. The result will be the number of months the new system
takes to pay for itself. When looking for information, try to fi nd
independent sources, rather than using estimates from the
companies selling the systems.
Activity Two
© Reducing Your School’s Carbon Footprint CC5779
NAME:
...................Student Worksheet
1A
Activity One
Writing a Short Report on Carbon Offsets
Write a short report on carbon offsets. It sounds straightforward: You or your
school has a carbon footprint that you are unable to reduce to zero. You
give money to some organization that is doing something that reduces
greenhouse gas emissions. Perhaps they say that they can reduce CO2
emissions by one ton for every $10 dollars you give them. Sounds good, but
many people are skeptical of the whole concept. Here are some of the
questions and controversies you can address in your report:
1. Can all these companies be trusted?
2. Does anyone oversee the program and validate legitimate
organizations?
3. Are carbon offsets a “license to pollute” that postpones a needed
change in lifestyle?
4. What about projects that would have been done anyway—like
a logging company replanting trees after they log? Should that
count as an offset?
5. What types of projects can be used as offsets?
6. Can you buy carbon offsets at airports to offset your share of the
CO2 that will be emitted by the plane you are getting on?
Many of these questions can be answered at:
http://www.carboncatalog.org/providers/
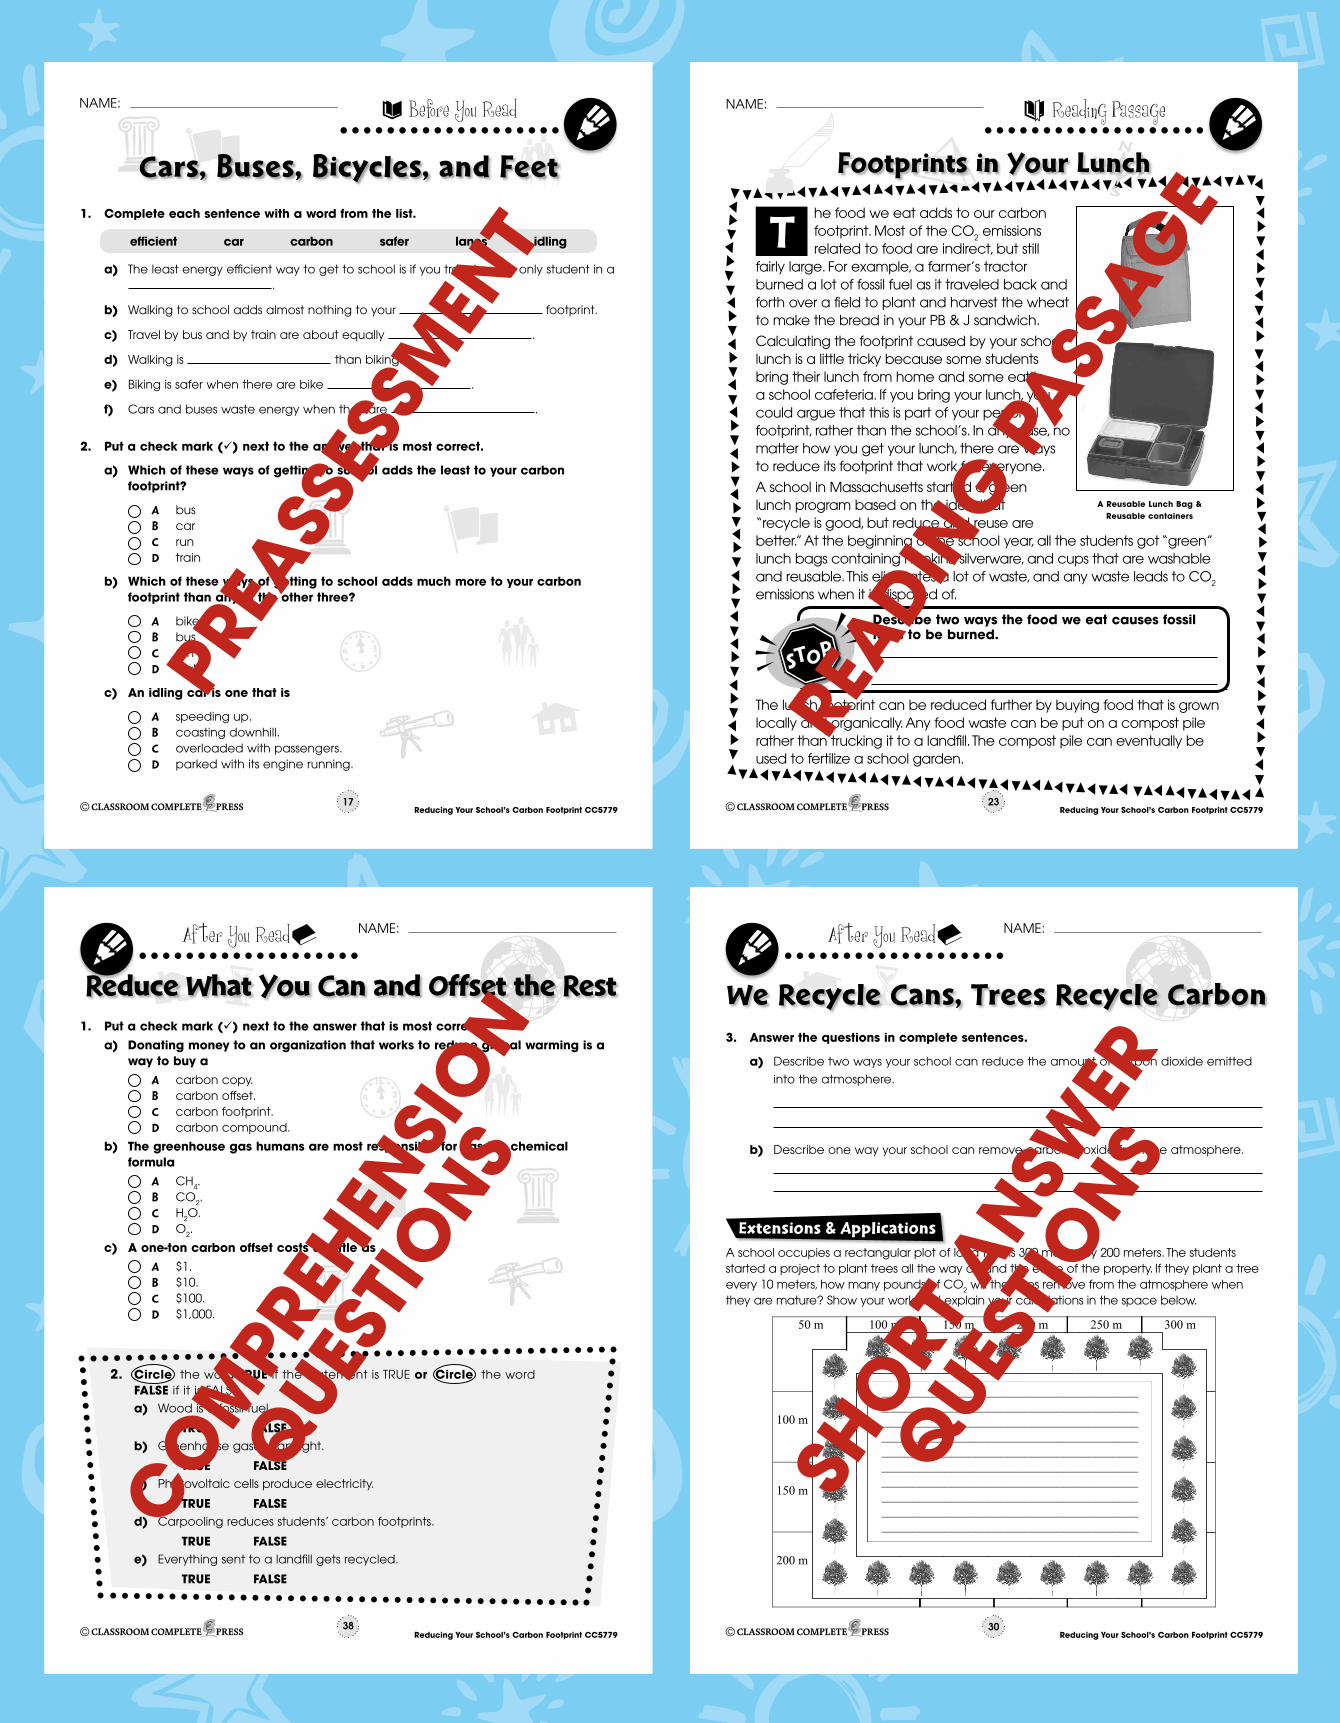
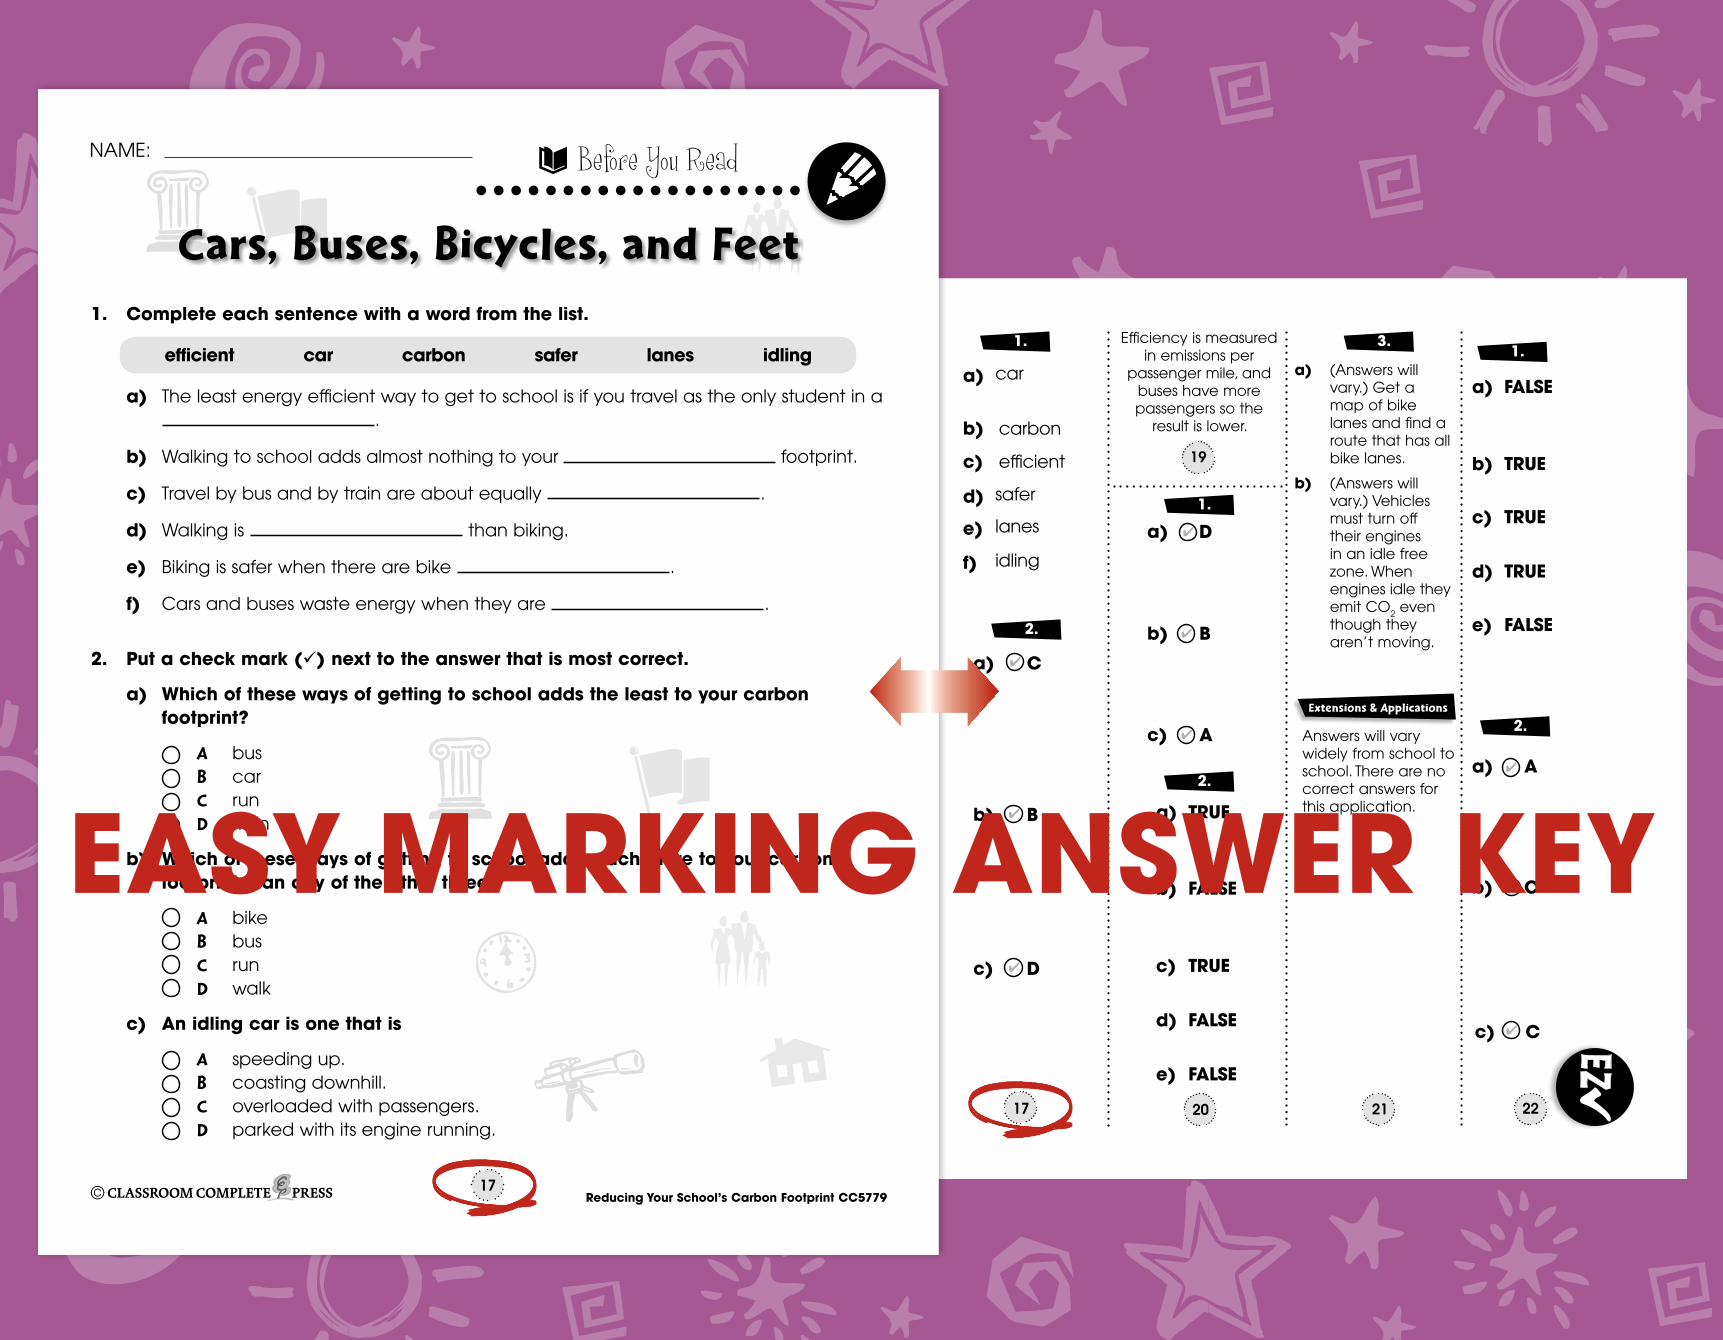
NAME:
...................Before You Read
Reducing Your School’s Carbon Footprint CC5779
1. Complete each sentence with a word from the list.
efficient car carbon safer lanes idling
a) The least energy efficient way to get to school is if you travel as the only student in a .
b) Walking to school adds almost nothing to your footprint.
c) Travel by bus and by train are about equally .
d) Walking is than biking.
e) Biking is safer when there are bike .
f) Cars and buses waste energy when they are .
2. Put a check mark (ü) next to the answer that is most correct.
a) Which of these ways of getting to school adds the least to your carbon footprint?
A bus B car C run D train
b) Which of these ways of getting to school adds much more to your carbon footprint than any of the other three?
A bike B bus C run D walk
c) An idling car is one that is
A speeding up. B coasting downhill. C overloaded with passengers. D parked with its engine running.
Cars, Buses, Bicycles, and Feet
17©
NAME:
...................After You Read
Reducing Your School’s Carbon Footprint CC5779
Reduce What You Can and Offset the Rest1. Put a check mark (ü) next to the answer that is most correct. a) Donating money to an organization that works to reduce global warming is a
way to buy a A carbon copy. B carbon offset. C carbon footprint. D carbon compound.
b) The greenhouse gas humans are most responsible for has the chemical formula
A CH4. B CO2. C H2O. D O2.
c) A one-ton carbon offset costs as little as A $1. B $10. C $100. D $1,000.
38
2. Circle the word TRUE if the statement is TRUE or Circle the word FALSE if it is FALSE.
a) Wood is a fossil fuel.
TRUE FALSE b) Greenhouse gases trap light.
TRUE FALSE c) Photovoltaic cells produce electricity.
TRUE FALSE d) Carpooling reduces students’ carbon footprints.
TRUE FALSE e) Everything sent to a landfill gets recycled.
TRUE FALSE
©
ReadinG PassaGeNAME:
...................
Reducing Your School’s Carbon Footprint CC5779
Footprints in Your Lunch
he food we eat adds to our carbon footprint. Most of the CO2 emissions related to food are indirect, but still
fairly large. For example, a farmer’s tractor burned a lot of fossil fuel as it traveled back and forth over a field to plant and harvest the wheat to make the bread in your PB & J sandwich.
Calculating the footprint caused by your school lunch is a little tricky because some students bring their lunch from home and some eat in a school cafeteria. If you bring your lunch, you could argue that this is part of your personal footprint, rather than the school’s. In any case, no matter how you get your lunch, there are ways to reduce its footprint that work for everyone.
A school in Massachusetts started a green lunch program based on the idea that “recycle is good, but reduce and reuse are better.” At the beginning of the school year, all the students got “green” lunch bags containing napkins, silverware, and cups that are washable and reusable. This eliminates a lot of waste, and any waste leads to CO2 emissions when it is disposed of.
A Reusable Lunch Bag & Reusable containers
23
T
Describe two ways the food we eat causes fossil fuels to be burned.
STOP
©
The lunch footprint can be reduced further by buying food that is grown locally and organically. Any food waste can be put on a compost pile rather than trucking it to a landfill. The compost pile can eventually be used to fertilize a school garden.
NAME:
...................After You Read
Reducing Your School’s Carbon Footprint CC5779
3. Answer the questions in complete sentences.
a) Describe two ways your school can reduce the amount of carbon dioxide emitted
into the atmosphere.
b) Describe one way your school can remove carbon dioxide from the atmosphere.
A school occupies a rectangular plot of land that is 300 meters by 200 meters. The students started a project to plant trees all the way around the edge of the property. If they plant a tree every 10 meters, how many pounds of CO2 will the trees remove from the atmosphere when they are mature? Show your work and explain your calculations in the space below.
We Recycle Cans, Trees Recycle Carbon
30
Extensions & Applications
©
50 m 100 m 150 m 200 m 250 m 300 m
100 m
150 m
200 m
__________________________________________________________________________________________________________________________________________________________________________________________________________________________________________________________________________________________________________________________________________________________________________________________________________________________
PREA
SSES
SMEN
T
CO
MPR
EHEN
SIO
N
QUE
STIO
NS
READ
ING
PAS
SAG
E
SHO
RT A
NSW
ER
QUE
STIO
NS
...................Hands-On ActivitY # 1
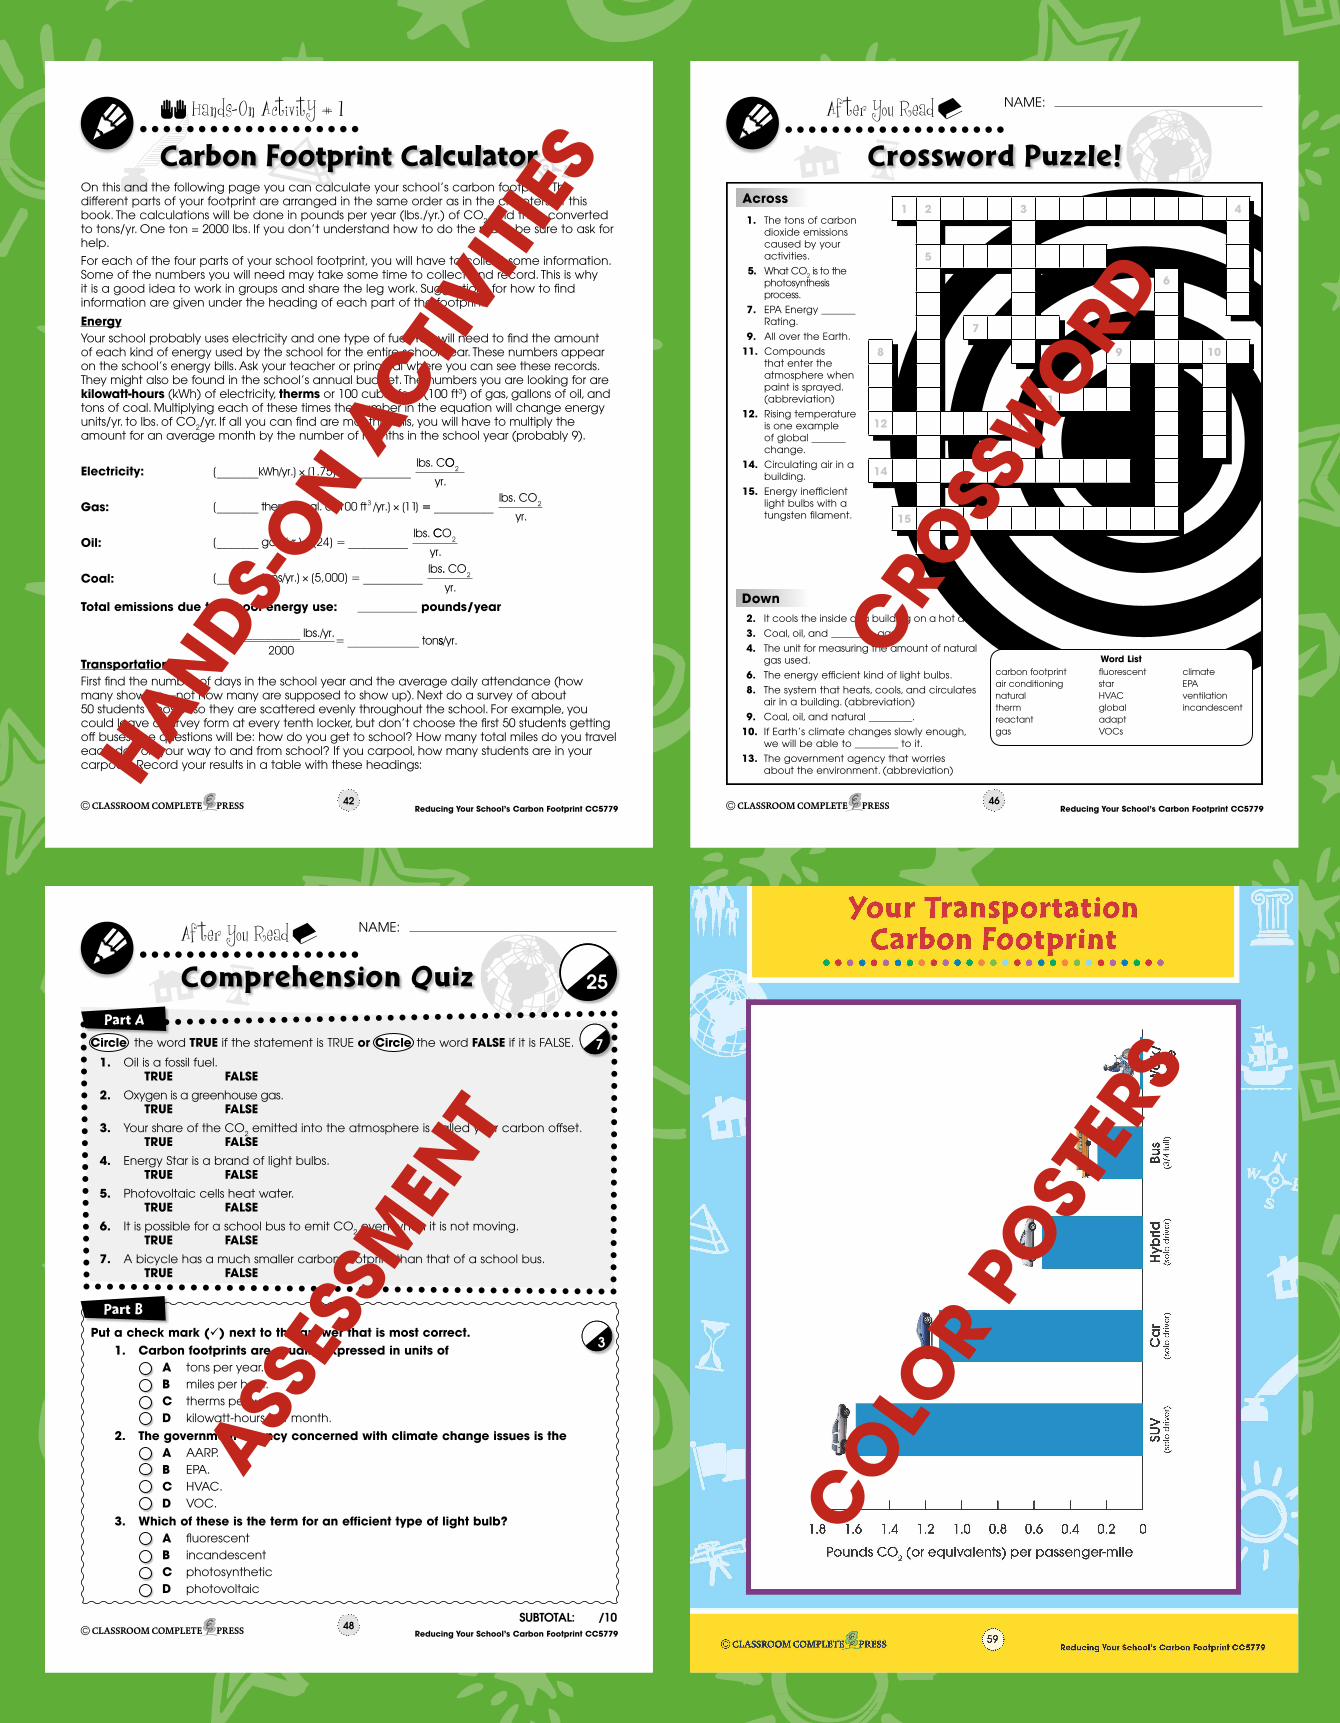
Reducing Your School’s Carbon Footprint CC577942
Carbon Footprint CalculatorOn this and the following page you can calculate your school’s carbon footprint. The different parts of your footprint are arranged in the same order as in the chapters of this book. The calculations will be done in pounds per year (lbs./yr.) of CO2 and then converted to tons/yr. One ton = 2000 lbs. If you don’t understand how to do the math, be sure to ask for help.
For each of the four parts of your school footprint, you will have to collect some information. Some of the numbers you will need may take some time to collect and record. This is why it is a good idea to work in groups and share the leg work. Suggestions for how to find information are given under the heading of each part of the footprint.
EnergyYour school probably uses electricity and one type of fuel. You will need to find the amount of each kind of energy used by the school for the entire school year. These numbers appear on the school’s energy bills. Ask your teacher or principal where you can see these records. They might also be found in the school’s annual budget. The numbers you are looking for are kilowatt-hours (kWh) of electricity, therms or 100 cubic feet (100 ft3) of gas, gallons of oil, and tons of coal. Multiplying each of these times the number in the equation will change energy units/yr. to lbs. of CO2/yr. If all you can find are monthly bills, you will have to multiply the amount for an average month by the number of months in the school year (probably 9).
Electricity:
Gas:
Oil:
Coal:
Total emissions due to school energy use: __________ pounds/year
TransportationFirst find the number of days in the school year and the average daily attendance (how many show up—not how many are supposed to show up). Next do a survey of about 50 students chosen so they are scattered evenly throughout the school. For example, you could leave a survey form at every tenth locker, but don’t choose the first 50 students getting off buses. The questions will be: how do you get to school? How many total miles do you travel each day on your way to and from school? If you carpool, how many students are in your carpool? Record your results in a table with these headings:
____________ lbs./yr.2000
= ____________ tonss/yr.
( ) ( , )_______ tons/yr. = __________lbs
× 5 000.. CO
yr.2
( ) ( )_______ gal. /yr. = __________lbs.
× 24CCO
yr.2
( ) ( )_______ therms, gal. or 100 ft /yr.3 11× == __________lbs. CO
yr.2
( ) ( . )_______kWh/yr. = __________lbs. C
× 1 75OO
yr.2
©
NAME:
...................After You Read
Reducing Your School’s Carbon Footprint CC5779
Comprehension Quiz
48
3
7
Part A
1. Oil is a fossil fuel. TRUE FALSE2. Oxygen is a greenhouse gas. TRUE FALSE3. Your share of the CO2 emitted into the atmosphere is called your carbon offset. TRUE FALSE4. Energy Star is a brand of light bulbs. TRUE FALSE5. Photovoltaic cells heat water. TRUE FALSE6. It is possible for a school bus to emit CO2 even when it is not moving. TRUE FALSE7. A bicycle has a much smaller carbon footprint than that of a school bus. TRUE FALSE
Part B
Put a check mark (ü) next to the answer that is most correct. 1. Carbon footprints are usually expressed in units of A tons per year. B miles per hour. C therms per week. D kilowatt-hours per month.
2. The government agency concerned with climate change issues is the A AARP. B EPA. C HVAC. D VOC.
3. Which of these is the term for an efficient type of light bulb? A fluorescent B incandescent C photosynthetic D photovoltaic
Circle the word TRUE if the statement is TRUE or Circle the word FALSE if it is FALSE.
25
SUBTOTAL: /10©
NAME:
...................After You Read
Reducing Your School’s Carbon Footprint CC5779
Crossword Puzzle!
46
carbon footprintair conditioningnaturalthermreactantgas
Word ListfluorescentstarHVACglobaladaptVOCs
climateEPAventilationincandescent
1 2 3 4
5
6
7
8 9 10
11
12 13
14
15
Across
1. The tons of carbon dioxide emissions caused by your activities.
5. What CO2 is to the photosynthesis process.
7. EPA Energy _______ Rating.
9. All over the Earth.
11. Compounds that enter the atmosphere when paint is sprayed. (abbreviation)
12. Rising temperature is one example of global _______ change.
14. Circulating air in a building.
15. Energy inefficient light bulbs with a tungsten filament.
Down 2. It cools the inside of a building on a hot day.
3. Coal, oil, and _________ gas.
4. The unit for measuring the amount of natural gas used.
6. The energy efficient kind of light bulbs.
8. The system that heats, cools, and circulates air in a building. (abbreviation)
9. Coal, oil, and natural _________.
10. If Earth’s climate changes slowly enough, we will be able to _________ to it.
13. The government agency that worries about the environment. (abbreviation)
©
HAND
S-O
N AC
TIVI
TIES
ASSE
SSM
ENT
CRO
SSW
ORD
CO
LOR
POST
ERS
Re
duc
ing Yo
ur Scho
ol’s C
arb
on Fo
otp
rint CC
5779
17
Efficiency is measured in emissions per
passenger mile, and buses have more passengers so the
result is lower.
2016
EZ
a) (Answers will vary.) Change to energy efficient bulbs and raise blinds on a sunny day.
b) (Answers will vary.) Open windows and turn off AC. Install double-paned windows.
3.
School Energy Need
How to Reduce Energy Use
HeatingInstall better insulation and double-pane windows.
Air conditioning
Open the windows and turn off the air conditioning when outside temperature permits.
Hot waterInstall solar water heaters on school roof.
LightingRaise the blinds and turn off some of the lights.
Extensions & Applications
21
Answers will vary widely from school to school. There are no correct answers for this application.
a) (Answers will vary.) Get a map of bike lanes and find a route that has all bike lanes.
b) (Answers will vary.) Vehicles must turn off their engines in an idle free zone. When engines idle they emit CO2 even though they aren’t moving.
3.
Extensions & Applications
1.
a) car
b) carbon
c) efficient
d) safer
e) lanes
f) idling
a) C4
b) B4
c) D4
2.
a) D4
c) A4
b) B4
1.
b) FALSE
a) TRUE
d) FALSE
c) TRUE
e) FALSE
2.
19
22
1.
e) FALSE
d) TRUE
c) TRUE
b) TRUE
a) FALSE
2.
c) 4 C
b) 4 C
a) 4 A
©
NAME:
...................Before You Read
Reducing Your School’s Carbon Footprint CC5779
1. Complete each sentence with a word from the list.
efficient car carbon safer lanes idling
a) The least energy efficient way to get to school is if you travel as the only student in a .
b) Walking to school adds almost nothing to your footprint.
c) Travel by bus and by train are about equally .
d) Walking is than biking.
e) Biking is safer when there are bike .
f) Cars and buses waste energy when they are .
2. Put a check mark (ü) next to the answer that is most correct.
a) Which of these ways of getting to school adds the least to your carbon footprint?
A bus B car C run D train
b) Which of these ways of getting to school adds much more to your carbon footprint than any of the other three?
A bike B bus C run D walk
c) An idling car is one that is
A speeding up. B coasting downhill. C overloaded with passengers. D parked with its engine running.
Cars, Buses, Bicycles, and Feet
17©
EASY MARKING ANSWER KEY