Embed Size (px)
Citation preview
45
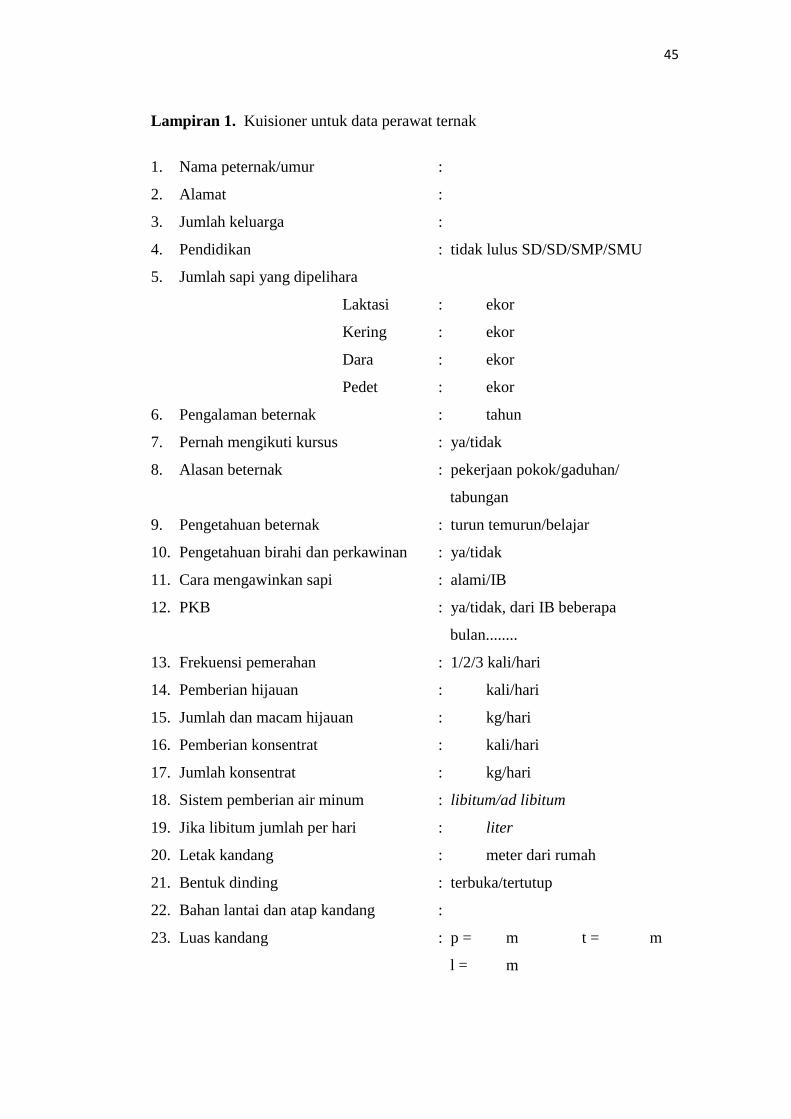
Lampiran 1. Kuisioner untuk data perawat ternak
1. Nama peternak/umur :
2. Alamat :
3. Jumlah keluarga :
4. Pendidikan : tidak lulus SD/SD/SMP/SMU
5. Jumlah sapi yang dipelihara
Laktasi : ekor
Kering : ekor
Dara : ekor
Pedet : ekor
6. Pengalaman beternak : tahun
7. Pernah mengikuti kursus : ya/tidak
8. Alasan beternak : pekerjaan pokok/gaduhan/
tabungan
9. Pengetahuan beternak : turun temurun/belajar
10. Pengetahuan birahi dan perkawinan : ya/tidak
11. Cara mengawinkan sapi : alami/IB
12. PKB : ya/tidak, dari IB beberapa
bulan........
13. Frekuensi pemerahan : 1/2/3 kali/hari
14. Pemberian hijauan : kali/hari
15. Jumlah dan macam hijauan : kg/hari
16. Pemberian konsentrat : kali/hari
17. Jumlah konsentrat : kg/hari
18. Sistem pemberian air minum : libitum/ad libitum
19. Jika libitum jumlah per hari : liter
20. Letak kandang : meter dari rumah
21. Bentuk dinding : terbuka/tertutup
22. Bahan lantai dan atap kandang :
23. Luas kandang : p = m t = m
l = m
46
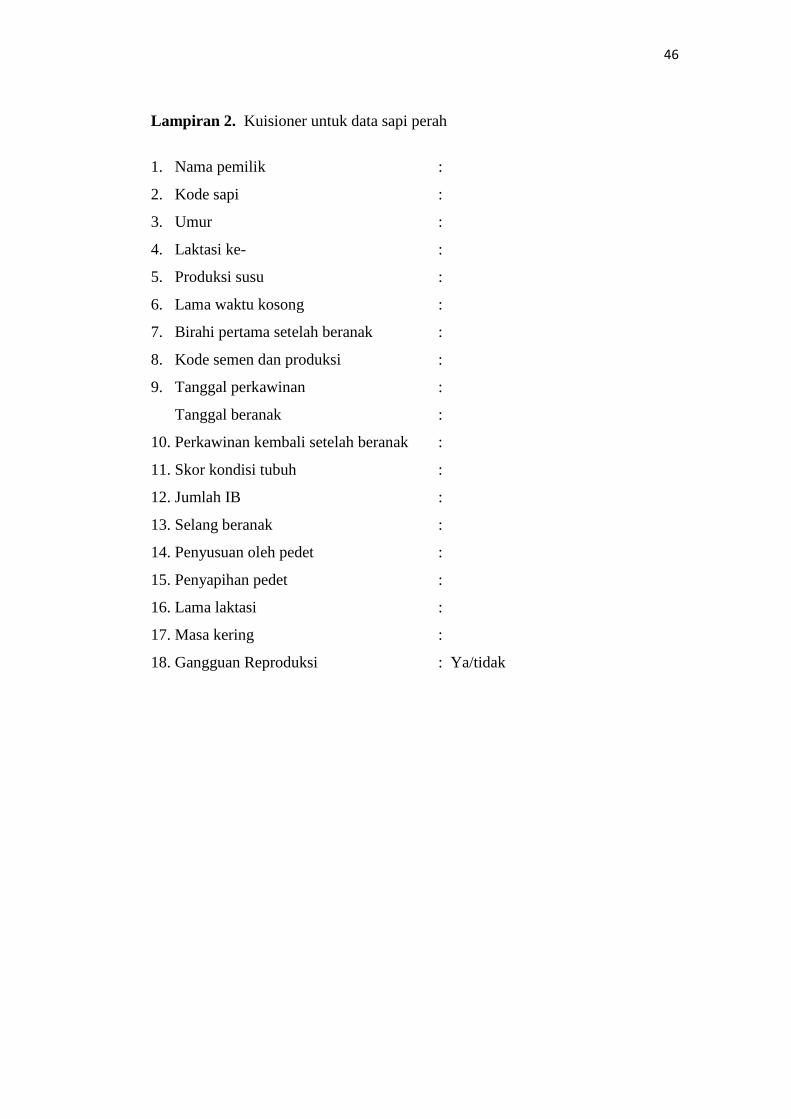
Lampiran 2. Kuisioner untuk data sapi perah
1. Nama pemilik :
2. Kode sapi :
3. Umur :
4. Laktasi ke- :
5. Produksi susu :
6. Lama waktu kosong :
7. Birahi pertama setelah beranak :
8. Kode semen dan produksi :
9. Tanggal perkawinan :
Tanggal beranak :
10. Perkawinan kembali setelah beranak :
11. Skor kondisi tubuh :
12. Jumlah IB :
13. Selang beranak :
14. Penyusuan oleh pedet :
15. Penyapihan pedet :
16. Lama laktasi :
17. Masa kering :
18. Gangguan Reproduksi : Ya/tidak
47
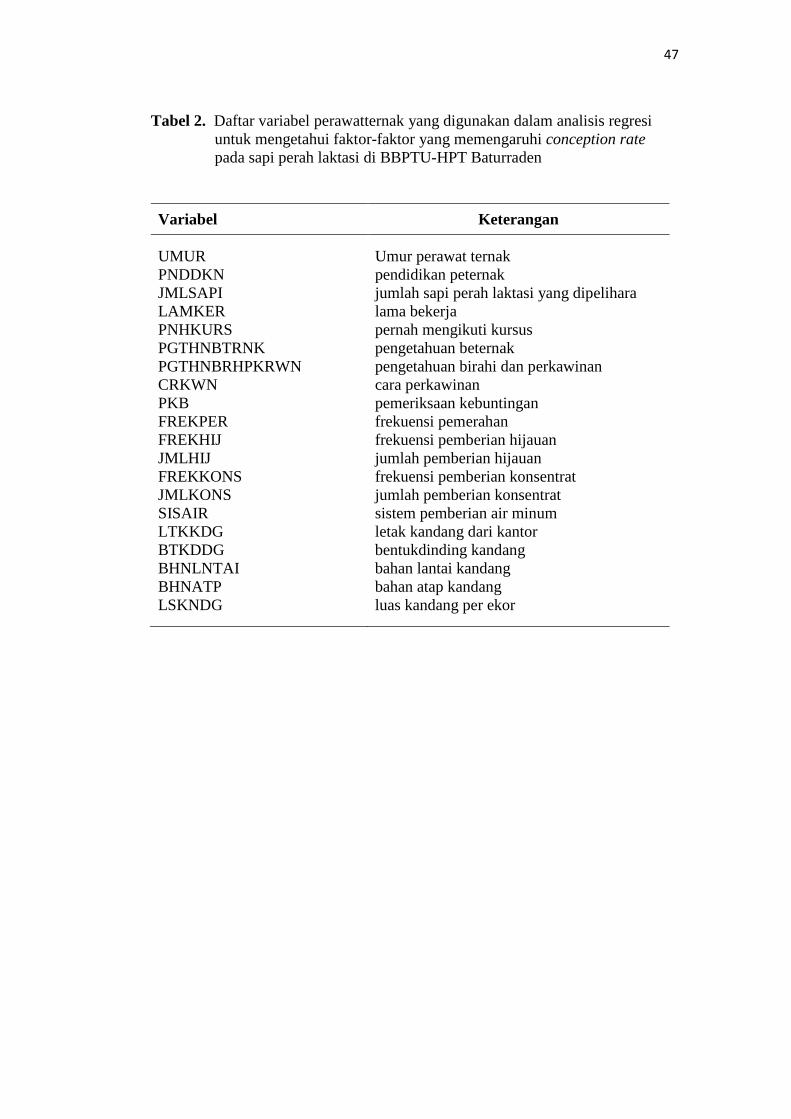
Tabel 2. Daftar variabel perawatternak yang digunakan dalam analisis regresi
untuk mengetahui faktor-faktor yang memengaruhi conception rate
pada sapi perah laktasi di BBPTU-HPT Baturraden
Variabel Keterangan
UMUR
PNDDKN
JMLSAPI
LAMKER
PNHKURS
PGTHNBTRNK
PGTHNBRHPKRWN
CRKWN
PKB
FREKPER
FREKHIJ
JMLHIJ
FREKKONS
JMLKONS
SISAIR
LTKKDG
BTKDDG
BHNLNTAI
BHNATP
LSKNDG
Umur perawat ternak
pendidikan peternak
jumlah sapi perah laktasi yang dipelihara
lama bekerja
pernah mengikuti kursus
pengetahuan beternak
pengetahuan birahi dan perkawinan
cara perkawinan
pemeriksaan kebuntingan
frekuensi pemerahan
frekuensi pemberian hijauan
jumlah pemberian hijauan
frekuensi pemberian konsentrat
jumlah pemberian konsentrat
sistem pemberian air minum
letak kandang dari kantor
bentukdinding kandang
bahan lantai kandang
bahan atap kandang
luas kandang per ekor
48
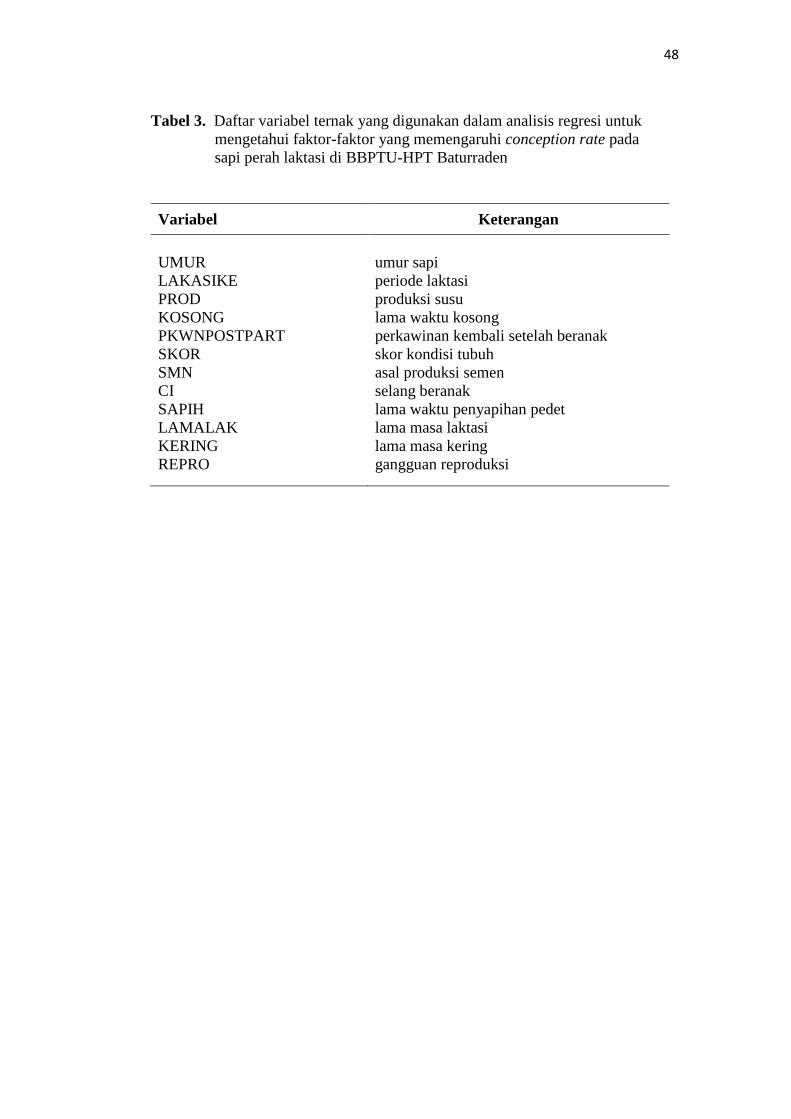
Tabel 3. Daftar variabel ternak yang digunakan dalam analisis regresi untuk
mengetahui faktor-faktor yang memengaruhi conception rate pada
sapi perah laktasi di BBPTU-HPT Baturraden
Variabel Keterangan
UMUR
LAKASIKE
PROD
KOSONG
PKWNPOSTPART
SKOR
SMN
CI
SAPIH
LAMALAK
KERING
REPRO
umur sapi
periode laktasi
produksi susu
lama waktu kosong
perkawinan kembali setelah beranak
skor kondisi tubuh
asal produksi semen
selang beranak
lama waktu penyapihan pedet
lama masa laktasi
lama masa kering
gangguan reproduksi
49
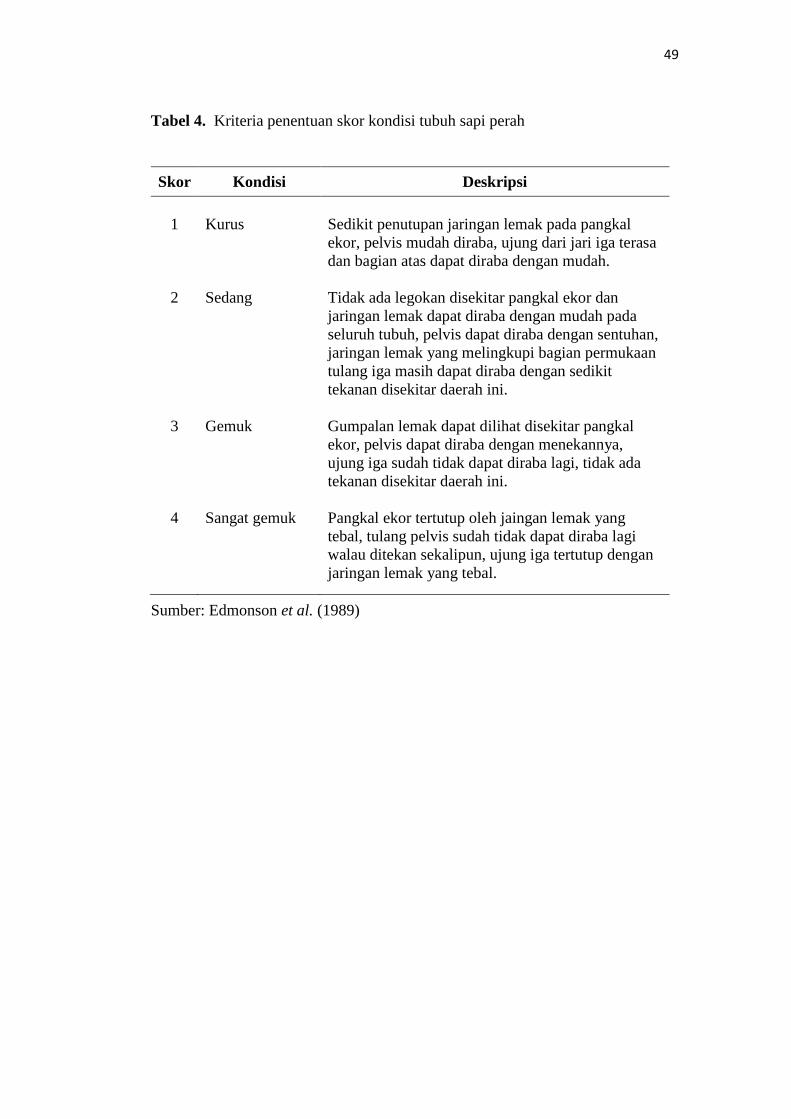
Tabel 4. Kriteria penentuan skor kondisi tubuh sapi perah
Skor Kondisi Deskripsi
1
2
3
4
Kurus
Sedang
Gemuk
Sangat gemuk
Sedikit penutupan jaringan lemak pada pangkal
ekor, pelvis mudah diraba, ujung dari jari iga terasa
dan bagian atas dapat diraba dengan mudah.
Tidak ada legokan disekitar pangkal ekor dan
jaringan lemak dapat diraba dengan mudah pada
seluruh tubuh, pelvis dapat diraba dengan sentuhan,
jaringan lemak yang melingkupi bagian permukaan
tulang iga masih dapat diraba dengan sedikit
tekanan disekitar daerah ini.
Gumpalan lemak dapat dilihat disekitar pangkal
ekor, pelvis dapat diraba dengan menekannya,
ujung iga sudah tidak dapat diraba lagi, tidak ada
tekanan disekitar daerah ini.
Pangkal ekor tertutup oleh jaingan lemak yang
tebal, tulang pelvis sudah tidak dapat diraba lagi
walau ditekan sekalipun, ujung iga tertutup dengan
jaringan lemak yang tebal.
Sumber: Edmonson et al. (1989)
50
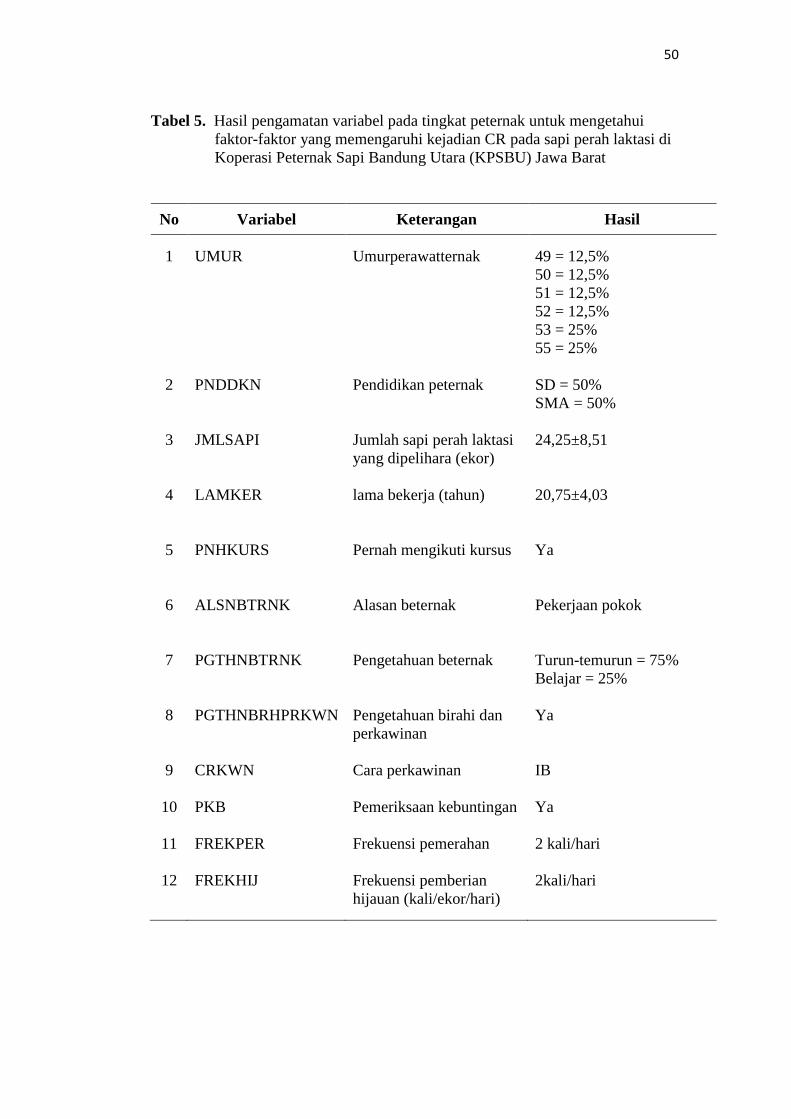
Tabel 5. Hasil pengamatan variabel pada tingkat peternak untuk mengetahui
faktor-faktor yang memengaruhi kejadian CR pada sapi perah laktasi di
Koperasi Peternak Sapi Bandung Utara (KPSBU) Jawa Barat
No Variabel Keterangan Hasil
1
2
3
4
5
6
7
8
9
10
11
12
UMUR
PNDDKN
JMLSAPI
LAMKER
PNHKURS
ALSNBTRNK
PGTHNBTRNK
PGTHNBRHPRKWN
CRKWN
PKB
FREKPER
FREKHIJ
Umurperawatternak
Pendidikan peternak
Jumlah sapi perah laktasi
yang dipelihara (ekor)
lama bekerja (tahun)
Pernah mengikuti kursus
Alasan beternak
Pengetahuan beternak
Pengetahuan birahi dan
perkawinan
Cara perkawinan
Pemeriksaan kebuntingan
Frekuensi pemerahan
Frekuensi pemberian
hijauan (kali/ekor/hari)
49 = 12,5%
50 = 12,5%
51 = 12,5%
52 = 12,5%
53 = 25%
55 = 25%
SD = 50%
SMA = 50%
24,25±8,51
20,75±4,03
Ya
Pekerjaan pokok
Turun-temurun = 75%
Belajar = 25%
Ya
IB
Ya
2 kali/hari
2kali/hari
51
13
14
15
16
17
18
19
20
21
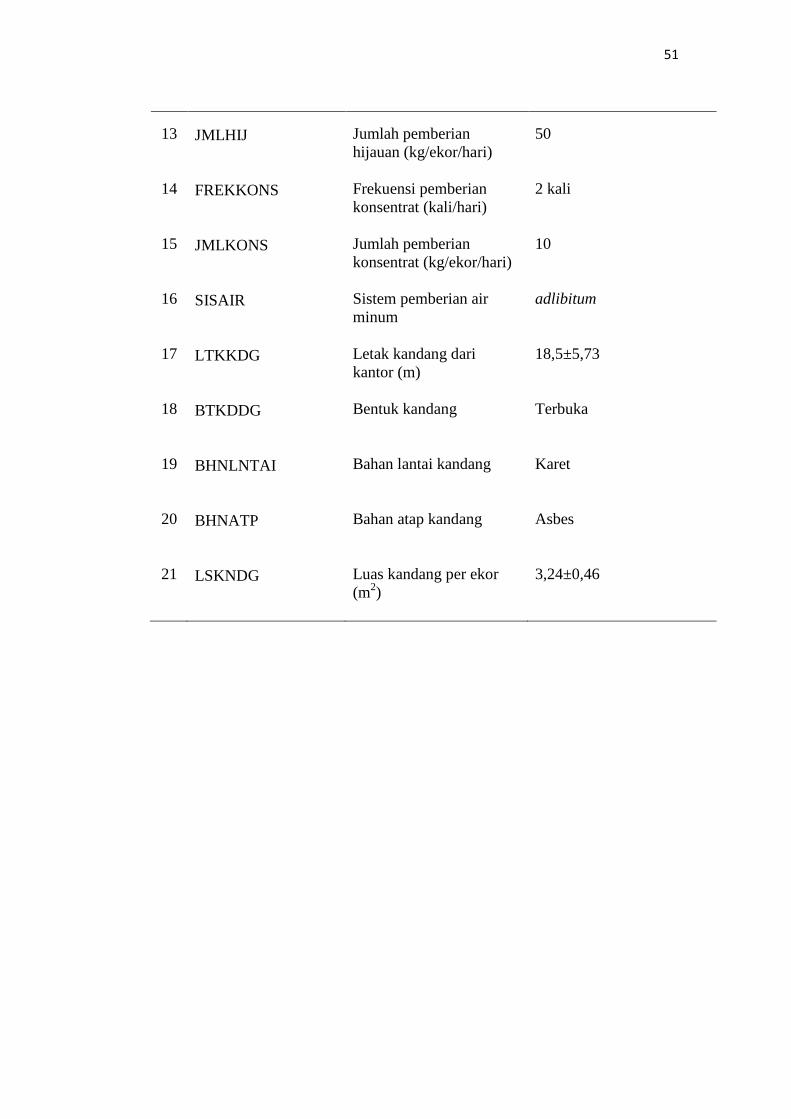
JMLHIJ
FREKKONS
JMLKONS
SISAIR
LTKKDG
BTKDDG
BHNLNTAI
BHNATP
LSKNDG
Jumlah pemberian
hijauan (kg/ekor/hari)
Frekuensi pemberian
konsentrat (kali/hari)
Jumlah pemberian
konsentrat (kg/ekor/hari)
Sistem pemberian air
minum
Letak kandang dari
kantor (m)
Bentuk kandang
Bahan lantai kandang
Bahan atap kandang
Luas kandang per ekor
(m2)
50
2 kali
10
adlibitum
18,5±5,73
Terbuka
Karet
Asbes
3,24±0,46
52
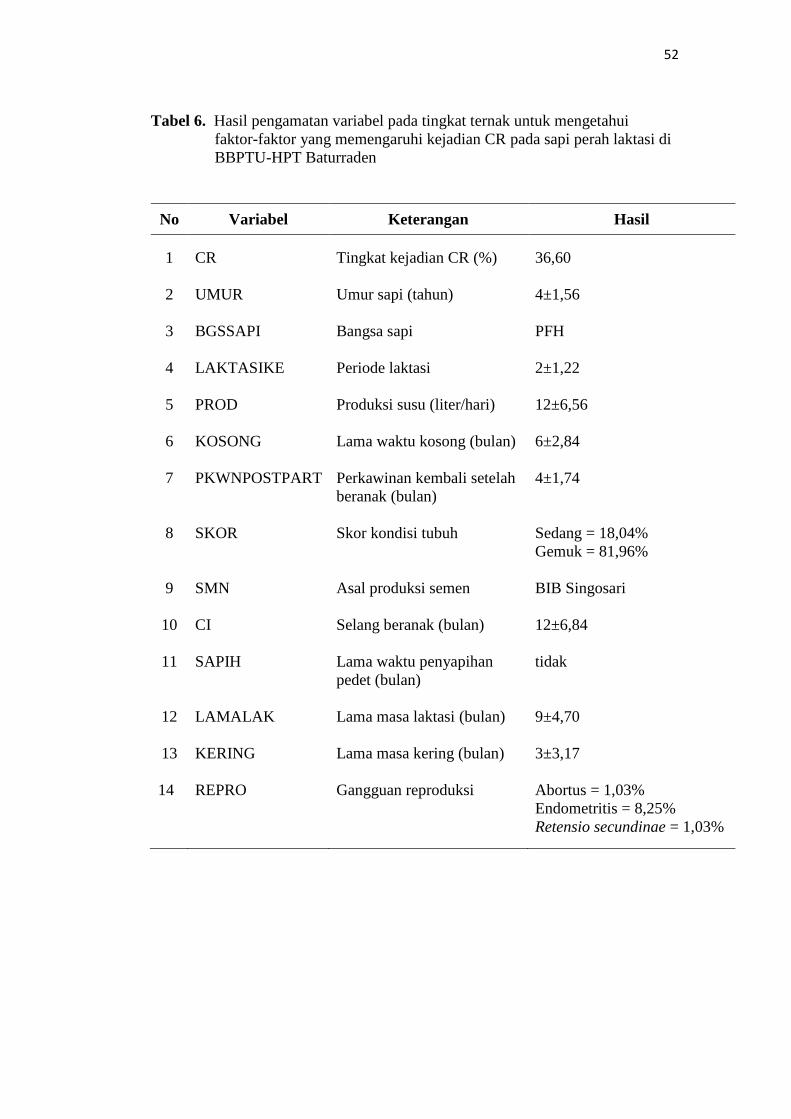
Tabel 6. Hasil pengamatan variabel pada tingkat ternak untuk mengetahui
faktor-faktor yang memengaruhi kejadian CR pada sapi perah laktasi di
BBPTU-HPT Baturraden
No Variabel Keterangan Hasil
1
2
3
4
5
6
7
8
9
10
11
12
13
14
CR
UMUR
BGSSAPI
LAKTASIKE
PROD
KOSONG
PKWNPOSTPART
SKOR
SMN
CI
SAPIH
LAMALAK
KERING
REPRO
Tingkat kejadian CR (%)
Umur sapi (tahun)
Bangsa sapi
Periode laktasi
Produksi susu (liter/hari)
Lama waktu kosong (bulan)
Perkawinan kembali setelah
beranak (bulan)
Skor kondisi tubuh
Asal produksi semen
Selang beranak (bulan)
Lama waktu penyapihan
pedet (bulan)
Lama masa laktasi (bulan)
Lama masa kering (bulan)
Gangguan reproduksi
36,60
4±1,56
PFH
2±1,22
12±6,56
6±2,84
4±1,74
Sedang = 18,04%
Gemuk = 81,96%
BIB Singosari
12±6,84
tidak
9±4,70
3±3,17
Abortus = 1,03%
Endometritis = 8,25%
Retensio secundinae = 1,03%
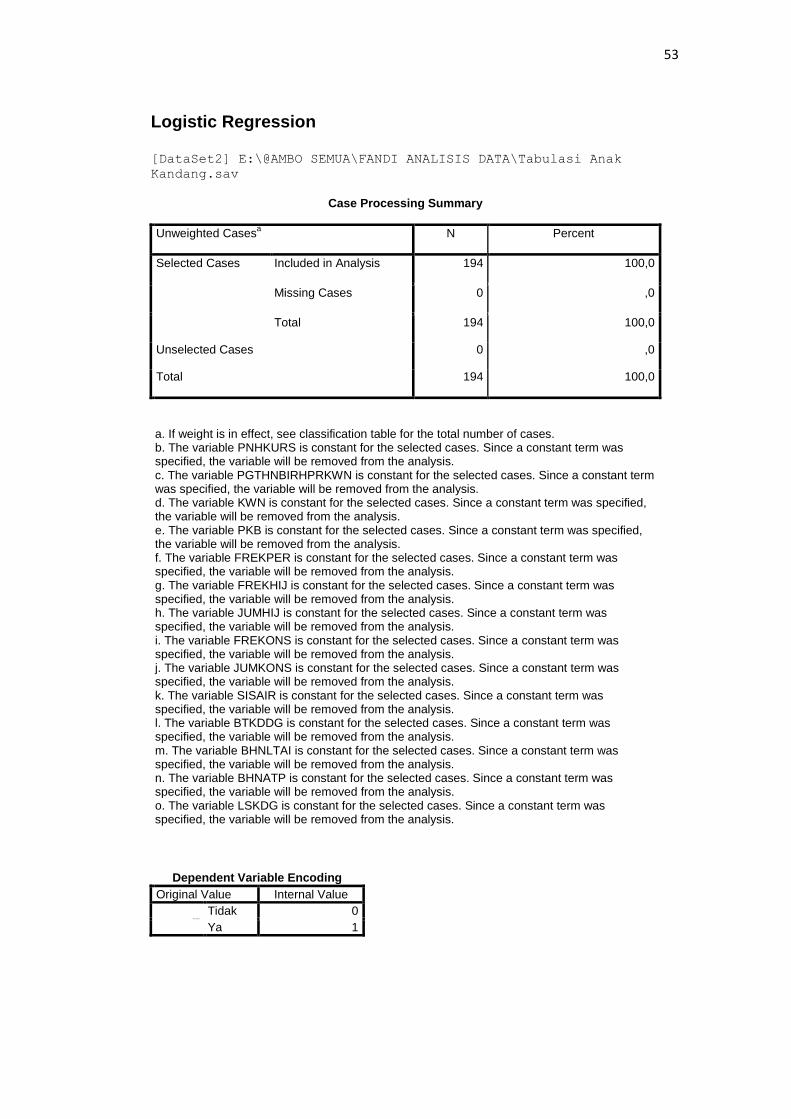
53
Logistic Regression [DataSet2] E:\@AMBO SEMUA\FANDI ANALISIS DATA\Tabulasi Anak
Kandang.sav
Case Processing Summary
Unweighted Casesa N Percent
Selected Cases Included in Analysis 194 100,0
Missing Cases 0 ,0
Total 194 100,0
Unselected Cases 0 ,0
Total 194 100,0
a. If weight is in effect, see classification table for the total number of cases. b. The variable PNHKURS is constant for the selected cases. Since a constant term was specified, the variable will be removed from the analysis. c. The variable PGTHNBIRHPRKWN is constant for the selected cases. Since a constant term was specified, the variable will be removed from the analysis. d. The variable KWN is constant for the selected cases. Since a constant term was specified, the variable will be removed from the analysis. e. The variable PKB is constant for the selected cases. Since a constant term was specified, the variable will be removed from the analysis. f. The variable FREKPER is constant for the selected cases. Since a constant term was specified, the variable will be removed from the analysis. g. The variable FREKHIJ is constant for the selected cases. Since a constant term was specified, the variable will be removed from the analysis. h. The variable JUMHIJ is constant for the selected cases. Since a constant term was specified, the variable will be removed from the analysis. i. The variable FREKONS is constant for the selected cases. Since a constant term was specified, the variable will be removed from the analysis. j. The variable JUMKONS is constant for the selected cases. Since a constant term was specified, the variable will be removed from the analysis. k. The variable SISAIR is constant for the selected cases. Since a constant term was specified, the variable will be removed from the analysis. l. The variable BTKDDG is constant for the selected cases. Since a constant term was specified, the variable will be removed from the analysis. m. The variable BHNLTAI is constant for the selected cases. Since a constant term was specified, the variable will be removed from the analysis. n. The variable BHNATP is constant for the selected cases. Since a constant term was specified, the variable will be removed from the analysis. o. The variable LSKDG is constant for the selected cases. Since a constant term was specified, the variable will be removed from the analysis.
Dependent Variable Encoding
Original Value Internal Value
dimension0
Tidak 0
Ya 1

54
Block 0: Beginning Block
Classification Tablea,b
Observed Predicted
CR Percentage
Correct Tidak Ya
Step 0 CR Tidak 123 0 100,0
Ya 71 0 ,0
Overall Percentage 63,4
a. Constant is included in the model. b. The cut value is ,500
Variables in the Equation
B S.E. Wald df Sig. Exp(B)
Step 0 Constant -,550 ,149 13,593 1 ,000 ,577
Variables not in the Equation
Score df Sig.
Step 0 Variables UMUR 5,363 1 ,021
PNDDKN ,562 1 ,454
JMLSAPI 8,639 1 ,003
LMKRJ 7,003 1 ,008
PGTHNBTRNK 3,512 1 ,061
THAWING 3,033 1 ,082
LTKKDG 10,680 1 ,001
Overall Statistics 28,491 7 ,000
55
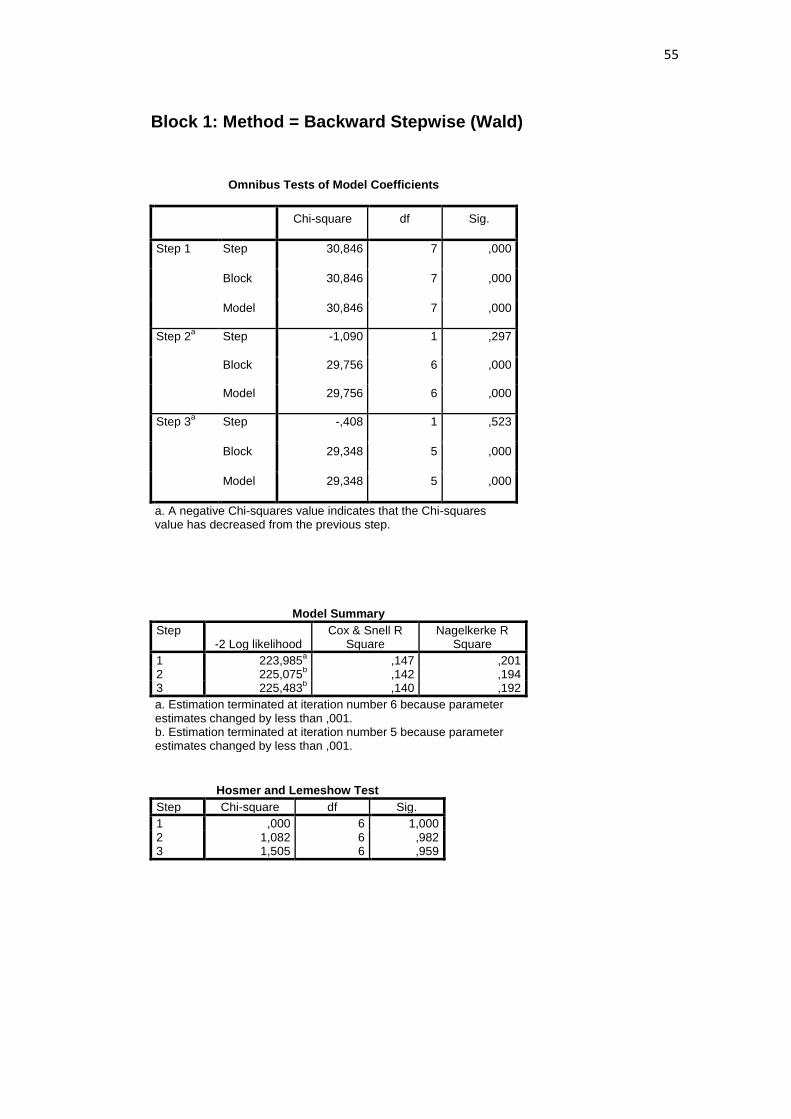
Block 1: Method = Backward Stepwise (Wald)
Omnibus Tests of Model Coefficients
Chi-square df Sig.
Step 1 Step 30,846 7 ,000
Block 30,846 7 ,000
Model 30,846 7 ,000
Step 2a Step -1,090 1 ,297
Block 29,756 6 ,000
Model 29,756 6 ,000
Step 3a Step -,408 1 ,523
Block 29,348 5 ,000
Model 29,348 5 ,000
a. A negative Chi-squares value indicates that the Chi-squares value has decreased from the previous step.
Model Summary
Step -2 Log likelihood
Cox & Snell R Square
Nagelkerke R Square
1 223,985a ,147 ,201
2 225,075b ,142 ,194
3 225,483b ,140 ,192
a. Estimation terminated at iteration number 6 because parameter estimates changed by less than ,001. b. Estimation terminated at iteration number 5 because parameter estimates changed by less than ,001.
Hosmer and Lemeshow Test
Step Chi-square df Sig.
1 ,000 6 1,000 2 1,082 6 ,982 3 1,505 6 ,959
56
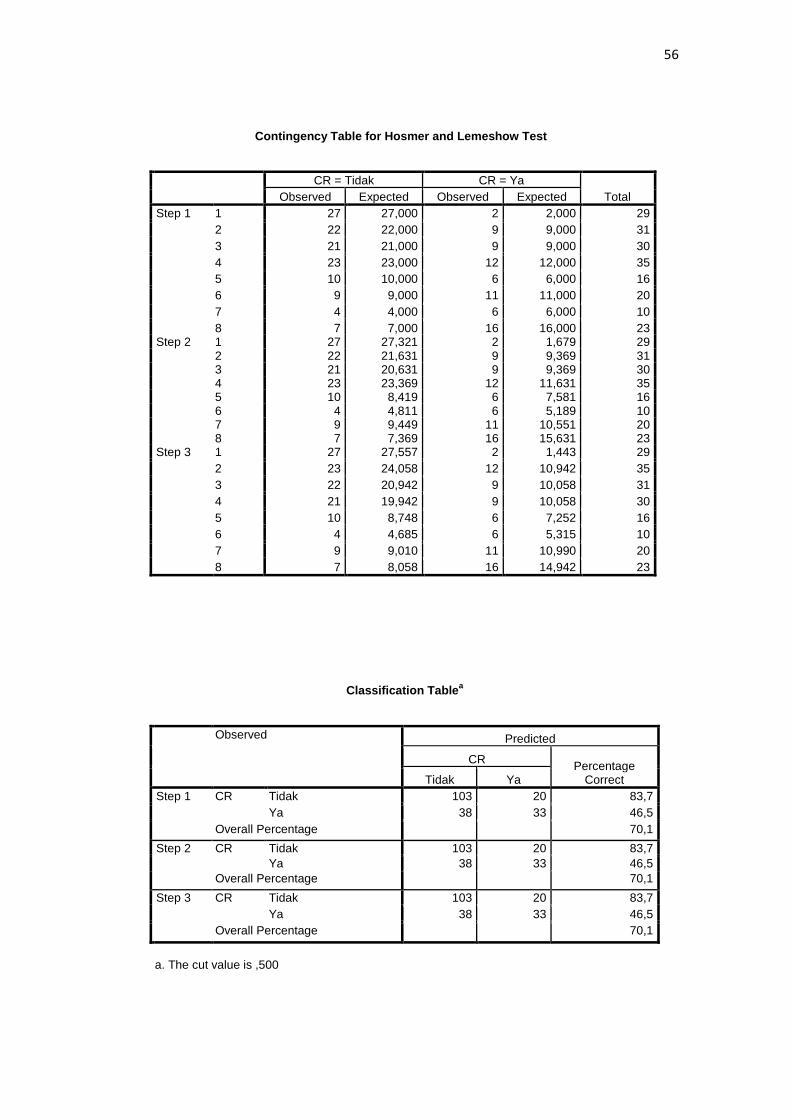
Contingency Table for Hosmer and Lemeshow Test
CR = Tidak CR = Ya
Total Observed Expected Observed Expected
Step 1 1 27 27,000 2 2,000 29
2 22 22,000 9 9,000 31
3 21 21,000 9 9,000 30
4 23 23,000 12 12,000 35
5 10 10,000 6 6,000 16
6 9 9,000 11 11,000 20
7 4 4,000 6 6,000 10
8 7 7,000 16 16,000 23 Step 2 1 27 27,321 2 1,679 29
2 22 21,631 9 9,369 31 3 21 20,631 9 9,369 30 4 23 23,369 12 11,631 35 5 10 8,419 6 7,581 16 6 4 4,811 6 5,189 10 7 9 9,449 11 10,551 20 8 7 7,369 16 15,631 23
Step 3 1 27 27,557 2 1,443 29
2 23 24,058 12 10,942 35
3 22 20,942 9 10,058 31
4 21 19,942 9 10,058 30
5 10 8,748 6 7,252 16
6 4 4,685 6 5,315 10
7 9 9,010 11 10,990 20
8 7 8,058 16 14,942 23
Classification Tablea
Observed Predicted
CR Percentage
Correct Tidak Ya
Step 1 CR Tidak 103 20 83,7
Ya 38 33 46,5
Overall Percentage 70,1
Step 2 CR Tidak 103 20 83,7
Ya 38 33 46,5
Overall Percentage 70,1
Step 3 CR Tidak 103 20 83,7
Ya 38 33 46,5
Overall Percentage 70,1
a. The cut value is ,500
57
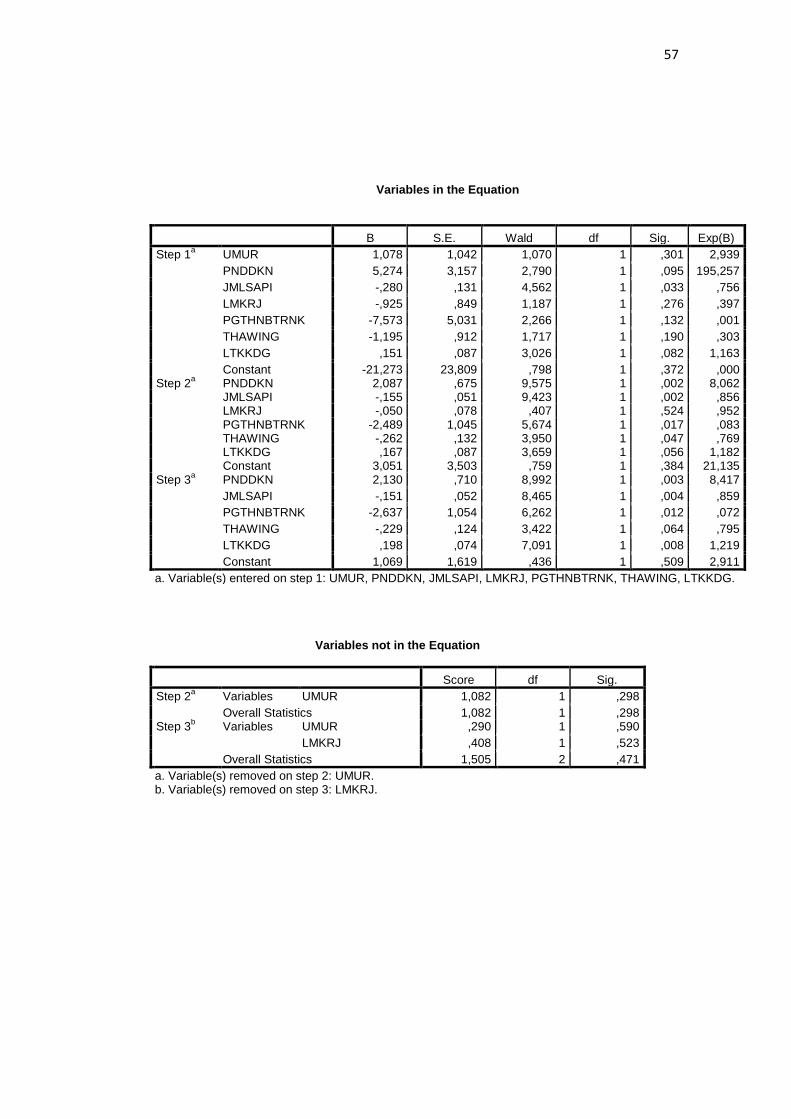
Variables in the Equation
B S.E. Wald df Sig. Exp(B)
Step 1a UMUR 1,078 1,042 1,070 1 ,301 2,939
PNDDKN 5,274 3,157 2,790 1 ,095 195,257
JMLSAPI -,280 ,131 4,562 1 ,033 ,756
LMKRJ -,925 ,849 1,187 1 ,276 ,397
PGTHNBTRNK -7,573 5,031 2,266 1 ,132 ,001
THAWING -1,195 ,912 1,717 1 ,190 ,303
LTKKDG ,151 ,087 3,026 1 ,082 1,163
Constant -21,273 23,809 ,798 1 ,372 ,000 Step 2
a PNDDKN 2,087 ,675 9,575 1 ,002 8,062
JMLSAPI -,155 ,051 9,423 1 ,002 ,856 LMKRJ -,050 ,078 ,407 1 ,524 ,952 PGTHNBTRNK -2,489 1,045 5,674 1 ,017 ,083 THAWING -,262 ,132 3,950 1 ,047 ,769 LTKKDG ,167 ,087 3,659 1 ,056 1,182 Constant 3,051 3,503 ,759 1 ,384 21,135
Step 3a PNDDKN 2,130 ,710 8,992 1 ,003 8,417
JMLSAPI -,151 ,052 8,465 1 ,004 ,859
PGTHNBTRNK -2,637 1,054 6,262 1 ,012 ,072
THAWING -,229 ,124 3,422 1 ,064 ,795
LTKKDG ,198 ,074 7,091 1 ,008 1,219
Constant 1,069 1,619 ,436 1 ,509 2,911
a. Variable(s) entered on step 1: UMUR, PNDDKN, JMLSAPI, LMKRJ, PGTHNBTRNK, THAWING, LTKKDG.
Variables not in the Equation
Score df Sig.
Step 2a Variables UMUR 1,082 1 ,298
Overall Statistics 1,082 1 ,298 Step 3
b Variables UMUR ,290 1 ,590
LMKRJ ,408 1 ,523
Overall Statistics 1,505 2 ,471
a. Variable(s) removed on step 2: UMUR. b. Variable(s) removed on step 3: LMKRJ.
58
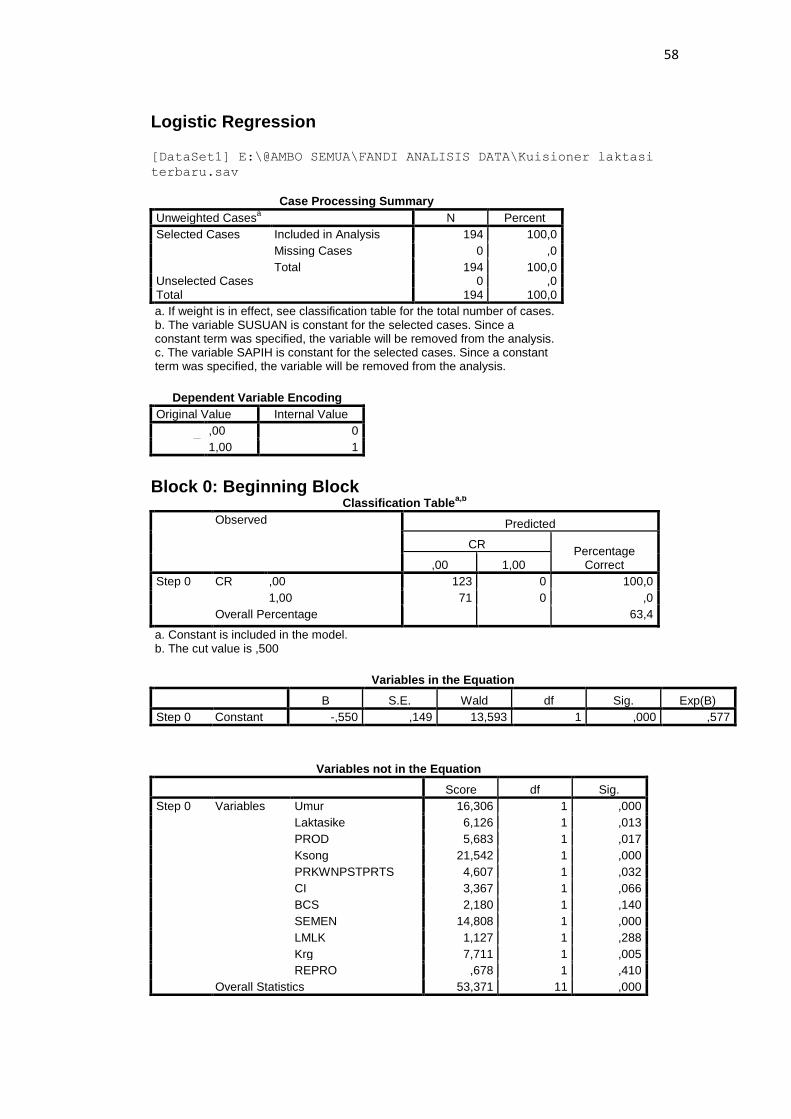
Logistic Regression [DataSet1] E:\@AMBO SEMUA\FANDI ANALISIS DATA\Kuisioner laktasi
terbaru.sav
Case Processing Summary
Unweighted Casesa N Percent
Selected Cases Included in Analysis 194 100,0
Missing Cases 0 ,0
Total 194 100,0 Unselected Cases 0 ,0 Total 194 100,0
a. If weight is in effect, see classification table for the total number of cases. b. The variable SUSUAN is constant for the selected cases. Since a constant term was specified, the variable will be removed from the analysis. c. The variable SAPIH is constant for the selected cases. Since a constant term was specified, the variable will be removed from the analysis.
Dependent Variable Encoding
Original Value Internal Value
dimension0
,00 0
1,00 1
Block 0: Beginning Block
Classification Tablea,b
Observed Predicted
CR Percentage
Correct ,00 1,00
Step 0 CR ,00 123 0 100,0
1,00 71 0 ,0
Overall Percentage 63,4
a. Constant is included in the model. b. The cut value is ,500
Variables in the Equation
B S.E. Wald df Sig. Exp(B)
Step 0 Constant -,550 ,149 13,593 1 ,000 ,577
Variables not in the Equation
Score df Sig.
Step 0 Variables Umur 16,306 1 ,000
Laktasike 6,126 1 ,013
PROD 5,683 1 ,017
Ksong 21,542 1 ,000
PRKWNPSTPRTS 4,607 1 ,032
CI 3,367 1 ,066
BCS 2,180 1 ,140
SEMEN 14,808 1 ,000
LMLK 1,127 1 ,288
Krg 7,711 1 ,005
REPRO ,678 1 ,410
Overall Statistics 53,371 11 ,000

59
Block 1: Method = Backward Stepwise (Wald)
Omnibus Tests of Model Coefficients
Chi-square df Sig.
Step 1 Step 73,156 11 ,000
Block 73,156 11 ,000
Model 73,156 11 ,000
Step 2a Step -,097 1 ,756
Block 73,060 10 ,000
Model 73,060 10 ,000
Step 3a Step -,623 1 ,430
Block 72,437 9 ,000
Model 72,437 9 ,000
Step 4a Step -,611 1 ,434
Block 71,826 8 ,000
Model 71,826 8 ,000
Step 5a Step -1,082 1 ,298
Block 70,744 7 ,000
Model 70,744 7 ,000
a. A negative Chi-squares value indicates that the Chi-squares value has decreased from the previous step.
Model Summary
Step -2 Log likelihood
Cox & Snell R Square
Nagelkerke R Square
1 181,675a ,314 ,430
2 181,772a ,314 ,429
3 182,394a ,312 ,426
4 183,005a ,309 ,423
5 184,087a ,306 ,418
a. Estimation terminated at iteration number 6 because parameter estimates changed by less than ,001.
Hosmer and Lemeshow Test
Step Chi-square df Sig.
1 3,857 8 ,870 2 3,081 8 ,929 3 4,196 8 ,839 4 3,361 8 ,910 5 12,862 8 ,117
Contingency Table for Hosmer and Lemeshow Test
CR = ,00 CR = 1,00
Total Observed Expected Observed Expected
Step 1 1 19 18,955 0 ,045 19
2 18 18,534 1 ,466 19
3 17 17,572 2 1,428 19
4 16 15,100 3 3,900 19
5 14 13,054 5 5,946 19
6 11 11,137 8 7,863 19
7 12 9,868 7 9,132 19
8 7 7,818 12 11,182 19
9 4 6,352 15 12,648 19
10 5 4,610 18 18,390 23

60
Step 2 1 19 18,955 0 ,045 19 2 18 18,541 1 ,459 19 3 17 17,586 2 1,414 19 4 16 15,085 3 3,915 19 5 14 12,988 5 6,012 19 6 11 11,101 8 7,899 19 7 12 9,929 7 9,071 19 8 7 7,817 12 11,183 19 9 5 6,365 14 12,635 19 10 4 4,632 19 18,368 23
Step 3 1 19 18,957 0 ,043 19 2 18 18,549 1 ,451 19 3 17 17,594 2 1,406 19 4 15 15,016 4 3,984 19 5 15 12,946 4 6,054 19 6 11 11,147 8 7,853 19 7 12 9,918 7 9,082 19 8 7 7,718 12 11,282 19 9 4 6,183 15 12,817 19 10 5 4,973 18 18,027 23
Step 4 1 19 18,965 0 ,035 19 2 18 18,558 1 ,442 19 3 17 17,618 2 1,382 19 4 15 14,957 4 4,043 19 5 14 12,897 5 6,103 19 6 13 11,072 6 7,928 19 7 10 9,733 9 9,267 19 8 8 7,700 11 11,300 19 9 6 6,367 13 12,633 19 10 3 5,135 20 17,865 23
Step 5 1 19 18,963 0 ,037 19
2 18 19,446 2 ,554 20
3 18 17,458 1 1,542 19
4 13 14,824 6 4,176 19
5 16 12,909 3 6,091 19
6 12 10,853 7 8,147 19
7 11 9,710 8 9,290 19
8 9 7,487 10 11,513 19
9 2 6,228 17 12,772 19
10 5 5,123 17 16,877 22
Classification Table
a
Observed Predicted
CR Percentage
Correct ,00 1,00
Step 1 CR ,00 104 19 84,6
1,00 24 47 66,2
Overall Percentage 77,8
Step 2 CR ,00 105 18 85,4
1,00 26 45 63,4
Overall Percentage 77,3
Step 3 CR ,00 105 18 85,4
1,00 26 45 63,4
Overall Percentage 77,3
Step 4 CR ,00 104 19 84,6
1,00 25 46 64,8
Overall Percentage 77,3
Step 5 CR ,00 102 21 82,9
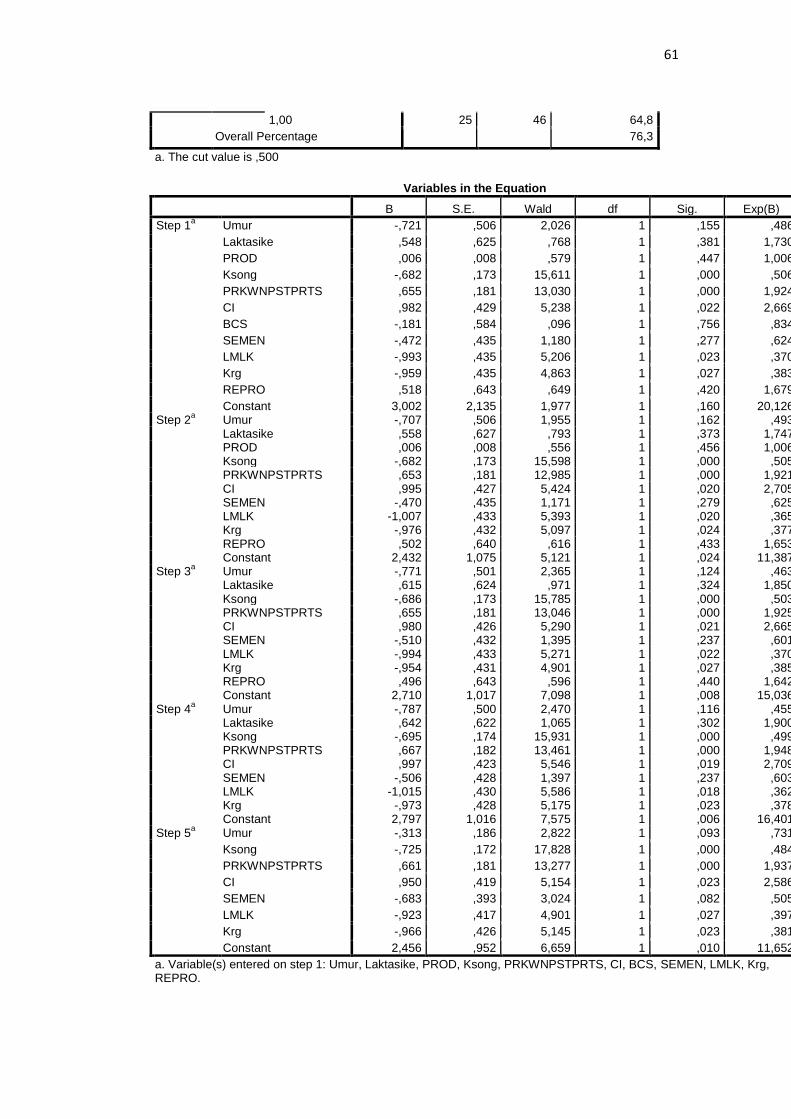
61
1,00 25 46 64,8
Overall Percentage 76,3
a. The cut value is ,500
Variables in the Equation
B S.E. Wald df Sig. Exp(B)
Step 1a Umur -,721 ,506 2,026 1 ,155 ,486
Laktasike ,548 ,625 ,768 1 ,381 1,730
PROD ,006 ,008 ,579 1 ,447 1,006
Ksong -,682 ,173 15,611 1 ,000 ,506
PRKWNPSTPRTS ,655 ,181 13,030 1 ,000 1,924
CI ,982 ,429 5,238 1 ,022 2,669
BCS -,181 ,584 ,096 1 ,756 ,834
SEMEN -,472 ,435 1,180 1 ,277 ,624
LMLK -,993 ,435 5,206 1 ,023 ,370
Krg -,959 ,435 4,863 1 ,027 ,383
REPRO ,518 ,643 ,649 1 ,420 1,679
Constant 3,002 2,135 1,977 1 ,160 20,126 Step 2
a Umur -,707 ,506 1,955 1 ,162 ,493
Laktasike ,558 ,627 ,793 1 ,373 1,747 PROD ,006 ,008 ,556 1 ,456 1,006 Ksong -,682 ,173 15,598 1 ,000 ,505 PRKWNPSTPRTS ,653 ,181 12,985 1 ,000 1,921 CI ,995 ,427 5,424 1 ,020 2,705 SEMEN -,470 ,435 1,171 1 ,279 ,625 LMLK -1,007 ,433 5,393 1 ,020 ,365 Krg -,976 ,432 5,097 1 ,024 ,377 REPRO ,502 ,640 ,616 1 ,433 1,653 Constant 2,432 1,075 5,121 1 ,024 11,387
Step 3a Umur -,771 ,501 2,365 1 ,124 ,463
Laktasike ,615 ,624 ,971 1 ,324 1,850 Ksong -,686 ,173 15,785 1 ,000 ,503 PRKWNPSTPRTS ,655 ,181 13,046 1 ,000 1,925 CI ,980 ,426 5,290 1 ,021 2,665 SEMEN -,510 ,432 1,395 1 ,237 ,601 LMLK -,994 ,433 5,271 1 ,022 ,370 Krg -,954 ,431 4,901 1 ,027 ,385 REPRO ,496 ,643 ,596 1 ,440 1,642 Constant 2,710 1,017 7,098 1 ,008 15,036
Step 4a Umur -,787 ,500 2,470 1 ,116 ,455
Laktasike ,642 ,622 1,065 1 ,302 1,900 Ksong -,695 ,174 15,931 1 ,000 ,499 PRKWNPSTPRTS ,667 ,182 13,461 1 ,000 1,948 CI ,997 ,423 5,546 1 ,019 2,709 SEMEN -,506 ,428 1,397 1 ,237 ,603 LMLK -1,015 ,430 5,586 1 ,018 ,362 Krg -,973 ,428 5,175 1 ,023 ,378 Constant 2,797 1,016 7,575 1 ,006 16,401
Step 5a Umur -,313 ,186 2,822 1 ,093 ,731
Ksong -,725 ,172 17,828 1 ,000 ,484
PRKWNPSTPRTS ,661 ,181 13,277 1 ,000 1,937
CI ,950 ,419 5,154 1 ,023 2,586
SEMEN -,683 ,393 3,024 1 ,082 ,505
LMLK -,923 ,417 4,901 1 ,027 ,397
Krg -,966 ,426 5,145 1 ,023 ,381
Constant 2,456 ,952 6,659 1 ,010 11,652
a. Variable(s) entered on step 1: Umur, Laktasike, PROD, Ksong, PRKWNPSTPRTS, CI, BCS, SEMEN, LMLK, Krg, REPRO.
62
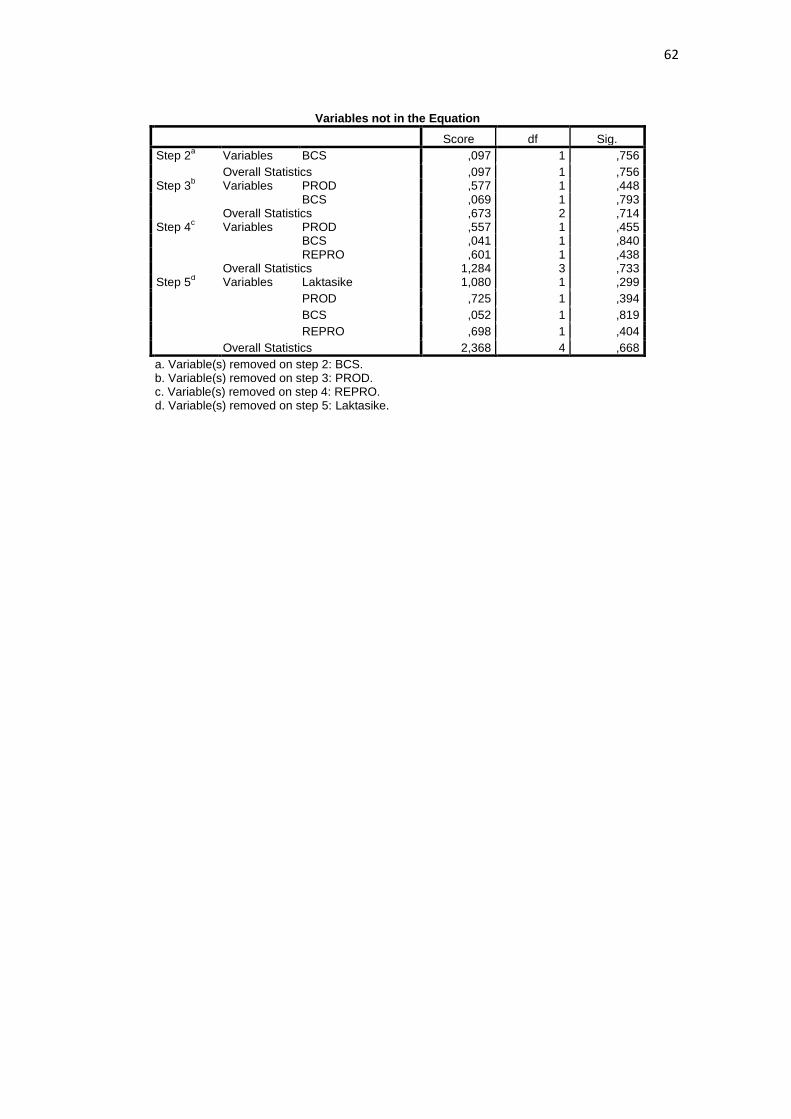
Variables not in the Equation
Score df Sig.
Step 2a Variables BCS ,097 1 ,756
Overall Statistics ,097 1 ,756 Step 3
b Variables PROD ,577 1 ,448
BCS ,069 1 ,793 Overall Statistics ,673 2 ,714
Step 4c Variables PROD ,557 1 ,455
BCS ,041 1 ,840 REPRO ,601 1 ,438
Overall Statistics 1,284 3 ,733 Step 5
d Variables Laktasike 1,080 1 ,299
PROD ,725 1 ,394
BCS ,052 1 ,819
REPRO ,698 1 ,404
Overall Statistics 2,368 4 ,668
a. Variable(s) removed on step 2: BCS. b. Variable(s) removed on step 3: PROD. c. Variable(s) removed on step 4: REPRO. d. Variable(s) removed on step 5: Laktasike.