Embed Size (px)
Citation preview

23
Lanaspa, L.F. and Sanz, F., ‘Krugman's Core-Periphery Model with Heterogeneous Quality of Land’, Urban Studies, Vol. 36, No. 3, 1999, pp. 499-507.
Lanaspa, L. F. and Sanz, F., ‘Multiple Equilibria, Stability, and Asymmetries in Krugman's Core-Periphery Model’, Papers in Regional Science, Vol. 80, No. 4, 2001, pp. 425-38.
Lee, P. and Townsend, P., “A Study of Inequality, Low Incomes and Unemployment in London, 1985-92”, International Labour Review, Vol. 133, No. 5-6, 1994, pp. 579-95.
Lucas, R.E.B., “The Effects of Proximity and Transportation on Developing Country Population Migrations”, Journal of Economic Geography, Vol. 1, No. 3, 2001, pp. 323-39.
Matsuyama, K., “Endogenous Inequality”, Review of Economic Studies, Vol. 67, 2000, pp. 743-59.
Michel, R.C., “Economic Growth and Income Equality since the 1982 Recession”, Journal of Policy Analysis and Management, Vol. 10, No. 2, 1991, pp. 181-203.
Morley, S.A., “Mudancas no Emprego e na Distribucao da Renda Durante o Milagre Brazileiro”, Pesquisa e Planejamento Economico, Vol. 8, No. 2, 1978, pp. 331-66.
Myrdal, G., “Asian Drama, an Inquiry into the Poverty of Nations”, vol. II, chapter 24: “The Industrialization Issue”, 1968, pp. 1149-1205, Pantheon, New-York.
Rondinelli, D.A. and Ruddle, K., “Urbanization and Rural Development, a Spatial Policy for Equitable Growth”, Praeger, New York, 1978.
Rosenstein-Rodan, P.N., “Problems of Industrialization of Eastern and South-Eastern Europe”, Economic Journal, 1943, pp. 202-11.
Rosenstein-Rodan, P.N., “Notes on the Theory of the Big Push”, in Economic Development for Latin America, edited by H.S. Ellis, New York, St. Martin Press, 1961.
Rostow, W.W., “The Stages of Economic Growth”, Cambridge University Press, 1960. Selowsky, M., “Income Distribution, Basic Needs and Trade-offs with Growth: the
Case of Semi-Industrialized Latin American Countries”, World Development, Vol. 9, No. 1, 1981, pp. 73-92.
Tendler, J. and Amorim, M.A., “Small Firms and Their Helpers: Lessons on Demand”, World Development, Vol. 24, No. 3, 1996, pp. 407-26.
Williams, D.G., “Objective Function Tradeoff Curves in a Rural Economic Development, Activity Analysis Planning Model”, The Annals of Regional Science, Vol. 15, No. 3, 1981, pp. 55-72.
Zhu, U., “In Situ Urbanization in Rural China: Case Studies from Fujian Province”, Development and Change, Vol. 31, No. 2, 2000, pp. 413-34.

22
Bar-El, R. and Felsenstein, D., "Entrepreneurship and Rural Industrialization: Comparing Patterns of Rural and Urban Locational Choice in Israel", World Development, Vol. 18, No. 2, 1990, pp. 257-267.
Bar-El, R., “Rural Industrialization Objectives: the Income-Employment Conflict”, World Development, Vol. 12, No.2, 1984, pp. 129-40.
Biles, J.J. and Pigozzi, B.W., “The Interaction of Economic Reforms, Socio-economic Structure and Agriculture in Mexico”, Growth and Change, Vol. 31, No. 1, 2000, pp. 3-22.
Cardoso, E. and Helwege, A., “Below the Line: Poverty in Latin America”, World Development, Vol. 20, No. 1, 1992, pp. 19-37.
Copus, A.K., “From Core-Periphery to Polycentric Development: Concepts and Spatial and Aspatial Peripherality”, European Planning Studies, Vol. 9, No. 4, 2001, pp. 539-52.
Epstein, T.S. and Jezeph, D., “Development - There is Another Way: a Rural-Urban Partnership Development Paradigm”, World Development, Vol. 29, No. 8, 2001, pp. 1443-54.
Fishman, A. and Simhon, A., “The Division of Labor, Inequality and Growth”, Journal of Economic Growth, Vol. 7, No. 2, 2002, pp. 117-36.
Forslid, R.,”Agglomeration With Human and Physical Capital: An Analytically Solvable Case”, Centre for Economic Policy Research Discussion Paper: 2102, 1999.
Goheer, N.A., “Poverty in Pakistan: Increasing Incidence, Chronic Gender Preponderance, and the Plausibility of Grameen-Type Intermediation”, Pakistan Development Review, Vol. 38, No. 4, 1999, pp. 873-93.
Goldsmith, W.W. and Wilson, R., “Poverty and Distorted Industrialization in the Brazilian Northeast”, World Development, Vol. 19, No. 5, 1991, pp. 435-55.
Gupta, S.P., “Trickle Down Theory Revisited: the Role of Employment and Poverty”, Indian Journal of Labour Economics, Vol. 43, No. 1, 2000, pp. 25-34.
Gwynne, R.N., “Industrialization and Urbanization in Latin America”, The Johns Hopkins University Press, Baltimore, Maryland, 1986.
Hsieh, W. and Hsing, Y., “Economic Growth and Social Indicators: the Case of Taiwan”, International Journal of Social Economics, Vol. 29, No. 7-8, 2002, pp. 518-25.
Isserman, A.M., “Competitive Advantages of Rural America in the Next Century”, International Regional Science Review, Vol. 24, No. 1, 2001, pp. 38-58.
Jaksch, H.J., “Income Distribution as an Objective in Development Planning”, De Economist, Vol. 122, No. 1, 1974, pp. 1-22.
Kim, K.S., “Income Distribution and Poverty: An Interregional Comparison”, World Development, Vol. 25, No. 11, 1997, pp. 1909-24.
Kim, E. and Kim, K., “Impacts of Regional Development Strategies on Growth and Equity of Korea: a Multiregional CGE Model”, The Annals of Regional Science, Vol. 36, No. 1, 2002, pp. 165-80.
Krugman, P., “Increasing Returns and Economic Geography”, Journal of Political Economy, Vol. 91, 1991, pp. 483-99.
Krugman, P., 1999, ‘The Role of Geography in Development’, International Regional Science Review, Vol. 22, No. 2, 1999, pp. 142-61.
Kuznets, S., “Economic Growth and Income Inequality”, American Economic Review, Vol. 45, No. 1, 1955, pp. 1-28.
Lanaspa, L.F., Pueyo, F. and Sanz, F., ‘The Public Sector and Core-Periphery Models’, Urban Studies, Vol. 38, No. 10, 2001, pp. 1639-49.
21
government as a main purchaser of products. More common approaches require the
involvement of the government as a facilitator of development through the provision of
appropriate conditions. Supporting the development of several urban centers within the
interior through the creation of infrastructures (Bar-El and Benhayoun, 2000), investing
in human capital formation and improving public social services could probably lead to
healthier economic growth (Epstein and Jezeph, 2001; Isserman, 2001; Kim and Kim,
2002; Bar-El and Felsenstein, 1990), leading to lower levels of poverty and to a more
equal distribution of income, through the following expected effects:
1. Better conditions in the urban interior would attract some of the industrial
activities, using its potential of abundant supply of land and labor force.
2. Such conditions would attract more rural migrants within the interior, increasing
the urbanization process and improving the spatial distribution of the population.
3. The diminution of the population in the rural area would improve higher levels
of productivity in agriculture (by diminishing the disguised unemployment) and
therefore increase the income level.
4. Stronger urban centers within the interior can stimulate the development of non-
farm employment in the rural sector, by providing necessary economic support
services (Zhu, 2000; Biles and Pigozzi, 2000).
The government of Ceara has clearly identified the need for the integration of policies to
achieve a better distribution with policies for economic growth. An important measure
recently taken is the establishment of a Secretariat for Regional and Local
Development, and the initiation of a process of elaboration of a few regional
development master plans.
REFERENCES
Azzoni, C.R., “Economic Growth and Regional Income Inequality in Brazil”, The Annals of Regional Science, Vol. 35, No. 1, 2001, pp. 133-52.
Aghion, P. and Bolton, P., “A Theory of Trickle-Down Growth and Development”, Review of Economic Studies, Vol. 64, 1997, pp. 151-172.
Baldwin, R.E. and Forslid, R., ‘The Core-Periphery Model and Endogenous Growth: Stabilizing and Destabilizing Integration’, Economica, Vol. 67, 2000, pp. 307-24
Bar-El, R. and Parr, J., “Over-Reliance on the Core-Periphery Model? The Case of Israel”, Environment and Planning C, forthcoming, 2003.
Bar-El, R. and Benhayoun, G., “Convergence, Divergence and Non Efficiency of Public Infrastructure Spatial Allocation”, Region and Development, No. 12, 2000, pp 167-181.
20
migrate to towns within the interior). The lack of job opportunities is reflected
by the rapid growth of employment in services with low and stagnant
productivity, again hinting at the existence of disguised unemployment. This
again leads to high levels of poverty and inequality.
3. The ability of the metropolitan region to absorb excess labor force is apparently
quite limited: the growth of the industrial sector is not fully reflected by a
growth in employment (the share of industry in employment even shows a
decreasing trend), and while the service sector shows growth, it also shows zero
productivity growth. This may indicate that other than the growth of the
productive tourism sector, much of the labor force in services actually reflects a
growing hidden unemployment also in the metropolitan region.
The persistence of poverty and inequality can therefore be explained by a concentration
of economic growth in the metropolitan core, while the excess labor force from
agriculture cannot find appropriate employment conditions in the rural area or in the
local regional towns, or competes mostly for low productivity jobs in the metropolitan
region.
As indicated above, two main factors come to play in this distorted economic
situation. One is the excessively low pace of urbanization and the other is the
excessively strong spatial concentration of urban growth in the metropolitan region. The
alternative policy that could be considered is thus one of adaptation of urban structures
to the changing economic structure. Urban development is subject to “market failure”
and is therefore generally guided or supported by government policy. In its evaluation
of the economic growth process in Ceara, the state government has actually reached the
conclusion of the need for a more space-balanced approach. In addition to the measures
that have been already taken for the diminution of poverty in the short run and in the
long run (education programs, support to small enterprises, agricultural extension, etc.),
the government has initiated a policy of regional development, trying to identify urban
centers in the interior that can be stimulated and provided with the necessary conditions
for the development of new economic activities that respond to the needs of the
population of the interior.
Much research has been done and still needs to be done in order to identify the
optimal policy measures to be taken by the government. An approach of “demand-
driven” models has been suggested for the specific case of the development of small
enterprises in Ceara by Tendler and Amorim (1996), involving the intervention of

19
The findings lead quite clearly to the following interpretation of the process of
growth with insufficient diminution of poverty and with widening gaps in income
distribution. The efforts made for the stimulation of economic growth are for the most
part focused on attracting industrial and tourist activities, generally without sufficient
regional considerations. Those activities find the best location in the metropolitan
region, where the conditions of access to labor force, supply of infrastructures, access to
markets and tourist resources (mainly the seashore) are best. The urban features that are
required for a process of industrialization are much less accessible in the interior, where
cities are much smaller and provide much weaker infrastructures. If we disregard the
social inequality problem and the probable future negative implications of unequal
distribution on long-term growth, theoretically, this could be a steady free market and
efficient equilibrium of the core-periphery type, achieved through concentration of the
economic activity in the metropolitan region and through increasing inequality in the
distribution of income. However, although we do not have data on productivity in each
region, the zero growth productivity in agriculture and in services throughout the 14-
year macro-growth period raises doubts about the economic efficiency of this solution.
The excess labor force from agriculture in the rural area, trying to find
employment in non-farm activities, has three options: migrating to the regional town
within the interior, migrating to the metropolitan region or staying “at home” in the
rural area:
1. The growing disproportion between the share of the population still staying in
the rural area (32%) or the share of labor force in agriculture (40%) and the
share of agriculture in total GDP (6%) implies that this is a reaction of despair
rather than a healthy efficient response to changing economic conditions. These
figures actually imply that approximately one third of the state population
remains in the rural area and refrains from migrating to urban areas, because of
the lack of job opportunities in the urban area and the long distance from the
metropolitan region (Lucas, 2001). In terms of poverty and distribution, this
population actually grows poorer relative to the population that is engaged in
more productive activities.
2. The fact that the rural population that is ready to leave the rural area and find
alternative non-farm employment cannot find an appropriate response in the
economy of the interior is reflected by the high share of migrants having to go to
the metropolitan region (60%, as opposed to 40% of the rural migrants who

18
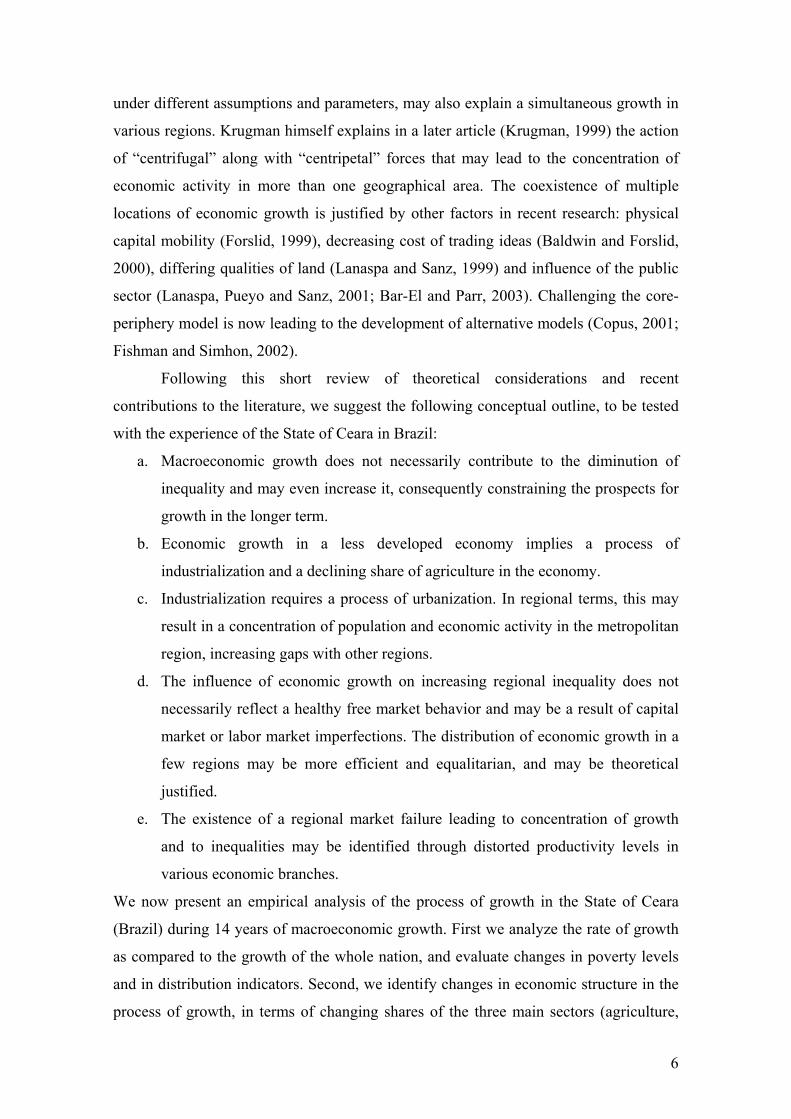
employment along the years can be found in the service sector (and not in industry,
which leads the economic growth). One should not be misled by the growth of
employment in this sector, as it is a direct result of stagnation in productivity during the
entire 14-year period: the trend line for this sector as well as that of agriculture has a
practically zero R square value, and a zero growth coefficient. Growth of employment
in services, therefore, reflects to a large extent the accumulation of hidden
unemployment and low levels of productivity. The sector of agriculture shows the same
stagnation in productivity, with very heavy fluctuations that reflect the climatic
instability and the fact that employment in this sector does not decline in times of low
production. Again, this indicates the prevalence of constantly growing disguised
unemployment levels and growing levels of poverty.
Figure 5: Index of productivity (1985=100) in Ceara by economic sector, 1985-1999
80
100
120
140
160
180
85 86 87 88 89 90 91 92 93 94 95 96 97 98 99
prod
uctiv
ity in
dex
IP
TP
AP
SP
Conclusion
Our tentative conclusion is that economic growth with no policy of regional
adaptation may lead to a core-periphery type of equilibrium, with both social inequality
and economic inefficiency. The operational conclusion in terms of public policy reached
by the government of Ceara is the need for a combination of sectoral policies (such as
support for industry) and regional policies (such as support for infrastructures and
education in the interior) in order to achieve both economic growth and a wider
distribution of this growth.
17
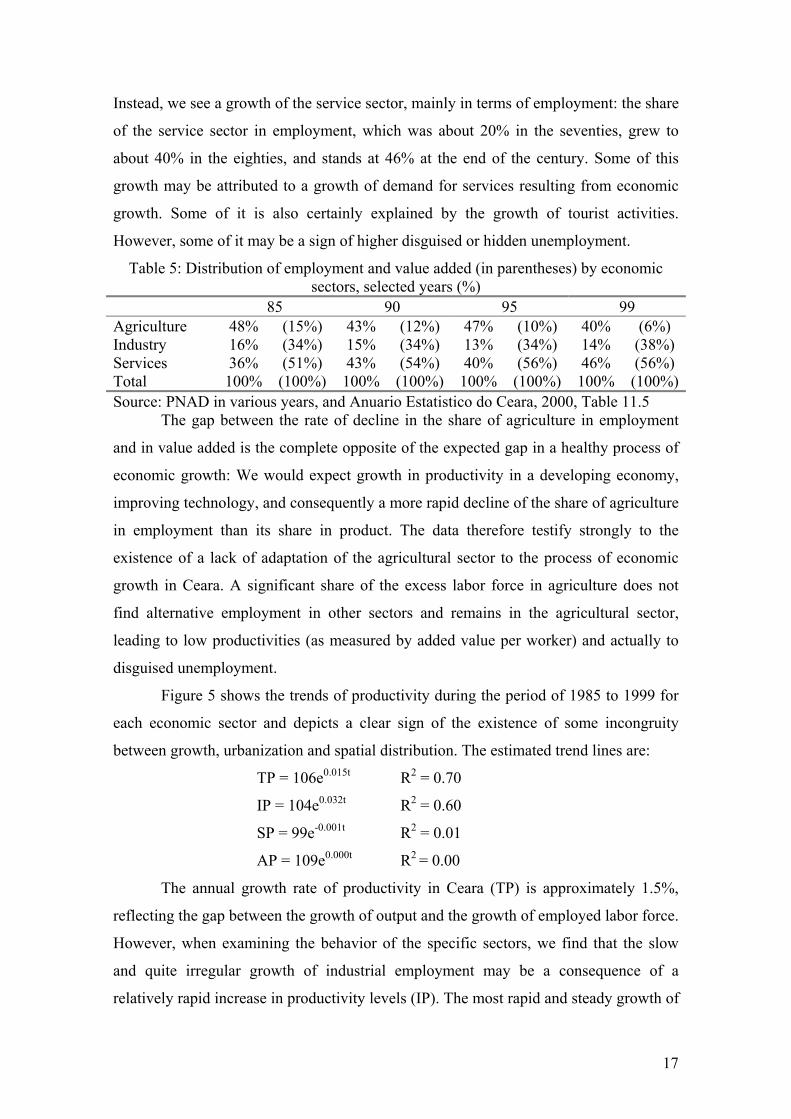
Instead, we see a growth of the service sector, mainly in terms of employment: the share
of the service sector in employment, which was about 20% in the seventies, grew to
about 40% in the eighties, and stands at 46% at the end of the century. Some of this
growth may be attributed to a growth of demand for services resulting from economic
growth. Some of it is also certainly explained by the growth of tourist activities.
However, some of it may be a sign of higher disguised or hidden unemployment.
Table 5: Distribution of employment and value added (in parentheses) by economic sectors, selected years (%)
85 90 95 99 Agriculture 48% (15%) 43% (12%) 47% (10%) 40% (6%) Industry 16% (34%) 15% (34%) 13% (34%) 14% (38%) Services 36% (51%) 43% (54%) 40% (56%) 46% (56%) Total 100% (100%) 100% (100%) 100% (100%) 100% (100%)Source: PNAD in various years, and Anuario Estatistico do Ceara, 2000, Table 11.5 The gap between the rate of decline in the share of agriculture in employment
and in value added is the complete opposite of the expected gap in a healthy process of
economic growth: We would expect growth in productivity in a developing economy,
improving technology, and consequently a more rapid decline of the share of agriculture
in employment than its share in product. The data therefore testify strongly to the
existence of a lack of adaptation of the agricultural sector to the process of economic
growth in Ceara. A significant share of the excess labor force in agriculture does not
find alternative employment in other sectors and remains in the agricultural sector,
leading to low productivities (as measured by added value per worker) and actually to
disguised unemployment.
Figure 5 shows the trends of productivity during the period of 1985 to 1999 for
each economic sector and depicts a clear sign of the existence of some incongruity
between growth, urbanization and spatial distribution. The estimated trend lines are:
TP = 106e0.015t R2 = 0.70
IP = 104e0.032t R2 = 0.60
SP = 99e-0.001t R2 = 0.01
AP = 109e0.000t R2 = 0.00
The annual growth rate of productivity in Ceara (TP) is approximately 1.5%,
reflecting the gap between the growth of output and the growth of employed labor force.
However, when examining the behavior of the specific sectors, we find that the slow
and quite irregular growth of industrial employment may be a consequence of a
relatively rapid increase in productivity levels (IP). The most rapid and steady growth of

16
The consequence is a more rapid growth of population in the metropolitan
region, as can be seen in Figure 4 above (an annual growth trend of 3.2%, as opposed to
2.7% in the urban area of the interior), and as a result, a stronger concentration of the
population in the metropolitan region, as can be seen in Table 3, following a core-
periphery model, more than a multi-focal model as described above: Over the 14-year
period the share of the metropolitan region in total population grew from 31% to 39%.
The process of urbanization is therefore a concentration process, creating a relatively
large metropolitan region of 2.7 million inhabitants, with the big city of Fortaleza with
approximately 2 million inhabitants, 10 times larger than the second largest city in
Ceara, Juazeiro do Norte.
Reflections on productivity
We have shown that economic growth has led to urbanization, but probably at
insufficient rates, and at too high a spatial concentration. We do not intend to formulate
the “optimal” relationship between growth, changing economic structure, urbanization
and spatial demographic distribution through rigid equations. Theoretically, the findings
above could still reflect healthy economic behavior. A high share of rural population
(low rate of urbanization) in relation to a decreasing share of agriculture in GDP could
be explained by higher levels of non-farm activity in the rural area or by a transition to
highly labor-intensive agricultural activities. An increasing concentration of the
population in the metropolitan region could be explained by the existence of still high
agglomeration economies. However, our hypothesis is that there is some incongruity
between economic growth, urbanization rate, and spatial distribution of the population,
and that incongruity is reflected by low productivity levels, as well as by persistent
poverty and inequality.
This suspected incongruity is tested with the analysis of processes of change in
employment and productivity (in terms of product per worker). The economic growth of
Ceara in the last decade was led to a large extent by growth in industrial activity.
Actually, the share of industry in the GDP of Ceara did grow, but its share in
employment remained quite stable, with a slight downward trend. Table 5 provides the
distribution of employment between sectors, as compared with the distribution of value
added, copied here from Table 2 above. This economic growth can indicate growing
productivity in the industrial sector, but the ability of this sector to absorb excess labor
force is still rather limited. Its share in employment and product is still quite low.

15
hidden unemployment in agriculture. Much more alarming, however, is the fact that
after 14 years, this proportion changes drastically, when the share of population in the
rural area (32%) is more than 5 times higher than the share of agriculture in GDP (6%).
The apparent conclusion is that the process of economic development (and
industrialization) has led to urbanization, but at a rate that is much too low.
Changing spatial structure
The decline in absolute population in the rural area means that migration to the
urban area is higher that natural growth. We would assume that rural population with no
employment in agriculture would first try to find employment in industry or services in
the urban area within the region (or develop non-farm employment in the rural area).
The lack of such employment opportunities would stimulate migration to other regions
or to the metropolitan region. A rough estimate of the flow of migrants from the rural
area is made in Table 4 below. Assuming that natural growth rates are similar in the
rural, urban and metropolitan sectors (1.4% a year), we estimate the net migration from
the rural area to the metropolitan region and to the urban interior (as shown in Column
d, the difference between Column c that calculates theoretical population at the average
growth rate of 1.4% over 14 years, and Column b with the actual population). The result
is an evaluated figure of 0.9 million migrants from the rural area during this 14-year
period. Only 40% of them migrated to the urban sector within the interior, and 60% of
them migrated to the metropolitan region (this is in net migration terms, meaning that
this may also reflect some rural to urban interior migrants balanced by urban interior to
metropolitan region migrants). Since we can assume that the natural growth rate is
highest in the rural area, and lowest in the metropolitan region, those estimates can be
considered as downward biased: real migration from rural areas is probably higher, and
the share of the metropolitan region in the absorption of migrants is probably higher
than the results shown in Table 4.
Table 4: Rough estimates of rural to urban net migration (millions and %) 1999 1985
a
Actual b
Assuming no migration
c=a*(1.014)14
Estimated net migration
from rural area D=c-b
Share of rural
migrants absorbed
CE 5.8 7.1 7.1 Metropolitan 1.8 2.7 2.2 0.5 60% Urban interior 1.4 2.1 1.7 0.4 40% Rural interior 2.6 2.3 3.2 -0.9 -100%
14
The population of the state POP(CE) grows at an annual trend of 1.4%, with a
clear urbanization process as can be seen by high R square coefficients for the
metropolitan region POP(MRF), growing at an annual rate of 3.2%, and for the urban
interior POP(UI), at an annual rate of 2.7%. The rural interior POP(RI) shows a trend of
decreasing population at an annual rate of 1.1%. We put aside at this stage the
distribution of the urban population between the metropolitan and the non-metropolitan
region (the interior) and focus on the pure urbanization process. The increasing
urbanization process as visible from the figure is apparently a healthy response to the
changing economic structure, with a decreasing emphasis on agriculture. The share of
rural population has constantly declined over the years, from 77% in 1940 to 32% at the
end of the century. In absolute terms, rural population has not increased at all since
1970 (and even slightly decreased), while all the population growth in the last 30 years
has actually occurred in the urban sector.
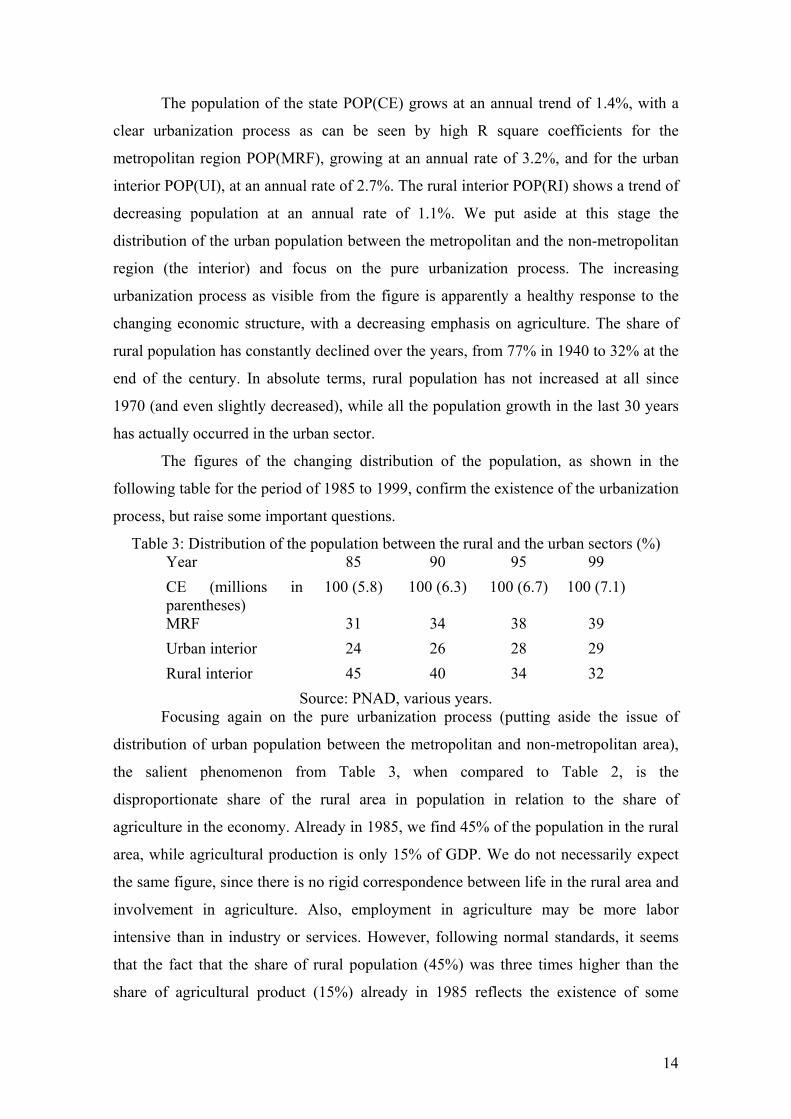
The figures of the changing distribution of the population, as shown in the
following table for the period of 1985 to 1999, confirm the existence of the urbanization
process, but raise some important questions.
Table 3: Distribution of the population between the rural and the urban sectors (%) Year 85 90 95 99 CE (millions in parentheses)
100 (5.8) 100 (6.3) 100 (6.7) 100 (7.1)
MRF 31 34 38 39 Urban interior 24 26 28 29 Rural interior 45 40 34 32
Source: PNAD, various years. Focusing again on the pure urbanization process (putting aside the issue of
distribution of urban population between the metropolitan and non-metropolitan area),
the salient phenomenon from Table 3, when compared to Table 2, is the
disproportionate share of the rural area in population in relation to the share of
agriculture in the economy. Already in 1985, we find 45% of the population in the rural
area, while agricultural production is only 15% of GDP. We do not necessarily expect
the same figure, since there is no rigid correspondence between life in the rural area and
involvement in agriculture. Also, employment in agriculture may be more labor
intensive than in industry or services. However, following normal standards, it seems
that the fact that the share of rural population (45%) was three times higher than the
share of agricultural product (15%) already in 1985 reflects the existence of some

13
Table 2: Distribution of value added by economic sector (%) Year 85 90 95 99 Total 100 100 100 100 Agriculture 15 12 10 6 Industry 34 34 34 38 Services 51 54 56 56
Source: Anuario estatistico do Ceara, 2000, Table 11.5, page 356
Urbanization
At this stage, we ask ourselves to what extent the changing economic structure
has led to a changing demographic structure, or in other words, to what extent the
diminution of the relative weight of agriculture in the economy led to a diminution of
the share of the rural population. As previously stated, we deal with three categories of
population: the rural interior, urban interior and metropolitan region. The following
figure shows the growth of the population index in the state as a whole and in each of
the three categories (the population in each group is set at 100 in 1985).
Figure 4: Growth of population by category, 1985- 1999.
80
90
100
110
120
130
140
150
160
85 86 87 88 89 90 91 92 93 94 95 96 97 98 99
popu
latio
n in
dex
POP(CE)
POP(MRF)
POP(UI)
POP(RI)
The trend lines in Figure 4 show the changes in the population index as a
function of time t (t taking values of 0 in 1985 to 14 in 1999). The estimated functions
are:
POP(CE)= 99 e0.014t R2= 0.99
POP(MRF)= 98 e0.032tR2= 0.97
POP(UI)= 101 e0.027t R2= 0.97
POP(RI)= 101 e-0.011t R2= 0.74

12
Figure 3: Index of value added (1985=100) in Ceara by economic sector, 1985-1999
60
80
100
120
140
160
180
200
85 86 87 88 89 90 91 92 93 94 95 96 97 98 99
valu
e ad
ded
inde
x
IV
TV
SV
AV
Source: Anuario Estatistico do Ceara, 2000, Table 11.4.
Total GDP in Ceara displays an annual growth rate of 3.4%, as shown earlier.
This growth of value added is mainly led by industrial growth, at an annual rate of
4.2%, followed by services. The interesting, though not surprising, result is that the
growth of agricultural value added is the only one with an extremely low R square,
reflecting the existence of extreme fluctuations in agricultural production (mainly as a
result of droughts), with no significant trend of growth over the years. The problem of
instability of agricultural production is treated by the Secretariat of Rural Development
through various important programs, some of which are oriented towards increasing
productivity and others focused on alleviation of poverty problems caused by droughts
and climatic conditions.
The different growth rates of product in each sector lead naturally to a changing
economic structure, in terms of the share of each sector in total GDP. It is difficult to
analyze time series of those shares, because of the heavy fluctuations of the agricultural
product as a consequence of the influence of droughts. However, the following table,
showing the distribution of product between the three sectors at 5-year intervals, gives
quite a clear picture of the decreasing share of agriculture and the increasing share of
industry and services. The share of agriculture in the GDP of Ceara fell drastically from
15% in 1985 to 6% in 1999, with comparable growth of the share of industry and
services.

11
strongest elements in the rural population have benefited from economic growth, but the
weakest elements are still stagnating and have not found a solution by migrating to
urban areas.
Summarizing the results of this short analysis, we find that the macroeconomic
growth of the Ceara economy since 1985 did not contribute significantly to the
reduction of poverty and inequality. Poverty levels did diminish to some extent, but
most of the effect actually occurred during several years in the middle of the period.
Inequality was not reduced, and may even be increasing, particularly within the rural
areas. Most importantly, inequalities mainly result from gaps between the three
population sectors: rural, urban and metropolitan.
Growth and changing economic structure
A process of economic growth on a national level is generally characterized by a
change in the structure of the economy, mainly a diminution of the share of agriculture
in the total state product and employment, an increase in the share of industrial
activities, and a later stage an increase in the service sector. The process of economic
growth in the Northeast of Brazil as a whole has been led by industrialization, although
it has not been integrated into the economy of the nation (Goldsmith and Wilson, 1991).
Figure 3 shows the trends of growth in total product in Ceara, and in each economic
sector, in real terms, using an index based on the value for 1985 (100). For the sake of
simplicity, we call “agriculture” all agricultural and cattle or fishing activities,
“industry” includes manufacturing, construction and utilities, and “services” includes all
kinds of services, private and public, economic services and social services.
In Figure 3, TV stands for total value added, IV for industrial value added, SV
for services value added and AV for agricultural value added. Trend lines have been
estimated for each of the sectors, using an exponential function in order to evaluate the
growth rate trends. The estimated equations of the trend lines and their R squares are:
TV = 100e0.034t R2 = 0.98
IV = 103e0.042t R2 = 0.95
SV = 99e0.030t R2 = 0.99
AV = 97e0.011t R2 = 0.07
t is the time period: a value of 0 at year 1985 until a value of 14 in 1999.

10
G(MRF), probably reflecting the coexistence of entrepreneurs and workers in
productive economic activities with unemployed, disguised unemployed or workers in
low productivity activities. This may indicate the existence of migration from the
interior to the capital, with no economic absorption ability of the capital. The Gini
coefficients of the state of Ceara as a whole G(CE) show the highest values (around
0.62 during the years), reflecting both the inequalities within each population group and
those between the groups. This is as high as in other states of Brazil, but probably much
higher than in any other country in Latin America (Kim, 1997, p. 1913).
Other indicators such as the share of poorest 20% or poorest 50% in the total
income do not show any increasing equality. Furthermore, the ratio between the average
income of the richest quintile of the population and that of the poorest quintile seems to
have increased during this period. This ratio fluctuates over the years. We will restrict
this study to the results of 5-year periods, excluding years of extreme drought. This ratio
is shown in Table 1, together with the Gini coefficients for those years.
Table 1: Distribution indicators in selected years: Gini coefficients and ratio of income of richest and poorest 20%.
Year 85 90 95 99 Gini coefficients CE 0.62 0.63 0.62 0.62 MRF 0.61 0.62 0.60 0.62 Urban interior 0.53 0.52 0.58 0.56 Rural interior 0.40 0.46 0.47 0.49 Ratio of average income of richest 20% and poorest 20% CE 22 24 27 29 MRF 21 26 22 25 Urban interior 14 13 21 20 Rural interior 8 11 13 20
In the state of Ceara, the average income of the richest 20% of the population
was 22 times higher than that of the poorest 20% in 1985, and this ratio continued on an
upward trend, reaching 29 in 1999. Within each sector (urban, rural and metropolitan),
we can also detect signs of increasing gaps, suggesting higher benefits for the richer
population from the economic growth. This is especially true for the rural population for
whom signs of increasing inequality and of increasing gaps between the richest and the
poorest are most clear: the gap of average income between the poorest and the richest
has more than doubled during this period. This most likely reflects the fact that the
9
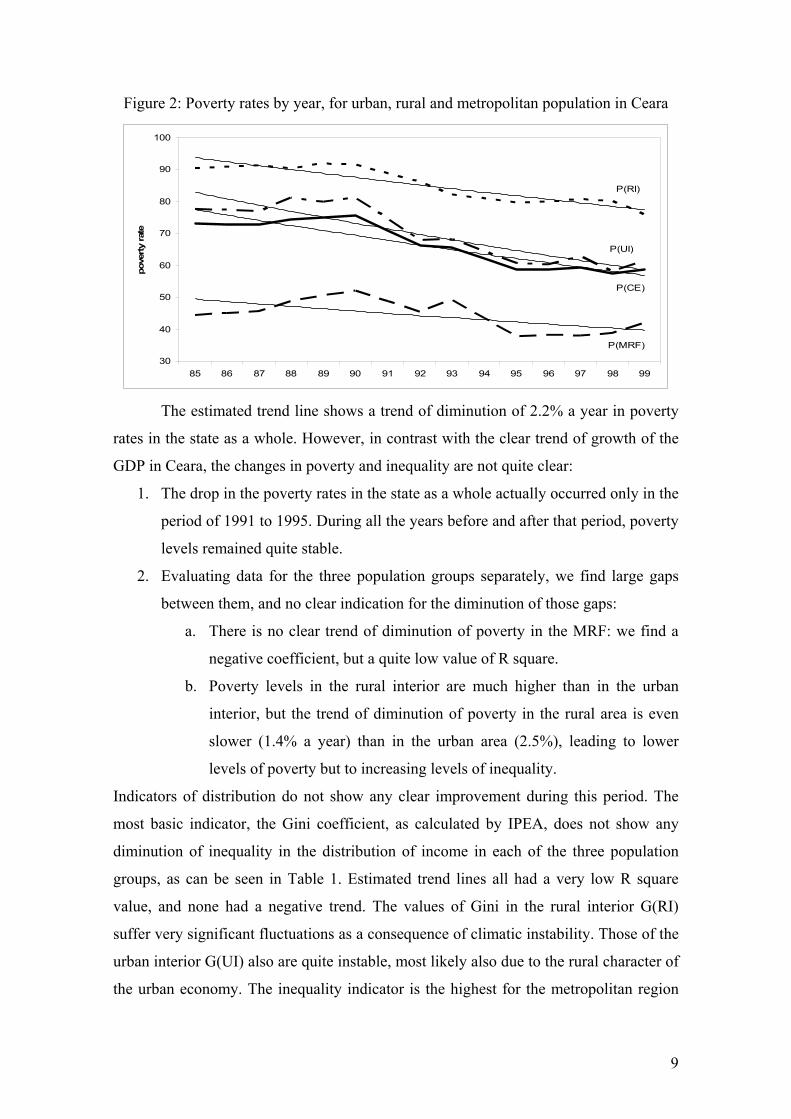
Figure 2: Poverty rates by year, for urban, rural and metropolitan population in Ceara
30
40
50
60
70
80
90
100
85 86 87 88 89 90 91 92 93 94 95 96 97 98 99
pove
rty ra
te
P(CE)
P(UI)
P(RI)
P(MRF)
The estimated trend line shows a trend of diminution of 2.2% a year in poverty
rates in the state as a whole. However, in contrast with the clear trend of growth of the
GDP in Ceara, the changes in poverty and inequality are not quite clear:
1. The drop in the poverty rates in the state as a whole actually occurred only in the
period of 1991 to 1995. During all the years before and after that period, poverty
levels remained quite stable.
2. Evaluating data for the three population groups separately, we find large gaps
between them, and no clear indication for the diminution of those gaps:
a. There is no clear trend of diminution of poverty in the MRF: we find a
negative coefficient, but a quite low value of R square.
b. Poverty levels in the rural interior are much higher than in the urban
interior, but the trend of diminution of poverty in the rural area is even
slower (1.4% a year) than in the urban area (2.5%), leading to lower
levels of poverty but to increasing levels of inequality.
Indicators of distribution do not show any clear improvement during this period. The
most basic indicator, the Gini coefficient, as calculated by IPEA, does not show any
diminution of inequality in the distribution of income in each of the three population
groups, as can be seen in Table 1. Estimated trend lines all had a very low R square
value, and none had a negative trend. The values of Gini in the rural interior G(RI)
suffer very significant fluctuations as a consequence of climatic instability. Those of the
urban interior G(UI) also are quite instable, most likely also due to the rural character of
the urban economy. The inequality indicator is the highest for the metropolitan region

8
study on changes in regional inequality in Brazil, identifying a significant Beta
convergence between Brazilian regions between 1939 and 1995 (Azzoni, 2001).
Compared with the Northeast region as a whole, Ceara eradicated a gap of 20%
in GDP per capita within a decade, and now enjoys a slight advantage. The share of
Ceara in the total Northeast economy has constantly increased from 12.5% at the end of
the eighties, to 16% at the end of the nineties.
There are several alternative measures of poverty rates. Here we adopt the
measure used by IPEA (Instituto de Pesquisa Economica Aplicada) for the calculation
of time series of poverty rates. The poverty estimates are calculated from PNAD
(Pesquisa Nacional por Amostra de Domicilios), an annual survey of the Brazilian
national institute for statistics (IBGE). The calculations performed by IPEA are based
on a poverty line of R$68 per capita per month in 1999 prices (which is about the value
of a minimum food basket, and roughly half a minimum salary). This is more or less
equivalent to the measures used by the World Bank. We will calculate poverty rates for
three separate population groups:
a. The metropolitan region of Fortaleza (MRF), including the capital and several
neighboring municipalities (today 39% of total population of the state).
b. The urban interior (UI), including the entire urban population in the interior of
the state, out of the metropolitan region (29% of total population).
c. The rural interior (RI), including the entire rural population in the interior (32%
of total population).
The relatively rapid growth in GDP per capita was actually accompanied by a
trend of decreasing poverty rates, as can be seen in Figure 2. The poverty rate for the
whole state of Ceara decreased from 73% in 1985 to 59% in 1999. Estimated trend lines
for total poverty rates and in each population group are as follows (shown in Figure 2):
P(CE)= 79 e-0.022t R2= 0.85
P(MRF)= 50 e-0.016t R2= 0.42
P(UI)= 85 e-0.025t R2= 0.82
P(RI)= 95 e-0.014t R2= 0.86
Where P(CE), P(MRF), P(UI) and P(RI) are the poverty rates for the whole state and for
each of the three population groups, and t is the time period with values from 0 (in
1985) to 14 (in 1999).
7
industry and services). Third, we compare the changing economic structures with the
urbanization process, both in terms of increasing shares of the urban population and in
terms of regional distribution of the population. Fourth, we find the extent to which
incongruence between changes in economic structures and demographic spatial
structures are reflected by the levels of productivity in each economic sector. Then, we
attempt to draw conclusions about an appropriate approach for the achievement of a
more healthy economic growth with a more regional equalitarian distribution.
Economic growth, poverty and inequality in Ceara
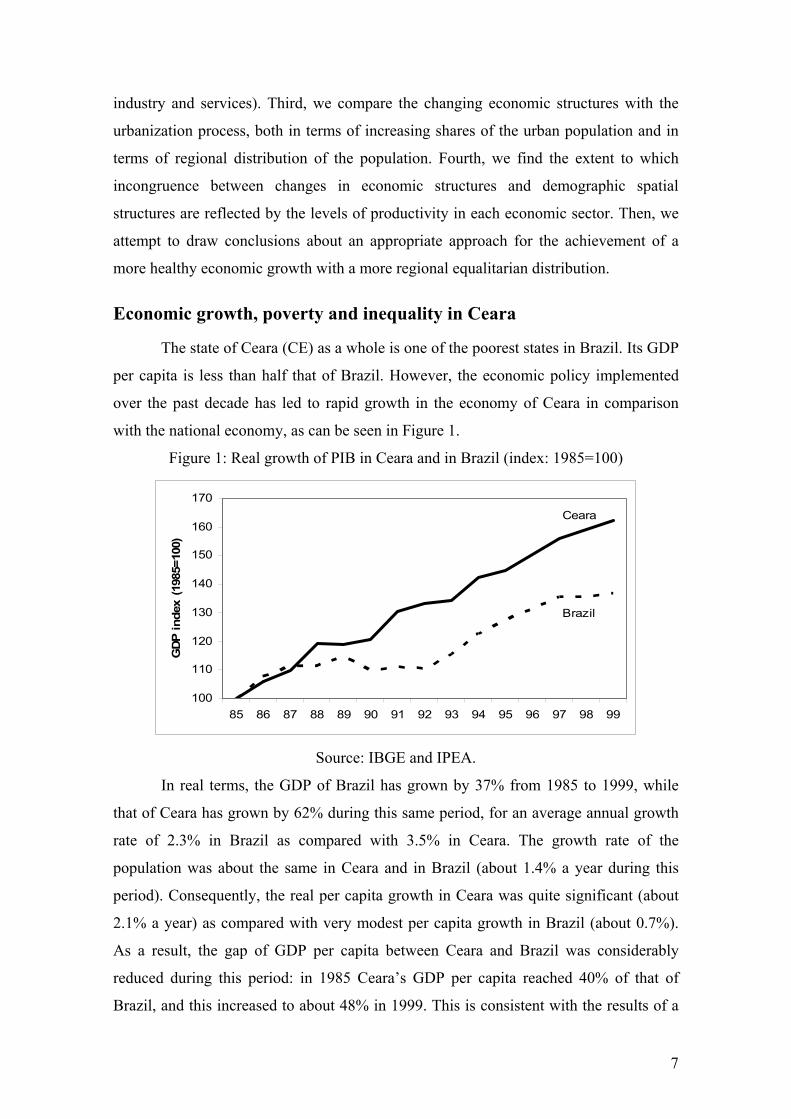
The state of Ceara (CE) as a whole is one of the poorest states in Brazil. Its GDP
per capita is less than half that of Brazil. However, the economic policy implemented
over the past decade has led to rapid growth in the economy of Ceara in comparison
with the national economy, as can be seen in Figure 1.
Figure 1: Real growth of PIB in Ceara and in Brazil (index: 1985=100)
100
110
120
130
140
150
160
170
85 86 87 88 89 90 91 92 93 94 95 96 97 98 99
GDP
inde
x (1
985=
100)
Brazil
Ceara
Source: IBGE and IPEA.
In real terms, the GDP of Brazil has grown by 37% from 1985 to 1999, while
that of Ceara has grown by 62% during this same period, for an average annual growth
rate of 2.3% in Brazil as compared with 3.5% in Ceara. The growth rate of the
population was about the same in Ceara and in Brazil (about 1.4% a year during this
period). Consequently, the real per capita growth in Ceara was quite significant (about
2.1% a year) as compared with very modest per capita growth in Brazil (about 0.7%).
As a result, the gap of GDP per capita between Ceara and Brazil was considerably
reduced during this period: in 1985 Ceara’s GDP per capita reached 40% of that of
Brazil, and this increased to about 48% in 1999. This is consistent with the results of a
6
under different assumptions and parameters, may also explain a simultaneous growth in
various regions. Krugman himself explains in a later article (Krugman, 1999) the action
of “centrifugal” along with “centripetal” forces that may lead to the concentration of
economic activity in more than one geographical area. The coexistence of multiple
locations of economic growth is justified by other factors in recent research: physical
capital mobility (Forslid, 1999), decreasing cost of trading ideas (Baldwin and Forslid,
2000), differing qualities of land (Lanaspa and Sanz, 1999) and influence of the public
sector (Lanaspa, Pueyo and Sanz, 2001; Bar-El and Parr, 2003). Challenging the core-
periphery model is now leading to the development of alternative models (Copus, 2001;
Fishman and Simhon, 2002).
Following this short review of theoretical considerations and recent
contributions to the literature, we suggest the following conceptual outline, to be tested
with the experience of the State of Ceara in Brazil:
a. Macroeconomic growth does not necessarily contribute to the diminution of
inequality and may even increase it, consequently constraining the prospects for
growth in the longer term.
b. Economic growth in a less developed economy implies a process of
industrialization and a declining share of agriculture in the economy.
c. Industrialization requires a process of urbanization. In regional terms, this may
result in a concentration of population and economic activity in the metropolitan
region, increasing gaps with other regions.
d. The influence of economic growth on increasing regional inequality does not
necessarily reflect a healthy free market behavior and may be a result of capital
market or labor market imperfections. The distribution of economic growth in a
few regions may be more efficient and equalitarian, and may be theoretical
justified.
e. The existence of a regional market failure leading to concentration of growth
and to inequalities may be identified through distorted productivity levels in
various economic branches.
We now present an empirical analysis of the process of growth in the State of Ceara
(Brazil) during 14 years of macroeconomic growth. First we analyze the rate of growth
as compared to the growth of the whole nation, and evaluate changes in poverty levels
and in distribution indicators. Second, we identify changes in economic structure in the
process of growth, in terms of changing shares of the three main sectors (agriculture,

5
economic process and consequently limits the prospects of growth. An important model
was recently developed by Fishman and Simhon (2002), showing that a high
concentration of wealth leads to low degrees of specialization and productivity and,
therefore, to a vicious circle of underdevelopment.
The main arguments presented above explaining the relationship between
growth and inequality actually relate to both inter-personal inequalities and inter-
regional inequalities. In this article, we will primarily focus on the second pattern: inter-
regional inequalities. If, at least to a certain extent, inequalities are the result of capital
market or labor market imperfections, the question is whether efficient free market
equilibrium is reached through spatial concentration of economic activity (leading to
inequality) or through a more dispersed distribution.
Industrial development has been used as a main engine for economic
development, absorbing the excess labor force from agriculture and leading to an
urbanization process. It is not our intention here to enter into the polemics around
industrialization policies in developing countries and their influence on development
(see, for example, Rostow, 1960; Myrdal, 1968; Gwynne, 1986). Instead, we focus on
the question of the impact of industrialization on the spatial features of urbanization.
Krugman (1991) established a significant starting point with the development of a
rather simplified model for the explanation of geographical concentration of
manufacturing. He explains, using a two-region, two-sector model, how a concentration
of manufacturing activity may happen in one region, depending on the interaction
between three main parameters: the share of manufacturing in the economy, the
existence of economies of scale and the level of transportation costs. This core-
periphery (CP) model implies that economic efficiency considerations lead to a heavy
concentration of the population around the manufacturing activity in one region (core),
while the second region (periphery) will be less populated and based on agricultural
activity. However, further developments of Krugman’s model, mainly implementing
changes in some basic assumptions, have led other scholars to different conclusions.
Lanaspa and Sanz (2001) find that assuming the existence of congestion costs and
abandoning the assumption of constant transportation costs lead (using the same basis
of Krugman’s CP model) to the existence of various asymmetric stable equilibria, thus
providing a “theoretical justification for economic landscapes in which large industrial
belts coexist with smaller ones” (p. 437). We can state that the theoretical structure
established by Krugman may justify a concentration of manufacturing activity, but

4
selected populations or regions. Another perspective is the potential conflict between
achieving goals of increasing employment and increasing income: broadly speaking,
achieving higher levels of growth and income generation may imply the adoption of
higher technology or capital-intensive processes, leading to a limited increase of
employment (see several empirical analyses, such as Morley, 1978 and Bar-El, 1984 for
Brazil; Williams, 1981 for Arkansas; Jaksch, 1974 for Columbia).
The hypothesis of the existence of a Kuznets U-curve (growth causes growing
inequality in the first stages and growing equality in the second phase, see Kuznets,
1955), or of a “trickle down” effect or a spread effect through which the first inequality
stage is followed by benefits to the poorer segments of the population (“growth first,
distribution later”) was not generally supported by empirical findings. To mention just a
few empirical findings in the past years, Michel (1991) finds a concentration of growth
in higher income percentiles and similar results using Gini coefficients, for the period
after the 1982 recession. Lee (1994) finds similar results for that same period in
London, leading to growing gaps and a tendency toward long-term dependency. Limited
trickle-down effects are also found in developing countries such as Pakistan (Goheer,
1999), India (Gupta, 2000) and Taiwan (Hsieh and Hsing, 2002). Recent theoretical
explanations for the existence of free market equilibrium at high levels of inequality
have been elaborated, primarily on the basis of financial market behavior. Matsuyama
(2000) elaborates a model in which the distribution of wealth in one period affects the
supply and demand for credit, which, in turn, affects the distribution of wealth in the
next period. Assuming that economic development projects that generate higher returns
require a minimum level of investment and assuming the existence of borrowing
constraints, growth would lead to equilibrium with a growing inequality. Under certain
conditions, however, the same model could lead in the long run to Kuznets curve type
of development, with a diminution of inequalities. Similar conclusions are reached
using a model proposed by Aghion and Bolton (1997), suggesting that government
intervention may be needed to achieve decreasing inequalities.
The trade-off between growth and distribution should not be considered a static
phenomenon, stating a price to be paid in terms of social costs for attaining economic
growth. The dynamic and very important element that is generally indicated in most
studies is the negative long-term influence of unequal distribution of income on future
growth. The argument, in general terms, is that concentrated growth leads to the
exclusion of large proportions of production factors (workers, land, etc.) from the

3
Using the case of Ceara, a state in Northeast Brazil, we will provide some
evidence that continuing gaps and poverty are consistent with a lack of adaptation of
demographic geographical distribution to changing economic structures. Furthermore,
we want to show that such a lack of adaptation reduces the level of labor productivity,
and as a result limits the potential of growth of the state as a whole.
The state of Ceara has a population of approximately 7.5 million, and its
inhabitants are among the poorest in Brazil. In the last decade or two, the state
government has undertaken activities that have led to a relatively high level of
macroeconomic growth. That said, inequality and poverty remain a major concern,
particularly in the interior of the state and most specifically in the rural areas. The
economic growth seems to have mostly affected the metropolitan region, while the rural
areas and small cities in the interior still suffer from the implications of instable
agricultural conditions and difficulties in establishing competitive non-farm activities.
The state government has been deeply concerned with this situation, and since the
beginning of the millennium has been devising policies designed to ensure more
balanced growth and long-term alleviation of poverty. Those policies are for the most
part oriented towards the reinforcement of the interior of the state through spatial
reorganization and support for the development of non-farm activities in the rural areas.
These efforts were initiated and led by Governor Tasso Jereissati and by State
Secretaries Pedro Sisnando Leite (Rural Development), Monica Clark (Planning and
Coordination) and Carlos Matos (Agriculture).
Some theoretical considerations
The issue of the relationship between economic growth and income distribution
or poverty has been widely analyzed over the past several decades. Growth does not
necessarily lead to an improvement in equality. On the contrary, many researchers have
approached this question from various angles and shown the potential of increasing
inequality as a consequence of economic growth (Kim, 1997). In very general terms, the
process of economic growth may require a higher concentration on stronger elements of
the economy: investments in regions with better infrastructures, in populations with
better education and skills, etc… The “big push” theory, first conceived decades ago by
Rosenstein-Rodan (1943, 1961) already implies concentration processes due to the
indivisibility of production and supply of social overhead capital (among other factors).
Such a concentration naturally leads to the concentration of benefits from growth in
2
Introduction Countries in the developing world are continually struggling to solve their
development problems by implementing various policies for economic growth
(investing in infrastructures and education, providing incentives for capital investments,
etc.). In many cases, however, it seems that economic growth, even when it is achieved,
does not necessarily resolve the fundamental problems such as poverty and unequal
income distribution that constantly plague these countries, (Cardoso and Helwege,
1992; Selowsky, 1981). The question of whether a conflict exists between economic
growth and income distribution has already been widely analyzed in the literature over
the past several decades (see the excellent review by Kim, 1997). This question is
particularly acute in the case of growth of developing countries, where such growth is
generally accompanied by a changing structure of economic activity: a transition from
agricultural to industrial and service activities. This article focuses on one important
potential source of growing inequalities as a consequence of economic growth: the
incompatibility of structural economic changes and structural demographic spatial
changes. Using case study, we attempt to show the consequences of such
incompatibility and to suggest the need to devise appropriate development policies for
the achievement of coherence between structural economic changes and structural
spatial demographic changes (Rondinelli and Ruddle, 1978).
The transition from agriculture to industry, and later to services as major
branches in the process of economic growth of less developed countries may naturally
require a higher level of urbanization. Theoretically, such a process occurs naturally as a
response to increasing labor supply from agriculture to more urban-oriented activities.
Our hypothesis is that the process of urbanization resulting from the transition
from agriculture to industry and services is not sufficient to generate healthy and
equalitarian economic growth. We argue that the coexistence of economic growth with
unequal distribution of income and continuing poverty can be explained by the lack of a
spatial adjustment of urbanization. In the absence of appropriate conditions for urban
development outside the metropolitan core, the process of urbanization is distorted in
two ways. First, it is biased towards the metropolis. Second, it is quantitatively
restricted. Consequently, the economic transition process is inefficient and generates
unbalanced growth.
1
Spatial urban restructuring for economic growth with distribution
The case of Ceara (Brazil)
Raphael Bar-El and Dafna Schwartz Ben-Gurion University of the Negev,
Beer-Sheva, Israel
ERSA 2003 Congress
University of Jyvaskyla, Finland
August 27-30, 2003
Prof. Raphael Bar-El, Fax: 972-8-6472816, e-mail: [email protected]
Dr. Dafna Schwartz, Fax: 972-8-9353307, e-mail: [email protected]
Abstract Macroeconomic growth does not necessarily lead to the reduction of poverty or to a
more equal distribution of income in developing countries. This study examines this
issue from a regional perspective and claims that this is due to a large extent to an
economically unjustified concentration of growth in the metropolitan region. We review
the recent theoretical core-periphery debate and the rationale for the existence of
simultaneous cores of development. Using the case of the state of Ceara in Northeast
Brazil, we find a persistent and even growing unequal distribution of income in spite of
the relatively rapid macroeconomic growth and show that this is not an efficient free-
market equilibrium: the growth of productivity in agriculture and in services is zero, and
the urbanization process is insufficient, leaving much of the rural population in a state
of hidden unemployment. Furthermore, the migration process leads to an overly heavy
concentration of population in the metropolitan region. The primary conclusion drawn
from the findings is the need to adopt a regional policy that includes spatial reallocation
of public expenditures for physical and human infrastructures, leading to a spatial urban
restructuring.