Embed Size (px)
Citation preview

Lancaster CountyLancaster County Industry Cluster Profiles Industry Cluster Profiles
Scott SheelyLancaster County
Workforce Investment Board

A Workforce Investment A Workforce Investment StrategyStrategy
Local industries that have a chance for long-term growth and success because they have some sort of local competitive advantage;
Local industries with a competitive advantage that grow gold-collar (high skill, high pay, high demand) jobs.

Lancaster CountyLancaster CountyCommunity Audit ProjectCommunity Audit Project
Funded by a grant from the US Department of Labor;
Began July 1, 2001; Intensive study of Lancaster County industry
clusters using data collected by the PA Department of Labor and Industry;
Interpreted by a group of local planners, economists, economic and workforce development professionals, industry representatives, educators, and State officials.

A Conceptual FrameworkA Conceptual Framework
Industry clusters as a planning concept provides all of these systems with a common framework for understanding and a common language that is meaningful for all;
Working together toward understanding local clusters helps these diverse systems develop a common vision of where each needs to put its energy and resources;
Each system then follows through on the implications for its work.

Questions to Ask Questions to Ask in Analysis of Datain Analysis of Data
Which industries are growing and which are declining?
What is the importance of an industry to the local economy relative to its importance to the national economy?
How competitive are regional industries when compared to their national counterparts?
ResultsResults Statistical analysis completed; Validated with calls on-site through the PA
Business Calling Program; Preliminary results analyzed by local Steering
Committee; Preliminary findings shared with Chamber,
Economic Development Company, County government, higher education, and local school districts;
Priority clusters reviewed by County Commissioners and used by other systems.

Lancaster CountyLancaster CountyPriority Industry ClustersPriority Industry Clusters
Health CareConstructionFood ProcessingBiotechnologyCommunicationsMetals and Metal FabricatingAutomotive

Health CareHealth Care
Industries• Long-term Care• Acute Care• Mental Health and Mental Retardation• Outpatient and Private Practice• Wholesale and Retail• Insurance

Health CareHealth Care
Employment• Grew 2,520 jobs or 12.9% since 1995• Average earnings of $30,149• 4% less concentrated than US average• 22,030 is 10.1% of Lancaster County
employment in 2000*
*Includes drug stores and health insurance

Health CareHealth Care
Key Segments• Nursing and personal care facilities (805)
(very high employment, high LQ, and high CEC)
• Hospitals (806) (very high employment)• Offices of medical doctors (801) (high
growth in employment, high CEC)

Health CareHealth CareTop Occupations Nursing Aides Registered Nurses Licensed Practical Nurses Physicians and Surgeons Home Care Aides Medical Secretaries Dental Hygienists and Assistants Residential Counselors Lab Technologists
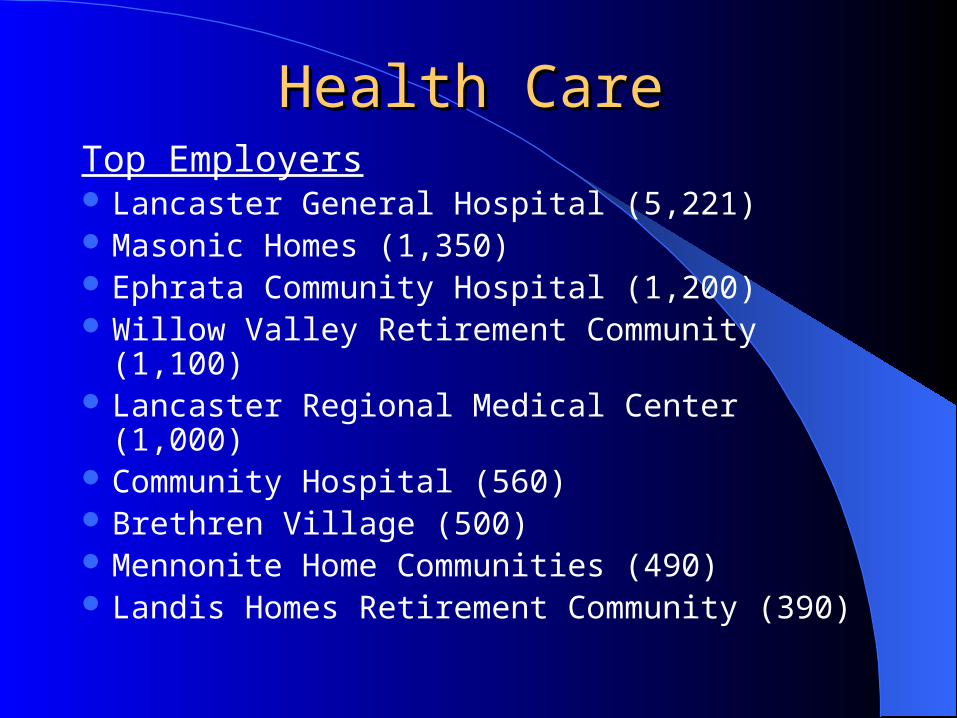
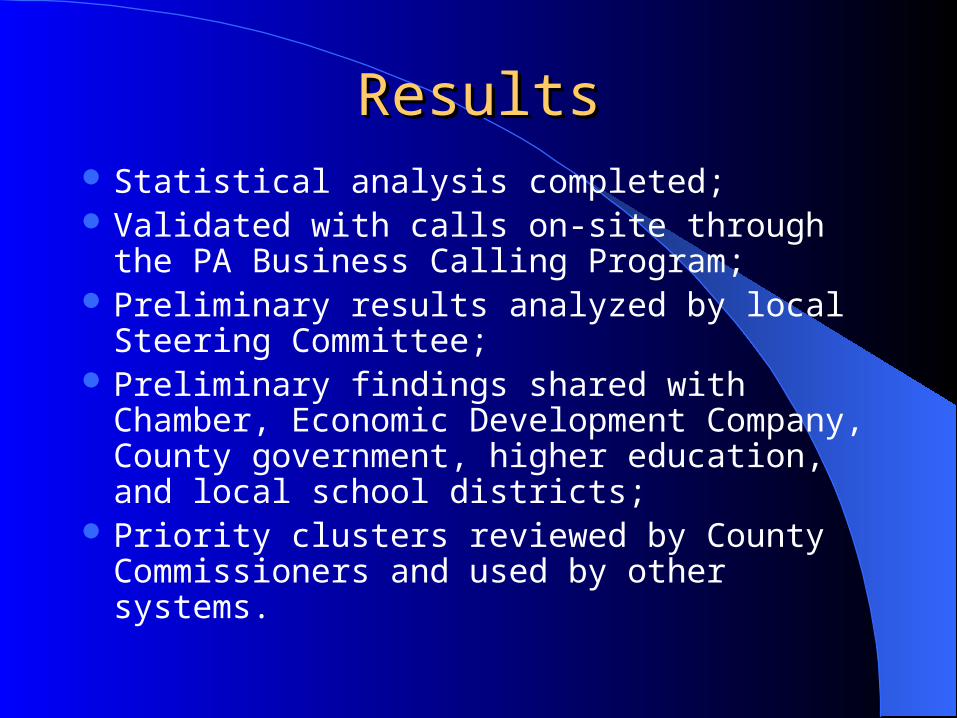
Health CareHealth CareTop Employers Lancaster General Hospital (5,221) Masonic Homes (1,350) Ephrata Community Hospital (1,200) Willow Valley Retirement Community (1,100) Lancaster Regional Medical Center (1,000) Community Hospital (560) Brethren Village (500) Mennonite Home Communities (490) Landis Homes Retirement Community (390)

ConstructionConstruction
Industries• Contractors• Building Services• Lumber and Wood Products• Real Estate• Engineering and Architectural Services

ConstructionConstruction
Employment• 26,505 is 12.1% of Lancaster County
employment in 2000• Grew 5,184 jobs or 24% since 1995• Average earnings of $34,491• 23% more concentrated than US average

ConstructionConstructionKey Segments• Residential and non-residential building
construction (152, 154) (high employment and high LQ)
• Plumbing, heating, and air conditioning (171) (high employment and high LQ)
• Masonry, stonework, and plastering (174) (high employment and high LQ)
• Millwork, plywood and structures (243) (high employment, high LQ, and moderate CEC)
• Household and public building furniture (251, 253) (high LQ)

ConstructionConstructionTop Occupations Carpenters Plumbers Electricians Assemblers and Fabricators Brickmasons Painters Brickmason and Carpenter Helpers Cost Estimators HVAC Mechanics

ConstructionConstructionTop Employers Armstrong (2,750) High Industries (1,950) The Horst Group (450) Martin Limestone (430) Stock Building Supply (240) Rutt Handcrafted Cabinetry (230) Fleetwood Homes of PA (225) Amerimax Home Products (225) B.J. Baldwin and Lancaster Electric (200) Redman Homes (200)

Food ProcessingFood Processing
IndustriesAgricultural ProductionAgricultural ServicesProcessing of FoodWholesale Food Distribution

Food ProcessingFood Processing
Employment• 15,933 is 7.3% of Lancaster County
employment in 2000• Grew 673 jobs or 4.4% since 1995• Average earnings of $32,061• 90% more concentrated than US average

Food ProcessingFood Processing
Key SegmentsPoultry and eggs (025) (high LQ)Veterinary and other animal services (074,
075) (high LQ)Meat products (201) (high employment,
high LQ, and moderate CEC)Dairy products (202) (high employment,
very high LQ, and high CEC)

Food ProcessingFood Processing
Key SegmentsGrain mill products (204) (high
employment, very high LQ)Bakery products (205) (high employment
and very high LQ)Sugar and confectionary products (206)
(high employment and very high LQ)Grocery distribution (514) (high
employment, high LQ, and high CEC)

Food ProcessingFood ProcessingTop Occupations Packaging Machine Operators Agricultural Workers Truck Drivers Freight Movers Industrial Machine Mechanics Bakers Precision Food Workers Sales Representatives Food Batchmakers

Food ProcessingFood Processing
Top Employers Tyson Foods (1,200) Y & S Candies (800) Kellogg Co. (600) Turkey Hill Dairy (460) Four Seasons Produce (425) Kunzler & Co. (335) Nissin Foods (310) Kemps Foods (305)
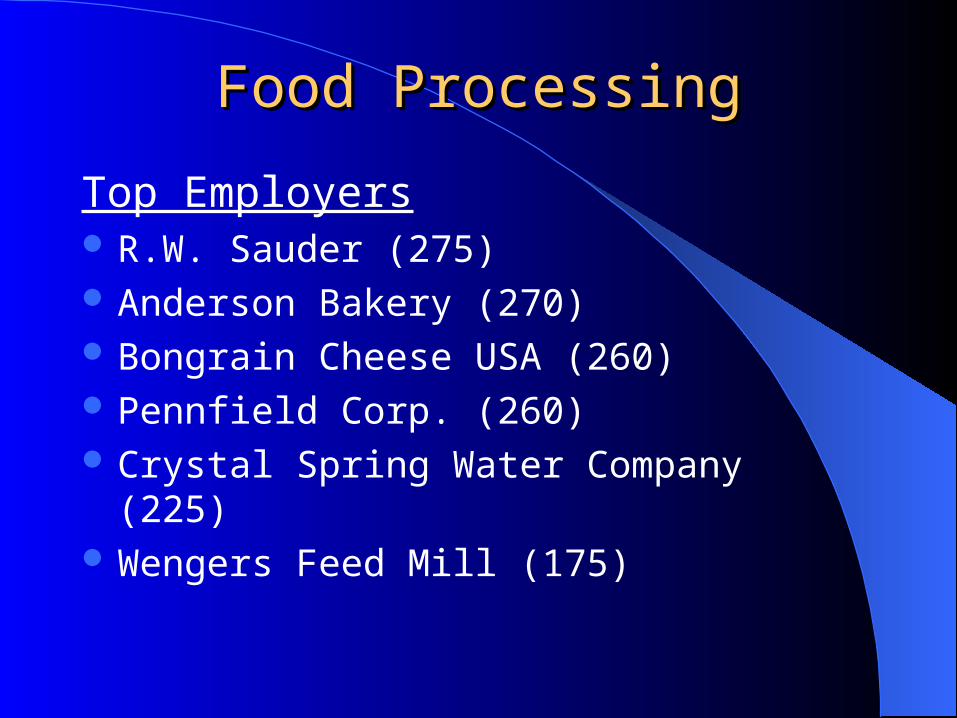
Food ProcessingFood Processing
Top Employers R.W. Sauder (275) Anderson Bakery (270) Bongrain Cheese USA (260) Pennfield Corp. (260) Crystal Spring Water Company (225) Wengers Feed Mill (175)

CommunicationsCommunications
IndustriesPrintingCommunicationsPrecision Electronics ManufacturingAdvertisingComputer Services

CommunicationsCommunications
Employment• 18,367 is 8.4% of Lancaster County
employment in 2000• Grew 2,519 jobs or 15.9% since 1995• Average earnings of $40,936• Concentrated at the US average

CommunicationsCommunications
Key SegmentsNewspaper printing (271) (high
employment and high LQ)Commercial printing (275) (very high
employment, very high LQ, and high CEC)Household audio and video equipment
(365) (high LQ)

CommunicationsCommunications
Top Occupations Hand Packers and Packagers Precision Printing Workers Sales Representatives Offset Lithographic Press Operators Printing and Binding Workers Writers and Editors Computer Programmers and Support Specialist

CommuncationsCommuncationsTop Employers R.R. Donnelley & Sons (3,500) U.S. Postal Service (1,225) Lancaster Newspapers (650) D & E Communications (600) Coupon Clipper (500) Philips Communication and Security Systems (385) Cadmus – Lancaster Press Division (305) Burle Industries (260) Intelligencer Printing (230) Cadmus – Science Press Division (225) Thomson Multimedia, Inc. (220)

BiotechnologyBiotechnology
IndustriesPharmaceutical ManufacturingMedical Instruments ManufacturingMedical and Dental LabsResearch and Testing

BiotechnologyBiotechnology
Employment• 2,281 is 1.1% of Lancaster County
employment in 2000• Grew 650 jobs or 39.9% since 1995• Average earnings of $51,517• 8% less concentrated than US average

BiotechnologyBiotechnology
Key Segments• Drug manufacturing (283) (high LQ)• Medical instruments and supplies (384)
(high growth in employment, change in IQ, and high CEC)

BiotechnologyBiotechnologyTop Occupations Electrical and Electronics Engineers Computer Engineers Precision Assemblers Biological Scientists Inspectors and Testers Biological Technicians Packaging Machine Operators Animal Caretakers
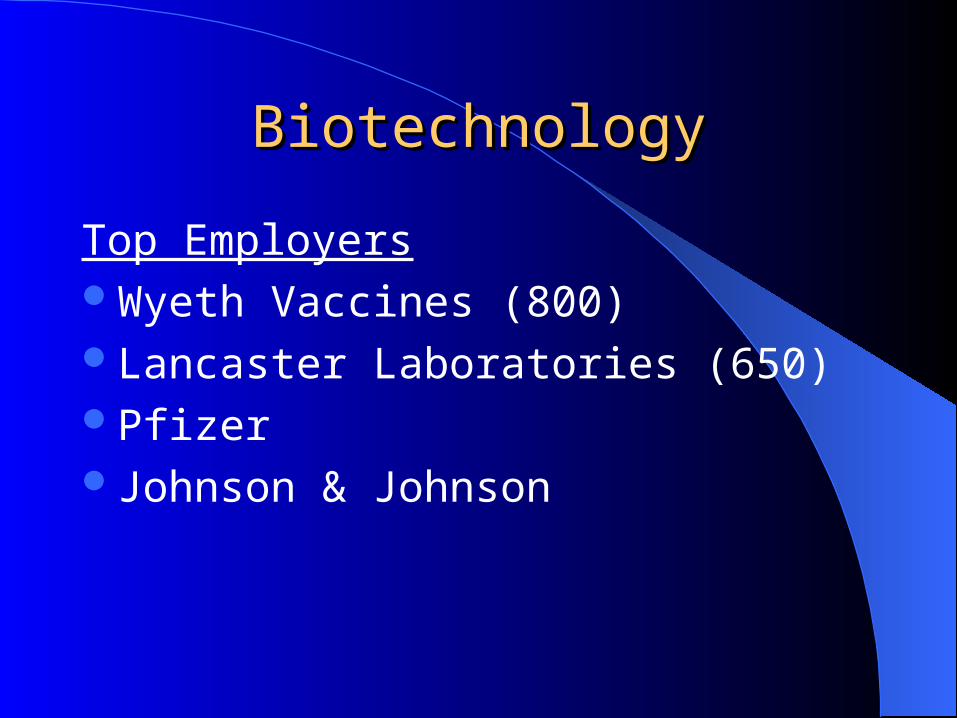
BiotechnologyBiotechnology
Top EmployersWyeth Vaccines (800)Lancaster Laboratories (650)PfizerJohnson & Johnson

Metals and Metal FabricatingMetals and Metal Fabricating
IndustriesPrimary Metal ProductsFabricated Metal ProductsIndustrial Machinery and EquipmentElectrical EquipmentTransportation Equipment

Metals and Metal FabricatingMetals and Metal Fabricating
Employment• 17,395 is 8.0% of Lancaster County
employment in 2000• Lost 539 jobs or 3% since 1995• Average earnings of $40,153• 55% more concentrated than US average

Metals and Metal FabricatingMetals and Metal Fabricating
Key SegmentsNonferrous rolling and drawing (335) (high
employment and high LQ);Fabricated metal products (340) (high
employment and high LQ);Electrical equipment and supplies (369)
(high growth and high LQ).

Metals and Metal FabricatingMetals and Metal Fabricating
Top Occupations Assemblers Industrial Truck and Tractor Operators Extrusion and Drawing Operators Industrial Machinery Mechanics Machine Forming Operators Precision Assemblers Machinists Foundry Operators and Tenders

Metals and Metal FabricatingMetals and Metal FabricatingTop Employers New Holland North America (1,300) Alcoa Mill Products (1,000) Anvil International (945) Burnham Corp. (635) Buck Co. (375) Ladder Towers, Inc. (280) NTN-BCA Corp. (270) ITT Industries, Engineered Valves (250) Dana Corp. (240) Kalas Manufacturing (230)

AutomotiveAutomotive
IndustriesWholesale Motor Vehicles, Parts and
SuppliesNew and Used Car DealersRetail Auto and Home Supply StoresService StationsAuto Repair Services

AutomotiveAutomotive
Employment• 9,094 is 4.2% of Lancaster County
employment in 2000• Grew 1,653 jobs or 22.2% since 1995• Average earnings of $26,290• 31% more concentrated than US average

AutomotiveAutomotive
Key SegmentsMotor Vehicles, Parts, and Supplies (501)
(high growth rate, very high LQ)New and Used Car Dealers (551) (moderate
growth, good LQ)Auto Repair Services (750) (high growth
rate, moderate LQ, good CEC)

AutomotiveAutomotive
Top OccupationsAuto mechanics and service techniciansRetail salespersonsTruck driversMarketing and sales supervisorsParts salespersonsCashiersHelpers and movers

AutomotiveAutomotive
Top Employers Manheim Auto Auction (1,900)
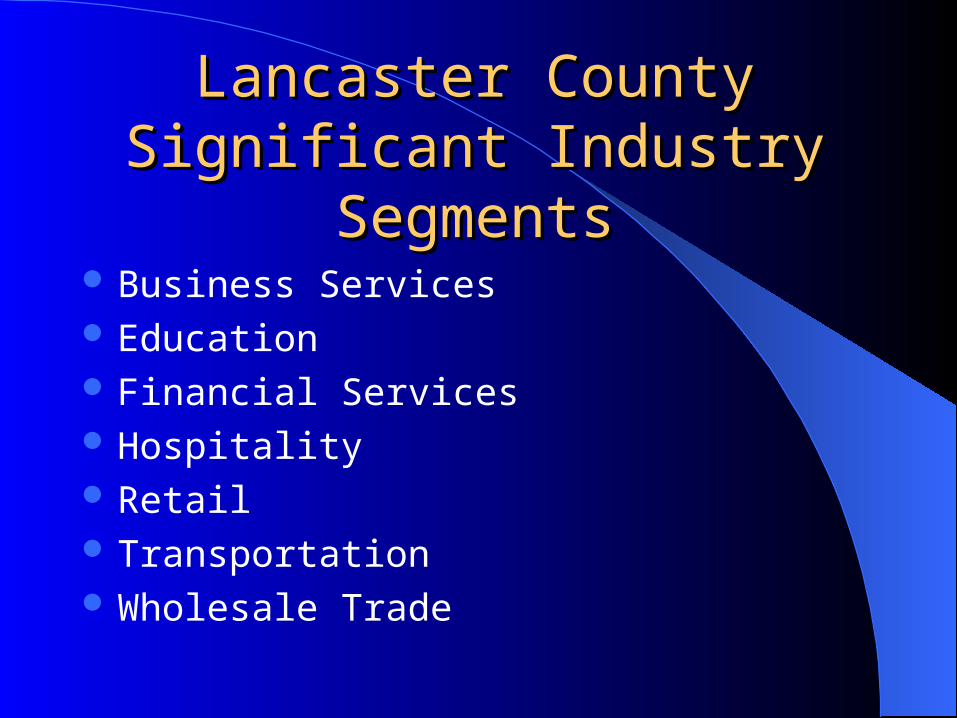
Lancaster CountyLancaster CountySignificant Industry SegmentsSignificant Industry Segments
Business Services Education Financial Services Hospitality Retail Transportation Wholesale Trade

Business ServicesBusiness Services
IndustriesPersonnel Supply ServicesDetective, Guard, and Armored CarSecurity SystemsBusiness AssociationsProfessional and Labor OrganizationManagement and Consulting Services

Business ServicesBusiness Services
Employment• 7,071 is 3.2% of Lancaster County
employment in 2000• Grew 1,904 or 36.8% since 1995• Average earnings of $19,330*• 39% less concentrated than US average*

Business ServicesBusiness Services
Key SegmentsPersonnel Supply Services (736) (high
employment)Security Systems (7382) (good LQ and
CEC)Limited growth and improvement in
competitive position among most categories

Business ServicesBusiness Services
Top Occupations Hand packers Secretaries Plant and system operators Machine operators Carpenters Administrative support Janitors Office clerks Data entry keyer

Business ServicesBusiness Services
Top Employers Kelly Services (560) 1to1 Contact Centers (225) Diamond Medical Staffing (150)

EducationEducation
IndustriesDay CareElementary and Secondary SchoolsColleges and UniversitiesJob Training Services

EducationEducation
Employment• 14,226 is 6.5% of Lancaster County
employment in 2000• Grew 1,272 or 9.8% since 1995• Average earnings of $33,215• 28% less concentrated than US average*

EducationEducation
Key SegmentsVocational Schools (824) (moderate LQ,
good CEC)Elementary and Secondary (821) (good
growth)College and University (822) (good growth)Most of the segments are flat with regard to
competitive position
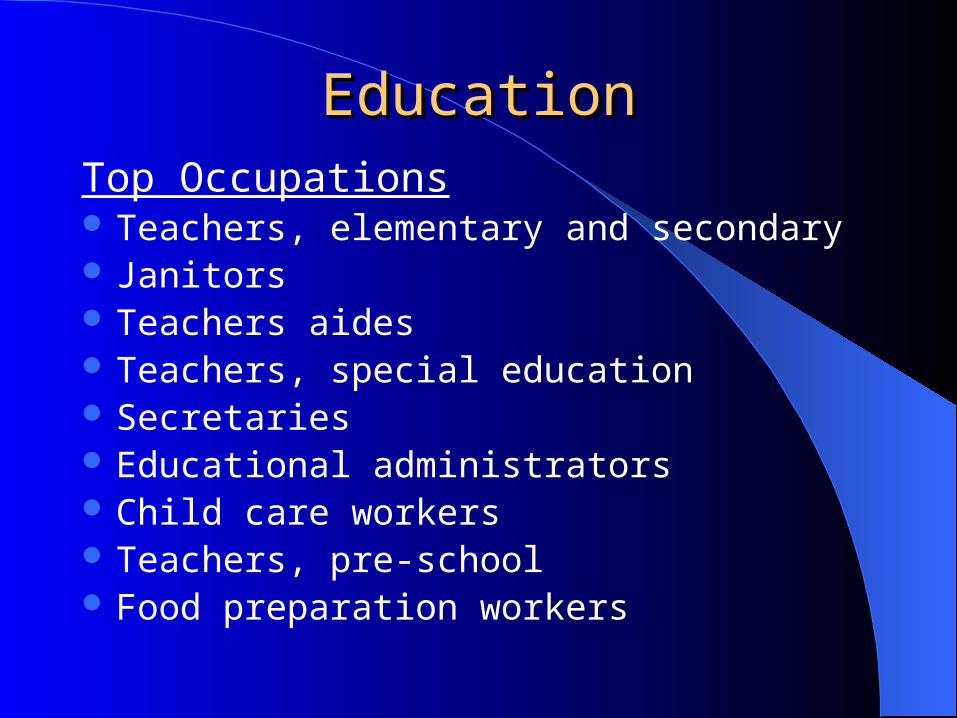
EducationEducationTop Occupations Teachers, elementary and secondary Janitors Teachers aides Teachers, special education Secretaries Educational administrators Child care workers Teachers, pre-school Food preparation workers

EducationEducation
Top Employers Lancaster-Lebanon Intermediate Unit #13 (1,600) School District of Lancaster (1,300) Millersville University (940) Hempfield School District (850) Manheim Township School District (600) Penn Manor School District (520) Warwick School District (525) Franklin and Marshall College (500)

Financial ServicesFinancial Services
IndustriesDepository and Non Depository InstitutionsSecurity and Commodity BrokersInsurance Carriers and AgentsReal EstateCredit Reporting and CollectionAccounting, Auditing, and Bookkeeping

Financial ServicesFinancial Services
Employment• 11,106 is 5.1% of Lancaster County
employment in 2000• Grew 1,382 or 14.2% since 1995• Average earnings of $35,418• 21% less concentrated than US average*

Financial ServicesFinancial Services
Key Segments Security and Commodity Brokers (620) (high
growth, high CEC) Insurance Carriers (630) (good growth, good CEC) Real Estate (650) (good growth, good CEC) Holding and Other Investment Offices (670) (good
growth, good CEC) Most segments grew and improved their
competitive position but are still far below average LQ

Financial ServicesFinancial Services
Top Occupations Tellers Accountants Accounting clerks Office managers Office clerks Secretaries Financial managers Insurance policy adjustment clerks

Financial ServicesFinancial Services
Top Employers Fulton Bank (460) Bank of Lancaster County (445) Farmers First Bank (410) CoreSource, Inc. (340) Blue Ball National Bank (275) Donegal Mutual Insurance Co. (210) Educators Mutual Life Insurance Co. (200) Westfield Group (200) HealthGuard (175)

HospitalityHospitality
IndustriesEating and Drinking PlacesHotels and MotelsCamps and ParksAmusement and RecreationMuseums and Zoos

HospitalityHospitality
Employment• 19,097 is 8.7% of Lancaster County
employment in 2000• Grew 1,997 or 11.7% since 1995• Average earnings of $12,495*• 44% less concentrated than US average*

HospitalityHospitality
Key SegmentsEating and Drinking Places (581) (large
employer, good growth)Hotels and Motels (701) (good growth)Amusement and Recreation (790) (good
growth, good CEC)Most segments grew with the two largest
losing competitive position

HospitalityHospitalityTop Occupations Waiter and waitress Food preparation workers Cooks Cashiers Maids Bartenders Hosts and hostesses Service supervisors and managers

HospitalityHospitality
Top Employers Shady Maple Farm Market and Smorgasbord
(640) Willow Valley Associates (500) Sight and Sound (380) Lancaster Host Resort (300) Thomas E. Strauss, Inc. (270) Eden Resort Inn (250)

RetailRetail
IndustriesBuilding Materials and Garden SuppliesGeneral MerchandiseFood StoresFurniture StoresPersonal Services

RetailRetail
Employment• 25,317 is 11.6% of Lancaster County
employment in 2000• Grew 3,826 or 17.8% since 1995• Average earnings of $18,705*• 17% more concentrated than US average
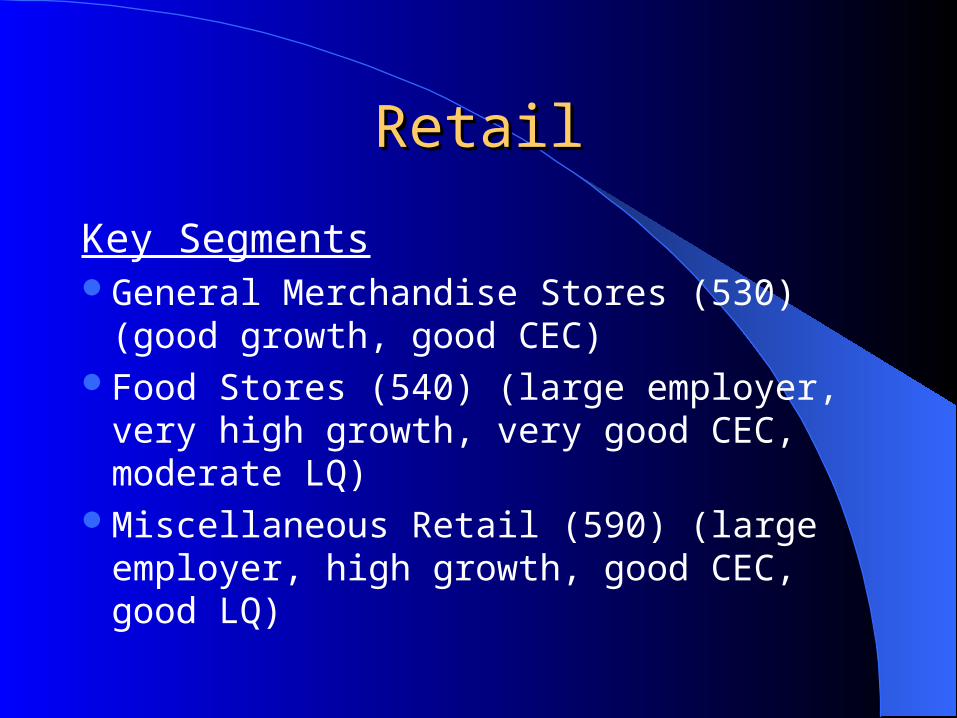
RetailRetail
Key SegmentsGeneral Merchandise Stores (530) (good
growth, good CEC)Food Stores (540) (large employer, very
high growth, very good CEC, moderate LQ)Miscellaneous Retail (590) (large employer,
high growth, good CEC, good LQ)

RetailRetailTop Occupations Retail salesperson Stock clerk Cashiers Sales supervisors Food preparation workers Hairdressers Office clerks Hand packers Truck drivers

RetailRetailTop Employers Giant Food Stores (620) Weis Markets Good’s Furniture (360) Doneckers, Inc. (310) Yoders Country Market (305) Weaver Markets (300) Oregon Dairy Farm Market (285) The Bon-Ton (250) The Sico Company (250) Sears, Roebuck & Co. (250)

TransportationTransportation
IndustriesLocal Passenger TransitTrucking and WarehousingTransportation by AirTransportation Services

TransportationTransportation
Employment• 5,460 is 2.5% of Lancaster County
employment in 2000• Grew 84 or 1.6% since 1995• Average earnings of $32,429• 28% less concentrated than US average*

TransportationTransportation
Key SegmentsTrucking and Warehousing (420) (good
LQ)Transportation by Air (450) (strong growth,
good CEC)Most of the industries in this cluster lost
competitive position in the period

TransportationTransportationTop Occupations Truck driver Transportation worker Bus driver Diesel mechanics Helpers and movers Office clerks Supervisors Dispatchers Travel Agents

TransportationTransportation
Top Employers Yellow Transportation (680)

Wholesale TradeWholesale Trade
IndustriesFurnitureProfessional and Commercial EquipmentMetals and MineralsElectrical GoodsMachineryFlowers and Miscellaneous

Wholesale TradeWholesale Trade
Employment• 4,911 is 2.2% of Lancaster County
employment in 2000• Grew 33 or .7% since 1995• Average earnings of $39,447• 11% less concentrated than US average

Wholesale TradeWholesale Trade
Key SegmentsMetals and Minerals (505) (good growth,
good CEC)Machinery and Supplies (508) (good LQ)Flowers and Nursery Stock (5193) ( high
LQ)

Wholesale TradeWholesale Trade
Top Occupations Sales representatives Assemblers Sales supervisors Truck drivers Secretaries and clerks Freight movers Stock clerks Order fillers

Wholesale TradeWholesale Trade
Top Employers QVC, Inc. (1,190) The Jay Group (300)

Other Lancaster CountyOther Lancaster CountyIndustry SegmentsIndustry Segments
Chemicals, Rubber, and PlasticsGovernmentPersonal ServicesTextilesTobaccoUtilities

Chemicals, Rubber, and Chemicals, Rubber, and PlasticsPlastics
IndustriesIndustrial ChemicalsSoap and CleanersPaintsPetroleum ProductsRubber and Plastic ProductsWholesalers

Chemicals, Rubber, and Chemicals, Rubber, and PlasticsPlastics
Employment• 4,530 is 2.1% of Lancaster County
employment in 2000• Grew 266 or 6.2% since 1995• Average earnings of $41,594• 51% more concentrated than US average

Chemicals, Rubber, and Chemicals, Rubber, and PlasticsPlastics
Key SegmentsSoap and Cleaners (284) (high LQ)Rubber and Plastics (300) (moderate LQ,
good growth, moderate CEC)Wholesale Petroleum Products (517)
(moderate LQ, good CEC)

Chemicals, Rubber, and Chemicals, Rubber, and PlasticsPlastics
Top Occupations Assemblers and fabricators Plastic mold and casting machine operators Extruding and form machine operators Shipping, receiving and traffic clerks Maintenance repairers Crushing, grinding, mixing machine operators Freight movers

Chemicals, Rubber, and Chemicals, Rubber, and PlasticsPlastics
Top Employers Dart Container Corporation (1,200) Exide Corp. (205)

GovernmentGovernment
IndustriesExecutive and LegislativeJustice, Public Order, and SafetyFinance and TaxationEnvironmental and EconomicNational Security

GovernmentGovernment
Employment• 3,704 is 1.7% of Lancaster County
employment in 2000• Grew 230 or 6.6% since 1995• Average earnings of $30,208• 68% less concentrated than US average*

GovernmentGovernment
Top Employers County of Lancaster (2,700) City of Lancaster (590)

Personal ServicesPersonal Services
IndustriesMotion PicturesLegal ServicesSocial ServicesCivic and Social AssociationPolitical OrganizationsReligious Organizations

Personal ServicesPersonal Services
Employment• 4,351 is 2.0% of Lancaster County
employment in 2000• Grew 314 or 7.8% since 1995• Average earnings of $24,023*• 37% less concentrated than US average*

Personal ServicesPersonal Services
Top Employers Community Action Program (380) The PAI Corporation (180) Goodwill Industries (160)

TextilesTextiles
IndustriesMill ProductsApparelPiece Goods and Notions

TextilesTextiles
Employment• 3,202 is 1.5% of Lancaster County
employment in 2000• Lost 1,235 or 27.8% since 1995*• Average earnings of $24,614*• 38% more concentrated than US average

TextilesTextiles
Top Employers Bollman Hat Co. (595) Weave Corp. (200) Donegal Industries (165) Hope Hosiery Mills (155)
TobaccoTobacco
IndustriesTobacco Products (agricultural)Wholesale Tobacco Products

TobaccoTobacco
Employment• 440 is .2% of Lancaster County
employment in 2000*• Grew 126 or 40.1% since 1995• Average earnings of $35,399• 342% more concentrated than US average

UtilitiesUtilities
IndustriesElectric, Gas, and Sanitary Services

UtilitiesUtilities
Employment• 909 is .4% of Lancaster County
employment in 2000• Lost 240 or 20.9% since 1995*• Average earnings of $48,740• 52% less concentrated than US average

UtilitiesUtilities
Top Employers PPL Corporation (350) UGI

Next StepsNext Steps
Integrate cluster priorities into policymaking processes;
Realign the workforce system around cluster priorities;
Better define career ladders and skills that support each cluster;
Study the implications for regional planning; Dialogue with economic development and
education on common vision.

ContactContact
Scott Sheely
Executive Director
Lancaster County Workforce Investment Board
313 W. Liberty St., Suite 114
Lancaster, PA 17603
717-735-0333