Embed Size (px)
Citation preview
Lancaster University Management School
Working Paper 2000/006
Corruption in Nigeria
Mohammed Salisu
The Department of Economics Lancaster University Management School
Lancaster LA1 4YX UK
©Mohammed Salisu All rights reserved. Short sections of text, not to exceed
two paragraphs, may be quoted without explicit permission, provided that full acknowledgement is given.
The LUMS Working Papers series can be accessed at http://www.lums.co.uk/publications
LUMS home page: http://www.lums.lancs.ac.uk/
Corruption in Nigeria
By
M. A. Salisu
Department of Economics
The Management School
Lancaster University, LA1 4YX
E-mail: [email protected]
This paper has benefited, without implications, from the encouragement and comments of V.N. Balasubramanyam and other members of the International Business Research Group (IBRG), Lancaster University. An earlier version of the paper titled "Corruption and Economic Growth in Nigeria" was presented at the International Economics Study Group (IESG) Easter Conference 2000, University of Wales Conference Centre, Gregynog. All comments from this Conference are gratefully acknowledged. I am, however, solely responsible for any errors.
2
Corruption in Nigeria
1 Introduction Nigeria, with a population of over 100 million people, is the most populous country in
Africa; one in five Sub-Saharan Africans is a Nigerian. At the time of political independence,
on 1st October 1960, Nigeria was known for her exports of agricultural products including
groundnut, palm oil, cocoa, cotton, beans, timber, and hides and skins. Then, during the oil
boom period of the seventies Nigeria made headlines with her oil wealth, as the country is
richly endowed with oil and natural gas resources capable of financing a number of important
projects to meet basic consumption and development needs. With a per capita income of
around $1100 during the late 1970s Nigeria was regarded as the fastest growing country in
sub-Saharan Africa, thanks to the oil windfall. Since then Nigeria has been rarely off the
world press, but mostly due to notoriety rather than fame. One persistent accolade conferred
on Nigeria is that it is one of the most corrupt countries in the world. The succession of
dictatorial regimes, disregard of human rights, political instability and economic
mismanagement have all contributed to cast Nigeria in a bad light internationally. These
factors have also served to undermine Nigeria's economic growth and development potential,
in terms of most development indicators. With a per capita income of $340 Nigeria now
ranks amongst the least developed countries in the World Bank league tables. The Nigerian
higher education system, once regarded as the best in sub-Saharan Africa, is in deep crisis.
Health services are woefully inadequate. Graduate unemployment is rising and so too is the
crime rate.
This sad state of affairs is despite the oil wealth. As the old cliché goes, oil has been a
blessing and a curse to Nigeria. It is a blessing because the oil wealth provided Nigeria with
an easy entry into international capital markets. It also allowed the country to embark on
large scale public and private sector projects. However, the oil bonanza has also introduced
opportunities for rent-seeking activities and corruption in both private and public sectors of
the economy. These, in turn, have changed Nigerian politics and intensified ethnic rivalry, as
access to and manipulation of the government-spending process has become the gateway to
fortune.
This paper provides an estimate of the extent of corruption in Nigeria and discusses its
causes and consequences. Section 2 briefly discusses definitional issues and attempts at
estimating corruption in various countries. Section 3 reviews the major causes of corruption
3
which are relevant for the analysis of corruption in Nigeria. Section 4 provides statistical
evidence on the magnitude of corruption and its impact on the Nigerian economy. Section 5
pulls together the main conclusions of the paper.
2 Definitional issues There are a number of definitions of corruption. The simplest definition, however, is that
it is the misapplication of public resources to private ends1. For example, public officials
may collect bribes for issuing passports or visa, for providing permits and licenses, for
authorising passage of goods at sea/air port, for awarding contracts or for enacting
regulations designed to create artificial scarcity.
In a broader sense, corruption can be defined as "an arrangement that involves an
exchange between two parties (the demander and the supplier) which (i) has an influence on
the allocation of resources either immediately or in the future; and (ii) involves the use or
abuse of public or collective responsibility for private ends" (Macrae, 1982, p.678). This
definition distinguishes the factors that influence the demand price and supply price of
'favours'. For instance, it is likely that in a military regime (or dictatorship), the demand price
for favours might exceed their supply price. The opposite may be true in a democratic
regime, as a corrupt representative is likely to evaluate the consequences of detection.
It is noteworthy that in a supply determined (briber-initiated) model of corruption the size
of the bribe, determined by the briber, is linked to the opportunity costs of time for the briber.
In a demand determined (bribee-initiated) model of corruption, however, the public servant
sets the price of corruption. In determining the size of the bribe, the official may be
influenced by a number of factors, such as imperfect information on the part of the briber,
family pressure, favouritism for a particular client and nepotism. Whether or not the supply
price exceeds the demand price of corruption depends on the nature of corruption, type of
governance and institutional framework for detecting and penalising corrupt officials. It is
likely that at a low price, people may demand a larger number of bribes to get a target
amount of money. So corruption may be very high in societies at a middle level, with highly
unequal income distribution and complex regulatory regimes. What then are the factors that
may influence supply price and demand price of corruption?
1 This definition is similar to that given by the World Bank, i.e. "the abuse of public power for private benefits" (Tanzi, 1998). For other definitions of corruption, see Theobald (1990) and Tanzi (1995).
4
3 Causes of Corruption Public choice theory, game theory and transaction-cost economics have all made important
contributions to the study of corruption (Rose-Ackerman, 1978; Macrae, 1982). Whilst
economists focus on the decision making of rational, self-interest seeking individuals
involved in corrupt transactions, political scientists have utilised a psychological profile of
government officials by incorporating moral integrity into their analyses. Other studies have
examined the link between specific organisational structures and incentives to corruption.
Empirical analyses, however, concentrate on three broad categories: government policy-
induced sources of corruption, natural resource endowments, cultural/socio-political factors.
i) Policy-induced sources of corruption Policy-induced sources of corruption arise when pervasive regulations exist and
government officials have an excessive degree of discretion in applying them. Private parties
may be willing to pay bribes to government officials in order to obtain pure rents that the
regulations may generate. As Tanzi (1994) argues, the problem becomes worse when
regulations lack simplicity and transparency. The following are some of the government-
induced sources of corruption that have been identified in the literature2.
• trade restrictions
• government subsidies
• multiple exchange rate practices and foreign exchange allocation
• low wages in the civil service relative to private sector wages or per capita GDP
Although the bulk of the theoretical literature on rent-seeking has generally concentrated on
quantitative restrictions upon international trade, it can be extended to cover other forms of
government restrictions upon economic activity. Whilst such rent-seeking competition may
sometimes be legal, in other instances it takes illegal forms, such as bribery, corruption,
smuggling and other 'hidden' activities. In fact, Krueger (1974) shows that the estimated
values of rents associated with 'underground' activities in India and Turkey for the year 1964
were quite considerable.

5
Multiple exchange rate practices and foreign exchange schemes (whose importance may
be proxied by parallel exchange market premia, such as those used by Levine and Renelt,
1992) also lead to corruption. In developing countries, in particular, where state-owned
commercial banks ration foreign exchange on the discretion of bank managers, the supply
price of bribes could be substantial.
ii) Natural Resource Endowments Endowments of natural resources, such as crude oil, provide a major source of economic
rents since they can be sold at a price that far exceeds their cost of extraction. Sachs and
Warner (1995) argue that resource-rich economies are more likely to be subject to extreme
rent-seeking behaviour than are resource-poor economies. In Nigeria, for example, oil
wealth has been attributed to be one of the main causes of the pervasiveness of rent-seeking
activities and corruption. The oil boom of the 1970s, in particular, was responsible for the
'Dutch Disease' syndrome in Nigeria; including contraction of agriculture (the principal non-
oil tradeable sector), appreciation of the real exchange rate and a loss of competitiveness of
agricultural exports. Although the appreciation of the exchange rate was an inevitable
response to the oil boom and an adjustment to a new equilibrium situation, the use of oil
boom resources to finance large scale public expenditure programmes introduced 'grand'
(political) corruption in Nigeria. The oil boom also engendered laxity in the selection criteria
and procedures in the case of many investment projects, resulting in the selection of projects
with low or even negative rates of return.
iii) Cultural and/or socio-political sources Sociological and/or cultural factors such as customs, family pressures on government
officials and ethnicity constitute potential sources of corruption. In Nigeria, although
traditional values of gift-giving and tributes to leaders often lead to what Brownsberger
(1983) describes as "polite corruption", the extent of such corruption is relatively small. The
prevalence of this kind of corruption in Nigeria is illustrated by Chinua Achebe (1959), in his
novel, Things Fall Apart. Here, a strong and determined young man, called Okonkwo, went
to the 'great man' of his Igbo village to ask a favour. In seeking the loan of yam3 seeds to
2 See Mauro (1995, 1997). 3 Yam is a tuber root, like cassava, grown in most parts of West Africa and the Carribean.
6
plant on his farm, Okonkwo brought a cock, a pot of palm-wine, a kola nut, and an alligator
pepper. Offering them to elder, he said:
'[Our father], I have brought you this little kola. As our people say, a man who pays respect
to the Great paves the way for his own greatness. I have come to pay you my respects and
also to ask a favour'.
Thus, Okonkwo's gift-giving constitutes 'polite' corruption. It should be noted, however, that
although gift-giving and tributes to leaders may lead to corruption, not every gift-giving
should constitute corruption. A number of authors (Wraith and Simpkins 1963, Lloyd 1967,
McMullan 1961) have pointed out that Africans know the difference between a polite
gratuity and a bribe and that traditional (Nigerian) culture does recognise that the community
leader has a duty to his people, and that this bars systematic exploitation of office. There are
also those who believe that modern bribery may not be seen as cognate with traditional gift-
giving since it takes place outside the context of a patron-client relationship. Ethnically, the
poor man's bribe to the faceless power he will never meet again is completely distinct from
his traditional gift to a patron.
In spite of the prevalence of polite corruption, much of Nigerian corruption is underlined
by the ethics of dependency relations, ethnic loyalties and attitudinal tendencies, such as
greed or love of ostentations, either in the culture at large or among a clique. Evidence of this
abounds in developing countries where a number of the elite have mismanaged their own
careers and financial affairs, the result being special temptations to corruption. This is again
illustrated in another novel by Chinua Achebe (1961), No Longer at Ease, where a young
civil servant in Nigeria ends up in debt from poor planning and is driven to corruption.
It is also noteworthy that poverty, political instability and other societal forces put
pressure on public servants to be corrupt. This is especially so when officials know that their
opportunities may vanish following a coup d'etat or a defeat at polls or their kinsmen place
expanded demands on them or they feel compelled to maintain a high visible standard of
living (Colins, 1965; Nye 1961). Similarly, where neither individuals nor organisations have
accumulated wealth for the legal support of their activities or families, politicians may feel
forced to apply public resources to personal or sectional ends by embezzling, taking bribes,
or distributing jobs and contracts politically.
7
In the case of the dominance of ethnic loyality in politics, as a source of corruption in
Nigeria, Brownsberger (1983) rightly attributes this to the colonialists who tried to pacify
warring groups by setting up administrative regions bearing little relation to local loyalties.
With independence and self-government, tribes who for centuries had dealt with each other
only through war and commerce were forced to co-operate. As a result, politicians in many
developing countries view their national governments as collections of resources and
opportunities for self-dealing, and that patronage and corrupt exchange would be the tool to
bind together various ruling coalitions.
These sociological and cultural causes of corruption are likely to continue for a long time
in Nigeria, unless credible legal enforcement measures are put in place. The forces which
deter corruption are often weak as some, if not most, of the law enforcement agencies are
themselves corrupt. In addition, rulers, politicians and civil servants are highly corrupt, and
professional organisations may be incapable of sanctioning their members. Wealthy people
who are known to be corrupt are regularly courted and honoured by communities, religious
bodies, social clubs and other private organisations. This implies that people who benefit
from the largesse of these corrupt people rarely ask questions. Clearly, such a liberal attitude
suggests that corruption is endemic in Nigeria.
Table 1 provides a cogent summary of the various determinants of corruption, many of
which fit the Nigerian situation. All of the factors relevant to Nigeria may be a result of
absence of a properly functioning market system.
Table 1: Factors influencing corruption 1. Wage Considerations: a) inadequate pay b) fringe benefits and other financial incentives 2. Inefficient internal control: a) inadequate supervision and control systems b) lack of explicit standard of performance for employees and
8
organisations c) poor recruitment and selection procedures for personnel d) too few or too many (non-transparent) rules and procedures (red tape) 3. Insufficient external control: a) law and order tradition, checks and balances b) lack of information made available to the public and freedom of press c) mechanisms for citizens' participation and complaint d) difficulty of proving cases in court e) high social acceptance of corruption 4. Statutory penalty rate: a) amount of fine, prison sentence b) administrative sanctions c) prohibition of being ever re-employed in the public sector d) penalties for relatives 5. Amount of distortions or opportunities in the economy:
a) pervasive government regulations b) high statutory tax rates, non-transparent tax regulations c) provision of government services short of demand
(government monopolies) 6. Other factors: a) cultural factors b) culture of bureaucratic elitism and education of civil servants
d) leadership e) ethnic diversity
Source: Van Rijckeghem and Weder (1997)
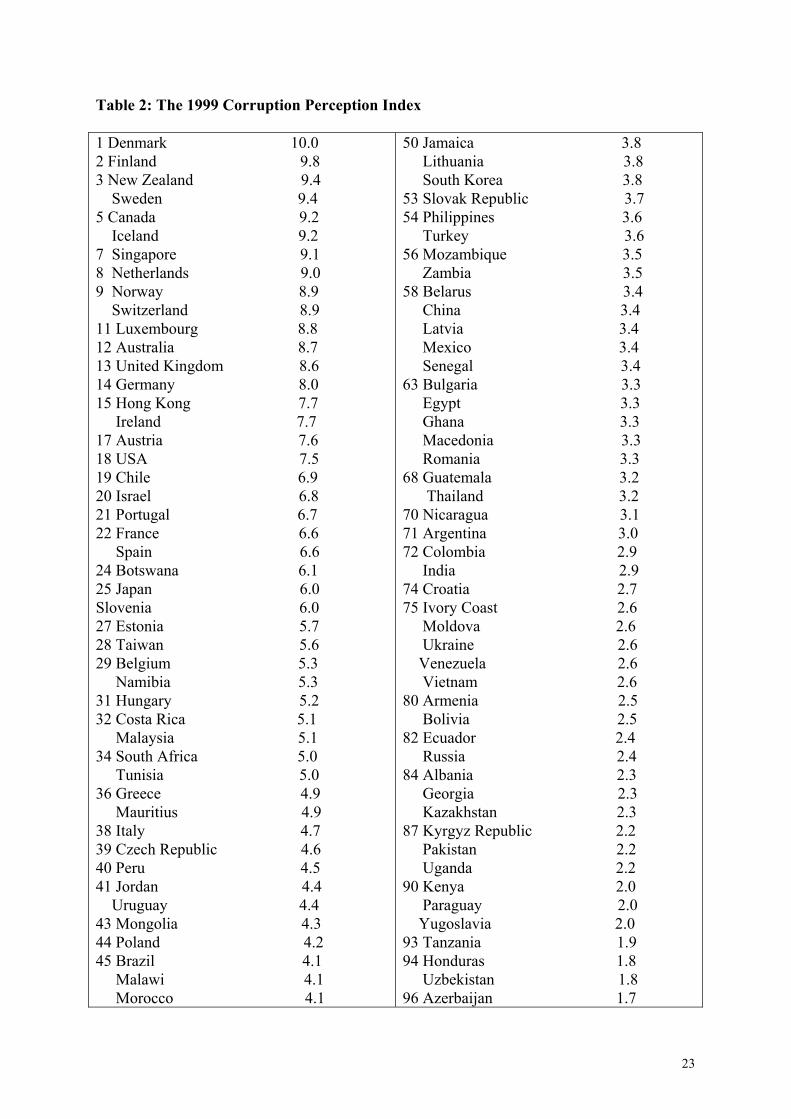
4 Statistical evidence As stated earlier, corruption is both pervasive and significant in Nigeria. For the past five
consecutive years, Nigeria has been ranked by the Berlin-based Transparency International as
the most corrupt country in the world (Table 2). This ranking was based on a weighted
average of corruption perception indices (CPI). The overall index assesses the degree to
which public officials and politicians in particular countries are involved in such practices as
accepting bribes, taking illicit payments in public procurement and embezzling public funds.
The index ranges from a score of 0 (a highly corrupt country) to 10 (a totally corrupt-free
country).
Few would dispute Nigeria's premier position in the corruption league table. Corruption is
found in virtually every stratum of society, but especially so in corridors of power – the
9
leadership. As the cliché goes, "keeping an average Nigerian from being corrupt is like
keeping a goat from eating cassava". Rarely is a distinction made between cash earned
privately and cash removed from the public purse. On the one hand, this attitude could be
attributed to a deep sense of obligation to one's family and ethnic group, but on the other
hand to selfishness, greed and avarice. The former viewpoint is reflected in the Financial
Times (1993) survey on Nigeria which found that a number of Nigerians see nothing wrong
with "using public funds to disperse favours to a cousin or to build a well for one's village, as
it is an informal means of redistributing wealth." Such an act is considered as a lubricant or a
positive sum game of "give and take" which is widely practised in employment offers, award
of contracts, import licences and even in obtaining admission to institutions of higher
education. The visible riches of these corrupt and the greedy spur the poor to imitate their
life styles and modes of acquisition of wealth.
The current democratically elected government of President Obasanjo who has welcomed
the 1999 corruption index table published by Transparency International. A statement issued
by the Presidential spokeman, Doyin Okupe, said:
"President Obasanjo has no objections to the results shown in the (Transparency
International) poll. The poll shows the magnitude of the challenge the present administration
is facing and addressing energetically. It should also draw further attention to the need for
Nigerians to collectively support the Federal Government's efforts to stem corruption and
redeem Nigeria's image with the international community." (Agence France-Presse,
October 27, 1999)4
Even so, many economic and political commentators in Nigeria have questioned the
Transparency International index. Firstly, the table consists of only less than half of the
countries in the world. Secondly, the corruption index reflects only the perception of business
people in the industrialised countries. Hence the corruption index concentrates solely on the
demand side of corruption whilst ignoring the supply side. Thirdly, the corruption index says
nothing about the weights attached to various sorts of corruption. In fact, it ignores the major
vehicle for bribery and corruption - the company to company kickbacks which involve
multinational companies from the so-called bribery-free countries of the developed world.
This omission is reflected in a warning by the Director of the Transparency International,
Peter Eigen, who said:
4 See, also, Transparency International web site http://www.gwdg.de/~uwvw/1999Press.html.

10
"corruption is perceived to be greatest in the Third World, but I urge the public to recognise
that a large share of the corruption is the explicit product of multinational corporations,
headquartered in leading industrialised countries, using massive bribery and kickbacks to
buy contracts in the developing world" (Agence France Presse, October 27, 1999).
He further added, "the Third World would be less corrupt if developed states stopped offering
bribes".
In view of this observation, Transparency International has now started to compile a separate
league table of Bribe Payers Index (BPI) to address the supply side of corruption in
developing countries.
i) Methodology The corruption index does not quantify the magnitude of corruption per se. It cannot
therefore be relied upon for evaluating the extent of corruption in monetary terms. While
there are no direct ways of measuring corruption, there are several indirect ways of getting
information about its prevalence in a country. These include reports on corruption availabe
from published sources including newspapers such as the Financial Times, The New York
Times, Le Monde, The Economist; case studies of corrupt agencies such as tax
administrations, customs, and police; and questionnaire-based surveys, relating to a specific
agency or a whole country. The World Bank has relied on some of these surveys in its work
on Tanzania, Uganda, India, Ukraine and other countries (Tanzi, 1998).
Anecdotal evidence on the magnitude of corruption in Nigeria can be found in media
sources and proceedings of various tribunals set up to investigate cases of alleged financial
impropriety on the part of government officials. Such evidence, however, does not tell the
whole story as it relates to isolated acts of corruption. It is therefore crucial to utilise some
methodological approaches to measure the magnitude of corruption. One such approach is
based on the technique for estimation of the size of the hidden economy. Bhattacharyya and
Ghose (1998) argue that the disaggregated hidden economy estimates are very informative in
identifying the growth of corruption. Evidence from India shows that the high rates of growth
of industrial sector's hidden economy during the 1980s and 1990s coincide with the timings
of a large number of corruption cases uncovered by the police departments in India
(Bhattacharyya, 1999).
ii) Modelling the 'hidden economy'
11
The black economy (also known as hidden, underground, irregular, unofficial, shadow or
illegal economy) is used to describe unreported activities or hidden transactions in an
economy. It is defined as that part of economic activity which generates factor incomes,
such as wages, salaries and profits arising from the production of goods and services, but
which cannot be estimated from the regular statistical sources used to compile the income
measure of gross domestic product (Frey and Weck-Hanneman, 1984).
Underground activities exist in every country but its size varies across countries,
reflecting differences in the tax burden, the sophistication of the regulatory system, success
in prosecuting tax offenders, and the degree of tax burden or tax 'morality'. But the incidence
of the black economy may be lower in the developed countries than in the developing
countries where the bulk of economic transactions are conducted in cash and policy makers
and politicians are relatively dishonest and corrupt. The size of the hidden economy may also
vary over time within the same country.
The existence of black economy leads to a gross underestimation of the true size of the
economy and may have considerable economic and political implications. It may bias the
calculations of effective tax rates as well as estimates of savings and consumption ratios. The
bias in the tax structure will have serious implications for budgetary requirements and for
income distribution in the society since people in the hidden economy evade taxation. Thus,
accurate estimates of the size of the black economy may help policy makers to formulate
efficient tax policies.
A number of techniques have recently been employed to estimate the size of the hidden
economy5. One such technique is the 'factor analytic' approach, based on the statistical
theory of unobserved or latent variables. A variant of this approach is the MIMIC (Multiple
Indicators and Multiple Causes) modelling, which is a special case of LISREL (Linear
Interdependent Structural Relationship) statistical model of Zellner (1970), Joreskog and Van
Thillo (1973), and Joreskog and Goldberger (1975).
A MIMIC is a structural econometric model for estimating an equation in which the
dependent variable is unobservable (latent). Frey and Weck-Hannemann (1984) pioneered
the use of MIMIC modelling in the context of the hidden economy. Since then, a number of
other studies have employed this technique (Aigner et al. 1986; Schneider 1997; Giles 1997,
1999; Tedds, 1998). It is a powerful technique for estimating the underground economy, as it
allows for simultaneous interaction between multiple explanatory variables and multiple
12
indicators of the hidden economy. The latent variable is linked, on the one hand, to a number
of observable indicators (reflecting changes in the size of the unreported economy); and on
the other hand to a set of observed causal variables, which are considered to be important
determinants of the unreported economic activity. The MIMIC model equations can be
written as:
y = λη + ε (1)
η = γ'x + ζ (2)
where y is a column vector of indicators of the latent variable, η, and x is a column vector of
"causes" of η. In other words, equation (1) is the measurement model for η and equation (2)
is the structural equation for the latent variable, η. ε and ζ are the measurement and structural
errors, respectively, and are assumed to be mutually uncorrelated.
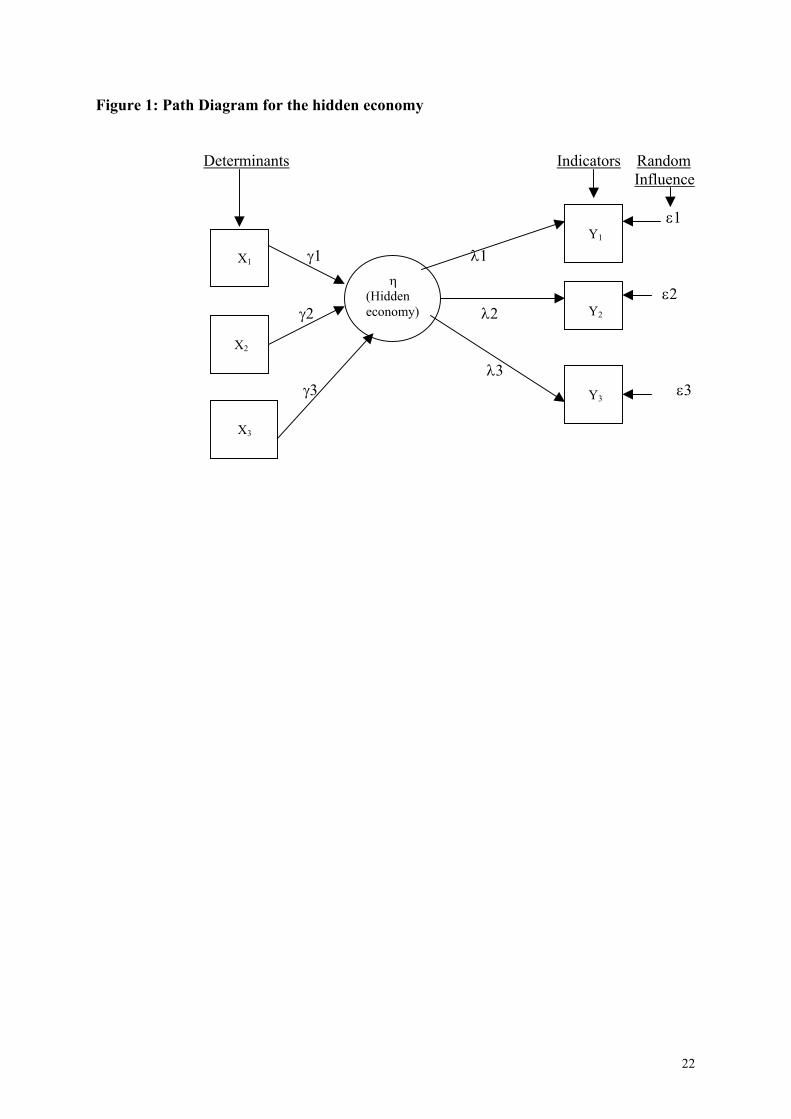
Figure 1 shows the interrelationships between the (unobservable) hidden economy (η), its
determinants (x) and the indicators (y). The theoretical literature on the hidden economy has
identified four broad determinants: burden imposed by the public sector on individuals (TB),
tax morality (TM), labour market conditions (L) and structural factors (SF). In this context,
and for purposes of estimating the size of the hidden economy (η), equation (2) can be re-
written as:
η = γ1TB + γ2TM + γ3L + γ4SF + ζ (2a)
The burden on the official economy may consist of burden of taxation (measured by either
the average or marginal tax rate) and the burden of regulation (measured by the number of
regulators or the ratio of the number of public sector employees to total employment). The a
priori expectation on the coefficient of the tax 'burden' is negative, implying that an increase
in the burden will drive people into the hidden economy. Tax morality, however, reflects the
readiness with which individuals leave the official economy. A decline in tax morality will
reduce people's trust in government and will consequently increase their willingness to go
underground. Frey, Weck and Pommerehne (1984) suggest that the consequences of tax
morality can be checked by a growing intensity of public controls and a rise in expected
punishment, which will reduce the return on hidden activities.
In the case of the labour market, it is hypothesised that the incentive to work in the hidden
economy is high for the unemployed, since they can work in the underground economy while
at the same time receiving unemployment benefits. It is noteworthy, however, that while the
5 For discussion of these approaches see Erard (1997) and Giles (1997).
13
demand for underground activity rises with unemployment, it is also likely that the supply of
job opportunities in the hidden economy will fall with rising unemployment. Overall, the
effect of unemployment on the shadow economy is ambiguous, depending upon the
elasticities of demand and supply with respect to the rate of unemployment.
The level of economic development can also influence the hidden economy. Individuals
with low per capita real disposable income will have a strong incentive to hold multiple jobs
and to pay taxes only on the first job. Empirical evidence from Italy, however, suggests that
the size of underground economy in the rich North is larger than in the poor South. This
positive relationship between per capita income and hidden economic activity suggests that
the supply of hidden economy jobs may increase with an increase in per capita income. The
expected sign of the coefficient of the level of development, however, is a priori ambiguous.
The theoretical literature on the hidden economy suggests three indicators: the growth rate
of the 'official' real GDP, labour market participation rate, and monetary variables. These
constitute the elements in the y vector in equation (1) above. An increase in the underground
economy implies that inputs (particularly labour) move out of the official economy, with a
depressing effect on the growth of the observed GDP. In the case of monetary aggregates, the
literature hypothesises a positive relationship between hidden economy activity and cash-
demand ratio, as the bulk of transactions are conducted in cash.
iii) Estimates of the hidden economy in Nigeria. In utilising the MIMIC approach to estimating the size of the hidden economy in Nigeria,
we use three types of determinants and two types of indicators of the hidden economy. The
causal factors are: tax burden (measured by the share of taxes in GDP), inflation and real per
capita income. We have not, however, included unemployment and sectoral variables in the
list of determinants due to lack of reliable data. The two indicators used in the MIMIC
analysis are changes in male participation rate (DMALEF) and changes in cash-demand
deposit ratio (DCPDD). The growth rate of GDP is excluded from the estimation to avoid
double counting.
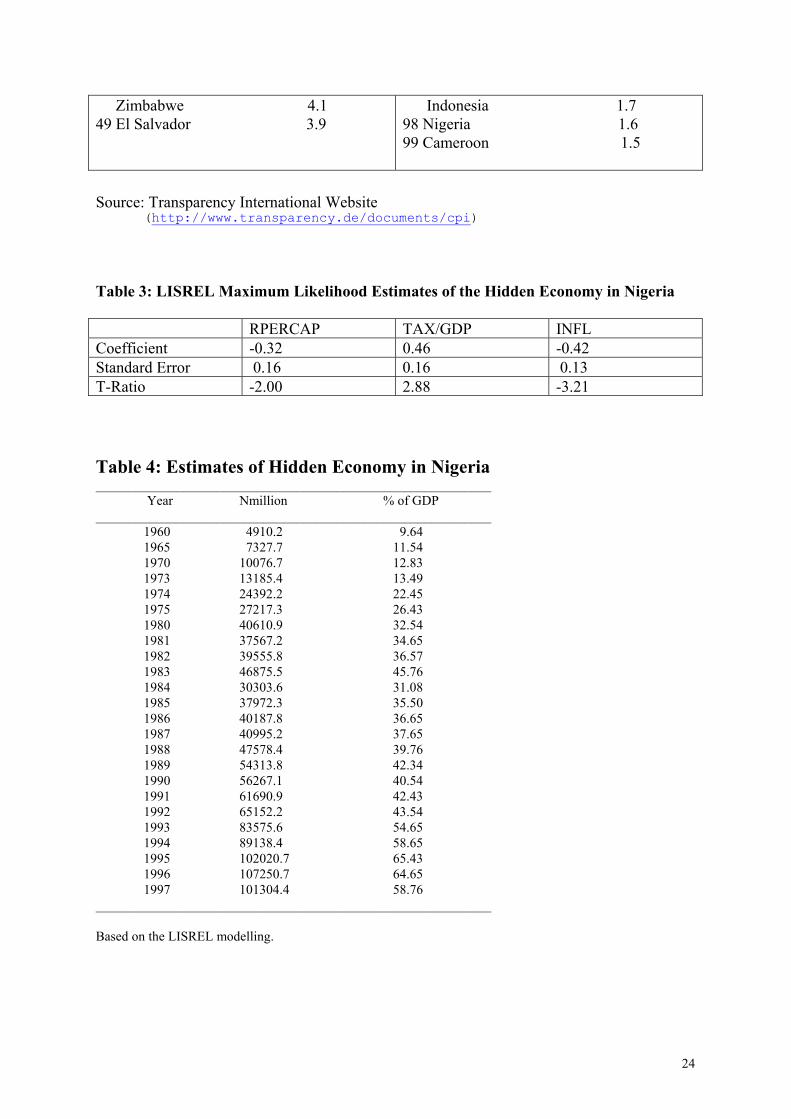
Table 3 shows the estimated parameters of the MIMIC model for the Nigerian economy
for the period 1960-1997. The LISREL coefficients of the tax rate (0.46), inflation (-0.42)
and per capita income (-0.32) all possess the expected signs and are statistically significant at
the 5 per cent. These estimated coefficients are then normalised to sum up to unity for
purposes of determining the size of the hidden economy. Table 4 shows the estimates of the
14
hidden economy for the years 1961-1997. The size of the hidden economy shows a rapidly
increasing trend; it increased substantially throughout the seventies and declined in 1984-85
before rising again. The declining trend in mid-1980s may reflect General Buhari’s new
measures to curb corruption and indiscipline. Tagged “War Against Indiscipline” (WAI) the
short-lived era of the Buhari administration had succeeded in reducing widespread
corruption in both public and private sectors of the economy. But with the ascendancy of
General Babangida to power and abolition of the decrees which empowered the WAI
campaign, the level of corruption rose again. Indeed, the Babangida administration has been
widely criticised as the worst military regime in Nigeria in terms of corruption and the
marginalisation of the middle class; as during his rule the rich became richer and the poor
poorer. Although Babangida's successor, the late General Sani Abacha, has revisited General
Buhari’s WAI policy by coining it “War Against Indiscipline and Corruption” (WAIC), it
had no effect whatsoever in curbing the tide of corruption even though it was generally
believed that the establishment of the Failed Bank Tribunals by General Abacha in 1995 had
instilled some financial discipline in the banking system. If anything, the magnitude of the
hidden economy has achieved record levels (over 60 per cent of GDP) during the Abacha era
(1993-1997). The present anti-corruption bill signed by President Obasanjo is designed to put
in place an appropriate institutional framework for dealing with the menace of corruption in
Nigeria.
iv) Econometric analysis of the impact of corruption To evaluate the effects of corruption on the Nigerian economy, we utilise the estimated
size of the hidden economy (a proxy for corruption) in an economic growth framework. The
procedure follows a conventional growth model in which corruption is introduced as an
input, in addition to labour and capital6. Table 5 shows estimated growth equation for Nigeria
during the period 1961-1997. The inclusion of exports into the equation follows the large
number of empirical studies which investigate the export-led growth hypothesis (e.g. Feder,
1983; Balassa, 1985; Salvatore and Hatcher, 1991; Greenaway and Sapsford, 1994).
As is widely expected, the estimated coefficient on corruption is negative and statistically
significant at the 1 per cent level. In contrast, the estimated coefficient on domestic
investment is also negative, but not significant. Although out of line with the theoretical
6 For a detailed discussion on the derivation of the growth regression equation in developing countries, see Balasubramanyam, Salisu and Sapsford (1996).

15
expectation, the negative investment coefficient is not surprising, as this shows the
inefficiency of domestic investment in Nigeria, which itself may have been severely
influenced by corruption. This result appears to lend support to the widely held view that
corruption encourages capital intensive projects in Nigeria. In other words, the efficiency of
investment is severely influenced by corruption. This finding concurs with conclusions of a
number of empirical studies elsewhere (e.g. Shleifer and Vishny, 1993; Mauro, 1997; Tanzi
and Davoodi, 1997; Ades and Di Tella, 1997) that corruption adversely affects the
productivity of public investment and distorts the effects of industrial policy on investment.
In the case of the labour force variable, the estimated coefficient is negative and
statistically insignificant. This suggests that in spite of the abundance of labour in the
country, it does not have any significant effect on growth. In contrast, exports, mainly
dominated by oil, appear to have an unambiguously positive and statistically significant
effect on economic growth in Nigeria.
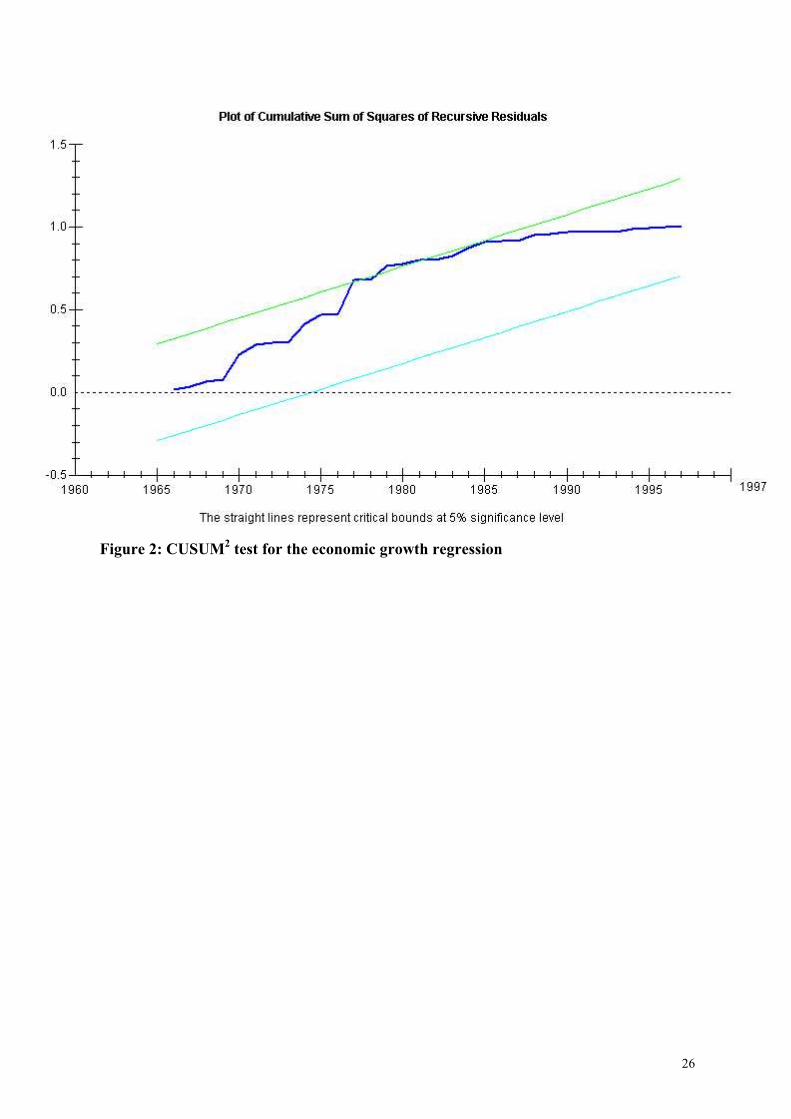
A Chow test for structural stability of the model shows evidence of a structural break in
the growth equation. The cumulative sum of squares (CUSUMSQ) of recursive residuals of
he model, plotted in Figure 2, suggests that a structural break has occured in 1978/79 which
coincides with the beginning of the second democratic experience and the second oil price
shock, both of which created opportunities for rent seeking activities in Nigeria.
5 Conclusions The paper has examined the various theoretical and empirical issues on the determinants
and impact of corruption. The statistical exercise on Nigeria suggests that the magnitude of
corruption is quite considerable, ranging from 11 per cent of GDP in the 1960s to around 60
per cent in the 1990s. This undoubtedly has had serious consequences for growth and
development in Nigeria. Econometric estimates of the link between corruption and economic
growth suggests that corruption has an adverse effect on the growth rate of GDP in Nigeria.
This perhaps explains why Nigeria is so rich and yet so poor. There is need for the current
Nigerian civilian administration to take the issue of corruption seriously and introduce
appropriate measures to remedy this cronic problem. The anti-corruption bill recently signed
by the Presidency is a right step in the direction, but appropriate incentive structures need to
be put in place if current efforts at fighting corruption were to have any meaningful results.
The political leadership in Nigeria must take honest and credible measures to (a) lead by
example, showing zero tolerance on corrupt behaviour; (b) develop credible institutional
16
(legal) framework for dealing with corrupt practices; (c) draw measures that would reduce
both the demand for and supply of corruption. On the demand side, the government should
scale down regulations and other policies with transparent honesty. On the supply side, this
can be done by taking appropriate measures that will improve public sector wages, incentives
towards honest behaviour, instituting effective controls and penalties on the public servants.
This aspect demands urgent attention as the perceived high correlation between corruption
and inefficiency of public servants may retard economic growth even in the absence of
corruption.
17
References
Achebe, C. (1959), Things Fall Apart (Greenwich edition). Achebe, C. (1961), No Longer At Ease (New York).
Ades, A. and Di Tella, R. (1997), "National Champions and Corruption: Some Unpleasant
Interventionist Arithmetic", Economic Journal, Vol.107, pp.1023-42.
Aigner, D.J., Schneider, F. and Ghosh, D. (1988), "Me and my shadow: estimating the size of
the hidden economy from time series data", in Barnett, W.A. (eds), Dynamic Econometric
Modeling: Proceedings of the Third International Symposium in Economic Theory and
Econometrics (Cambridge: Cambridge University Press)
Agency France Presse, October 27, 2000.
Balasa, B. (1985) "Exports, Policy Choices, and Economic Growth in Developing Countries
After the 1973 Oil Shock", Journal of Development Economics, Vol.18, pp.23-35.
Balasubramanyam, V.N., Salisu, M.A. and Sapsford, D. (1996), "Foreign Direct Investment
and Growth in Export Promoting and Import Substituting Countries", Economic Journal,
Vol.106, No.434, pp.92-105.
Bhattacharyya, D.K (1999) "On the Economic Rationale of Estimating the Hidden
Economy", Economic Journal, Special Supplement, Vol.109, pp.348-359.
Bhattacharyya, D.K. and Ghose, S. (1998), "Corruption in India and the hidden economy",
Economic and Political Weekly of India, Vol.33, No.44.
Brownsberger, W.N. (1983), "Development and Governmental Corruption - Materialism and
Political Fragmentation in Nigeria", The Journal of Modern African Studies, 21, 2,
pp.215-233.
18
Colins, L. (1965), "What is the problem about corruption?" The Journal of Modern African
Studies, 3, pp.215-244.
Erard, B. (1997), "A Critical Review of the Empirical Research on Canadian Tax
Compliance", Paper prepared for the Technical Committee on Business Taxation, Carleton
University, Ottawa.
Feder, G. (1983), "On Exports and Economic Growth", Journal of Development
Economics, Vol.12, pp.59-73.
Financial Times, Survey of Nigeria, 21 February 1993.
Frey, B.S. and Weck-Hanneman, H. (1984), "The Hidden Economy as an 'Unobserved'
Variable", European Economic Review, Vol.26, pp.33-35.
Frey, B. S., Weck, H. and Pommerehne, W.W. (1984), "Has the Shadow Economy Grown in
Germany? An Exploratory Study", Welwirtschaffliches Archiv, Vol.118, pp.499-524.
Greenaway, D. and Sapsford, D. (1994), "What does liberalisation do for exports and
growth?", Weltwirtschaftliches Archive, Vol.130, pp.152-73.
Giles, D.E.A. (1997), "The hidden economy and the tax-gap in New Zealand: a latent
variable analysis", Discussion Paper 97-8, Department of Economics, University of
Victoria.
Giles, D.E.A. (1999), "Measuring the Hidden Economy: Implications for Econometric
Modelling", Economic Journal, Special Supplement, Vol.109, pp.370-380.
Joreskog, K.G. and Goldberger, A.S. (1975), "Estimation of a model with multiple indicators
and multiple causes of a single latent variable", Journal of the American Statistical
Association, Vol.70, pp.631-639.
19
Joreskog, K.G. and Van Thillo, M. (1973), "LISREL: A general computer program for
estimating a linear structural equation system involving multiple indicators of unobserved
variables", Research Report 73-5, Department of Statistics, University of Uppsala.
Krueger, A. (1974), "The Political Economy of the Rent-Seeking Society", American
Economic Review, Vol.64, No.3, pp.291-303.
Levine, R. and Renelt, D. (1992), "A Sensitivity Analysis of Cross-Country Growth
Regressions", American Economic Review, Vol.82, pp.942-963.
Llyod, P.C., (1967), Africa in Social Change (Baltimore and Harmondsworth). Macrae, J. (1982), "Underdevelopment and the economics of corruption: A game theory
approach", World Development, 10, 8, pp.677-687.
Mauro, P. (1995), "Corruption and Growth", Quarterly Journal of Economics, Vol.110, pp.
681-712.
Mauro, P. (1997), Why Worry About Corruption? IMF Economic Series 6 (Washington:
International Monetary Fund).
McMullan, M. (1961), "A Theory of Change", Sociological Review, pp.181-196. Nye, J.S. (1961), "Corruption and Political Development: a cost-benefit analysis",
American Political Science Review, 56, pp.417-435.
Rose-Ackerman, S. (1978), Corruption: A Study in Political Economy (New York:
Academic Press).
Sach, J. and Warner, A. (1995), "Natural Resource Abundance and Economic Growth",
NBER Working Paper 5398 (Cambridge, MA: National Bureau of Economic Research).
Salvatore, D. and Hatcher, T. (1991), "Inward oriented and outward oriented trade
strategies", Journal of Development Studies", Vol.27, pp.7-25.

20
Schneider, F. (1997), "Empirical Results for the size of the shadow economy of Western
European countries over time", Working Paper 9710, Institut fur Volkswirtschaftslehre,
Linz University.
Shleifer, A. and Vishny, R.W. (1993), "Corruption", Quarterly Journal of Economics,
Vol.108, pp. 599-617.
Tanzi, V. (1994), "Corruption, Governmental Activities and Markets", IMF Working
Papers 94/99 (Washington DC: International Monetary Fund).
Tanzi, V. (1995), "Corruption, Arm's-Length Relationships and Markets", in Gianluca,
Fiorentini and Sam Peltzman (eds), The Economics of Organised Crime (Cambridge,
Mass.: Cambridge University Press).
Tanzi, V. (1998), "Corruption Around the World", IMF Staff Papers, 45, 4, pp.559-594.
Tanzi, V. and Davoodi, H. (1997), "Corruption, Public Investment and Growth", IMF
Working Paper 97/139 (Washington: International Monetary Fund).
Tedds, L. (1998), "Measuring the size of the hidden economy in Canada: a latent
variable/MIMIC model approach", Unpublished MA Essay, Department of Economics,
University of Victoria, Canada.
Theobald, R. (1990), Corruption, Development and Underdevelopment (Durham, North
Carolina: Duke University Press).
Transparency International Website, http://www.gwdg.de/~uwvw/1999Press.html.
Van Rijckeghem, C. and Weder, B (1997), "Corruption and the Rate of Temptation: Do Low
Wages in Civil Service Cause Corruption?", IMF Working Paper 97/73 (Washington:
International Monetary Fund).
21
Wraith, R. and Simpkins, E. (1963), Corruption in Developing Countries (London: Macmillan).
Zellner, A. (1970), "Estimation of regression relationships containing unobservable
variables", International Economic Review, Vol.11, pp.441-454.
22
Figure 1: Path Diagram for the hidden economy Determinants Indicators Random Influence ε1 γ1 λ1 ε2 γ2 λ2 λ3 γ3 ε3
η (Hidden economy)
X1
X3
Y2
Y1
Y3
X2
23
Table 2: The 1999 Corruption Perception Index 1 Denmark 10.0 2 Finland 9.8 3 New Zealand 9.4 Sweden 9.4 5 Canada 9.2 Iceland 9.2 7 Singapore 9.1 8 Netherlands 9.0 9 Norway 8.9 Switzerland 8.9 11 Luxembourg 8.8 12 Australia 8.7 13 United Kingdom 8.6 14 Germany 8.0 15 Hong Kong 7.7 Ireland 7.7 17 Austria 7.6 18 USA 7.5 19 Chile 6.9 20 Israel 6.8 21 Portugal 6.7 22 France 6.6 Spain 6.6 24 Botswana 6.1 25 Japan 6.0 Slovenia 6.0 27 Estonia 5.7 28 Taiwan 5.6 29 Belgium 5.3 Namibia 5.3 31 Hungary 5.2 32 Costa Rica 5.1 Malaysia 5.1 34 South Africa 5.0 Tunisia 5.0 36 Greece 4.9 Mauritius 4.9 38 Italy 4.7 39 Czech Republic 4.6 40 Peru 4.5 41 Jordan 4.4 Uruguay 4.4 43 Mongolia 4.3 44 Poland 4.2 45 Brazil 4.1 Malawi 4.1 Morocco 4.1
50 Jamaica 3.8 Lithuania 3.8 South Korea 3.8 53 Slovak Republic 3.7 54 Philippines 3.6 Turkey 3.6 56 Mozambique 3.5 Zambia 3.5 58 Belarus 3.4 China 3.4 Latvia 3.4 Mexico 3.4 Senegal 3.4 63 Bulgaria 3.3 Egypt 3.3 Ghana 3.3 Macedonia 3.3 Romania 3.3 68 Guatemala 3.2 Thailand 3.2 70 Nicaragua 3.1 71 Argentina 3.0 72 Colombia 2.9 India 2.9 74 Croatia 2.7 75 Ivory Coast 2.6 Moldova 2.6 Ukraine 2.6 Venezuela 2.6 Vietnam 2.6 80 Armenia 2.5 Bolivia 2.5 82 Ecuador 2.4 Russia 2.4 84 Albania 2.3 Georgia 2.3 Kazakhstan 2.3 87 Kyrgyz Republic 2.2 Pakistan 2.2 Uganda 2.2 90 Kenya 2.0 Paraguay 2.0 Yugoslavia 2.0 93 Tanzania 1.9 94 Honduras 1.8 Uzbekistan 1.8 96 Azerbaijan 1.7
24
Zimbabwe 4.1 49 El Salvador 3.9
Indonesia 1.7 98 Nigeria 1.6 99 Cameroon 1.5
Source: Transparency International Website
(http://www.transparency.de/documents/cpi) Table 3: LISREL Maximum Likelihood Estimates of the Hidden Economy in Nigeria RPERCAP TAX/GDP INFL Coefficient -0.32 0.46 -0.42 Standard Error 0.16 0.16 0.13 T-Ratio -2.00 2.88 -3.21 Table 4: Estimates of Hidden Economy in Nigeria ___________________________________________________________
Year Nmillion % of GDP ___________________________________________________________
1960 4910.2 9.64 1965 7327.7 11.54 1970 10076.7 12.83 1973 13185.4 13.49 1974 24392.2 22.45 1975 27217.3 26.43 1980 40610.9 32.54 1981 37567.2 34.65 1982 39555.8 36.57 1983 46875.5 45.76 1984 30303.6 31.08 1985 37972.3 35.50 1986 40187.8 36.65 1987 40995.2 37.65 1988 47578.4 39.76 1989 54313.8 42.34 1990 56267.1 40.54 1991 61690.9 42.43 1992 65152.2 43.54 1993 83575.6 54.65 1994 89138.4 58.65 1995 102020.7 65.43 1996 107250.7 64.65 1997 101304.4 58.76
___________________________________________________________ Based on the LISREL modelling.
25
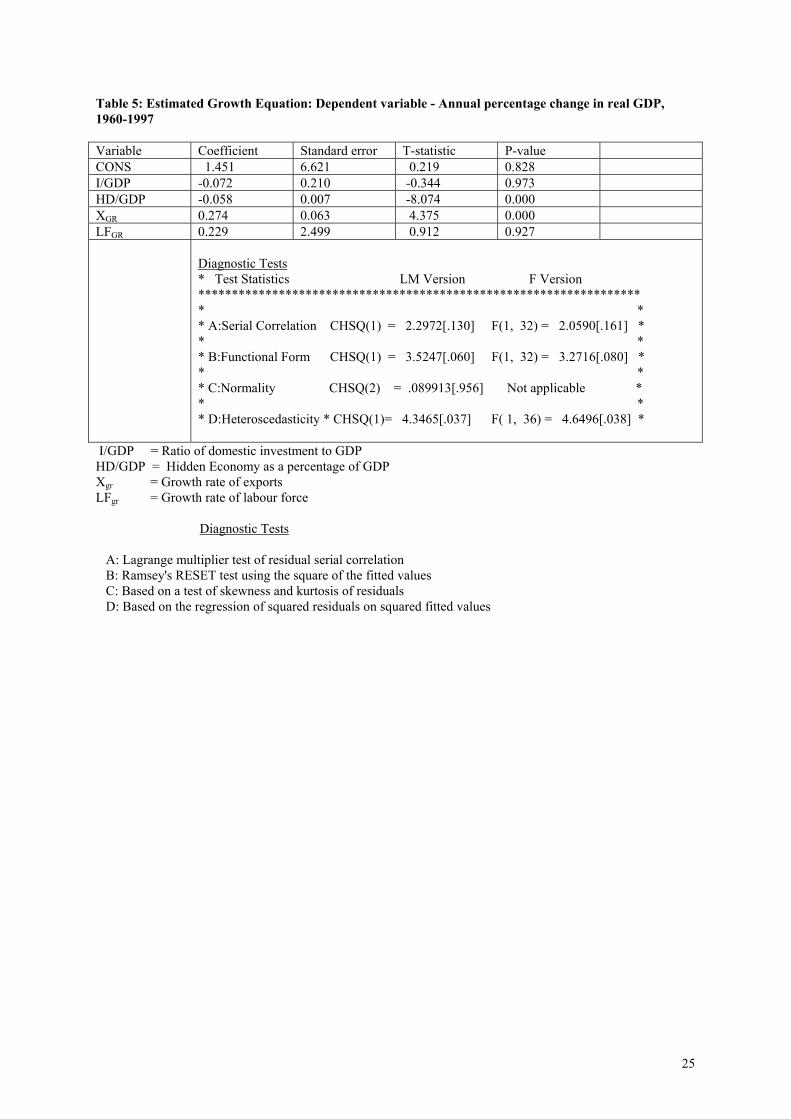
Table 5: Estimated Growth Equation: Dependent variable - Annual percentage change in real GDP, 1960-1997 Variable Coefficient Standard error T-statistic P-value CONS 1.451 6.621 0.219 0.828 I/GDP -0.072 0.210 -0.344 0.973 HD/GDP -0.058 0.007 -8.074 0.000 XGR 0.274 0.063 4.375 0.000 LFGR 0.229 2.499 0.912 0.927
Diagnostic Tests * Test Statistics LM Version F Version ****************************************************************** * * * A:Serial Correlation CHSQ(1) = 2.2972[.130] F(1, 32) = 2.0590[.161] * * * * B:Functional Form CHSQ(1) = 3.5247[.060] F(1, 32) = 3.2716[.080] * * * * C:Normality CHSQ(2) = .089913[.956] Not applicable * * * * D:Heteroscedasticity * CHSQ(1)= 4.3465[.037] F( 1, 36) = 4.6496[.038] *
I/GDP = Ratio of domestic investment to GDP HD/GDP = Hidden Economy as a percentage of GDP Xgr = Growth rate of exports LFgr = Growth rate of labour force Diagnostic Tests A: Lagrange multiplier test of residual serial correlation B: Ramsey's RESET test using the square of the fitted values C: Based on a test of skewness and kurtosis of residuals D: Based on the regression of squared residuals on squared fitted values
26
Figure 2: CUSUM2 test for the economic growth regression