Embed Size (px)
Citation preview

Land carbon and vegetation models at LSCE
Philippe Peylin, Philippe Ciais, N. Viovy, N. DeNoblet, V. Bellasem,
N. Vuichard, P. Cadule, P. Friedlingstein, F. Maignan,
H. Verbeeck, C. Bacour, C. Ottle,….

Continental surface modeling

Outline
Land surface model at LSCE: ORCHIDEE
Model evaluation at the site level& Recent model improvements
Running projects and Studies
Data Assimilation with ORCHIDEE

ORCHIDEE
• ORganizing Carbon and Hydrology In
Dynamic EcosystEms
• Process-driven global ecosystem model
• Energy, Water, Carbone, N, balances
• Plant Functional Types PFT’s approach• Computes its own phenology

Major processes simulated by ORCHIDEE
Photosynthèse nette
Respiration decroissance & maintenance
Allocation des assimilats
litière
Bilan de carbone et de nutriments
Flux de CO2
Concentration en CO2
Interception par la canopée
Infiltration, stockage, drainage
ruissellement de surface
Evapotranspiration
Humidité de l’air Précipitation
Solaire etinfra-rouge
Rayonnement Vitesse du vent
Turbulence de l’air
Température
conv
ectio
n de
cha
leur
sèc
he
Températurede la surface

Below groundCarbon cycle

ORCHIDEE performances(site level)
& Recent improvements

H(W/m2)
LE(W/m2)
Rn(W/m2)
ORCHIDEE
EC measurements
NEE(µmol/m2/mth)
Extensive evaluation over more than 30 sites
Average seasonalcycle

NACP model intercomparison : NEE

Water cycle validation
• Change in runoffcomparison with data
(Labat et al., 2004)
Piao et al., submitted
-1.0
-0.5
0.0
0.5
1.0
-1.0
-0.5
0.0
0.5
1.0
Ano
mal
ies
of to
tal r
unof
f (×
1012
m3 )
-2
-1
0
1
2
-2
-1
0
1
2
Year
1900 1920 1940 1960 1980 2000-3
-2
-1
0
1
2
3
-3
-2
-1
0
1
2
3
-4
-2
0
2
4
-4
-2
0
2
4
-1.5
-1.0
-0.5
0.0
0.5
1.0
1.5
-1.5
-1.0
-0.5
0.0
0.5
1.0
1.5
South America
North America
Africa
Europe
Asia
ORCHIDEE Observed

Recent improvements of ORCHIDEE
Natural grass
Bare soil / desert
Multi-layer soil hydrology’
AssimilationOf variables
Modules implementation
Forest
Crops
Managed grass Temperate Crops
grassland
Tropicalcrops
Forest management module
Nitrogencycle

50 100 150 200 250 300 3500
1
2
3
4
5
6
days
Winter wheat : LAI (leaf Area index)
Measurements
ORCHIDEE
50 100 150 200 250 300 3500
1
2
3
4
5
6
days
ORCHIDEE+STICS
STICS
Improve “phenology” for cropland
Πse
q (tC
ha-1
)
PASIM
Potential for soil carbon storage
Improve soil carbon estimatesfor managed pasture

Atmosphere (prescribed or
simulated by a GCM)
LAI, roughness, albedo
Soil profiles ofwater and temperature,
GPP
ORCHIDEEBiosphere
SECHIBAEnergy budget
Hydrology+
PhotosynthesisΔt=1 hour
Vegetation distribution(prescribed or calculate by LPJ
Dynamic General Vegetation model)
Add-ons:• Progressive increase of LAI_max
for 15 years after a clear-cut• Age-related decline in NPP
(LAI_max limited by height and v_max declines after 50 years)
• 2.5% of branches die each year
ORCHIDEE, coupled with FM module
STOMATEVegetation and soil
Carbon cycle
Δt=1 day
Prognostic phenology and allocation, constant mortality
rainfall, temperaturesolar radiation, CO2
concentration, ...
sensible and latent heat fluxes, albedo, roughness, surface temperature, CO2 flux...
NPP, biomass,litterfall ...
Vegetation typesbiomass
Forest management (FM)• Explicit tree distribution• Explicit mortality due to self-
thinning and human thinning• LAI limited by thinnings
A Forest Management Module for ORCHIDEE

Impact of management on stocks & fluxes
Effect of management on fluxes and stocksPeriodic decrease of above-ground stocksDrop in GPPSlow changes in soil carbon during the rotation
Carbon fluxes at stand scale Carbon stocks at stand scale
RESULTS with Forest Module

Validation: 2 different datasets
Permanent monitoring plots: LERFOB Yield tables: Teobaldelli et al., 2009
RESULTS with Forest Module
Data
Model
Circumference distribution

Running projects & studiesParameterizations
- Forest growth (V. Bellassem)- Wetland dynamics & CH4 emissions (S. Piao + PhD B.
Ringeval)- Frozen C decomposition (post-doc D. Khvorostyanov +
new post-doc)- Fire (Boreal: phD A. Rubtsov ; Global: collab. with Quest
group in UK)- Weathering of Carbonates (phD M. Roland + collab I.
Janssens)- Advanced soil C-N decomposition model (S. Zaehle +
post-doc)

Running projects & studies Regional developments
- Eastern China cold grasslands (phD K.Tan)- Siberian crop abandonment (post-doc N. Vuichard + collab. With R.
Valentini)- Carboafrica (phD P. Brender ?)- Arctic and boreal vegetation (phD Tao Wang ?)- Amazon (post-doc H. Verbeeck)- France (high resolution simulation ; future climate change impacts)- Europe (carboeurope)
- Model intercomparison with climate + CO2- New model intercomparison with Climate + CO2 + land use- Site level evaluation (ongoing)- Forest inventory NPP comparison

CarboEurope project
Mean Carbone Uptake by Europe : ~ 0.15 - 0.3 GtC/ yr
Impact of extreme climate events (i.e. 2003 summer drought)

Flux anomaly : 2003 vs Mean
Comparison of several biosphere models(CarboEurope project)
Anomalous C-release in 2003 : ~ 0.3 GtC / yr

Carbon sequestration due to the abandonment of croplands in the
former USSR since 1990
NEE
(g
C m
-2yr
-1)
Abandonment of cultivation
Croplands100% instant. aband.Realistic aband. scenario
Croplands100% instant. aband. 1993 2000
1993
cropland
2000
537.2 gC m-2
1993 2000
recovering grassland

Change in Northern Hemisphere Spring LAI
• A) detection
Piao et al., GRL, 2006
LAI trend (1982-2002)
ORCHIDEE offlineNOAA data

• B) Attribution
– Temperature– CO2
Piao et al., GRL, 2006
Change in Northern Hemisphere Spring LAI

+ 80 ppm
Friedlingstein et al., GRL, 2001Dufresne et al., GRL, 2002
850
750
650550
450
350
2501850 1900 1950 2000 2050 2100
Berthelot et al., GBC, 2002
Climate impact on land productivity
Coupled runWith impact of climate changeon the carbon cycle
CO2Emission
1860 2100
CO2CLIMATE
ClimateImpact
Carbon cycle
Atmospheric CO2
Uncoupled run
Coupled run
Climate-carbon cycle feedback

Cadule et al., in prep
Model validation withatmospheric CO2
• Seasonal cycle
• Long term trend

Cadule et al., in prep
Mauna Loa mean seasonal cycle
• Test on carbon cycle sensitivity to climate ?

Data assimilation system at LSCE
• Optimize model trajectory using currentcurrent observations (i.e. satellite fAPAR,…)
• Optimize model parameters using current observations (i.e. Flux data, atmospheric CO2,…)
• Optimize model initial conditions: C-pools

Optimizer BFGSJ(X) and dJ(X)/X
flux tower measurements
PFT compositionecosystem parameters initial conditions
parameters(X) ≠
J(X) M(X)
Yflux
satellitefAPARYfAPAR
J(X) J(X)
climate NEE, H, LE
Variational data assimilation system
Bayesian optimization
iterative minimization of J(X)bound constrained optimizationdJ(x)/dx computed using the Tangent Linear version of ORCHIDEE
J(X) = (Yfluxseason- M(x))T Rseason
-1 (Yfluxseason- M(x)) +
(YfAPAR - M(x))T RfAPAR-1 (YfAPAR - M(x)) +
(x-xp)T B-1 (x-xp)

Governing processes and parameters to optimize

1 year 1 year 1 year 1 year
AB
(97-
98)
BX
(97-
98)
TH
(98-
99)
WE
(98-
99)
FCO2 (gC/m2/Jour) FH2O (W/m2)
a priori model
Optimized model
Observations
Seasonal cycle fit: temperate conifers

Diurnal Cycle
a priori model
Optimized model
Observations
AB
(97-
98)
BX
(97-
98)
TH
(98-
99)
WE
(98-
99)
FCO2 FSENS(μmol/m2/s
)(W/m2) (W/m2)
FH2O
Diurnal cycle fit: temperate conifers
Diurnal Cycle Diurnal Cycle

Comparison with independant data: Kvmax
Leaves Age
Observations (Porté et al., 98)
Vc,jmax optimized
Vc,jmax a priori
Vcm
ax(μ
mol
m-2
s-1)
Vjm
ax(μ
mol
m-2
s-1)
Dependency of the carboxylation rates wrt leaves age

Saleska et al. Science, 2003
Wet Dry
Counterintuitive seasonal NEE patternsin (parts of) the Amazon
Carbon uptake during the dry season

Latent heat flux results
33
Soil depth (m)prior optim2.0 6.8
Higher soil depth confirms previous studies: e.g. Kleidon et al. 1999

NEE results
34
Tapajós km 67: Soil depth 10mReserve Jarú: Soil depth 3.5m
Counterintuitive behaviourExpected behaviour

NEE results
35
Optimisation with Vcmax and SLA varying each month
Leaf flush /increased photosynthetic capacity observed: field data (Malhado et al. 2009, Bonal et al. 2008); modelling (Poulter et al. 2009); remote sensing (Myneni et al. 2007).
Adaptation of leafs to high light conditions

Parameter Error correlations
36
Photosynthesis
Soil water stress on photosynthesis
Phenology
Respiration
Soil water stress on respiration

Assimilation of MODIS data
• Global scale assimilation..(following Demarty et al. 2005)
• Assimilation of MODIS fAPAR data to correct the simulated LAI of ORCHIDEE
correct the trajectory of the model

Assimilation of MODIS data
2000 GPP differences (assim – ref)gC/m^2/year
● On a global scale, assimilation of LAI MODIS for years 2000-2001
advance of the greening and decrease of the growing season length
over northern temperate latitudes
decrease of the GPP
● Improvement of 25% for GPP RMSE over 40 FLUXNET sites

Assimilation of MODIS data

Assimilation of MODIS data: validation

fAPA
RN
EE
(g
C/m
²/day
)Parameter optimization at site level:
can we use satellite fAPAR and Flux data ?
flux assimilation
PSPOT3
fAPAR assimilationPSPOT3
strong decrease of the carbon uptake during the growing season
observation prior
posterior
Fontainebleau: decideous forest

Model data fusion : Next steps for the Carbon Cycle ?
• Improve “Operational operators”- Satellite data use RT code
• Better handle non-linearities & Thresholds
• Multi-data assimilation systems- Data relevant for all temporal scales- in particular Biomass data, Atm. CO2, …
• Incude Water cycle data in the assimilation…
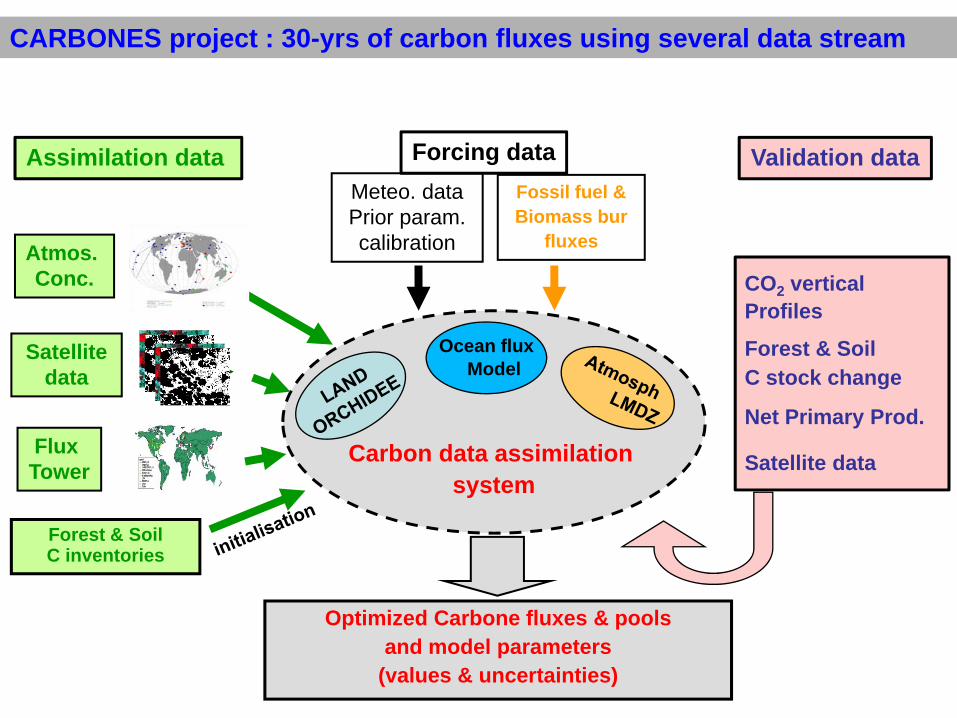
Carbon data assimilation system
Meteo. dataPrior param. calibration
Optimized Carbone fluxes & pools and model parameters
(values & uncertainties)
Satellite data
Atmos. Conc.
Fossil fuel & Biomass bur
fluxes
Flux Tower
Assimilation data Validation data
CO2 vertical Profiles
Forest & SoilC stock change
Net Primary Prod.
Satellite data
Forest & Soil C inventories
Forcing data
Ocean fluxModel
CARBONES project : 30-yrs of carbon fluxes using several data stream

Challenges for the Biogeochemical cycles
• Soil processes (carbon dynamic)
• Land use history
• Species competitions & Adaptation to climate changes
• Biotic effects on forests(i.e. insect damage)
• Lag effects of climate extreme
0
2
4
6
8
10
60 120 180 240 300
DOY
ΔC
(m
m)
2002
2003
2004
2005
Tree size increment (Beach forest)

Additional material

The terrestrial nitrogen cycle (PgN yr-1)
N2
NO3-1.7 NH4
+ 0.191.7organicresidue
denitrifiers
N2
ammonifiers
NH3+
glutaminesynthetase
nitratereductase
NH4+
fungus
[nitrogenase]
death
assimilation
uptake
uptake
Pools C:Nplant 17 36fungi 8 5bacteria 6 5dead N 132 11[atmos. 4x10⁶]
0.190.15
1.51
fixers
nitrifiers river flow
0.04
11
humus1.1

Water routing + irrigation computed in a consistent manner

Comparaison NDVI ORCHIDEE LAI
Anomalie de NDVI(MODIS)
Anomalie de LAI
(ORCHIDEE)
Pixel de forêt(Massif Central)

Extensive evaluation over more than 30 sites
Average diurnal cycle (JJA)
H(W/m2)
LE(W/m2)
Rn(W/m2)
ORCHIDEE
EC measurements
NEE(µmol/m2/mth)

Impact of critical periods on ecosystem C fluxes:
Lemaire et al. in prep

GPP TER
ObservationsORCHIDEE Model
CRITICAL PERIODS = HOT SPOTS
Assessing hot spots in data and model :

Long-term Proxies of extreme years relating drougth and C fluxes:
Crop Yields (FAO)
1976 2003
P.C. Smith et al. 2009, in press

Long-term proxies of extreme years relating drought and C fluxes:
C isotope of plant biomass in grassland (Rothamsted - England)
1976 2003
Eglin et al., in prep10 Dryest spring

Validation by remote sensing
FPAR modeled relativeanomaly (% of normal )
FPAR from MODISanomaly (% of normal)
FPAR Fraction of Absorbed Photosynthetically Active Radiationanomalies in summer (JAS)
2003
2005


![Modeling the Dynamic Vegetation–Climate System over China ...cas.nuist.edu.cn/TeacherFiles/file/20180824/... · Potsdam Jena (LPJ), Sitch et al. (2003)] and their cou-plingwithlandsurfaceandclimatemodelsimprovedthe](https://img.pdfslide.net/doc/110x75/5ca3b04d88c993ad338b68b0/modeling-the-dynamic-vegetationclimate-system-over-china-casnuisteducnteacherfilesfile20180824.jpg)