Embed Size (px)
Citation preview

Land Processes in a High Resolution Community Climate Model with
Sub-Grid Scale Parameterizations
Final Progress Report Project Number DE- FG03-98ER62606
May 1, 1998 - April 30,2002
R. E. Dickinson, PI School of Earth and Atmospheric Sciences
Georgia Institute of Technology Atlanta, Georgia 30332
Report Prepared by: Andrea N. Hahmann
Institute of Atmospheric Physics The University of Arizona Tucson, Arizona 85721
July 21, 2002

Contents
1 Introduction 3
1.1 Objectives . . . . . . . . . . . . . . . . . . . . . . . . . . . . . . . . . . . . . . . 3
1.2 Project milestones . . . . . . . . . . . . . . . . . . . . . . . . . . . . . . . . . . . 4
2 Research Overview 5
2.1 The fine-mesh model . . . . . . . . . . . . . . . . . . . . . . . . . . . . . . . . . 5
2.1.1 Interaction scheme . . . . . . . . . . . . . . . . . . . . . . . . . . . . . . 7
2.1.2 Performance . . . . . . . . . . . . . . . . . . . . . . . . . . . . . . . . . 7
2.2 Topographical aspects . . . . . . . . . . . . . . . . . . . . . . . . . . . . . . . . . 9
2.3 Precipitation disaggregation . . . . . . . . . . . . . . . . . . . . . . . . . . . . . 13
2.4 References . . . . . . . . . . . . . . . . . . . . . . . . . . . . . . . . . . . . . . . 15
A Submitted manuscripts 16
A.l Representing spatial sub-grid scale precipitation variability in a GCM . . . . . . . 16
B Publications. Abstracts. and Presentations 17
B . 1 Peer-Reviewed Publications . . . . . . . . . . . . . . . . . . . . . . . . . . . . . 17
B.2 Presentations . . . . . . . . . . . . . . . . . . . . . . . . . . . . . . . . . . . . . 19
2

CHAPTER 1
Introduction
1 . I Objectives
The characteristics of land important for climate are very heterogeneous, as are the key atmo-
spheric inputs to land, i.e. precipitation and radiation. To adequately represent this heterogeneity,
state-of-the-art climate models should represent atmospheric inputs to land, land properties, and
the dynamical changes of land at the highest resolution accessible by climate models. The re-
search funded under this project focused on the development of an alternative approach to this
problem in which a sub-mesh is imposed on each atmospheric model grid square. This allows rep-
resentation of the land climate dynamics at a higher resolution than that achievable in the global
atmospheric models. The high spatial detail of the fine-mesh treatment provides not only a more
accurate representation of land processes to the atmospheric model, but also the opportunity for
direct downscaling of the surface climate.
The proposed project continued the development and refinement of a high-resolution land sur-
face model that is compatible for inclusion into the National Center for Atmospheric Research
(NCAR) Community Climate Model (CCM), a state-of-the-art atmospheric general circulation
model (GCM) that is used for climate simulation and prediction.

DOE Final Report July 2002
1.2 Project milestones
1. Development of the fine-mesh model interface (Fall 1998);
2. Implementation of coupling interface into CCM3.2 (Fall 1998);
3. Upgrade of coupling interface for new computer architecture - CRAY to IBM SP migration,
FORTRAN77 to FORTRAN90 migration (Spring 1999);
4. Upgrade fine-mesh input/output procedures for compatibility with CCM3.6 (Spring 1999);
5. Development of sub-grid scale parameterizations for use within the fine-mesh model (Spring
2000):
0 Development of a physical/statistical scheme to perform the spatial disaggregation of
GCM precipitation into the fine-mesh model grid;
0 Computation of incident radiation on a sloped surface according to its topographic
slope and azimuth;
6. Development of land surface datasets to be used within the fine-mesh model (Spring 2001):
0 HR vegetation and soil compatible with CCM grid;
0 Land and ocean fractions for coupling interface;
0 HR slope and azimuth (development of aggregation procedure);
0 HR elevation dataset for future use with the topographic correction;
7. Publication of research results related to the fine-mesh model:
0 Fine-mesh model development, implementation, and impact in the simulation of cli-
mate published in Journal of Climate (Hahmann and Dickinson 2001);
0 Development and sensitivity analysis of the precipitation disaggregation scheme sub-
mitted to Journal of Hydrometeorology in April 2002 (Hahmann 2002);
4

CHAPTER 2
Research Overview
The research funded by DOE'S Climate Change Prediction Program (CCPP) described in this re-
port has focused on the development of the fine-mesh model interface and its sub-grid parameteri-
zations. The following briefly describes these developments.
2.1 The fine-mesh model
The fine-mesh model represents a land surface model interface that represents sub-grid scale land
heterogeneities by a sub-mesh imposed on each atmospheric model grid. A water and energy-
conserving scheme disaggregates atmospheric conditions to the fine-mesh model grid and aggre-
gates surface fluxes back to the atmospheric grid.
The developed interface is compatible for inclusion into the National Center for Atmospheric
Research (NCAR) Community Climate Model (CCM), and uses the Biosphere- Atmosphere Trans-
fer Scheme (BATS), which is described in Dickinson et a1 (1993), as its land surface scheme. The
current model setup is as follows:
0 Atmospheric model: NCAR Community Climate Model Version 3 (CCM3), T42 (approx-
imately 2.8' x 2.8'). Figure 2.la shows the distribution of BATS land types at this model
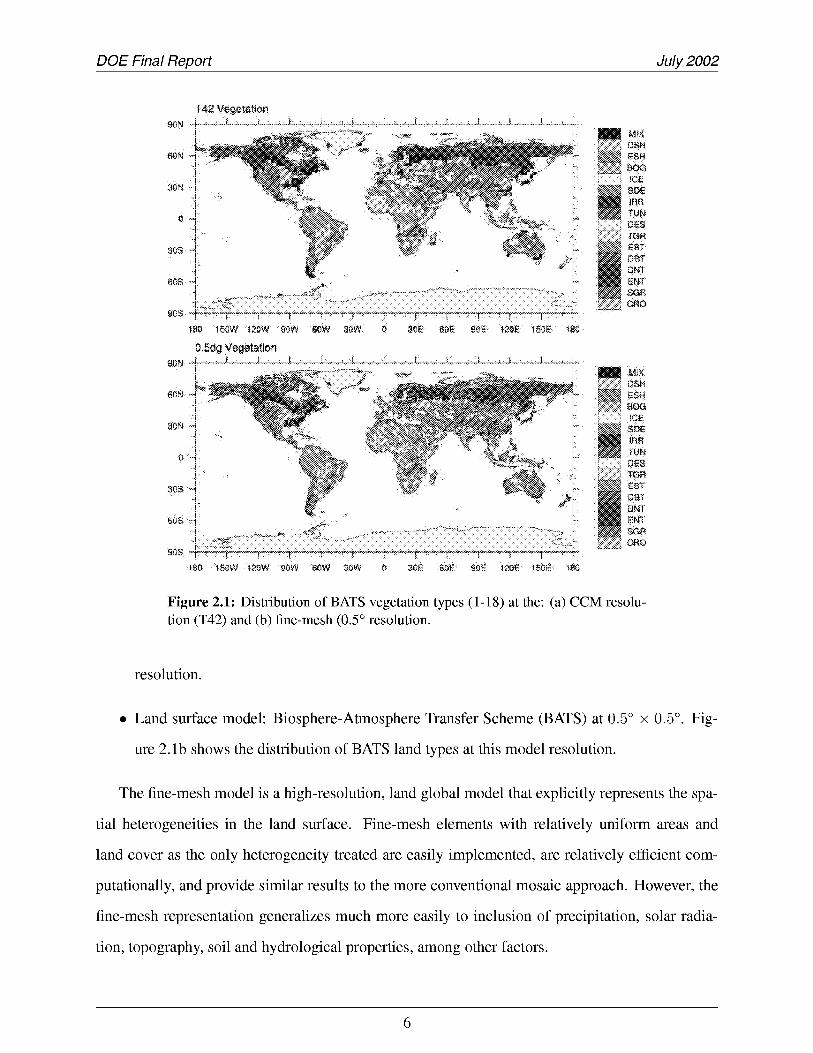
DOE Final Report July 2002
Figure 2.1: Distribution of BATS vegetation types (1-18) at the: (a) CCM resolu- tion (T42) and (b) fine-mesh (0.5" resolution.
resolution.
0 Land surface model: Biosphere-Atmosphere Transfer Scheme (BATS) at 0.5" x 0.5". Fig-
ure 2.lb shows the distribution of BATS land types at this model resolution.
The fine-mesh model is a high-resolution, land global model that explicitly represents the spa-
tial heterogeneities in the land surface. Fine-mesh elements with relatively uniform areas and
land cover as the only heterogeneity treated are easily implemented, are relatively efficient com-
putationally, and provide similar results to the more conventional mosaic approach. However, the
fine-mesh representation generalizes much more easily to inclusion of precipitation, solar radia-
tion, topography, soil and hydrological properties, among other factors.
6
DOE Final Report July 2002
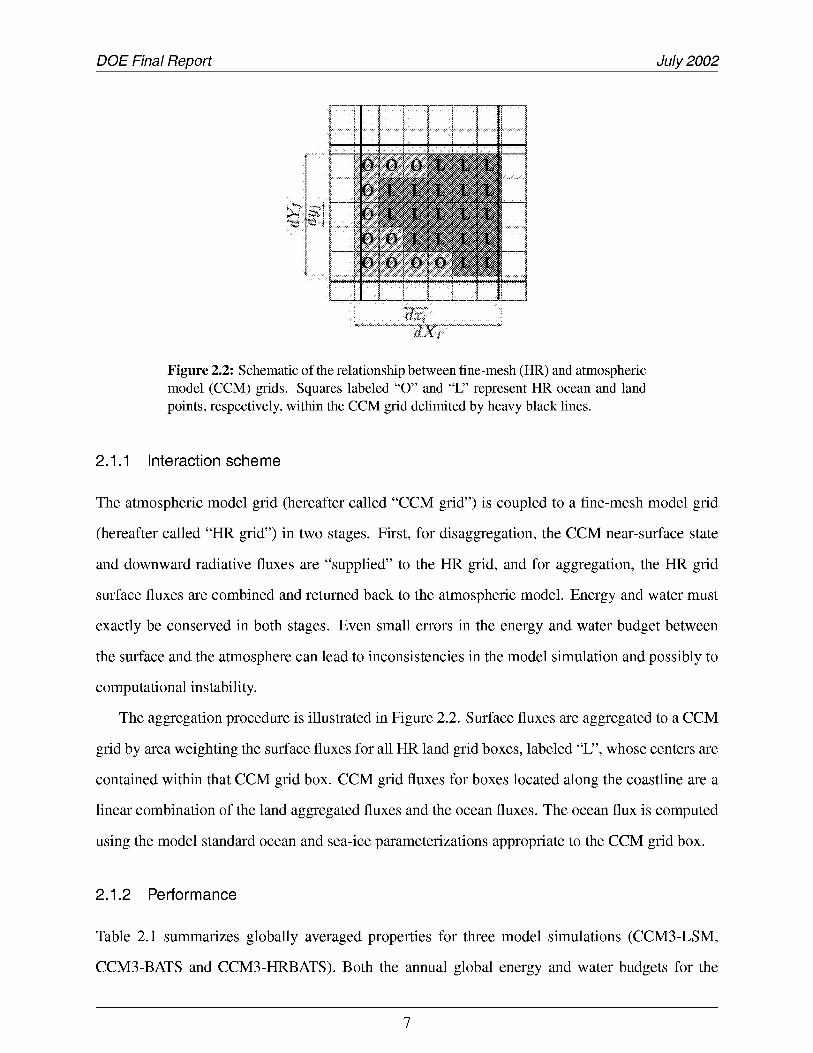
Figure 2.2: Schematic of the relationship between fine-mesh (HR) and atmospheric model (CCM) grids. Squares labeled “0” and “E’ represent HR ocean and land points, respectively, within the CCM grid delimited by heavy black lines.
2.1 .I Interaction scheme
The atmospheric model grid (hereafter called “CCM grid”) is coupled to a fine-mesh model grid
(hereafter called “HR grid”) in two stages. First, for disaggregation, the CCM near-surface state
and downward radiative fluxes are “supplied” to the HR grid, and for aggregation, the HR grid
surface fluxes are combined and returned back to the atmospheric model. Energy and water must
exactly be conserved in both stages. Even small errors in the energy and water budget between
the surface and the atmosphere can lead to inconsistencies in the model simulation and possibly to
computational instability.
The aggregation procedure is illustrated in Figure 2.2. Surface fluxes are aggregated to a CCM
grid by area weighting the surface fluxes for all HR land grid boxes, labeled “E’, whose centers are
contained within that CCM grid box. CCM grid fluxes for boxes located along the coastline are a
linear combination of the land aggregated fluxes and the ocean fluxes. The ocean flux is computed
using the model standard ocean and sea-ice parameterizations appropriate to the CCM grid box.
2.1.2 Performance
Table 2.1 summarizes globally averaged properties for three model simulations (CCM3-LSM,
CCM3-BATS and CCM3-HRBATS). Both the annual global energy and water budgets for the
7

DOE Final Report July 2002
Table 2.1: Global and global land annual average properties. Positive fluxes correspond to those downward to the surface.
Observed CCM3 CCM3 CCM3 LSM BATS HRBATS
Global: Outgoing longwave radiation (W mP2) TOA absorbed solar radiation (W mP2) Latent heat flux (W mP2) Sensible heat flux (W mP2) Net surface solar radiation (W mP2) Net surface longwave radiation (W mP2) Precipitation (mm day-')
Global Land (149 x lo6 km2): Latent heat flux (W mP2) Sensible heat flux (W mP2) Net surface solar radiation (W mP2) Net surface longwave radiation (W mP2) Surface net radiation (W mP2) Precipitation (mm day-') Surface runoff (mm day-') 2-meter temperature (K) Surface skin temperature (K) Surface albedo (%) Surface albedo (6O0S-60"N) (%)
-234.8 238.1 -78.0 -24.0 168.0
2.69 -66.0
-
-
-
-
-
2.24 0.73
282.9 -
-
-
-236.4 236.6 -89.4 -20.5 170.9
3.07
-43.9 -31.0 144.3
76.0 2.26 0.92
280.1 280.6
24.5 20.4
-60.8
-68.3
-236.6 236.2 -90.1 -20.9 170.3
3.09
-45.3 -32.0 142.7
-65.3 77.4 2.33 0.75
280.5 280.2
25.0 20.8
-59.8
-236.1 235.7 -91.1 -20.1 169.6
-59.0 3.13
-51.8 -29.7 141.1
78.2 2.42 0.70
280.5 280.3
24.1 19.6
-62.9
three model simulations are almost indistinguishable, and are closer to each other than either is to
the observations.
Global land statistics, however, do show a few notable differences. Land surface temperatures
are warmer (by 0.4"C) in CCM3-BATS than in CCM3-LSM, consistent with larger net surface ra-
diation (by 1.4W mP2). Latent and sensible heat fluxes are larger in CCM3-BATS than in CCM3-
LSM, and precipitation in CCM3-BATS is greater by 0.07mm day-', consistent with a more vig-
orous hydrological cycle. CCM3-HRBATS shows increases in fluxes of latent heat (-6.SW mP2)
and decreases in fluxes of sensible heat (2.3W mP2) from the CCM3-BATS simulation, which are
associated to increased soil water content. These changes are accompanied by increases in land
precipitation (from 2.33 to 2.42 mm day-') and low cloud fraction (1.6%), implying in a decrease
in the net downward shortwave flux (- 1.6W mP2) and an increase in the net upward longwave
flux (-2.4W mP2) at the surface.
How surface temperature and precipitation differ geographically between the CCM3-BATS
and CCM3-HRBATS simulations is shown in Figure 2.3 and Figure 2.4 for the periods December-
8

DOE Final Report July 2002
CGM3-HRBATS - CCM3-BATS z m tsmpeietatuta
Figure 2.3: (a) DJF and (b) JJA differences (CCM3-HRBATS minus CCM3-BATS), in 2- meter temperature (“C) between model simula- tions. Contour interval on color bar. The shaded regions show the 95 % level significance accord- ing to the Student’s t-test of these differences
Figure 2.4: (a) DJF and (b) JJA differences (CCM3-HRBATS minus CCM3-BATS), in total precipitation (mm day-’) between model simu- lations. Contour interval on color bar. The shaded regions show the 95% level significance accord- ing to the Student’s t-test of these differences.
February (DJF) and June-August (JJA). These figures also show the Student’s t-test of these dif-
ferences at the 95% level. Sub-grid disaggregation parameterizations
The next step in the development of the fine-mesh model is to introduce physically based
parameterizations that allow for non-uniform distribution of the atmospheric forcing. Two such
parameterizations are presented here: a parameterization for the horizontal distribution of rainfall
and the inclusion of the geometrical properties (slope and azimuth) of the terrain.
2.2 Topographical aspects
The surface of the Earth is composed of nonuniform terrain which partially controls the amount
of incident radiation available at the surface and in turn controls regional vegetation, hydrology
and ecology. Accurate land surface-atmosphere transfer interactions may require the terrain to
9

DOE Final Report July 2002
Figure 2.5: (top) Distribution of slopes and azimuths at lkm resolution for the western United States. Figure 2.6: (bottom) Distribution of aggregated slopes and azimuths at 0.5” resolution for the western United States. The aggregation is optimized to preserve incident solar radiation.
be viewed as homogeneous sub-regions of slope and aspect, particularly over complex terrain.
Processes associated with net solar radiation and hydrology are sensitive to the degree to which the
surface slope and aspect are approximated.
The effect of topographic differences are taken into account by including the slope and the
aspect of each grid point in the computation of the incident solar radiation to be used by the land
surface scheme.
Aggregated slopes and aspects derived from the HydrolK Elevation Derivative Database, are
calculated as “radiative mean” slopes and “radiative mean” aspects, which give the equivalent
amount of radiation for each of the fine-mesh grid considered.
10

DOE Final Report July 2002
Figure 2.7: Incident solar radiation (W mP2) for a flat (pink dash line) and a surface oriented North (aspect=341") with a slope of 3.76" (green solid line). line).
Figure 2.8: Incident solar radiation (W mP2) for a flat (pink dash line) and a surface oriented South (aspect=175") with a slope of 3.56" (green solid
The original and aggregated slope and aspect data sets for the southwestern U.S. are shown in
Figure 2.5 and Figure 2.6, respectively.
The simulated direct incident solar radiation differences between inclined and flat surfaces
confirm what it is expected from theory: a north looking slope receives less radiation than a flat
surface, whereas a south looking surface receives more radiation. The diurnal variation of incident
solar radiation for a north oriented surface is shown in Figure 2.7, while the diurnal incident solar
radiation for a south oriented surface is shown in Figure 2.8.
Simulations using CCM3 coupled with the 0.5" fine-mesh model are evaluated in terms of their
snow depth and cover. A three-month ("melting season", i.e. JFM) simulation for the difference in
snow equivalent water depth between a run with implemented topography and a control run with
no topography, indicates substantial differences for the world's most important topographic areas.
To better understand the influence of topography, one needs to examine a particular GCM grid
squares where the dominant distribution of the slopes is known.
For the south oriented surface (Figure 2.9), the model shows consistent links between all quan-
tities: more solar radiation correlated with less snow, more cloud coverage correlated with more
precipitation and its associated increase in snow cover.
11

DOE Final Report July 2002
Figure 2.9: Incident solar radiation (top left), snow fraction (top right), total cloud cover (middle left), total precipitation (middle right), snow cover water equivalent depth (bottom left) and first model level air temperature (bottom right) for a grid square with dominant south orientation. Lines represent: pink (HRBATS control) and green (HRBATS + slope).
The highest snow water equivalent difference is seen where radiation-snow depth correlation is
positive, (even though the topography run receives less radiation than control one, as we expected),
the difference in cloud coverage and in temperature are consistent; there is high cloud coverage
and negative temperatures, which together, do not allow snow melting, whereas less clouds but
positive temperatures make all the radiation received (even small amounts of it) to melt the snow
accumulated.
Two important conclusions we be can draw from this preliminary study:
1. Introducing topography into the fine-mesh model coupled to CCM3 produces changes con-
sistent with the physical quantities they modify. That is most changes in parameters such as
snow cover and depth are seen over mountainous terrain.
2. In many regions multiple feedback mechanisms complicate the interpretation of the model
results.
12

DOE Final Report July 2002
Figure 2.10: Schematic representation of the CCM (green lines) and Fine-Mesh (thin blue lines) grids. Blue boxes represent grid points where precipitation occurs.
2.3 Precipitation disaggregation
In addition to the inherent sub-grid nature of surface characteristics, the inputs, or “forcings”,
from the atmosphere to the land surface are also highly heterogeneous. The most variable of these
forcings is the precipitation field.
One approach in incorporating sub-grid scale precipitation variability in land surface models
is to consider its statistical representation within the GCM grid square. Most models that use
this approach assume that rainfall is patchy, and falling only on a small fraction of the GCM grid
square. The statistical distribution of rainfall is then incorporated into the equations controlling
hydrological processes such as the runoff generation and evapotranspiration.
Within the fine-mesh model we have chosen to explicitly represent rainfall variability within a
GCM grid square. We assume that the majority of precipitation events occur over a small fraction
of the entire grid square. For simplicity, we also assume that the spatial distribution of precipitation
is uncorrelated in time.
The procedure used within the fine-mesh model follows. Consider a GCM grid square com-
posed of N x M sub-grid squares. The disaggregation scheme first chooses a single grid random
point (2 , j ) among all possible sub-grid squares. The amount of rainfall received by this point is
determined by an exponential distribution of rainfall rates within the GCM grid square. This pro-
13

DOE Final Report July 2002
1
Figure 2.11: CCM3/HRBATS + disaggregation scheme (p = 0.2) minus control differences in the first model layer temperature (K) for DJF (top) and JJA (bottom). Contour interval of 1.O”C. The shaded regions show the 95% level significance according to the Student’s t-test of these differ- ences.
Figure 2.12: CCM3/HRBATS + disaggregation scheme (p = 0.2) minus control differences pre- cipitation (mmday-l) for DJF (top) and JJA (bottom). Contour interval of 0.5, 1.0, and 2.0mm day-’. The shaded regions show the 95% level significance according to the Student’s t-test of these differences.
cess is iterated until a fraction p of the GCM grid square (or, p x N x N sub-mesh grid points) is
covered with rainfall. Fine-mesh precipitation amounts are then normalized to conserve the GCM-
produced precipitation. A schematic representation of the scheme is presented in Figure 2.10.
The exponential distribution of fine-mesh rainfall is highly attractive because it depends on a
single parameter, the “wetting” area, which could potentially be estimated from observations of
rainfall or the thermodynamical structure of the large-scale environment.
The differences in surface temperature and precipitation between the control (CCM3-HRBATS)
and CCM3-HRBATS with p=0.2 simulations are presented in Figure 2.1 1 and Figure 2.12. Changes
in near-surface temperatures include cooler land (1°C) over most of the mid and high-latitude con-
tinents in the Northern Hemisphere during D F . In the tropics, the reductions in evapotranspiration
lead to significant warming (1-2°C) in both DJF and JJA.
14
DOE Final Report July 2002
Changes in precipitation are mainly confined to the tropical area. During DJF, there are large
and significant differences in precipitation over tropical land, with decreases of the order of 1-2
mm day-' over the Amazon and tropical Africa. During JJA, the largest differences in precipita-
tion migrate north, with increases over northern South America and Central America and India,
and an area of significant decreases in precipitation over the central United States.
Results from this aspect of our research have recently been submitted for publication. A copy
of the abstract of this manuscript (Hahmann 2002) is available in Appendix A.
2.4 References
Hahmann, A. N., 2002: Representing spatial sub-grid scale precipitation variability in a GCM. J.
Hydrometeorology. Submitted.
Hahmann, A. N., and R. E. Dickinson, 2001: A fine-mesh land approach for general circulation
models and its impact on regional climate. J. Climate, 14, 1634-1646.
1s

APPENDIX A
Submitted manuscripts
A.l Representing spatial sub-grid scale precipitation variability in a GCM
Manuscript submitted to Journal of Hydrometeorology
Abstract
A method for spatial disaggregation of rainfall to be used within a general circulation model
(GCM) is presented. The method is based on the assumption of exponential distribution of rain-
fall rates that are a function of the area of the GCM grid square where precipitation is occurring.
The climate simulated using the precipitation disaggregation scheme shows considerable changes
from the simulated control climate with overall warmer and drier tropical land and warmer high
latitude continental areas. Changes in the simulated climate can be explained by direct local land-
atmosphere interaction processes and remote responses to changes in tropical heating linked to dif-
ferences in precipitation. In the tropics, the relationship between decreases in rain-covered fraction
and decreases in GCM surface evaporation and precipitation follows an exponential relationship.
16

APPENDIX B
Publications, Abstracts, and Presentations
B.l Peer-Reviewed Publications
Buermann, W., J. Dong, X. Zeng, R. B. Myneni, and R. E. Dickinson, 2001: Evaluation of the
utility of satellite-based vegetation leaf area index data for climate simulations. J. Climate, 14,
3536-3550.
Chen, M., X. Zeng, and R. E. Dickinson, 1998: Adjustment of GCM precipitation intensity over
the United States. J. Appl. Meteor., 37, 876-887.
Dickinson, R. E. and K. J. Schaudt, 1998: Analysis of timescales of response of a simple climate
model. J . Climate, 11, 97-106.
Dickinson, R. E., M. Shaikh, R. Bryant, and L. Graumlich, 1998: Interactive canopies for a climate
model. J . Climate, 11,2823-2836.
Dickinson, R. E., J. A. Berry, G. B. Bonan, G. J. Collatz, C. B. Field, I. Y. Fung, M. Goulden, W.
A. Hoffman, R. B. Jackson, R. Myneni, P. J. Sellers, and M. Shaikh, 2001: Nitrogen controls
on climate model evapotranspiration. J. Climate, 15,278-295.
17

DOE Final Report July 2002
Hahmann, A. N., 2002: Representing spatial sub-grid scale precipitation variability in a GCM. J.
Hydrometeorology. Submitted.
Hahmann, A. N., and R. E. Dickinson, 2001: A fine-mesh land approach for general circulation
models and its impact on regional climate. J. Climate, 14, 1634-1646.
Koster, D. K., P. A. Dirmeyer, A. N. Hahmann, R. Ijpelaar, L. Tyahla, P. Cox, , and M. J. Suarez,
2002: Comparing the degree of land-atmospheric interaction in four atmospheric general cir-
culation models. J. Hydrometeorology, 3, 363-375.
Martin M., Dickinson R. E, Yang Z. L., 1999: Use of a coupled land surface general circulation
model to examine the impacts of doubled stomatal resistance on the water resources of the
American southwest. J. Climate, 12, 3359-3375.
Morrill, J. C., R. E. Dickinson, and A. N. Hahmann, 1999: Sensitivity of a land surface model
to the diurnal distribution of downward longwave radiation. J. of the Meteorological SOC. of
Japan, 77,265-279.
Polcher, J., B. McAvaney, P. Viterbo, M.-A. Gaertner, A. N. Hahmann, J.-E Mahfouf, J. Noilhan,
T. Phillips, A. Pitman, C. A. Schlosser, J.-P. Schultz, B. Timbal, D. Verseghy, and Y. Xue,
1998: A proposal for a general interface between land-surface schemes and general circulation
models. Global and Planetary Change, 19, 263-278.
Seth A., R. C. Bales, and R. E. Dickinson, 1999: A framework for the study of seasonal snow
hydrology and its interannual variability in the alpine regions of the Southwest. J. Geophys.
Res, 104,No. D18,22,117-22,135.
Wei, X, A. N. Hahmann, R. E. Dickinson, Z.-L. Yang, X. Zeng, K. J. Schaudt, C. B. Schaaf, N.
Strugnell, 2001: Comparison of albedos computed by land surface models and their evaluation
against remotely sensed data. J. Geophys. Res., 106, No. D18,20,687-20,702.
Yang, Z.-L., R. E. Dickinson, A. N. Hahmann, M. Shaikh, G.-Y. Niu, X. Gao, R. C. Bales, S.
Sorooshian and J. M. Jin, 1999: Simulation of snow mass and extent in global climate models.
Hydrological Processes, 13,2097-21 13.
18
DOE Final Report July 2002
Zeng, X. and R. E. Dickinson, 1998: Effect of surface sublayer on surface skin temperature and
fluxes. J. Climate, 11,537-550.
Zeng, X., Y.-J. Dai, R. E. Dickinson, and M. Shaikh, 1998: The role of root distribution for land
climate simulation. Geophys. Res. Lett., 25,4533-4536.
Zeng, X., R. E. Dickinson, A. Walker, M. Shaikh, R. S. DeFries, and J. Qi, 2000: Derivation and
evaluation of global 1-km fractional vegetation cover data for land modeling. J. Appl. Meteor.,
39,826-839.
Zeng, X., 2001: Global vegetation root distribution for land modeling. J. Hydrometeor., 2, 525-
530.
Zeng, X., M. Shaikh, Y. Dai, R. E. Dickinson, and R. Myneni, 2002: Coupling of the Common
Land Model to the NCAR Community Climate Model. J . Climate, 14, 1832-1 854.
B.2 Presentations
Land-Ocean-Atmosphere Interactions Over South America. Presented by A. Hahmann at the Sixth
International Conference on Southern Hemisphere Meteorology and Oceanography, Santiago,
Chile, April 2000.
Tropical Deforestation and Climate: A Testbed for Understanding Land Surface Processes. Pre-
sented by A. Hahmann as an Invited talk to the GEWEX/INSU Workshop on “Modeling
land-surface-atmosphere interactions and climate variability”, Gif-sur-Yvette, France, October
1999.
High-Resolution Simulations of the Global Climate - Validation of the Monsoon System over
the Southwest United States and Northern Mexico. Presented by A. Hahmann at the 22nd
General Assembly of the International Union of Geodesy and Geophysics, Birmingham, United
Kingdom, July 1999.
19

DOE Final Report July 2002
The Diurnal Cycle of Precipitation in the Amazon Basin: Sensitivity Experiments with a Global
Fine-Mesh Land Model. Presented by A. Hahmann at 23rd Conference on Hurricanes and
Tropical Meteorology. 1999 AMS Annual Meeting, Dallas, Texas, January 1999.
High-Resolution Simulations of the Global Climate: Validation of the Hydrological Cycle of the
Amazon and Southwest U.S. Presented by A. Hahmann at the 10th Symposium on Global
Change Studies, 1999 AMS Annual Meeting, Dallas, Texas, January 1999.
Land Processes in a High Resolution Community Climate Model with Sub-Grid Scale Parame-
terizations. Presented by A. Hahmann at the Climate Change Prediction Meeting, Phoenix,
Arizona, October, 1998.
20