Embed Size (px)
Citation preview
[Title]
Gary Hancock and Andy Revill
CSIRO Land and Water Science Report 2/11
January 2011
Land -use and erosion source discrimination of soil and carbon sources to the Logan and Albert rivers using Compound Specific Isotope Analysis
CSIRO Land and Water Science Report series ISSN: 1834-6618
Copyright and Disclaimer
© 2011 CSIRO To the extent permitted by law, all rights are reserved and no part of this publication covered by copyright may be reproduced or copied in any form or by any means except with the written permission of CSIRO.
Important Disclaimer:
CSIRO advises that the information contained in this publication comprises general statements based on scientific research. The reader is advised and needs to be aware that such information may be incomplete or unable to be used in any specific situation. No reliance or actions must therefore be made on that information without seeking prior expert professional, scientific and technical advice. To the extent permitted by law, CSIRO (including its employees and consultants) excludes all liability to any person for any consequences, including but not limited to all losses, damages, costs, expenses and any other compensation, arising directly or indirectly from using this publication (in part or in whole) and any information or material contained in it.
Cover Photograph:
Description: An example of channel bank erosion in the mid-catchment region of the Albert river after the January 2008 flood event.
Photographer: Tim Pietsch © 2008 CSIRO
iii
CONTENTS 1 INTRODUCTION................................................................................................. 1
1.1 Background............................................................................................................... 1 1.2 Compound specific δ13C measurements as sediment tracers.................................. 2 1.3 Study site .................................................................................................................. 2
2 METHODS .......................................................................................................... 3 2.1 Sample collection...................................................................................................... 3 2.2 Sample preparation and analysis ............................................................................. 5
3 RESULTS............................................................................................................ 6 3.1 Characterising soil sources....................................................................................... 6 3.2 Determining sediment sources ............................................................................... 11
3.2.1 Lower Logan River.............................................................................................. 11 3.2.2 Lower Albert River .............................................................................................. 15 3.2.3 Teviot Brook........................................................................................................ 16
4 CONCLUSIONS................................................................................................ 17 4.1 CSIA as a sediment source tracing technique........................................................ 17 4.2 Enhancement of sediment tracing capabilities ....................................................... 17 4.3 Value to CSIRO and wider...................................................................................... 18
5 ACKNOWLEDGMENTS.................................... ................................................ 18
REFERENCES........................................................................................................... 19
APPENDIX ................................................................................................................. 20
iv
EXECUTIVE SUMMARY The Compound Specific Isotope Analysis (CSIA) technique has been used to identify the sources of soil erosion contributing sediment to the Logan-Albert catchment. Soil samples were collected in January 2010 and used to assess the ability of the CSIA technique to discriminate probable sources of soil erosion. Fatty acid and bulk carbon δ13C were measured. This study has built on a previous sediment tracing study undertaken in 2008 using fallout radionuclides and major/minor element geochemistry. It is found that surface soil from forest, pasture and cultivated land-uses are well discriminated using CSIA. Furthermore, sub-surface soil sources associated with channel bank erosion and exposed subsoils (gullies and hillslope scalds) occurring specifically in the mid-western Logan catchment could also be discriminated. The CSIA and bulk carbon δ13C data were used in the IsoSource mixing model to estimate the erosion sources to sediment collected during the January 2008 flood. The results of this analysis were compared with results obtained using other sediment tracers. For the lower Logan River, the CSIA tracing results are consistent with fallout and element geochemistry tracing, with channel bank erosion being confirmed as the major sediment source. However, the significant contribution to Logan River sediment of exposed subsoils originating on hillslopes and drainage lines from the mid-western region of the Logan catchment has also been confirmed by CSIA. This erosion source was not quantified by catchment modelling. In the Albert River catchment about 50% of soil comes from forest land-use, although more than half of this soil comes from sub-surface sources. These results have demonstrated that the CSIA technique has the potential to significantly enhance the ability of CLW sediment tracing studies to determine the extent that different land-uses are contributing eroded soil to rivers, thus providing a check on catchment model predictions and/or a calibration of model parameters. In particular, sources of surface soil erosion in agricultural regions can now be distinguished from pristine forest hillslopes. Likewise, sub-surface soil sources such as river bank and gully erosion may also be distinguished.
1
1 INTRODUCTION
1.1 Background
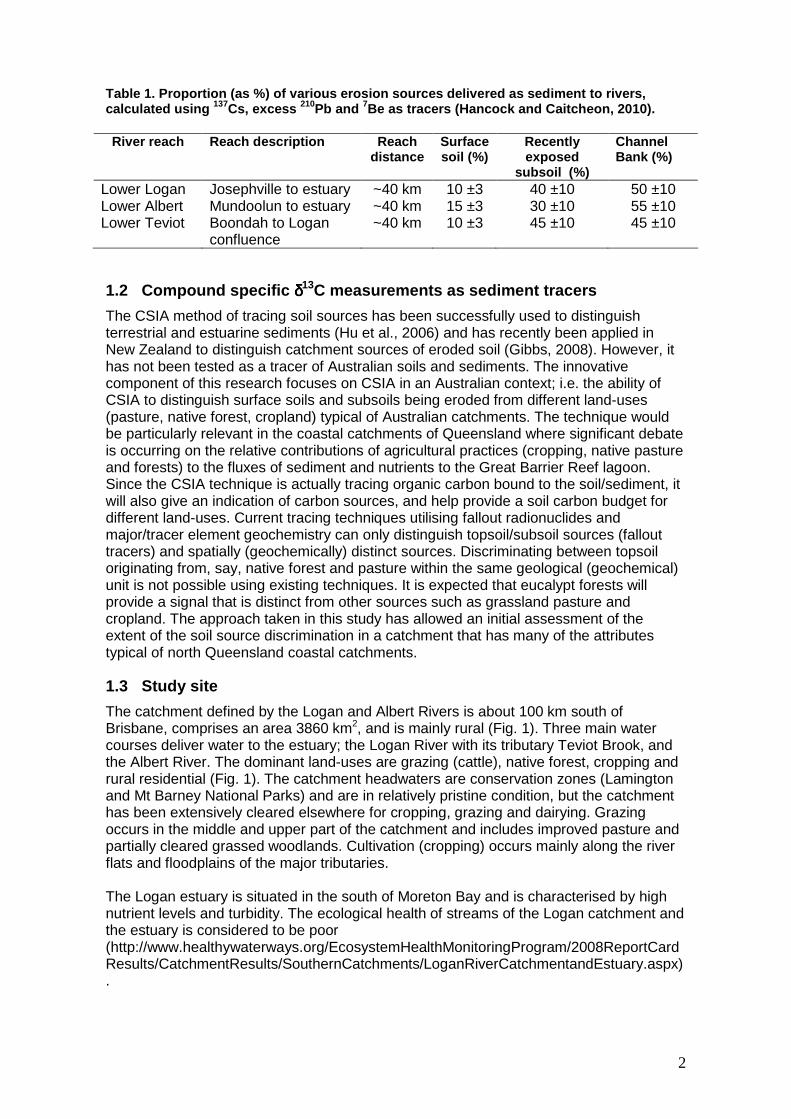
This report describes work designed to provide “proof of concept” for a new technique to discriminate eroded soil (and associated carbon) sources to rivers according to land-use in Australian catchments. The study entails the collection of characteristic soil and sediment samples from the Logan and Albert River catchments and their measurement by Compound Specific Isotope Analysis (CSIA). The CSIA technique measures the δ13C isotope signature of specific organic compounds (in this case, fatty acids) associated with the organic matter bound to the soil/sediment. It is proposed that different land-uses will provide distinctive CSIA signatures due to the different types of vegetation which, on decomposition, make up the organic matter bound to soil particles. It is well known that various plants (e.g. grasses, shrubs, trees etc.) synthesise 13C differently, leading to different δ13C values for the vegetation of those plants. On decomposition of this vegetation the δ13C values of the carbon compounds are retained and transferred to the soil. Thus, different plants (e.g. “C3” and “C4” plants) associated with different land-uses may allow the discrimination of land-uses and erosion processes contributing sediment to rivers and estuaries. A sediment sourcing study was recently been undertaken in the Logan-Albert catchment funded by the South-East Queensland Healthy Water Partnership and CSIRO Land and Water (Hancock and Caitcheon, 2010). The study used traditional radionuclide and major/minor element tracers, and provided new information on sediment sources and erosion processes. However, these tracers could not discriminate between different land-uses within the same geological province, in particular between the proportions of sediment originating from pasture, forest and cultivated regions. For example, in Table 1 below the tracers used by Hancock and Caitcheon (2010) identified surface soil erosion as contributing about 20% to river sediment, with exposed subsoils on hillslopes contributing 20-30%. Based on catchment modelling (SedNet, Caitcheon et al., 2001) channel bank erosion is assumed to contribute the remaining ~50%. However, the relative contributions of sub-surface soil sources (channel banks, exposed subsoils on hillslopes) are not well distinguished by surface tracers. Nor it is known where in the catchment the subsoil sources come from, and whether they are associated with pasture, forest and/or cultivated land-uses. The work outlined in this report investigates the ability of CSIA to characterise soils associated with specific land-uses, potentially providing improved discrimination of sediment and carbon sources to the Logan estuary. The work utilises the facilities and expertise of CMAR in Hobart (A. Revill, D. Holdsworth) where fatty acid extraction techniques and CSIA procedures are well established.
2
Table 1. Proportion (as %) of various erosion sourc es delivered as sediment to rivers, calculated using 137Cs, excess 210Pb and 7Be as tracers (Hancock and Caitcheon, 2010). River reach Reach description Reach
distance
Surface soil (%)
Recently exposed
subsoil (%)
Channel Bank (%)
Lower Logan Josephville to estuary ~40 km 10 ±3 40 ±10 50 ±10 Lower Albert Mundoolun to estuary ~40 km 15 ±3 30 ±10 55 ±10 Lower Teviot Boondah to Logan
confluence ~40 km 10 ±3 45 ±10 45 ±10
1.2 Compound specific δδδδ13C measurements as sediment tracers The CSIA method of tracing soil sources has been successfully used to distinguish terrestrial and estuarine sediments (Hu et al., 2006) and has recently been applied in New Zealand to distinguish catchment sources of eroded soil (Gibbs, 2008). However, it has not been tested as a tracer of Australian soils and sediments. The innovative component of this research focuses on CSIA in an Australian context; i.e. the ability of CSIA to distinguish surface soils and subsoils being eroded from different land-uses (pasture, native forest, cropland) typical of Australian catchments. The technique would be particularly relevant in the coastal catchments of Queensland where significant debate is occurring on the relative contributions of agricultural practices (cropping, native pasture and forests) to the fluxes of sediment and nutrients to the Great Barrier Reef lagoon. Since the CSIA technique is actually tracing organic carbon bound to the soil/sediment, it will also give an indication of carbon sources, and help provide a soil carbon budget for different land-uses. Current tracing techniques utilising fallout radionuclides and major/tracer element geochemistry can only distinguish topsoil/subsoil sources (fallout tracers) and spatially (geochemically) distinct sources. Discriminating between topsoil originating from, say, native forest and pasture within the same geological (geochemical) unit is not possible using existing techniques. It is expected that eucalypt forests will provide a signal that is distinct from other sources such as grassland pasture and cropland. The approach taken in this study has allowed an initial assessment of the extent of the soil source discrimination in a catchment that has many of the attributes typical of north Queensland coastal catchments.
1.3 Study site
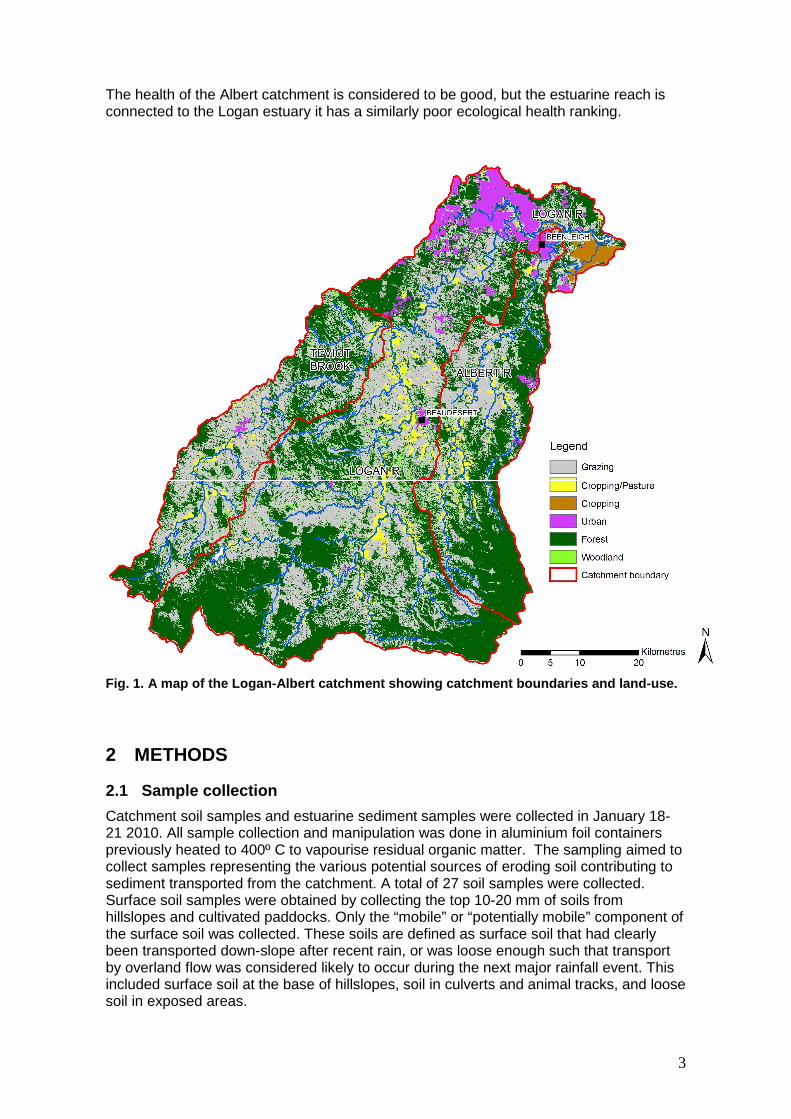
The catchment defined by the Logan and Albert Rivers is about 100 km south of Brisbane, comprises an area 3860 km2, and is mainly rural (Fig. 1). Three main water courses deliver water to the estuary; the Logan River with its tributary Teviot Brook, and the Albert River. The dominant land-uses are grazing (cattle), native forest, cropping and rural residential (Fig. 1). The catchment headwaters are conservation zones (Lamington and Mt Barney National Parks) and are in relatively pristine condition, but the catchment has been extensively cleared elsewhere for cropping, grazing and dairying. Grazing occurs in the middle and upper part of the catchment and includes improved pasture and partially cleared grassed woodlands. Cultivation (cropping) occurs mainly along the river flats and floodplains of the major tributaries. The Logan estuary is situated in the south of Moreton Bay and is characterised by high nutrient levels and turbidity. The ecological health of streams of the Logan catchment and the estuary is considered to be poor (http://www.healthywaterways.org/EcosystemHealthMonitoringProgram/2008ReportCardResults/CatchmentResults/SouthernCatchments/LoganRiverCatchmentandEstuary.aspx).
3
The health of the Albert catchment is considered to be good, but the estuarine reach is connected to the Logan estuary it has a similarly poor ecological health ranking.
Fig. 1. A map of the Logan-Albert catchment showing catchment boundaries and land-use.
2 METHODS
2.1 Sample collection
Catchment soil samples and estuarine sediment samples were collected in January 18-21 2010. All sample collection and manipulation was done in aluminium foil containers previously heated to 400º C to vapourise residual organic matter. The sampling aimed to collect samples representing the various potential sources of eroding soil contributing to sediment transported from the catchment. A total of 27 soil samples were collected. Surface soil samples were obtained by collecting the top 10-20 mm of soils from hillslopes and cultivated paddocks. Only the “mobile” or “potentially mobile” component of the surface soil was collected. These soils are defined as surface soil that had clearly been transported down-slope after recent rain, or was loose enough such that transport by overland flow was considered likely to occur during the next major rainfall event. This included surface soil at the base of hillslopes, soil in culverts and animal tracks, and loose soil in exposed areas.
4
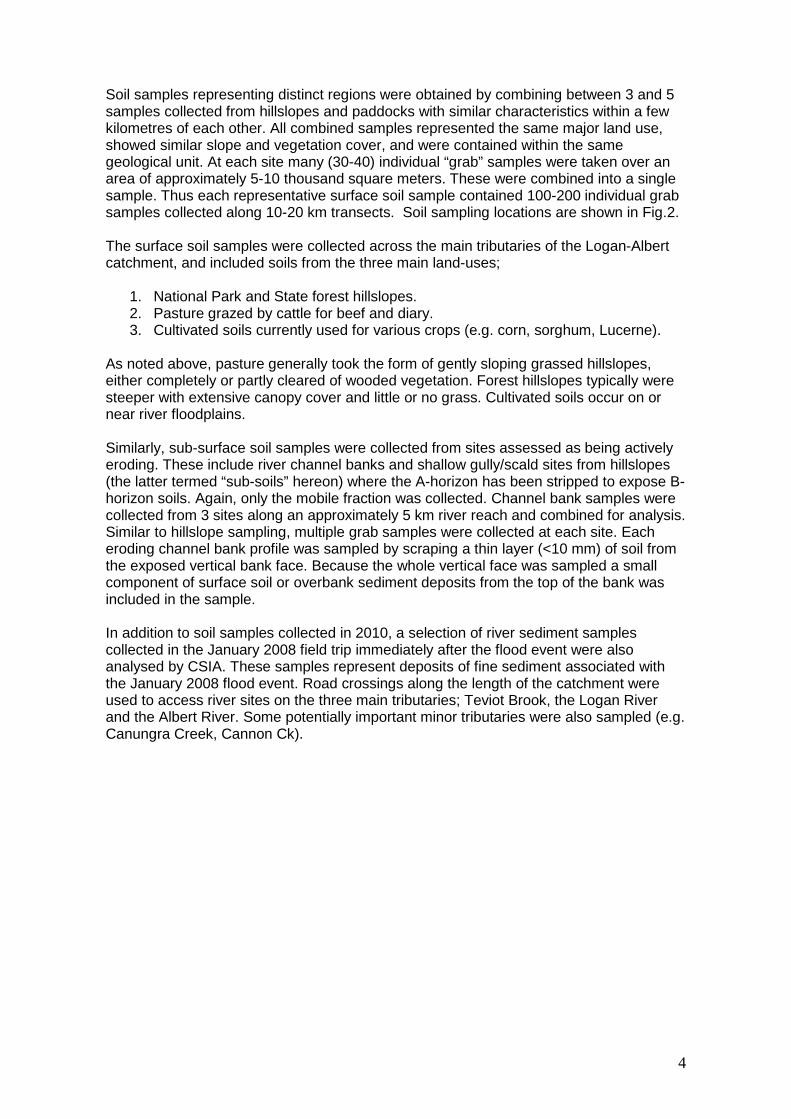
Soil samples representing distinct regions were obtained by combining between 3 and 5 samples collected from hillslopes and paddocks with similar characteristics within a few kilometres of each other. All combined samples represented the same major land use, showed similar slope and vegetation cover, and were contained within the same geological unit. At each site many (30-40) individual “grab” samples were taken over an area of approximately 5-10 thousand square meters. These were combined into a single sample. Thus each representative surface soil sample contained 100-200 individual grab samples collected along 10-20 km transects. Soil sampling locations are shown in Fig.2. The surface soil samples were collected across the main tributaries of the Logan-Albert catchment, and included soils from the three main land-uses;
1. National Park and State forest hillslopes. 2. Pasture grazed by cattle for beef and diary. 3. Cultivated soils currently used for various crops (e.g. corn, sorghum, Lucerne).
As noted above, pasture generally took the form of gently sloping grassed hillslopes, either completely or partly cleared of wooded vegetation. Forest hillslopes typically were steeper with extensive canopy cover and little or no grass. Cultivated soils occur on or near river floodplains. Similarly, sub-surface soil samples were collected from sites assessed as being actively eroding. These include river channel banks and shallow gully/scald sites from hillslopes (the latter termed “sub-soils” hereon) where the A-horizon has been stripped to expose B-horizon soils. Again, only the mobile fraction was collected. Channel bank samples were collected from 3 sites along an approximately 5 km river reach and combined for analysis. Similar to hillslope sampling, multiple grab samples were collected at each site. Each eroding channel bank profile was sampled by scraping a thin layer (<10 mm) of soil from the exposed vertical bank face. Because the whole vertical face was sampled a small component of surface soil or overbank sediment deposits from the top of the bank was included in the sample. In addition to soil samples collected in 2010, a selection of river sediment samples collected in the January 2008 field trip immediately after the flood event were also analysed by CSIA. These samples represent deposits of fine sediment associated with the January 2008 flood event. Road crossings along the length of the catchment were used to access river sites on the three main tributaries; Teviot Brook, the Logan River and the Albert River. Some potentially important minor tributaries were also sampled (e.g. Canungra Creek, Cannon Ck).
5
Fig. 2. Locations of soil samples collected in Janu ary 2010.
2.2 Sample preparation and analysis
Representative soil samples were obtained by sub-sampling the bulk samples to obtain a single sample of ~100 g dry weight. Again, all manipulations were done on aluminium foil, previously ashed at 450º C. The combined samples were dry sieved through a 700µm sieve and put into glass jars. The jars had been previously heated to 450º C. The soil samples were then frozen and packed with ice bricks for transport to CSIRO Marine Division laboratories in Hobart. Selected river sediment samples collected approximately one week after the January 2008 flood event were also retrieved and sent to Hobart for analysis. The samples had been stored in a freezer, and were sieved as described above. In the laboratory soil samples were extracted quantitatively by sonicating (2 x 30mL) with a modified one-phase CH2Cl2-MeOH Bligh and Dyer solvent mixture (Bligh and Dyer, 1959). The extracts were transferred to a separating funnel and after phase separation, the lipids were recovered in the lower CH2Cl2 layer (solvents were removed in vacuo) and were made up to a known volume and stored sealed under nitrogen at -20 °C. Fatty acids were recovered from the aqueous fraction of the saponified mixture after the addition of 1 ml of HCl. Fatty acids were converted to their methyl esters prior to analysis by treatment with acidified methanol.
Gas chromatography (GC) was performed using a Varian 3800, controlled by Galaxy chromatography software. The gas chromatograph was equipped with a 50 m x 0.32 mm i.d. cross-linked 5% phenyl-methyl silicone (HP5) fused-silica capillary column; hydrogen was the carrier gas. Fatty acid fractions were analysed using a flame ionisation detector,
6
with the C23 fatty acid methyl ester as the injection standard. Peak identifications were based on retention times relative to authentic and laboratory standards and subsequent gas chromatography mass spectrometry (GCMS) analysis.
Compound specific isotope analysis was performed using a Thermo GC coupled to a Finnigan Mat Delta S isotope ratio mass spectrometer operating in continuous flow mode. The nonpolar column (HP5) and operating conditions were similar to that described above for GC-FID analyses, but helium was used as the carrier gas.
3 RESULTS
3.1 Characterising soil sources
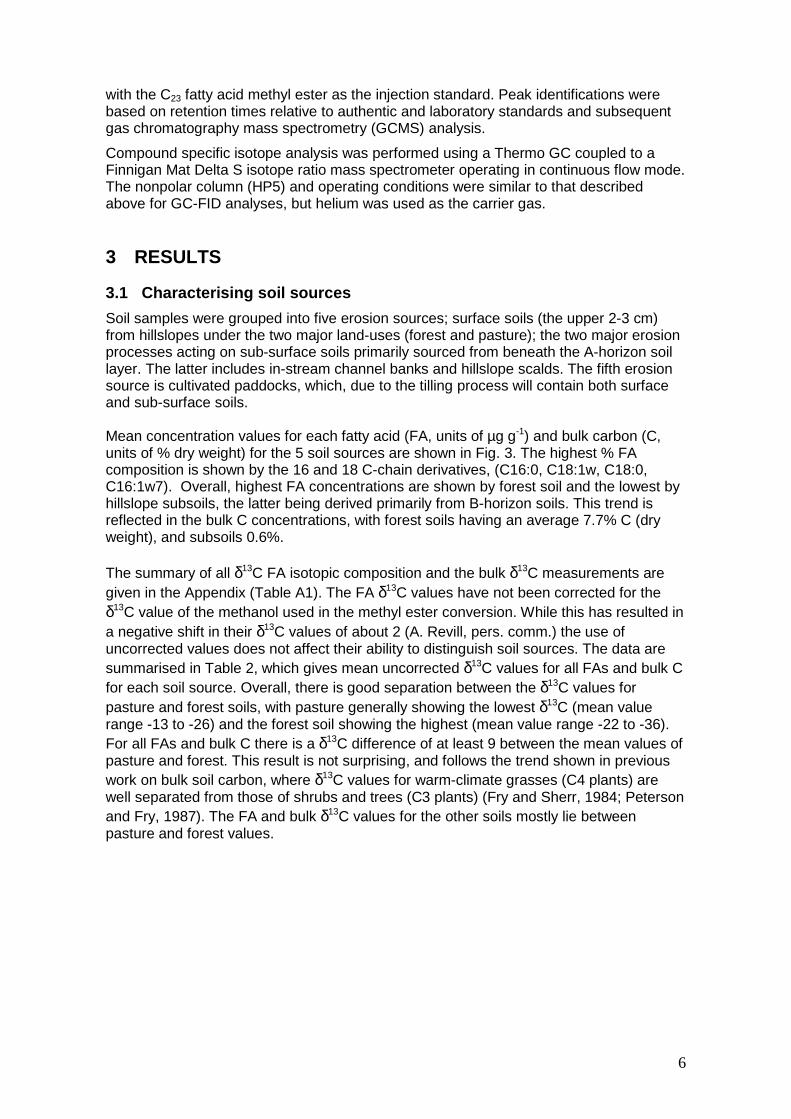
Soil samples were grouped into five erosion sources; surface soils (the upper 2-3 cm) from hillslopes under the two major land-uses (forest and pasture); the two major erosion processes acting on sub-surface soils primarily sourced from beneath the A-horizon soil layer. The latter includes in-stream channel banks and hillslope scalds. The fifth erosion source is cultivated paddocks, which, due to the tilling process will contain both surface and sub-surface soils. Mean concentration values for each fatty acid (FA, units of µg g-1) and bulk carbon (C, units of % dry weight) for the 5 soil sources are shown in Fig. 3. The highest % FA composition is shown by the 16 and 18 C-chain derivatives, (C16:0, C18:1w, C18:0, C16:1w7). Overall, highest FA concentrations are shown by forest soil and the lowest by hillslope subsoils, the latter being derived primarily from B-horizon soils. This trend is reflected in the bulk C concentrations, with forest soils having an average 7.7% C (dry weight), and subsoils 0.6%. The summary of all δ13C FA isotopic composition and the bulk δ13C measurements are given in the Appendix (Table A1). The FA δ13C values have not been corrected for the δ13C value of the methanol used in the methyl ester conversion. While this has resulted in a negative shift in their δ13C values of about 2 (A. Revill, pers. comm.) the use of uncorrected values does not affect their ability to distinguish soil sources. The data are summarised in Table 2, which gives mean uncorrected δ13C values for all FAs and bulk C for each soil source. Overall, there is good separation between the δ13C values for pasture and forest soils, with pasture generally showing the lowest δ13C (mean value range -13 to -26) and the forest soil showing the highest (mean value range -22 to -36). For all FAs and bulk C there is a δ13C difference of at least 9 between the mean values of pasture and forest. This result is not surprising, and follows the trend shown in previous work on bulk soil carbon, where δ13C values for warm-climate grasses (C4 plants) are well separated from those of shrubs and trees (C3 plants) (Fry and Sherr, 1984; Peterson and Fry, 1987). The FA and bulk δ13C values for the other soils mostly lie between pasture and forest values.
7
Fig. 3. Mean fatty acid concentrations for the 5 so il sources. Note each bar cluster represents one fatty acid. Also shown on the far ri ght is % bulk C (dry weight). Note separate y-axis for % bulk C. Table 2. Mean uncorrected fatty acid (FA) and bulk C δδδδ13C values for each soil source. Note the forest gully sample LA10014 is excluded from th e subsoil mean value. The FA and bulk C results shown in bold type are identified as providing the best discrimination between soil sources (see text discussion and Table 3 below).
Channel
Bank Cultivated Forest Pasture Subsoils Bulk C-13 -21.10 -18.85 -24.42 -15.30 -20.64
C12:0 -22.81 -23.37 -32.22 -21.88 -21.45 C14:0 -27.54 -26.93 -35.93 -23.14 -23.19
i15:0 -21.23 -20.46 -26.93 -15.99 -20.19 a15:0 -19.30 -21.18 -22.69 -13.79 -19.87 C15:0 -24.60 -22.62 -33.40 -20.45 nm i16:0 -25.51 -21.45 -30.75 -18.23 -20.30
C16:1w7 -23.82 -30.64 -29.91 -18.55 -31.23 C16:0 -24.35 -29.60 -32.37 -21.29 -26.64
18 comb -24.27 -24.68 -27.38 -18.61 -23.45 C18:0 -23.90 -24.44 -28.96 -19.60 -23.73 C20:0 -24.26 -24.46 -31.22 -21.28 -19.03 C22:0 -29.61 -27.57 -33.31 -23.85 nm C24:0 -32.04 -27.33 -32.68 -23.44 nm C25:0 -31.45 -29.63 -35.03 -25.41 nm C26:0 -33.25 -27.56 -33.24 -23.54 nm C28:0 -31.14 -27.04 -33.37 -23.31 nm C30:0 -30.53 -31.02 -32.80 -24.43 nm C23 IS -29.53 -29.70 -32.36 -26.49 -28.38
nm: δ13C not able to be measured due to low FA concentration.
Fatty acids + bulk C
Con
cent
ratio
n (u
g g-1
)
0
2
4
6
8
10
Bul
k C
(%
)
0
2
4
6
8
Channel bank Cultivated Forest Pasture Subsoil
C16
:1w
7
C18
:1w
9
C14
:0
C15
:0
i15:
0
C16
:0
i16:
0
C18
:0
C20
:0
C22
:0
C24
:0
C25
:0
C26
:0
C28
:0
C30
:0
C12
:0
Bul
k C
8
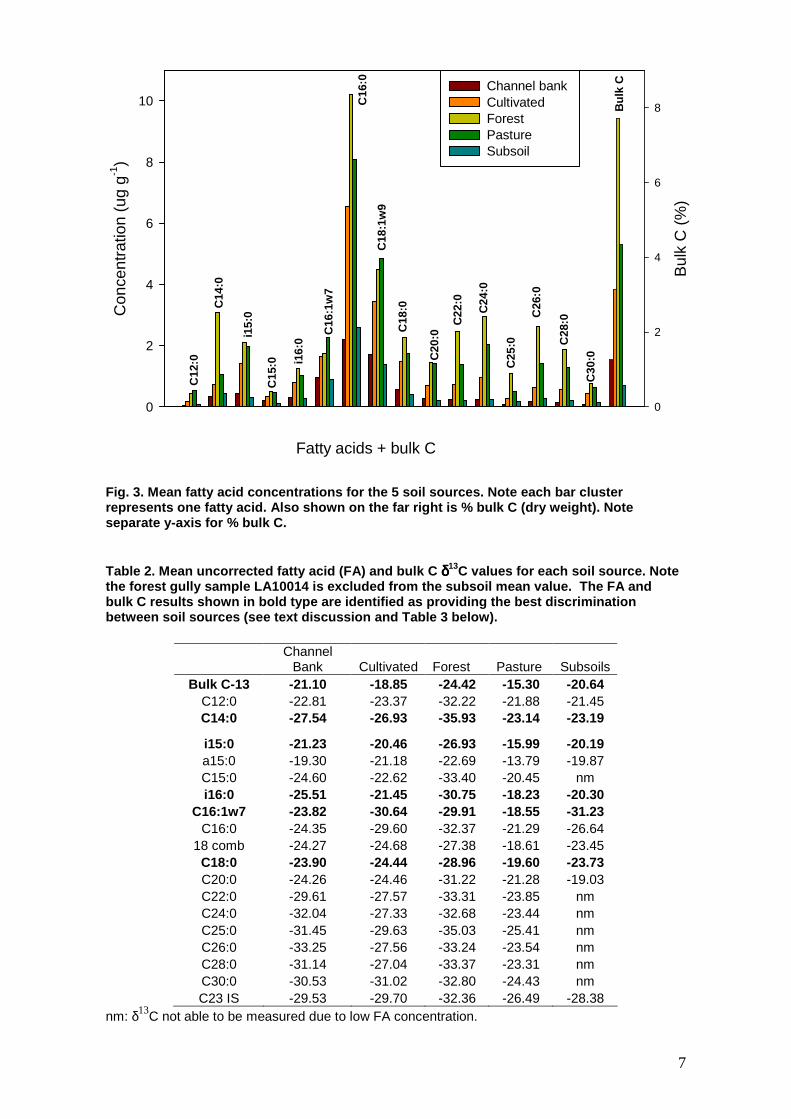
The discrimination between soil samples by FA δ13C values can be illustrated by a “tree”, or “cluster” diagram (Fig. 4). Values for each fatty acid are used to cluster similar source soils via hierarchical cluster analysis (squared euclidean distance; complete linkage), performed using the statistical software package (Statsoft inc.). The resulting dendrogram shows source materials on the y-axis and vertical lines represent linkages (similarity) between them. The further along x-axis that this linkage occurs the more dissimilar the groupings are. The diagram is arranged such that samples that show similar characteristics cluster together on the y-axis. Fig. 4 shows that pasture FA δ13C values cluster together, as do forest soil samples. Good separation is seen between them (linkage distance ~3200). Both these soil sources are well separated from the remaining sources, which, with a few exceptions, tend to cluster together. It is interesting to note that non-topsoil samples which were collected from pasture or forest land-use areas are in fact closely linked to samples from these areas. For example LA10014 is a subsoil from a gullied drainage line collected from a forest site in Mt Barney National Park, and shows an isotopic signature very similar to surface forest soils. Similarly, the channel bank sample LA10006 was collected just downstream from the Lamington National Park in a reach of the Albert River representing the transition zone from forest to pasture. It is interesting to note that the other two subsoil samples, which where collected from the dominantly pasture catchments of Knapp’s Creek and Sandy Creek (LA10019 and LA10021) in the middle western area of the Logan catchment, show characteristics similar to, but slightly different from that of the pasture samples.
Fig. 4. “Cluster” diagram for δδδδ13C composition of fatty acids in source soils.
Cluster diagram δ13C fatty acidsCluster diagram δ13C fatty acids
9
The discrimination between soil sources using CSIA is further quantified using the statistical t-test to compare the significance of differences between soil sources for each fatty acid. The parameter Tab is given by the difference between the fatty acid mean δ13C values of source soils a and b, divided by the standard error of that difference; i.e.
)( 22MbMa
ba
ab
XXT
σσ +
−= (1)
where ba σσ , represent the standard errors on the mean. T values for 10 of the soil
source pairs are shown in Table 3. Some fatty acids (C20:0 to C30:0) are not included because subsoil data is missing, although it is noted that these FA’s did not provide good discrimination anyway. Values of T can range from 0 (no discrimination) to >5 (excellent). For soil sources T values of 5 and above (equivalent to a statistical t-test with P <0.01) were selected as providing good discrimination. These are highlighted in Table 3. Excellent Pasture:Forest discrimination is seen and both pasture and forest are well discriminated from the other sources. The three subsoil sources (channel, bank, subsoils and cultivated soils) show a lesser degree of discrimination, although at least one FA shows good discrimination for each source pair. Since the mixing model employed for this work (IsoSource, see below) can only accept a maximum of 5 tracer values as input terms, the following FAs were selected as providing the best overall discrimination for all soil sources; Myristic Acid (C14:0), Palmitoleic Acid (C16:1w7), branched-chain iso-C15:0 (i15:0), and Stearic acid (C18:0). Following the suggestion of Gibbs (pers. comm.) the fifth input term (tracer) was δ13C of the bulk (whole) sample, as it makes up the largest mass component of the soil (1000 fold greater than the fatty acid signatures).
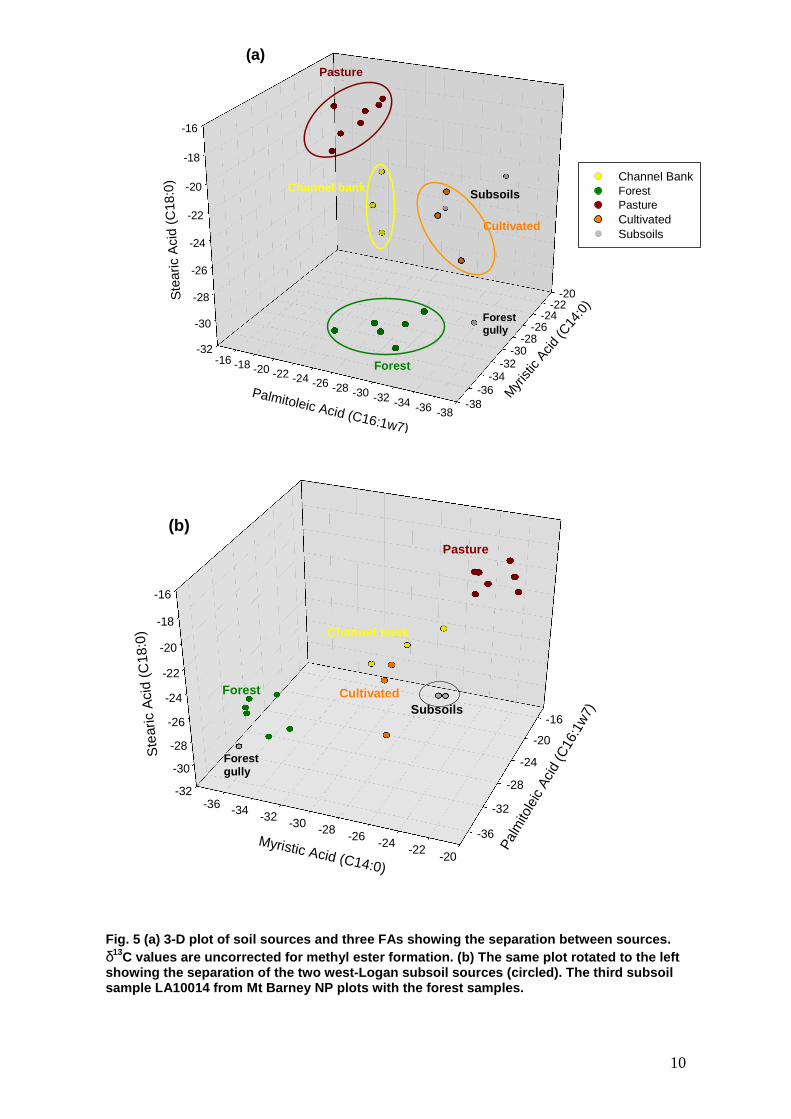
The discrimination of sources by isotopic composition of three members of the FA suite can be visually assessed using a 3-D plot (Fig. 5). The three FAs are Myristic Acid (C14:0), Palmitoleic Acid (C16:1w7) and Stearic acid (C18:0). In Fig. 5(a) good separation can be seen between the three main land-uses (pasture, forest and cultivation), as well as river channel banks. Rotation of the plot to the left (Fig. 5(b)) shows that the two subsoil samples from the western mid-Logan catchment are also well separated. As noted above, the third subsoil sample LA10014 plots with the forest samples.
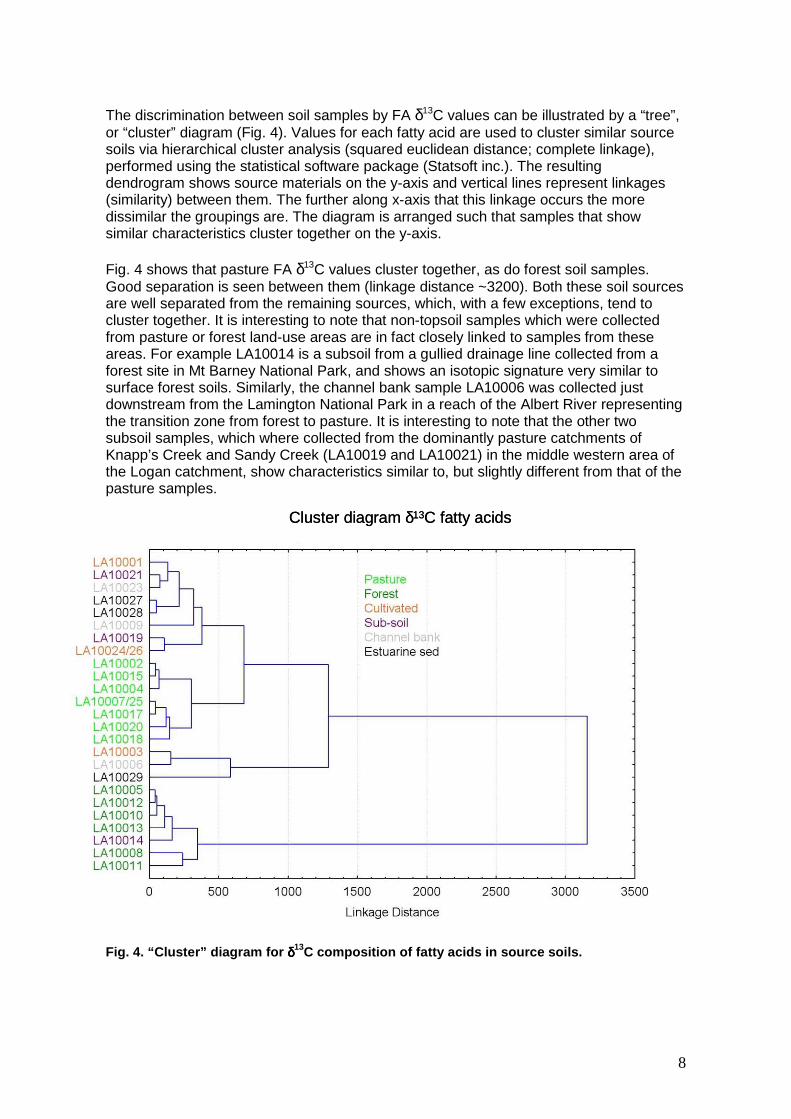
Table 3. Discrimination between soil sources by fat ty acid CSIA and bulk δδδδ13C, as measured by Tab (see text for details). Values of Tab greater than 5 are highlighted purple. Fatty acids with missing subsoil data (C20:0 to C30:0) have not been included. Those FAs selected for mixing model analysis are highlighted yellow.
Soil source pairs Bulk δ13C C12:0 C14:0 i15:0 a15:0 i16:0 C16:1w7 C16:0 18 comb C18:0 Pasture:Forest 9.4 6.4 19.1 17.0 9.8 16.6 8.2 12.2 15.2 12.6
Pasture:Cultivated 4.0 2.0 7.7 6.2 7.2 6.3 11.5 5.5 4.5 3.9 Pasture:Chan Bk 8.9 0.7 3.4 2.8 4.6 3.8 4.5 2.7 5.8 4.4
Pasture:Subsoils 5.9 0.5 0.1 9.5 8.7 2.0 4.3 3.1 4.4 2.7 Forest:Cultivated 5.3 5.5 16.1 8.7 1.3 11.0 0.6 2.0 2.2 3.8
Forest:Chan Bk 3.9 4.8 6.4 3.1 2.5 2.6 4.5 8.5 3.9 5.4 Forest:Subsoils 3.6 6.4 18.3 14.1 3.1 8.5 0.4 3.5 4.1 3.5 Chan Bk:Cultivated 2.9 0.4 0.5 0.4 1.3 2.1 6.6 3.4 0.3 0.4
Chan Bk:Subsoils 0.6 0.9 3.4 0.6 0.5 2.4 2.5 1.3 0.7 0.1 Cultivated:Subsoils 1.8 2.2 7.1 0.5 1.3 1.1 0.2 1.5 0.8 0.4
10
Fig. 5 (a) 3-D plot of soil sources and three FAs s howing the separation between sources. δ13C values are uncorrected for methyl ester formation . (b) The same plot rotated to the left showing the separation of the two west-Logan subsoi l sources (circled). The third subsoil sample LA10014 from Mt Barney NP plots with the for est samples.
-32
-30
-28
-26
-24
-22
-20
-18
-16
-38-36
-34-32
-30-28
-26-24
-22-20
-38-36-34-32-30-28-26-24-22-20-18-16
Ste
aric
Aci
d (C
18:0
)
Myr
istic
Acid (C
14:0
)
Palmitoleic Acid (C16:1w7)
Channel BankForestPastureCultivatedSubsoils
Forest
Pasture
Cultivated
Channel bank Subsoils
(a)
Forestgully
-32
-30
-28
-26
-24
-22
-20
-18
-16
-38-36
-34-32
-30-28
-26-24
-22-20
-38-36-34-32-30-28-26-24-22-20-18-16
Ste
aric
Aci
d (C
18:0
)
Myr
istic
Acid (C
14:0
)
Palmitoleic Acid (C16:1w7)
Channel BankForestPastureCultivatedSubsoils
Forest
Pasture
Cultivated
Channel bank Subsoils
(a)
Forestgully
-32
-30
-28
-26
-24
-22
-20
-18
-16
-36 -34 -32 -30 -28 -26 -24 -22-20
-36
-32
-28
-24
-20
-16
Ste
aric
Aci
d (C
18:0
)
Myristic Acid (C14:0)
Palm
itole
ic A
cid
(C16
:1w
7)
Forest
Pasture
Cultivated
Channel bank
Subsoils
(b)
Forestgully
11
3.2 Determining sediment sources
Mixing models are primarily used to apportion sources to sediment comprising a mixture of soils. As suggested by Gibbs (2008) we have used the isotopic mixing model IsoSource (Phillips and Gregg, 2003) to estimate soil sources for sediment samples collected at various locations in the river network, and in the estuary. While the primary aim of this study is to assess the ability of the CSIA to discriminate soils according to land-use and erosion process, a preliminary assessment has been made of the ability of the CSIA method to apportion soil sources to selected sediment samples collected during the January 2008 flood event.
IsoSource is useful for determining feasible proportions of potential soil sources to a sediment mixture where the number of sources is ≥ the number of tracers. The model calculates the feasible solutions within a given tolerance (e.g. ±1%) of the tracer concentrations of the target mixture. Results are displayed as a distribution frequency distribution allowing an estimate of the uncertainty of predictions. As noted above, the δ13C of 4 FAs plus bulk C were used as tracers to apportion sources to the river and estuarine sediment. Because the CSIA method traces carbon rather than the soil itself, the results given by the mixing model need to be adjusted to account for the different amounts of FAs in each of the soil sources. This is done by using the % carbon results, as described by Gibbs (2008); i.e.
( )
( )∑=
nnn
nnn CP
CPSoilsource
/
/% x 100 (2)
where Pn is the mean feasible solution of source n (%), and Cn is % carbon of the source soil.
3.2.1 Lower Logan River
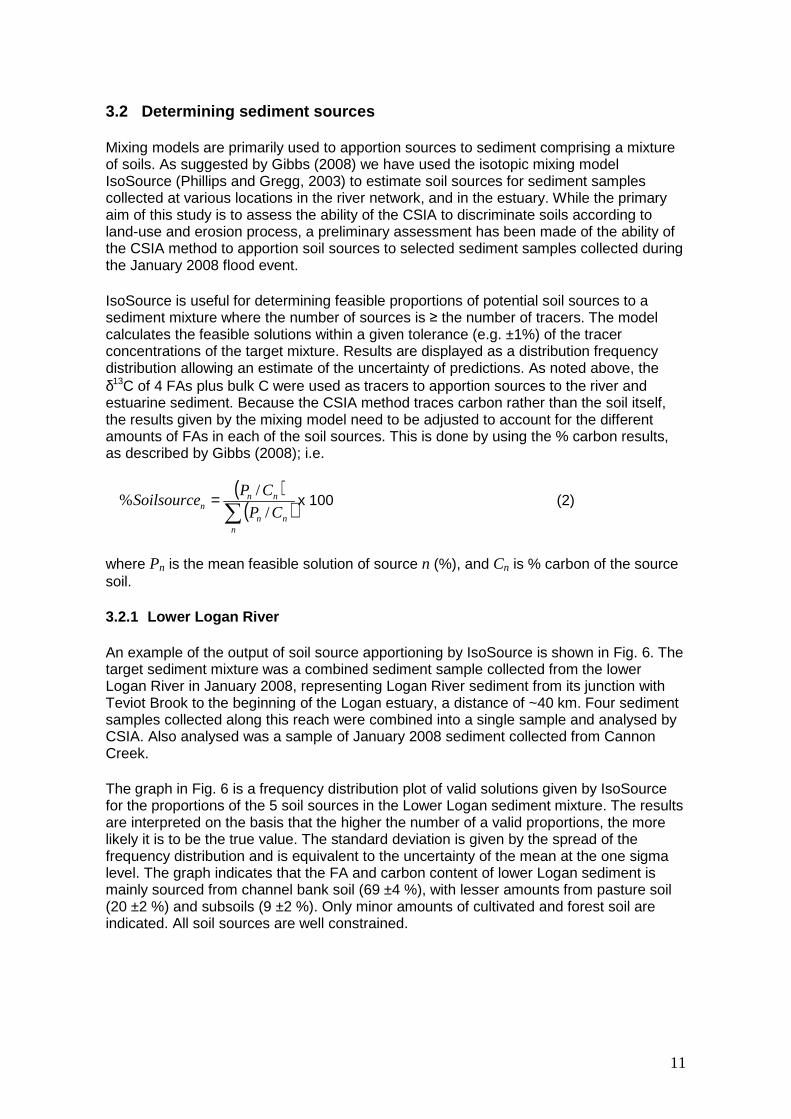
An example of the output of soil source apportioning by IsoSource is shown in Fig. 6. The target sediment mixture was a combined sediment sample collected from the lower Logan River in January 2008, representing Logan River sediment from its junction with Teviot Brook to the beginning of the Logan estuary, a distance of ~40 km. Four sediment samples collected along this reach were combined into a single sample and analysed by CSIA. Also analysed was a sample of January 2008 sediment collected from Cannon Creek.
The graph in Fig. 6 is a frequency distribution plot of valid solutions given by IsoSource for the proportions of the 5 soil sources in the Lower Logan sediment mixture. The results are interpreted on the basis that the higher the number of a valid proportions, the more likely it is to be the true value. The standard deviation is given by the spread of the frequency distribution and is equivalent to the uncertainty of the mean at the one sigma level. The graph indicates that the FA and carbon content of lower Logan sediment is mainly sourced from channel bank soil (69 ±4 %), with lesser amounts from pasture soil (20 ±2 %) and subsoils (9 ±2 %). Only minor amounts of cultivated and forest soil are indicated. All soil sources are well constrained.
12
Fig. 6. IsoSource frequency plot for the proportions of soil sources contributing carbon to sediment from lower Logan River (January 2008 event ). The 5 tracers used are listed; the number of feasible solutions, n, is 189.
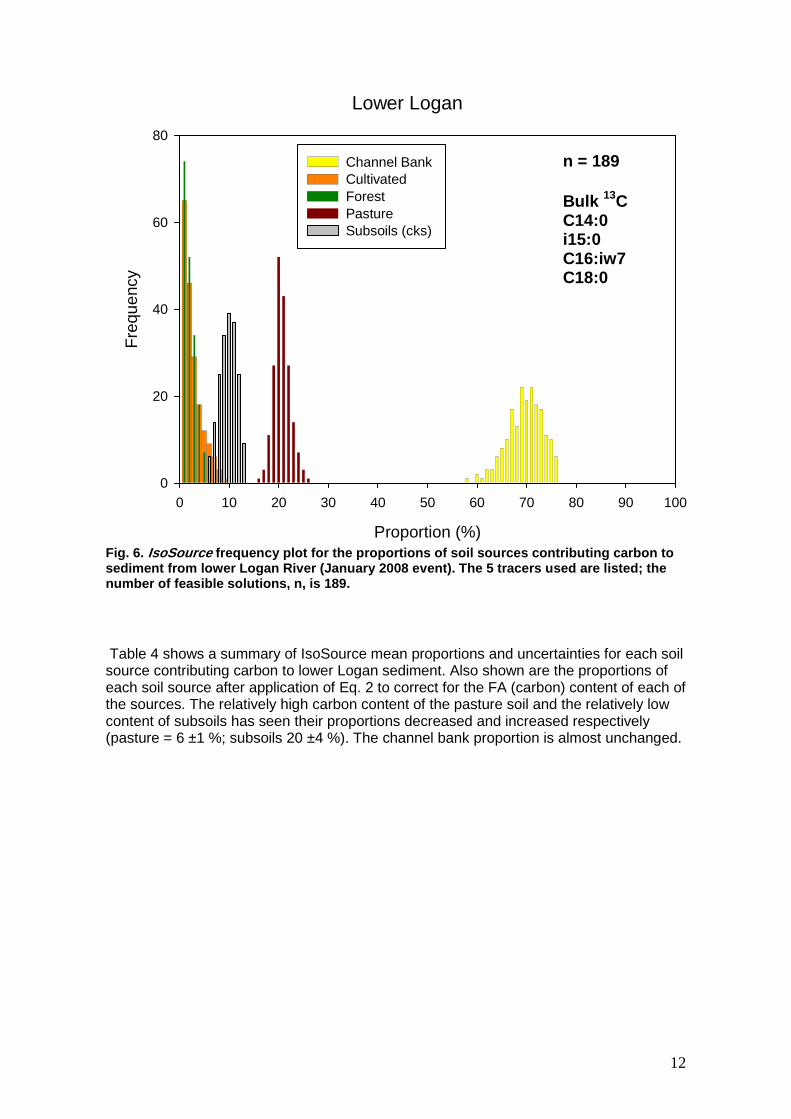
Table 4 shows a summary of IsoSource mean proportions and uncertainties for each soil source contributing carbon to lower Logan sediment. Also shown are the proportions of each soil source after application of Eq. 2 to correct for the FA (carbon) content of each of the sources. The relatively high carbon content of the pasture soil and the relatively low content of subsoils has seen their proportions decreased and increased respectively (pasture = 6 ±1 %; subsoils 20 ±4 %). The channel bank proportion is almost unchanged.
Lower Logan
Proportion (%)
0 10 20 30 40 50 60 70 80 90 100
Fre
quen
cy
0
20
40
60
80
Channel Bank Cultivated Forest Pasture Subsoils (cks)
n = 189
Bulk 13CC14:0i15:0C16:iw7C18:0
13
Table 4. Data used to determine soil sources to sub -catchments within Logan-Albert catchment. Apportionment of FA (carbon) sources is determined from δδδδ13C values using IsoSource. Soil sources are then determined using bulk C val ues and Eq. 2.
Bulk C (%)
IsoSource nominal C sources (%)
Soil sources (%)
Lower Logan Channel bank 1.26 68 ±4 72 ±4 Cultivated 3.14 2 ±2 1 ±1 Forest 7.72 1 ±1 <1 Pasture 4.35 20 ±2 7 ±2 Subsoils 0.59 9 ±2 20 ±4 Cannon Creek Channel bank 1.26 21 ±12 16 ±9 Forest 7.72 22 ±5 3 ±1 Pasture 4.35 10 ±6 2 ±1 Subsoils 0.59 48 ±4 79 ±7 Lower Albert Channel bank 1.26 14 ±2 47 ±7 Cultivated 3.14 7±2 9 ±3 Forest 7.72 78 ±1 42 ±3 Pasture 4.35 1 ±1 <2 Teviot Brook Channel bank 1.26 3 ±2 7 ±5 Cultivated 3.14 48 ±2 40 ±2 Forest 7.72 39 ±1 13 ±1 Pasture 4.35 2 ±1 <2 Subsoils 0.59 9 ±2 39 ±8
It is interesting to consider the role of the western region of the mid-Logan catchment in delivering subsoils to the lower Logan. The geochemical tracing by Hancock and Caitcheon (2010) indicated a significant proportion (10 to 25%) of sediment eroded from Marburg soils is delivered to the Logan River in the middle catchment region. Surface tracers indicate that the subsoils component is significant in this region. These eroded subsoils are almost certainly coming from creeks draining the mid-western region of the Logan catchment, with Tamrookum, Knapps, Cannon and Sandy and Allan Creeks all draining soils from the Marburg geological province.
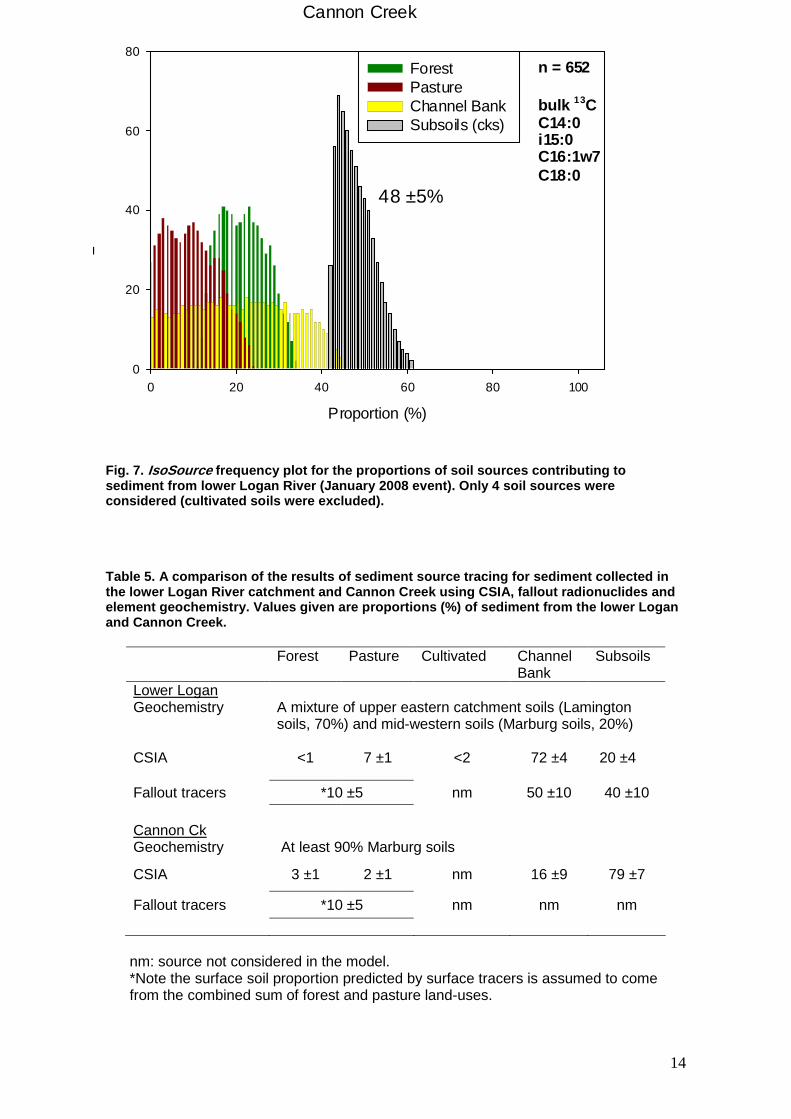
The CSIA technique has been applied to sediment from Cannon Creek (Fig. 7). Given the very small area of cultivation in the western Logan region cultivated soils were not included in the IsoSource model run. While the results are less definitive (higher uncertainties) for some of the soil sources than for the lower Logan the output shows that exposed subsoils contribute more than 40% of carbon to sediment delivered by Cannon Creek. When corrected for bulk carbon variations it is seen that between 70 and 85% of Cannon Creek sediment is sourced from eroded subsoils (Table 5). Thus the results of all tracer techniques (surface tracers, geochemistry and CSIA) are consistent, with the CSIA technique confirming the dominant role of channel banks to sediment input to the lower Logan (50-70%). It also confirms that a smaller but significant input (20-30%) of eroded subsoils comes from the western creeks.
14
Fig. 7. IsoSource frequency plot for the proportions of soil sources contributing to sediment from lower Logan River (January 2008 event ). Only 4 soil sources were considered (cultivated soils were excluded).
Table 5. A comparison of the results of sediment so urce tracing for sediment collected in the lower Logan River catchment and Cannon Creek us ing CSIA, fallout radionuclides and element geochemistry. Values given are proportions (%) of sediment from the lower Logan and Cannon Creek.
Forest Pasture Cultivated Channel Bank
Subsoils
Lower Logan Geochemistry A mixture of upper eastern catchment soils (Lamington
soils, 70%) and mid-western soils (Marburg soils, 20%)
CSIA <1 7 ±1 <2 72 ±4 20 ±4
Fallout tracers *10 ±5 nm 50 ±10 40 ±10 Cannon Ck Geochemistry At least 90% Marburg soils
CSIA 3 ±1 2 ±1 nm 16 ±9 79 ±7
Fallout tracers *10 ±5 nm nm nm
nm: source not considered in the model. *Note the surface soil proportion predicted by surface tracers is assumed to come from the combined sum of forest and pasture land-uses.
Cannon Creek
Proportion (%)
0 20 40 60 80 100
Frequency
0
20
40
60
80Forest Pasture Channel Bank Subsoils (cks)
n = 652
bulk 13CC14:0i15:0C16:1w7C18:0
48 ±5%
15
3.2.2 Lower Albert River
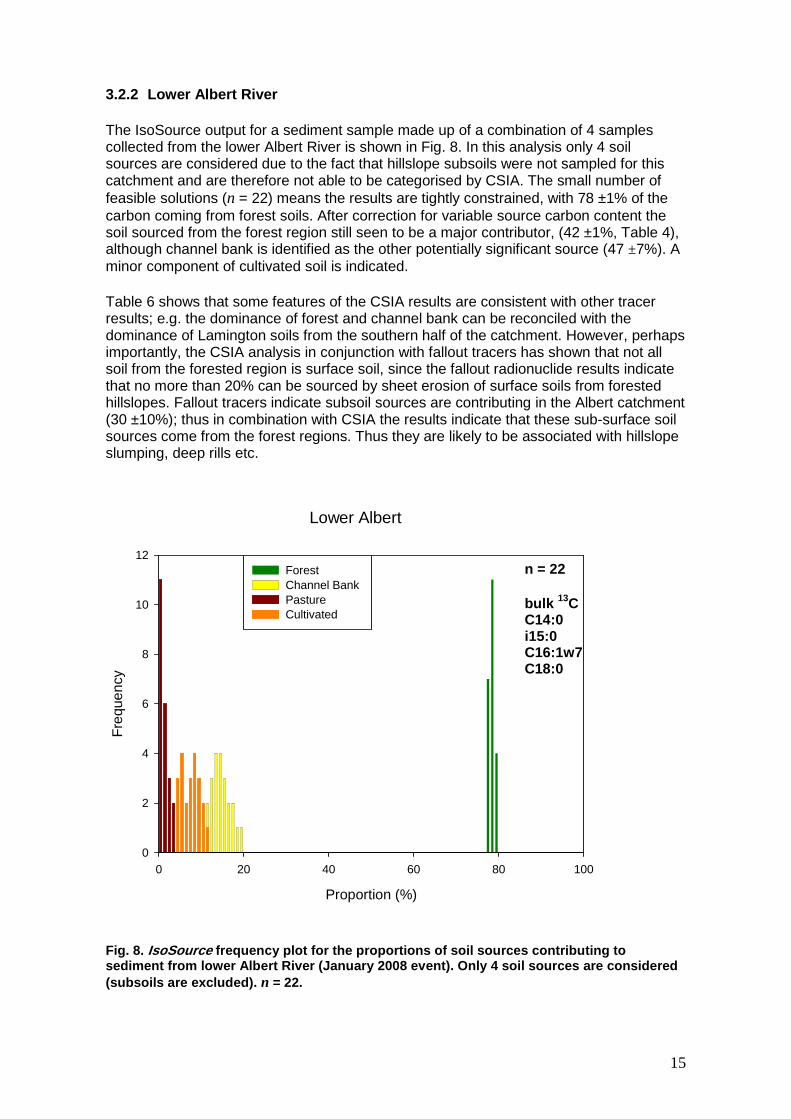
The IsoSource output for a sediment sample made up of a combination of 4 samples collected from the lower Albert River is shown in Fig. 8. In this analysis only 4 soil sources are considered due to the fact that hillslope subsoils were not sampled for this catchment and are therefore not able to be categorised by CSIA. The small number of feasible solutions (n = 22) means the results are tightly constrained, with 78 ±1% of the carbon coming from forest soils. After correction for variable source carbon content the soil sourced from the forest region still seen to be a major contributor, (42 ±1%, Table 4), although channel bank is identified as the other potentially significant source (47 ±7%). A minor component of cultivated soil is indicated.
Table 6 shows that some features of the CSIA results are consistent with other tracer results; e.g. the dominance of forest and channel bank can be reconciled with the dominance of Lamington soils from the southern half of the catchment. However, perhaps importantly, the CSIA analysis in conjunction with fallout tracers has shown that not all soil from the forested region is surface soil, since the fallout radionuclide results indicate that no more than 20% can be sourced by sheet erosion of surface soils from forested hillslopes. Fallout tracers indicate subsoil sources are contributing in the Albert catchment (30 ±10%); thus in combination with CSIA the results indicate that these sub-surface soil sources come from the forest regions. Thus they are likely to be associated with hillslope slumping, deep rills etc.
Fig. 8. IsoSource frequency plot for the proportions of soil sources contributing to sediment from lower Albert River (January 2008 even t). Only 4 soil sources are considered (subsoils are excluded). n = 22.
Lower Albert
Proportion (%)
0 20 40 60 80 100
Fre
quen
cy
0
2
4
6
8
10
12Forest Channel Bank Pasture Cultivated
n = 22
bulk 13CC14:0i15:0C16:1w7C18:0
16
Table 6. A comparison of the results of sediment s ource tracing for sediment collected in the lower Albert River catchment.
Forest Pasture Cultivated Channel Bank
Subsoils
Geochemistry Lower Albert sediment is at least 90% sourced from Lamington soils which are located in the forested part (the southern half) of the catchment.
CSIA 42 ±1 <2 9 ±2 47 ±7 nm
Fallout tracers *15 ±5 nm 55 ±10 30 ±10
nm: source not considered in the model. *Note the surface soil proportion predicted by surface tracers is assumed to come from the combined sum of forest and pasture land-uses.
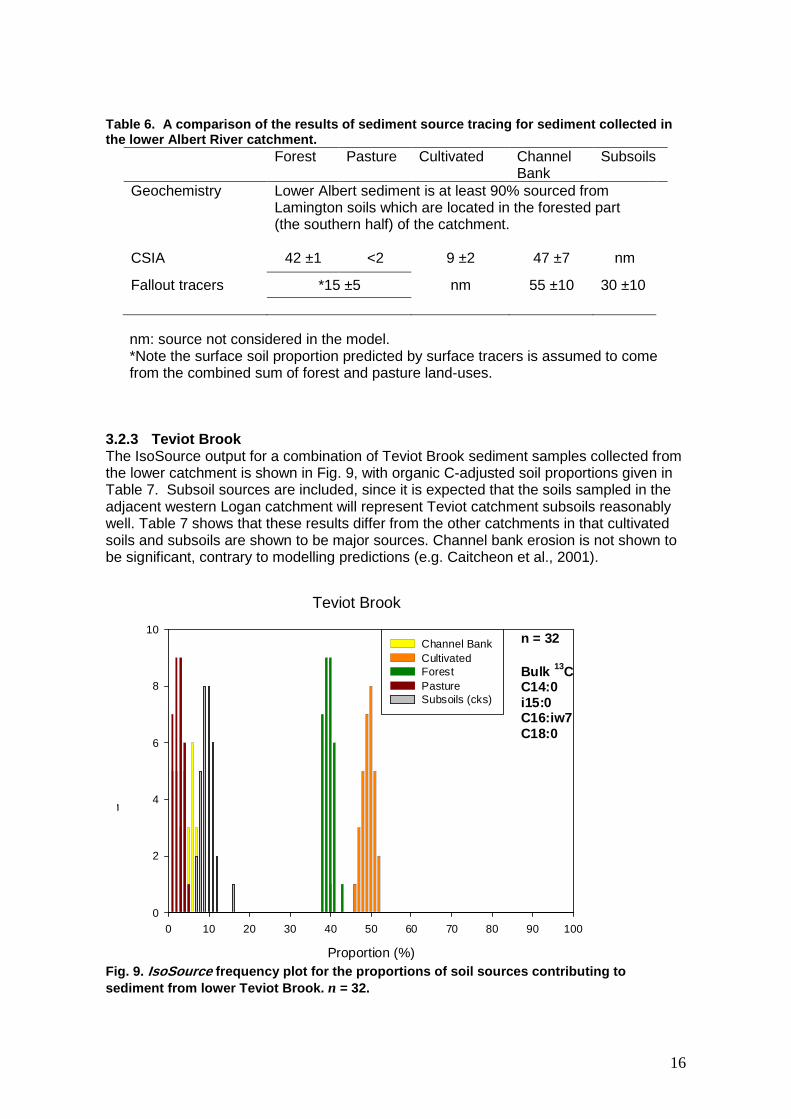
3.2.3 Teviot Brook The IsoSource output for a combination of Teviot Brook sediment samples collected from the lower catchment is shown in Fig. 9, with organic C-adjusted soil proportions given in Table 7. Subsoil sources are included, since it is expected that the soils sampled in the adjacent western Logan catchment will represent Teviot catchment subsoils reasonably well. Table 7 shows that these results differ from the other catchments in that cultivated soils and subsoils are shown to be major sources. Channel bank erosion is not shown to be significant, contrary to modelling predictions (e.g. Caitcheon et al., 2001).
Fig. 9. IsoSource frequency plot for the proportions of soil sources contributing to sediment from lower Teviot Brook. n = 32.
Teviot Brook
Proportion (%)
0 10 20 30 40 50 60 70 80 90 100
Frequ
ency
0
2
4
6
8
10Channel Bank Cultivated Forest Pasture Subsoils (cks)
n = 32
Bulk 13CC14:0i15:0C16:iw7C18:0
17
Table 7. A comparison of the results of sediment s ource tracing in the lower Teviot Brook catchment.
Forest Pasture Cultivated Channel Bank
Subsoils
Geochemistry
Lower Teviot sediment is mostly sourced from Walloon soils, located in the upper part (the southern half) of the catchment
CSIA 13 ±1 1 ±1 40 ±2 7 ±5 39 ±8
Fallout tracers *10 ±3 nm 45 ±10 45 ±10
nm: source not considered in the model. *Note the surface soil proportion predicted by surface tracers is assumed to come from the combined sum of forest and pasture land-uses.
4 CONCLUSIONS
4.1 CSIA as a sediment source tracing technique
In this study, the δ13C values of at least 8 FAs gave sufficient discrimination to distinguish pasture and forest land-uses. The δ13C values of bulk organic carbon also gave good discrimination. Other sub-surface soil sources (cultivated, channel bank and hillslope scalds) were also discriminated, although to a lesser extent. In determining the sources of sediment to the Logan and Albert rivers 4 FAs were selected for use in mixing model IsoSource such that they gave sufficient discrimination to provide realistic estimates of the proportions of the 5 source soils in samples of deposited sediment collected from the lower regions of the Logan and Albert Rivers. The results are generally consistent with other techniques used in this catchment (fallout radionulcides and trace element geochemistry), and appear to provide additional important information by distinguishing between surface soil erosion from pasture and forest land-uses, and by distinguishing sub-surface erosion from cultivated soils, channel banks and hillslope scalds.
4.2 Enhancement of sediment tracing capabilities
These results have demonstrated that the CSIA technique has the potential to significantly enhance the ability of CLW sediment tracing studies to determine the extent that different land-uses are contributing eroded soil to rivers. Topsoil erosion can be a major source of sediment to rivers, contributing up to 50% in tropical regions (e.g. Bartley et al., 2004), and it is often the subject of much debate whether grazed pastures or conservation forests are the source of this topsoil. The CSIA technique also appears to be able to discriminate sub-surface soil sources such as channel banks and hillslope B-horizon soils, a task surface tracers and elemental geochemistry often fail to do. In combination, the three tracing techniques, surface tracers, element geochemistry and

18
CSIA offer the opportunity to discriminate, both spatially and erosion process-based, 5 major erosion sources. Knowledge of the land-use practices and the erosion processes leading to the delivery of sediment and associated nutrient fluxes to near-shore regions is an important first step in the implementation of catchment management action to control these fluxes, and ultimately improve or protect the health of river systems and estuaries.
4.3 Value to CSIRO and wider
The method is a “leading edge” tracing technique which, when undertaken in conjunction with fallout and geochemical tracing, will allow CSIRO to apply the best technology to sediment tracing studies. It has been shown that when applied in conjunction with catchment modelling, sediment tracers are able to provide important validation and/or calibration of model output (e.g. Hancock et al., 2007; Rustomji et al., 2008). The study has provideed an answer to the questions posed in the recently completed Logan-Albert sediment source study; i.e. 1) what are the origins of sediment in the mid-catchment regions of the Logan catchment (cultivated soils or subsoils)?, and 2) what are the sources of topsoil in the upper catchment - pasture or native forest? In this study it is demonstrated that hillslope subsoils and forest soils contributed significantly in the mid-west Logan and the upper Albert catchments respectively. This result is of value to catchment managers in south-east Queensland and other northern catchments where similar soil erosion, soil sustainability and water quality issues are present. Finally, since CSIA traces carbon per se, the technique will allow improved estimates of the sustainability of surface (A-horizon) soils in agricultural regions. Since organic carbon is essential for a productive A-horizon, surface soil stability will be directly linked to agricultural productivity, especially on hillslopes where the A-horizon is thin.
5 ACKNOWLEDGMENTS We acknowledge the help of Danny Hunt during the collection, sub-sampling and packaging of samples in January 2010. Dan Holdsworth (CMAR) performed the CSIA analysis and provided the fatty acid and bulk carbon isotope data. This study is part of the IAEA Cooperative Research Project (CRP) entitled “Integrated Isotopic Approaches for an Area-wide Precision to Control the Impacts of Agricultural Practices on Land Degradation and Soil Erosion”. Discussions with scientists within this CRP has aided our ability to integrate the CSIA with other tracer methods. In particular, Max Gibbs (NIWA, NZ) helped GH’s application of IsoSource and understanding of the capability of the CSIA method.
19
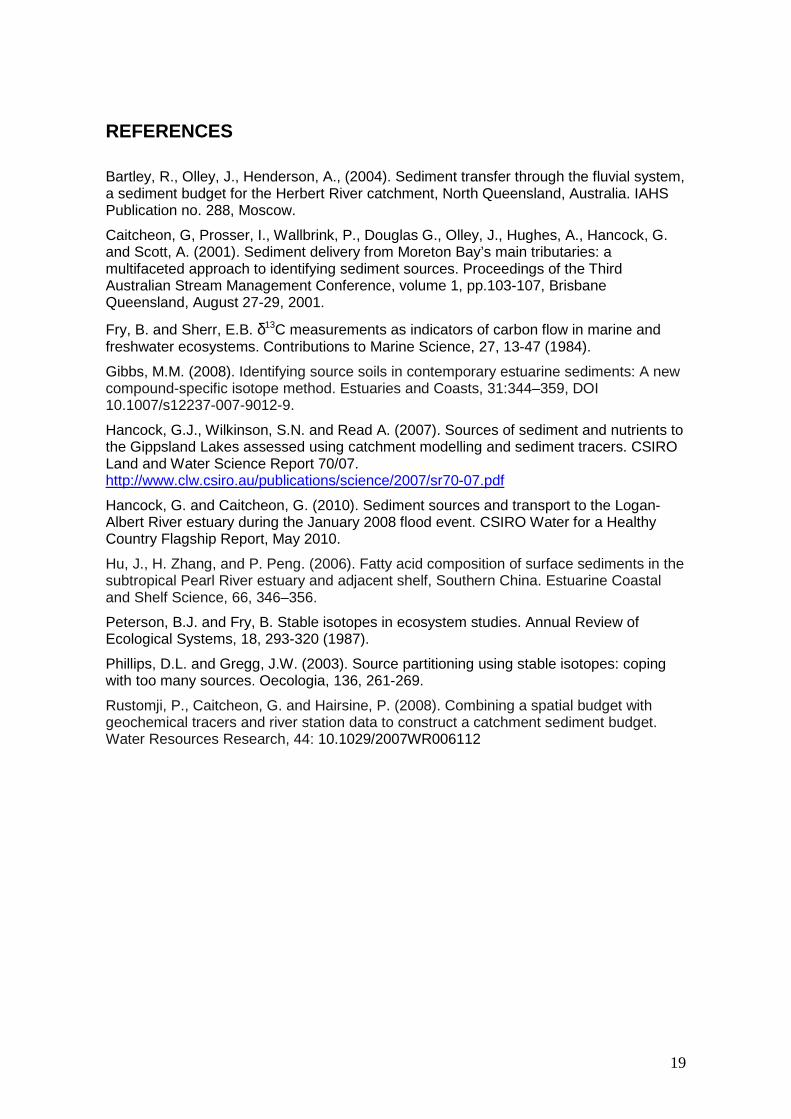
REFERENCES Bartley, R., Olley, J., Henderson, A., (2004). Sediment transfer through the fluvial system, a sediment budget for the Herbert River catchment, North Queensland, Australia. IAHS Publication no. 288, Moscow.
Caitcheon, G, Prosser, I., Wallbrink, P., Douglas G., Olley, J., Hughes, A., Hancock, G. and Scott, A. (2001). Sediment delivery from Moreton Bay’s main tributaries: a multifaceted approach to identifying sediment sources. Proceedings of the Third Australian Stream Management Conference, volume 1, pp.103-107, Brisbane Queensland, August 27-29, 2001.
Fry, B. and Sherr, E.B. δ13C measurements as indicators of carbon flow in marine and freshwater ecosystems. Contributions to Marine Science, 27, 13-47 (1984).
Gibbs, M.M. (2008). Identifying source soils in contemporary estuarine sediments: A new compound-specific isotope method. Estuaries and Coasts, 31:344–359, DOI 10.1007/s12237-007-9012-9.
Hancock, G.J., Wilkinson, S.N. and Read A. (2007). Sources of sediment and nutrients to the Gippsland Lakes assessed using catchment modelling and sediment tracers. CSIRO Land and Water Science Report 70/07. http://www.clw.csiro.au/publications/science/2007/sr70-07.pdf
Hancock, G. and Caitcheon, G. (2010). Sediment sources and transport to the Logan-Albert River estuary during the January 2008 flood event. CSIRO Water for a Healthy Country Flagship Report, May 2010.
Hu, J., H. Zhang, and P. Peng. (2006). Fatty acid composition of surface sediments in the subtropical Pearl River estuary and adjacent shelf, Southern China. Estuarine Coastal and Shelf Science, 66, 346–356.
Peterson, B.J. and Fry, B. Stable isotopes in ecosystem studies. Annual Review of Ecological Systems, 18, 293-320 (1987).
Phillips, D.L. and Gregg, J.W. (2003). Source partitioning using stable isotopes: coping with too many sources. Oecologia, 136, 261-269.
Rustomji, P., Caitcheon, G. and Hairsine, P. (2008). Combining a spatial budget with geochemical tracers and river station data to construct a catchment sediment budget. Water Resources Research, 44: 10.1029/2007WR006112
20
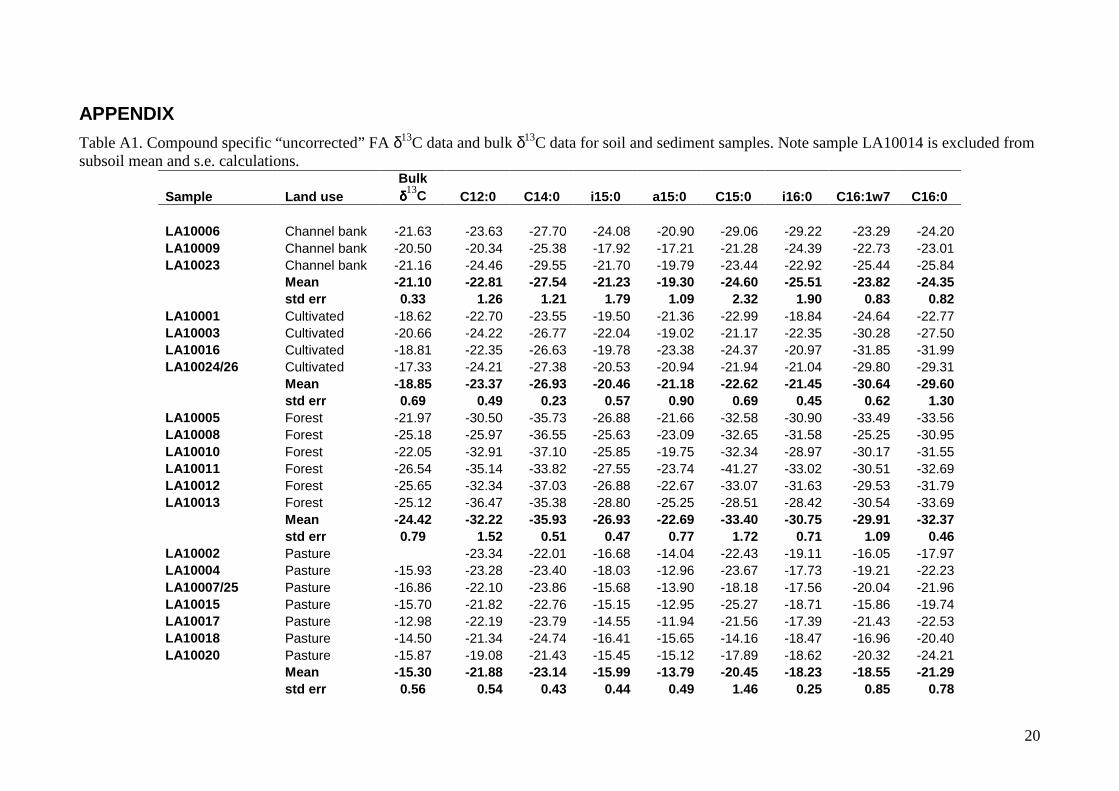
APPENDIX
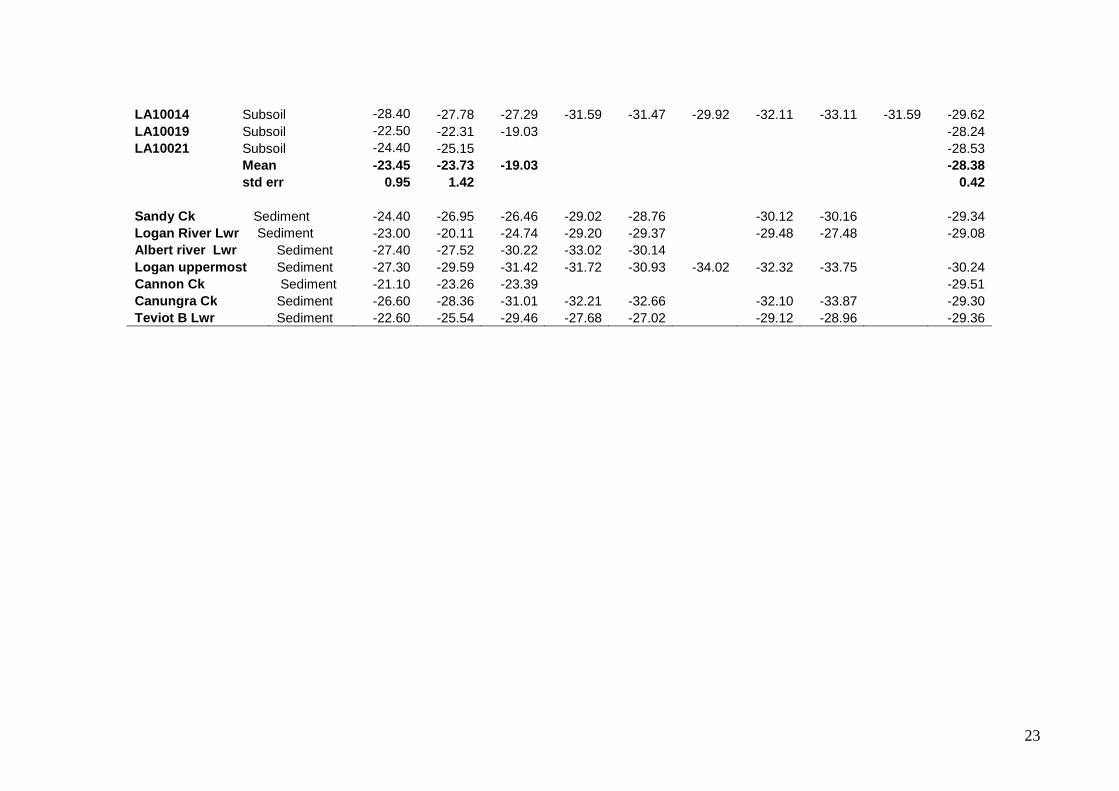
Table A1. Compound specific “uncorrected” FA δ13C data and bulk δ13C data for soil and sediment samples. Note sample LA10014 is excluded from subsoil mean and s.e. calculations.
Sample Land use Bulk δδδδ13C C12:0 C14:0 i15:0 a15:0 C15:0 i16:0 C16:1w7 C16:0
LA10006 Channel bank -21.63 -23.63 -27.70 -24.08 -20.90 -29.06 -29.22 -23.29 -24.20 LA10009 Channel bank -20.50 -20.34 -25.38 -17.92 -17.21 -21.28 -24.39 -22.73 -23.01 LA10023 Channel bank -21.16 -24.46 -29.55 -21.70 -19.79 -23.44 -22.92 -25.44 -25.84 Mean -21.10 -22.81 -27.54 -21.23 -19.30 -24.60 -25.51 -23.82 -24.35 std err 0.33 1.26 1.21 1.79 1.09 2.32 1.90 0.83 0.82 LA10001 Cultivated -18.62 -22.70 -23.55 -19.50 -21.36 -22.99 -18.84 -24.64 -22.77 LA10003 Cultivated -20.66 -24.22 -26.77 -22.04 -19.02 -21.17 -22.35 -30.28 -27.50 LA10016 Cultivated -18.81 -22.35 -26.63 -19.78 -23.38 -24.37 -20.97 -31.85 -31.99 LA10024/26 Cultivated -17.33 -24.21 -27.38 -20.53 -20.94 -21.94 -21.04 -29.80 -29.31 Mean -18.85 -23.37 -26.93 -20.46 -21.18 -22.62 -21.45 -30.64 -29.60 std err 0.69 0.49 0.23 0.57 0.90 0.69 0.45 0.62 1.30 LA10005 Forest -21.97 -30.50 -35.73 -26.88 -21.66 -32.58 -30.90 -33.49 -33.56 LA10008 Forest -25.18 -25.97 -36.55 -25.63 -23.09 -32.65 -31.58 -25.25 -30.95 LA10010 Forest -22.05 -32.91 -37.10 -25.85 -19.75 -32.34 -28.97 -30.17 -31.55 LA10011 Forest -26.54 -35.14 -33.82 -27.55 -23.74 -41.27 -33.02 -30.51 -32.69 LA10012 Forest -25.65 -32.34 -37.03 -26.88 -22.67 -33.07 -31.63 -29.53 -31.79 LA10013 Forest -25.12 -36.47 -35.38 -28.80 -25.25 -28.51 -28.42 -30.54 -33.69 Mean -24.42 -32.22 -35.93 -26.93 -22.69 -33.40 -30.75 -29.91 -32.37 std err 0.79 1.52 0.51 0.47 0.77 1.72 0.71 1.09 0.46 LA10002 Pasture -23.34 -22.01 -16.68 -14.04 -22.43 -19.11 -16.05 -17.97 LA10004 Pasture -15.93 -23.28 -23.40 -18.03 -12.96 -23.67 -17.73 -19.21 -22.23 LA10007/25 Pasture -16.86 -22.10 -23.86 -15.68 -13.90 -18.18 -17.56 -20.04 -21.96 LA10015 Pasture -15.70 -21.82 -22.76 -15.15 -12.95 -25.27 -18.71 -15.86 -19.74 LA10017 Pasture -12.98 -22.19 -23.79 -14.55 -11.94 -21.56 -17.39 -21.43 -22.53 LA10018 Pasture -14.50 -21.34 -24.74 -16.41 -15.65 -14.16 -18.47 -16.96 -20.40 LA10020 Pasture -15.87 -19.08 -21.43 -15.45 -15.12 -17.89 -18.62 -20.32 -24.21 Mean -15.30 -21.88 -23.14 -15.99 -13.79 -20.45 -18.23 -18.55 -21.29 std err 0.56 0.54 0.43 0.44 0.49 1.46 0.25 0.85 0.78
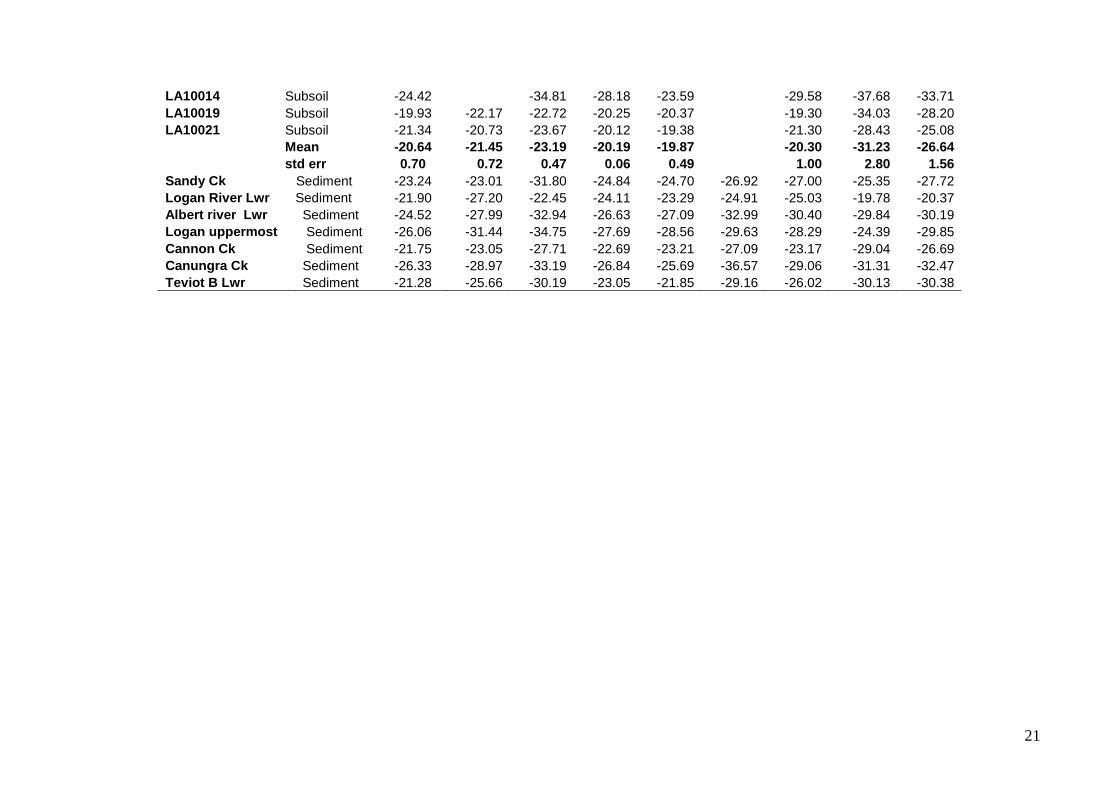
21
LA10014 Subsoil -24.42 -34.81 -28.18 -23.59 -29.58 -37.68 -33.71 LA10019 Subsoil -19.93 -22.17 -22.72 -20.25 -20.37 -19.30 -34.03 -28.20 LA10021 Subsoil -21.34 -20.73 -23.67 -20.12 -19.38 -21.30 -28.43 -25.08 Mean -20.64 -21.45 -23.19 -20.19 -19.87 -20.30 -31.23 -26.64 std err 0.70 0.72 0.47 0.06 0.49 1.00 2.80 1.56 Sandy Ck Sediment -23.24 -23.01 -31.80 -24.84 -24.70 -26.92 -27.00 -25.35 -27.72 Logan River Lwr Sediment -21.90 -27.20 -22.45 -24.11 -23.29 -24.91 -25.03 -19.78 -20.37 Albert river Lwr Sediment -24.52 -27.99 -32.94 -26.63 -27.09 -32.99 -30.40 -29.84 -30.19 Logan uppermost Sediment -26.06 -31.44 -34.75 -27.69 -28.56 -29.63 -28.29 -24.39 -29.85 Cannon Ck Sediment -21.75 -23.05 -27.71 -22.69 -23.21 -27.09 -23.17 -29.04 -26.69 Canungra Ck Sediment -26.33 -28.97 -33.19 -26.84 -25.69 -36.57 -29.06 -31.31 -32.47 Teviot B Lwr Sediment -21.28 -25.66 -30.19 -23.05 -21.85 -29.16 -26.02 -30.13 -30.38
22
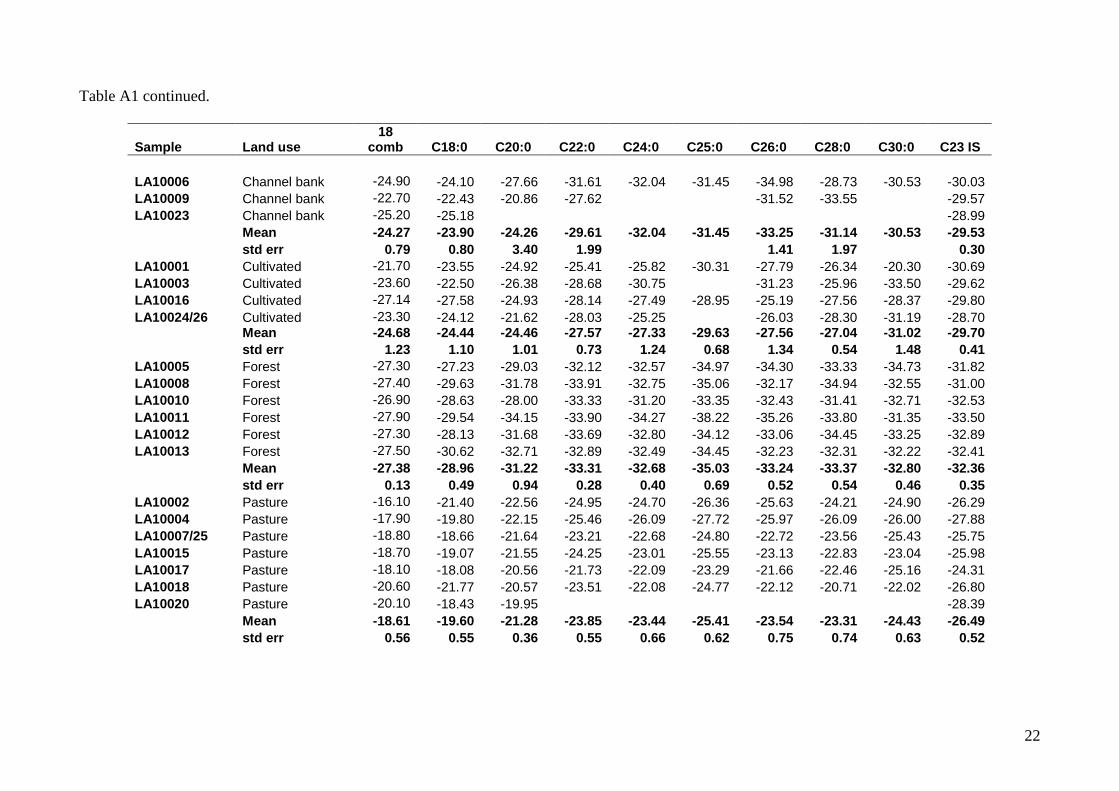
Table A1 continued.
Sample Land use 18
comb C18:0 C20:0 C22:0 C24:0 C25:0 C26:0 C28:0 C30: 0 C23 IS LA10006 Channel bank -24.90 -24.10 -27.66 -31.61 -32.04 -31.45 -34.98 -28.73 -30.53 -30.03 LA10009 Channel bank -22.70 -22.43 -20.86 -27.62 -31.52 -33.55 -29.57 LA10023 Channel bank -25.20 -25.18 -28.99 Mean -24.27 -23.90 -24.26 -29.61 -32.04 -31.45 -33.25 -31.14 -30.53 -29.53 std err 0.79 0.80 3.40 1.99 1.41 1.97 0.30 LA10001 Cultivated -21.70 -23.55 -24.92 -25.41 -25.82 -30.31 -27.79 -26.34 -20.30 -30.69 LA10003 Cultivated -23.60 -22.50 -26.38 -28.68 -30.75 -31.23 -25.96 -33.50 -29.62 LA10016 Cultivated -27.14 -27.58 -24.93 -28.14 -27.49 -28.95 -25.19 -27.56 -28.37 -29.80 LA10024/26 Cultivated -23.30 -24.12 -21.62 -28.03 -25.25 -26.03 -28.30 -31.19 -28.70 Mean -24.68 -24.44 -24.46 -27.57 -27.33 -29.63 -27.56 -27.04 -31.02 -29.70 std err 1.23 1.10 1.01 0.73 1.24 0.68 1.34 0.54 1.48 0.41 LA10005 Forest -27.30 -27.23 -29.03 -32.12 -32.57 -34.97 -34.30 -33.33 -34.73 -31.82 LA10008 Forest -27.40 -29.63 -31.78 -33.91 -32.75 -35.06 -32.17 -34.94 -32.55 -31.00 LA10010 Forest -26.90 -28.63 -28.00 -33.33 -31.20 -33.35 -32.43 -31.41 -32.71 -32.53 LA10011 Forest -27.90 -29.54 -34.15 -33.90 -34.27 -38.22 -35.26 -33.80 -31.35 -33.50 LA10012 Forest -27.30 -28.13 -31.68 -33.69 -32.80 -34.12 -33.06 -34.45 -33.25 -32.89 LA10013 Forest -27.50 -30.62 -32.71 -32.89 -32.49 -34.45 -32.23 -32.31 -32.22 -32.41 Mean -27.38 -28.96 -31.22 -33.31 -32.68 -35.03 -33.24 -33.37 -32.80 -32.36 std err 0.13 0.49 0.94 0.28 0.40 0.69 0.52 0.54 0.46 0.35 LA10002 Pasture -16.10 -21.40 -22.56 -24.95 -24.70 -26.36 -25.63 -24.21 -24.90 -26.29 LA10004 Pasture -17.90 -19.80 -22.15 -25.46 -26.09 -27.72 -25.97 -26.09 -26.00 -27.88 LA10007/25 Pasture -18.80 -18.66 -21.64 -23.21 -22.68 -24.80 -22.72 -23.56 -25.43 -25.75 LA10015 Pasture -18.70 -19.07 -21.55 -24.25 -23.01 -25.55 -23.13 -22.83 -23.04 -25.98 LA10017 Pasture -18.10 -18.08 -20.56 -21.73 -22.09 -23.29 -21.66 -22.46 -25.16 -24.31 LA10018 Pasture -20.60 -21.77 -20.57 -23.51 -22.08 -24.77 -22.12 -20.71 -22.02 -26.80 LA10020 Pasture -20.10 -18.43 -19.95 -28.39 Mean -18.61 -19.60 -21.28 -23.85 -23.44 -25.41 -23.54 -23.31 -24.43 -26.49 std err 0.56 0.55 0.36 0.55 0.66 0.62 0.75 0.74 0.63 0.52
23
LA10014 Subsoil -28.40 -27.78 -27.29 -31.59 -31.47 -29.92 -32.11 -33.11 -31.59 -29.62 LA10019 Subsoil -22.50 -22.31 -19.03 -28.24 LA10021 Subsoil -24.40 -25.15 -28.53 Mean -23.45 -23.73 -19.03 -28.38 std err 0.95 1.42 0.42 Sandy Ck Sediment -24.40 -26.95 -26.46 -29.02 -28.76 -30.12 -30.16 -29.34 Logan River Lwr Sediment -23.00 -20.11 -24.74 -29.20 -29.37 -29.48 -27.48 -29.08 Albert river Lwr Sediment -27.40 -27.52 -30.22 -33.02 -30.14 Logan uppermost Sediment -27.30 -29.59 -31.42 -31.72 -30.93 -34.02 -32.32 -33.75 -30.24 Cannon Ck Sediment -21.10 -23.26 -23.39 -29.51 Canungra Ck Sediment -26.60 -28.36 -31.01 -32.21 -32.66 -32.10 -33.87 -29.30 Teviot B Lwr Sediment -22.60 -25.54 -29.46 -27.68 -27.02 -29.12 -28.96 -29.36


![Monitoring Riverbank Erosion in Mountain Catchments Using ... · The use of terrestrial laser scanning (TLS) [22,23] has become a well-established practice for detecting riverbank](https://img.pdfslide.net/doc/110x75/5f5a82bbd93f9132702ed4b0/monitoring-riverbank-erosion-in-mountain-catchments-using-the-use-of-terrestrial.jpg)