Embed Size (px)
Citation preview

RESEARCH Open Access
Land use change detection in Solan ForestDivision, Himachal Pradesh, IndiaShipra Shah1* and DP Sharma2
Abstract
Background: Monitoring the changing pattern of vegetation across diverse landscapes through remote sensing isinstrumental in understanding the interactions of human activities and the ecological environment. Land use pattern inthe state of Himachal Pradesh in the Indian Western Himalayas has been undergoing rapid modifications due tochanging cropping patterns, rising anthropogenic pressure on forests and government policies. We studied landuse change in Solan Forest Division of Himachal Pradesh to assess species wise area changes in the forests ofthe region.
Methods: The supervised classification (Maximum likelihood) on two dates of IRS (LISS III) satellite data wasperformed to assess land use change over the period 1998–2010.
Results: Seven land use categories were identified namely, chir pine (Pinus roxburghii) forest, broadleaved forest,bamboo (Dendrocalamus strictus) forest, ban oak (Quercus leucotrichophora) forest, khair (Acacia catechu) forest,culturable blank and cultivation. The area under chir pine, cultivation and khair forests increased by 191 ha(4.55 %), 129 ha (13.81 %) and 77 ha (23.40 %), whereas the area under ban oak, broadleaved, culturable blankand bamboo decreased by 181 ha (16.58 %), 152 ha (6.30 %), 71 ha (2.72 %) and 7 ha (0.47 %), respectively.
Conclusions: The study revealed a decrease in the area under forest and culturable blank categories and asimultaneous increase in the area under cultivation primarily due to the large scale introduction of horticulturalcash crops in the state. The composition of forests also exhibited some major changes, with an increase in thearea of commercially important monoculture plantation species such as pine and khair, and a decline in the areaof oak, broadleaved and bamboo which are facing a high anthropogenic pressure in meeting the livelihooddemands of forest dependent communities. In time deforestation, forest degradation and ecological imbalancesdue to the changing forest species composition may inflict irreversible damages upon unstable and fragilemountain zones such as the Indian Himalayas. The associated common property externalities involved at local,regional and global scales, necessitate the monitoring of land use dynamics across forested landscapes indeveloping future strategies and policies concerning agricultural diversification, natural forest conservation andmonoculture tree plantations.
Keywords: Land use; Solan Forest Division; Supervised Classification; Maximum likelihood
* Correspondence: [email protected] of Forestry, College of Agriculture, Fisheries and Forestry, FijiNational University, NasinuP.O. Box 7222, Fiji IslandsFull list of author information is available at the end of the article
© 2015 Shah and Sharma. Open Access This article is distributed under the terms of the Creative Commons Attribution 4.0International License (http://creativecommons.org/licenses/by/4.0/), which permits unrestricted use, distribution, andreproduction in any medium, provided you give appropriate credit to the original author(s) and the source, provide a link tothe Creative Commons license, and indicate if changes were made.
Shah and Sharma Forest Ecosystems (2015) 2:26 DOI 10.1186/s40663-015-0050-7
BackgroundVery few landscapes remain on Earth that have not beensignificantly altered by the human race in one way or an-other (Yang 2001). Land use land cover (LULC) changeis the primary modifier of landscapes, affecting a widerange of socioeconomic, biological, climatic, and hydro-logical systems (Sohl and Sohl 2012). Understanding thespatial extent and distribution of LULC change is vital tothe study of environmental changes at various levels(Ojima et al. 1994). LULC change is one of the keydrivers of local and regional climate change (Chase et al.1999), biodiversity decline (Sala et al. 2000), soil degrad-ation (Tolba and El-Kholy 1992) and the loss of ecosys-tem services, thereby affecting the ability of ecosystemsto support human needs (Vitousek et al. 1997). Popula-tion growth, rapid economic development and povertyhave been identified as the underlying causes of land usechange resulting in deforestation and land degradation(Giri et al. 2003; Bolland et al. 2007).During the 1960s the concept of vegetation mapping
gained momentum, resulting in an increase in studies ofLULC change worldwide (Yang 2001). It is universallyacknowledged that declining forest cover triggers eco-logical problems like changes in global climate, habitatdegradation and unprecedented species extinction(Goldsmith 1998). Atmospheric carbon dioxide concen-tration is now higher than at any time in the past 10million years (Kennedy and Hanson 2006). It is esti-mated that forests (including associated soils, peat de-posits and lake sediments) hold 62–78 % of the world’sterrestrial biospheric carbon (IPCC 2001). Forest clear-ing is one of the major drivers of global warming andclimate change. The world’s forests particularly those inthe tropics are shrinking at a dramatic rate (Apan 1999).Anthropogenic activities involving forests, such as landuse change can alter the amount and temporal distribu-tion of C storage (Adams et al. 1993; Haynes et al.1994). According to Achard et al. (2014), the gross lossof tropical forests was 8.0 million ha yr−1 in the 1990sand 7.6 million ha yr−1 in the 2000s, which resulted incarbon losses of 887 MtC yr−1 and 880 MtC yr−1 re-spectively during the same period. It is imperative thatregular periodic assessments of forest cover change intropical regions are carried out to recognize previouspatterns, assist proper planning and predict futuretrends. The use of remote sensing data has been instru-mental in monitoring the changing pattern of vegetationacross diverse landscapes. The capacity for large geo-graphical coverage, high temporal frequency and wideselection of spatial and spectral resolution options, fur-ther enhances the use of remotely sensed imagery forLULC change detection.LULC change is primarily a local event, since the char-
acteristics of such change can vary dramatically from
one region to another. In order to capture the unique-ness of each region it is necessary that LULC studies areconducted at local to regional scales to better under-stand the cumulative impacts at multiple scales (Sohl etal. 2004). Over the years land use and cropping patternsin the western Himalayan state of Himachal Pradeshhave been changing. The expansion of cultivation at theexpense of forests has been relatively more profound inHimachal Pradesh than other parts of India (Melkaniaand Melkania 1987). The introduction of horticulturalcash crops and the commercialization of agriculturehave placed greater demands on the forests (Gouri et al.2004) of the state which have not only been undergoinga change in area but also a change in composition pri-marily due to human interference (Deshingkar et al.1997). To arrest forest degradation the state governmenthas been involved in raising monoculture tree planta-tions of species such as pine which offer relatively lessecological and economic services to forest dependentcommunities as compared to mixed broadleaved forests(Baland et al. 2008). Another grievous cause of concernis the replacement of oak by pine in the Indian WesternHimalayas. Thus, the forested landscapes in the state areundergoing major transformations. Some LULC changestudies have been conducted in Himachal Pradesh(Sharma et al. 2014, Singh et al. 2014, Chand and Cha-tranta 2014, Pareta 2014, Pareta and Pareta 2014, Rama-chandra et al. 2012) but none have specifically focusedon the change in the forests of the region to highlightspecific trends in species area and composition. There-fore, the present study is an attempt to study land usechange in Solan Forest Division, to highlight specieswise area changes which can play an indispensiblerole in developing future strategies and policies con-cerning natural forest conservation and monoculturetree plantations.
MethodsStudy areaThe population of Himachal Pradesh as per the Censusof India, 2011 is 6.86 million, with a decadal growth rateof 12.81 %. Around 90 % of the total population lives inrural areas and consequently people are highlydependent upon forests for their livelihoods (Gouri et al.2004). Local communities depend on forests for fuel-wood, fodder, grazing, non-timber forest products andconstruction timber through Timber Distribution (TD)rights. There has been an ever increasing pressure onthe forest resources due to the rising population on onehand as well as limited and fragmented agricultural landon the other.The state has a predominantly agro-horti-pastoral
economy. Apart from forests around 87 % of the popu-lation also depends on agriculture (Gouri et al. 2004).
Shah and Sharma Forest Ecosystems (2015) 2:26 Page 2 of 12
While in the lower valleys agriculture and animal hus-bandry form the backbone of the economy, at higher al-titudes, agro-pastoral systems predominate. Due to ahigh population density per unit area of agriculturalland, and small size of landholdings– 64 % are less than1 ha (Gouri et al. 2004), agriculture which was primar-ily for subsistence and considered an uneconomic voca-tion was diversified into horticulture which hasrelatively higher yields per unit area in terms of moneythan other agricultural crops (Ahluwalia 1998). Tem-perate fruits like apple, pear, stone fruits, nuts; sub-tropical fruits like mango, litchi, guava, citrus fruits;and new fruits crops like kiwi, strawberry, olive andhazelnuts have been introduced in recent years andhave since become a major source of the export earn-ings of the state. Himachal Pradesh is now known asthe fruit bowl of India and today the agriculture sectorprovides direct employment to around 71 % of the totalworking population (Kumar and Prashar 2012).The present study was carried out in Solan Forest
Division of Himachal Pradesh, which is located be-tween 30° 45’ 00” to 31° 10’00” N latitude and 76°55’00” to 77° 15’00’ E longitude. The area falls undersubtropical region where climate varies from extremehot in the lower elevations to extreme cold in higherelevations. Temperature in lower areas ranges between15 and 36 °C and in higher areas it varies from 0 to24 °C. Precipitation is in the form of rains mainly dur-ing rainy season and the area receives on an average1000 mm annual rainfall.The forests of the division are pure and mixed stands
of chir pine and mostly conform to Champion and Seth(1968) 9C1a - lower Shiwalik chir pine forests, lying be-tween an elevation of 900–2100 m a.s.l. The area above1800 m a.s.l is inhabited by oak forests. Low lying areasshow widespread population of bamboos and are also atransitional zone for Acacia catechu.
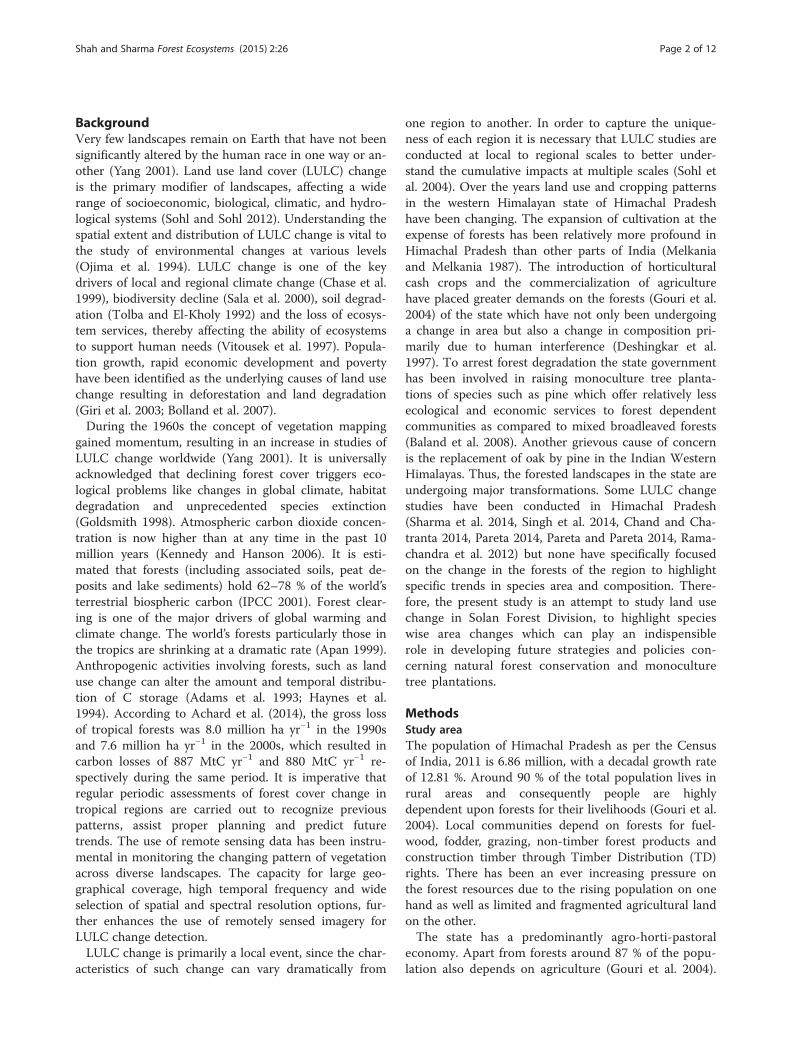
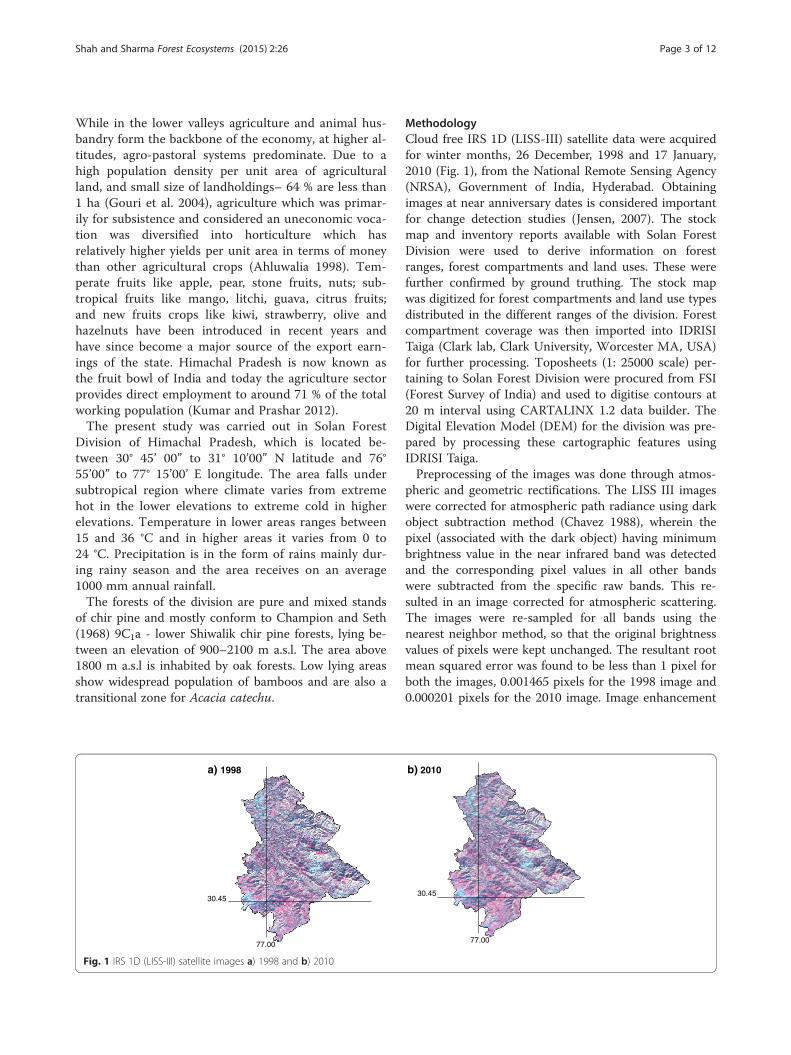
MethodologyCloud free IRS 1D (LISS-III) satellite data were acquiredfor winter months, 26 December, 1998 and 17 January,2010 (Fig. 1), from the National Remote Sensing Agency(NRSA), Government of India, Hyderabad. Obtainingimages at near anniversary dates is considered importantfor change detection studies (Jensen, 2007). The stockmap and inventory reports available with Solan ForestDivision were used to derive information on forestranges, forest compartments and land uses. These werefurther confirmed by ground truthing. The stock mapwas digitized for forest compartments and land use typesdistributed in the different ranges of the division. Forestcompartment coverage was then imported into IDRISITaiga (Clark lab, Clark University, Worcester MA, USA)for further processing. Toposheets (1: 25000 scale) per-taining to Solan Forest Division were procured from FSI(Forest Survey of India) and used to digitise contours at20 m interval using CARTALINX 1.2 data builder. TheDigital Elevation Model (DEM) for the division was pre-pared by processing these cartographic features usingIDRISI Taiga.Preprocessing of the images was done through atmos-
pheric and geometric rectifications. The LISS III imageswere corrected for atmospheric path radiance using darkobject subtraction method (Chavez 1988), wherein thepixel (associated with the dark object) having minimumbrightness value in the near infrared band was detectedand the corresponding pixel values in all other bandswere subtracted from the specific raw bands. This re-sulted in an image corrected for atmospheric scattering.The images were re-sampled for all bands using thenearest neighbor method, so that the original brightnessvalues of pixels were kept unchanged. The resultant rootmean squared error was found to be less than 1 pixel forboth the images, 0.001465 pixels for the 1998 image and0.000201 pixels for the 2010 image. Image enhancement
30.45
77.00
30.45
77.00
a) 1998 b) 2010
Fig. 1 IRS 1D (LISS-III) satellite images a) 1998 and b) 2010
Shah and Sharma Forest Ecosystems (2015) 2:26 Page 3 of 12

techniques such as histogram stretching, median filter-ing and compositing were also applied to aid visual in-terpretation. While histogram stretching is a linearstretch technique used for adjusting image intensities toenhance contrast; median filtering aids in random noiseremoval by creating an output image in which each pix-el's value is based on its value and those of its immediateneighbors in an input image. Colour composite imagesallow us to view the reflectance information from threeseparate bands in a single image, and were created byusing the bands which had the greatest amount of infor-mation, least redundancy and low relativity.The training sites were determined and a supervised
classification was performed on both images using Max-imum Likelihood algorithm. The supervised classifica-tion technique is preferred, because the data of the studyarea is available and the authors have a prior knowledgeof the area. The Maximum Likelihood decision rule isone of the most widely used supervised classification al-gorithms (Wu and Shao 2002; McIver and Friedl 2002).Land use classification was first done for the whole areaof Solan Forest Division, 57,158 ha (recorded forest area +non-forest area) and then from these classified images, theforest compartments 13,067 ha (recorded forest area)within the division were extracted, to assess the land usechange in the forests of the division. As a result the landuse maps depicting seven different land uses were derived.The flowchart elucidating the development of land usemaps is given in Fig. 2.A complete accuracy assessment was performed on
classified images of the two dates generated during thisstudy. A sample of ground truth points were distributedrandomly on the classified image. Total 450 points wereoverlaid over the classified image to assign to each pointan identifier of the land cover type. The ground truthdata (reference data) used were collected from field sur-veys and existing stock map that had been field checked.An error matrix was established to evaluate the accuracyof the classification. This is a very effective way to repre-sent the accuracy of the classification results, as the ac-curacy of each category is clearly described (Fan et al.2007). Overall accuracy, user and producer accuraciesand the Kappa statistics, were derived from the errormatrices. The overall accuracy was defined as the totalnumber of correctly classified pixels divided by the totalnumber of reference pixels (total number of samplepoints) (Rogan et al. 2002). The user accuracy was de-fined as the proportion of the correctly classified pixelsin a class to the total pixels that were classified in thatclass. It indicates the probability that a classified pixelactually represents that category in reality. The produceraccuracy was calculated by dividing the total number ofcorrectly classified pixels in a class by the total numberof reference measurements of that class and it is the
probability that a class identified from the reference datais correctly classified on the map. The KHAT statistics(an estimate of Kappa), which provides a measure ofhow many more pixels were correctly classified than ex-pected by chance (Congalton and Green 1999), wascomputed through the following formula:
k ¼ 0‐E1‐E
where: k represents the Kappa Index of Agreement; Ois the observed accuracy or proportion of matchingvalues (the matrix diagonal) i.e. the sum of the diagonalelements divided by the overall total; and E is the ex-pected proportion of matches in this diagonal i.e. thesum for each diagonal cell of the row total times the col-umn total divided by the overall total squared.
ResultsCartographic features obtained from the stockmap ofSolan Forest Division revealed that it covers five forestranges namely Dharampur, Parwanoo, Solan, Kandaghatand Subathu (Fig. 3). The area under these ranges was inthe order, Subathu (14198 ha) > Dharampur (11564 ha) >Solan (11027 ha) > Parwanoo (10688 ha) > Kandaghat(9681 ha). Within these five forest ranges are distributedaround 256 forest compartments (Fig. 4). Dharampur isthe largest range having the maximum number of forestcompartments (94), followed by Parwanoo (75), Solan(37), Kandaghat (35) and Subathu range (15). In theseforest compartments, seven types of land uses wereidentified. These are: 1) chir pine (Pinus roxburghii) for-ests, 2) ban oak (Quercus leucotricophora) forests 3)khair (Acacia catechu) forests 4) bamboo (Dendrocala-mus strictus) forests 5) broad leaved forests 6) cultiva-tion and 7) culturable blank.
Accuracy assessmentThe user accuracy ranged between 74–93 % in 1998and, 85–92 % in 2010 (Table 1). Producer accuracyranged between 79–96 % in 1998 and, 86 and 92 % in2010 (Table 1). Classification accuracy as a result ofmaximum likelihood classification resulted in an overallaccuracy of 87 and 89 % and KHAT accuracy of 85 and87 % in 1998 and 2010, respectively (Table 2).
Changes in Land use (1998–2010)Land use classification was first done for the whole areaof Solan Forest Division which is spread over 57,158 haand includes both recorded forest area and non-forestarea (Fig. 5) and then from these classified images, theforest compartments spread over 13,067 ha within thedivision (recorded forest area) were extracted, to assessthe land use change in the forests of the division (Fig. 6).
Shah and Sharma Forest Ecosystems (2015) 2:26 Page 4 of 12

In 1998 the distribution of the various land use cat-egories i.e. chirpine, culturable blank, broadleaved, bam-boo, ban oak, cultivation and khair was over 4200, 2608,2413, 1491, 1092, 934 and 329 ha area which accountedfor 32.14, 19.96, 18.47, 11.41, 8.36, 7.15, and 2.52 % ofthe total area, respectively (Table 3). In 2010 chirpine,culturable blank, broadleaved, bamboo, cultivation, banoak and khair land use categories covered 4391, 2537,2261, 1498, 1063, 911 and 406 ha which accounted for33.60, 19.42, 17.30, 11.46, 8.13, 6.97 and 3.11 % of thetotal area, respectively. Chirpine, cultivation and khairincreased in area by 191 ha (4.55 %), 129 ha (13.81 %)and 77 ha (23.40 %) respectively from 1998 to 2010. Ban
oak, broadleaved, culturable blank and bamboo de-creased in area by 181 ha (16.58 %), 152 ha (6.30 %),71 ha (2.72 %) and 7 ha (0.47 %) respectively (Table 3).The area under forest and culturable blank decreased by72 and 71 ha respectively while that under cultivationincreased by 129 ha.
DiscussionThe computed accuracies of the classification processwere reasonable which can be explained by the fact thatthe total number of correctly classified pixels was high.User accuracy as a result of maximum likelihood classifi-cation ranged between 74–93 % in 1998 and 85–92 % in
Forest stockmap Toposheets
Digitization
Boundaries(Division, Ranges, Forest
compartments)
Rivers Roads Contours
D E MInventory Data and Field Survey
Satellite data
IRS (LISS III)-1998 IRS (LISS III)-2010
Geometric Rectification
Geometric Rectification
Atmospheric Rectification
Atmospheric Rectification
Signature Development
Signature Development
Supervised Classification
Supervised Classification
Landuse Map
Landuse Change Map
Fig. 2 Flow chart of the procedure followed to develop land use maps for Solan Forest Division
Shah and Sharma Forest Ecosystems (2015) 2:26 Page 5 of 12

2010; while producer accuracy ranged between 79–96 %in 1998 and 86–92 % in 2010. Pareta (2014) in a studyon land use and land cover change in Baddi district ofSolan, has reported user accuracy for various lands coverclasses between 93–100 % while producer accuracy
between 83–100 %. Sharma and Leon (2005)) whileworking on land cover classification of Solan districtusing IRS (LISS III) data of different seasons reported auser accuracy ranging between 64–89 %, 32 and 68 %,23–62 %; and producer accuracy between 46–100 %, 33
Fig. 3 Basemap of Solan Forest Division showing the five Forest Ranges
Shah and Sharma Forest Ecosystems (2015) 2:26 Page 6 of 12

and 74 %, 28–80 %, in summer, winter and spring data-sets respectively, as a result of maximum likelihood clas-sification. Overall accuracy in the present study for thedifferent land use categories was 87–89 % in 1998 and2010, respectively. Overall accuracies of 76 % in summerdataset as compared to 49 % and 46 % in winter andspring datasets respectively, have been reported bySharma and Leon (2005). Ramachandra et al. (2012)while studying landscape dynamics of Mandhala water-shed in Solan district of Himachal Pradesh using IRSLISS III and Landsat data reported overall accuraciesranging between 78.52–86.52 %. KHAT accuracies of 85% and 87 % in 1998 and 2010 land use classifications re-spectively were computed in the present study. Com-paratively lower accuracy as per 1998 classification wasdue to relatively higher mixing of spectral signatures be-tween different land use categories in 1998 than in 2010.Sharma and Leon (2005) have reported KHAT accuraciesof 71 %, 40 % and 38 % for summer, winter and springdatasets respectively.The land use classification showed a decrease in the
area under both forest and culturable blank, and an in-crease in the area under cultivation. Similar results havebeen reported by Ramachandra et al. (2012), in Mandhala
watershed, district Solan, where the area under forest de-creased by 537.04 ha and the area under cultivation in-creased by 33.93 ha over the period 1972–2007. Pareta(2014) reported a decrease in the forest cover by54.95 km2 and an increase in cropland by 1.66 km2 inBaddi town of district Solan over 1990–2013. Pareta andPareta (2014) reported a decline in agricultural land anddense forest by 41.42 km2 and 112 km2 respectively over2001–2013 in Chamba district of Himachal Pradesh.Land use pattern in Himachal Pradesh has undergone
tremendous transformation due to changes in agricul-ture cropping pattern, urbanization and industrialization.Crop diversification gained momentum in the ninetiesand now covers several new areas in low and mid hilldistricts of the state (Sharma, 2011). With the integra-tion of horticultural cash crops, changing land use andcropping patterns have evolved (Sharma et al. 2007;Singh 1999). The area under horticulture in the stateregistered an enormous increase from 86230 ha in1980–1981 to 186900 ha in 2005–2006. In Solan the percent share of area under non-foodgrain crops increasedfrom 8.25 % in 1982–1983 to over 12.96 % in 2004–2005 (Sharma, 2011). While only about 11 % of the totalgeographical area of the state is available for cultivation
30.45
77.00Fig. 4 Data Layer of Forest Compartments in Solan Forest Division
Shah and Sharma Forest Ecosystems (2015) 2:26 Page 7 of 12

(Sharma, 2011), over the years growing area under horti-cultural cash crops has put increasing pressure on forestresources through land clearing (Sharma et al. 2010). Ina study on forest based livelihoods in Himachal Pradesh,Gouri et al. (2004) reported that in two of the villageswhere apple cultivation was adopted 35 years ago, en-croachment in forest areas for fruit production has re-duced the forest cover to just 5 % in Kiari and 3 % inDhadi Rawat village. In Kullu district of Himachal, en-croachment of apple orchards into un-demarcated pro-tected forest and demarcated protected forest is acommon practice (ODA 1993). The use of wood for fruitpacking cases also resulted in extensive deforestation inthe state (Singh 1992). Up to mid-1980s, 0.2 million m3
of wood was extracted to make 20 million boxes annu-ally for packaging of fruits and vegetables (Stokes, 1983).Alternative packaging materials like corrugated card-board are being experimented with to deal with theproblem of forest exploitation; however fruit growershave issues with the quality of the boxes.
Rising population pressure and inappropriate policiesof the government have further threatened forest sus-tainability and are contributing to deforestation and for-est degradation. Nautor is an ancient right under whichlandless people are permitted to break fresh agriculturalland in common land areas by village elders (ODA 1993).In 1968 the Himachal Pradesh Nautor Land Rules cameinto force whereby the government started granting nau-tor land (redistributed land) upto one acre to landless andother eligible people for agriculture and horticulture(Chowdhry, 2008). The un-demarcated forest is the landthat was designated for allocation under nautor rights.This practice of giving away un-demarcated forest land tolandless cultivators under the provisions of the said ruleshas resulted in deforestation in the Himalayan state(Gupta 2007). Another policy in the history of forest man-agement in Himachal is the Timber Distribution (TD) sys-tem under which landowners or right holders claim rightsto timber, primarily to meet house construction or repairneeds. This policy while meeting the basic needs of thelocal population has also been the single largest reasonfor timber harvest in the western Himalayan region(Vasan 1998) due to the rampant misuse of these rights.Although the system was directed towards villagers, TDrights extended in urban areas as well. While previouslythe right to timber was unlimited it was later restrictedto one or two trees once every five years. However,
Table 2 Comparison of two classification accuracy measures fortwo dates
Classification Overall accuracy (%) KHAT accuracy (%)
1998 87 85
2010 89 87
Table 1 Error matrices as a result of land use classification for 1998 and 2010
Reference data 1998
Classified data Ban oak Chirpine Culturable Blank Broadleaved Bamboo Cultivation Khair Total User accuracy
Ban oak 46 3 1 0 0 1 0 51 90
Chirpine 1 64 2 4 0 0 0 71 90
Culturable Blank 1 6 65 0 0 3 0 75 87
Broadleaved 1 0 3 59 2 0 3 68 87
Bamboo 1 0 0 9 48 5 2 65 74
Cultivation 0 1 4 0 0 66 0 71 93
Khair 0 1 0 3 0 0 45 49 92
Total 50 75 75 75 50 75 50 450
Producer accuracy 92 85 87 79 96 88 90 87
Reference data 2010
Ban oak 43 3 1 0 0 0 0 47 91
Chirpine 4 67 1 3 0 1 0 76 88
Culturable Blank 0 1 68 3 0 3 0 75 91
Broadleaved 1 2 1 65 2 1 2 74 88
Bamboo 0 1 0 3 46 1 3 54 85
Cultivation 2 1 4 0 0 68 0 75 91
Khair 0 0 0 1 2 1 45 49 92
Total 50 75 75 75 50 75 50 450
Producer accuracy 86 89 91 87 92 91 90 89
Shah and Sharma Forest Ecosystems (2015) 2:26 Page 8 of 12

people were still paying the same nominal amount fixedin the last century which was about 20 % of the marketrate at the time of the initial forest settlements (Vasan1998) i.e. a right holder could buy a tree for a subsi-dized rate as low as Rs 3 to 5. In 1992–1993 the subsidyprovided by the forest department under TD was to thetune of Rs.795,600,000 (DFFC 1994). In time, the trad-itional timber distribution system was overrun by atimber mafia with approximately 150,000 m3 of timber(against a total growing stock of 96.8 million m3) carry-ing a market value of around Rs 750 million, extracted
annually in the state under the TD rights, being si-phoned off to timber industries (Gouri et al. 2004). Thispolicy was later reviewed in light of a strong opposition,and the Himachal Pradesh Forest (Timber Distributionto the Right Holders) Rules, 2013 were notified on 26December, 2013, which enhanced both the rates andperiodicity for grant of TD rights. The government hasalso been funding massive monoculture plantation drivesacross the state to arrest forest degradation which how-ever is able to generate relatively less ecological and eco-nomic services to forest dependent communities when
a) 1998 b) 2010
30.45
77.00
30.45
77.00
Fig. 6 Land use classification based on Minimum distance classifier for forest compartments extracted from Solan Forest Division – recordedforest area a) 1998 and b) 2010
a) 1998 b) 2010
77.00
30.45
77.00
30.45
Fig. 5 Land use classification based on Minimum distance classifier for the whole area of Solan Forest Division – recorded forest area plusnon-forest area a) 1998 and b) 2010
Shah and Sharma Forest Ecosystems (2015) 2:26 Page 9 of 12

compared to mixed broadleaved forests and so the viciouscycle of forest degradation has remained unchecked. Suchpolicies have a profound impact on forested landscapesand play a pivotal role in change of land use.Within the forest land use category, chirpine and khair
showed an increase in area, while ban oak, broadleavedand bamboo decreased in area over 1998–2010 period.Both chir pine and khair have been the primary planta-tion species of the state, where the focus has revolvedmore around commercially important species ratherthan ecologically valuable ones. An increase in the areaof chir pine over the period 1998–2010 may be attrib-uted to an increase in the area under plantations of chirpine. This species is being tapped for resin and is the lar-gest species raised under plantations in Himachal Pra-desh constituting about 30.60 % of the total area underplantations and it registered an increase in area of8265 ha over 1998–2001 (Planning Commission 2005).Also profuse regeneration under chir pine forests wasobserved during ground surveys of the study area. Anincrease in the area of khair may also be attributable toan increase in the area under plantations of khair whichare a commercial source of kattha and cutch. While kat-tha is used in betel-vine preparations normally referredto as paan, cutch is a by-product of the kattha industryused for dyeing, colouring pulp in paper industry, watersoftening and in deep oil drilling operations. Khair isthe second single largest species being raised underplantations in the state after chirpine constituting
17.64 % of the total area under plantations, and over1998–2001 period, there has been reported an increaseby over 7497 ha in the area under this species (PlanningCommission 2005).Conversely, a decrease in the area of ban oak may be
attributed to heavy anthropogenic pressure on oak for-ests in hill states which results in indiscriminate loppingof the species. Ban oak is a multipurpose species havinga good fodder and fuel quality; hence, it is under a highbiotic stress in Himalayan forests (Saxena et al. 1978;Tiwari and Singh 1982; Bankoti et al. 1986; Joshi andTiwari, 2011). Gouri et al. (2004), reported scarcity offodder in Himachal Pradesh due to factors like forestfire, decrease in grasslands and mounting land utilisationpressure due to the adoption of horticulture. This hasresulted in people keeping fewer cattle thereby affectingthe availability of cow dung and natural manure. As a re-sult the fuel requirements which were to some extentmet through cow dung cakes, are now solely dependenton forests (Gouri et al. 2004) such as those of oak whichare facing the problem of severe degradation. The totalannual consumption of rural domestic fuel in the state isaround 2.5 to 3.2 million tones, half of which is ex-tracted from public forests (Singh and Sikka 1992). De-crease in the area of ban oak may also be due to poorregeneration observed in these forests compared to for-ests of chir pine in ground surveys of the study area.According to Bhandari et al. (1997), the regenerationpotential of Pinus roxburghii is greater than that ofQuercus species.In the present study it is pertinent to observe that the
increase in the area of pine namely 191 ha, is compar-able with the decline in the area of oak namely 181 ha.This may be due to the replacement of oak by pinewhich has become an ever increasing phenomenon inthe Western Himalayas (Singh et al. 1984). The exploit-ive management practices exerted by hill population inoak forests have encouraged pine (Saxena et al.1984).Forests in the Indian Himalayas are burnt periodicallyby the local communities to encourage the growth ofgrasses. This increases the preponderance of fire-resistantspecies such as chir pine. The aggressiveness of chir pineand its capacity to colonize disturbed sites have enabled itto spread at the expense of ban oak forests which areunder immense biotic pressure (Singh and Singh 1984).A decrease in the area of broadleaved forests which
includes species such as Terminalia belerica, T. che-bula, Dalbergia sissoo, Pyrus pashia, Albizzia chinensis,Juglans regia and Celtis australis, has also been ob-served in the present study, primarily due to the an-thropogenic pressure of the forest fringe communities.According to Baland et al., 2008, broad-leaved foreststend to be more useful and consequently more de-graded than coniferous forests. The former are of
Table 3 Territorial (compartment wise) Land use change inSolan Forest Division
Category Area under Land Use (ha) % Changein Landuse Area
1998 2010
Cultivation 934 1063 129 (+)
(7.15) (8.13) (13.81)
Culturable Blank 2608 2537 71(−)
(19.96) (19.42) (2.72)
Forest Land use
Chir Pine 4200 4391 191 (+)
(32.14) (33.6) (4.55)
Ban oak 1092 911 181 (−)
(8.36) (6.97) (16.58)
Broad Leaved 2413 2261 152 (−)
(18.47) (17.30) (6.30)
Khair 329 406 77 (+)
(2.52) (3.11) (23.40)
Bamboo 1491 1498 7 (−)
(11.41) (11.46) (0.47)
Total 13,067 13,067
Figures in parenthesis are in percent
Shah and Sharma Forest Ecosystems (2015) 2:26 Page 10 of 12

greater utility to adjacent villages due to the superiorquality of firewood and fodder, and are also a source ofseveral non-timber forest products. The decrease in thearea under bamboo forests may be attributed to pressureon bamboo for its commercial purposes. In HimachalPradesh, bamboo forests are considered economicallyvery important and support local livelihoods. Severalvillagers generate income from them by making use ofbamboo in basket making (Gouri et al. 2004).
ConclusionLand use change reflects the role of human activities onnatural resources and the environment. Analysis of thespatial and temporal pattern of land use and assessmentof the key driving factors behind the associated changesis imperative for sustainable use of land and its re-sources. The present study characterized the land usechange of Solan Forest Division in Himachal Pradeshwhere the area under forests and culturable blank hasbeen decreasing while that under cultivation shows anincreasing trend. The forests of the division also exhibitsome major changes in terms of species compositionand area, specifically, an increase in the area of commer-cially important monoculture plantation species such aspine and khair, and a simultaneous decrease in the areaof ecologically important oak and broadleaved forestswhich are under a high biotic stress. Human drivingforces emerge as the key factor responsible for land usechange in the region. This study highlights how thecommercialization of agriculture, anthropogenic pressureon forests and government policies have, the potential tosignificantly alter land use pattern across mountain eco-systems. There is an immediate need to periodically moni-tor LULC change across forested areas to assist decisionmaking and future policies concerning agriculture and for-estry, both of which are a way of life for the people in thehills of India and nevertheless play a pivotal role in land-scape modification. The cumulative effects of deforest-ation, forest degradation and changes in the speciescomposition of forests in the long run may have far reach-ing adverse impacts on people, livelihoods, sustainabilityand the forest ecosystem services flowing from the IndianHimalayan Region.
AbbreviationsLULC: Land use land cover; IRS: Indian Remote Sensing; LISS III: LinearImaging Self-Scanning Sensor 3; NRSA: National Remote Sensing Agency;DEM: Digital Elevation Model; TD: Timber Distribution.
Competing interestsThe author(s) declare that they have no competing interests.
Authors’ contributionsSS carried out the image analysis, designed and drafted the manuscript. DPwas involved in the acquisition of the satellite imageries, interpretation ofthe data and in revising the manuscript. Both authors read and approvedthe final manuscript,
Authors’ information1) SS participated in this research as a doctoral student. Currently she isworking in the Department of Forestry, College of Agriculture, Fisheries andForestry, Fiji National University, Nasinu, Fiji Islands.2) DP is a professor of Silviculture at Dr. Y.S. Parmar University of Horicultureand Forestry, Solan, Himachal Pradesh, India.
AcknowledgementsAuthors are grateful to Forest Division Solan, Himachal Pradesh for providingnecessary help and guidance.
Author details1Department of Forestry, College of Agriculture, Fisheries and Forestry, FijiNational University, NasinuP.O. Box 7222, Fiji Islands. 2Department ofSilviculture and Agroforestry, Dr. Y.S. Parmar University of Horiculture andForestry, Solan, Himachal Pradesh, India.
Received: 23 June 2015 Accepted: 24 September 2015
ReferencesAchard F, Beuchle R, Mayaux P, Stibig HJ, Bodart C, Brink A, Carboni S, Desclee B,
Donnay F, Eva HD, Lupi A, Rasi R, Seliger R, Simonetti D (2014) Determinationof tropical deforestation rates and related carbon losses from 1990 to 2010.Glob Chang Biol 20(8):2540–2554
Adams R, Adams D, Callaway J, Chang C, McCarl B (1993) Sequestering carbonon agricultural land: social costs and impacts on timber markets. ContempPol Issues 11:76–87
Ahluwalia MS (1998) Social, Cultural, and Economic History of Himachal Pradesh.Indus Publishing, New Delhi
Apan AA (1999) GIS applications in tropical forestry. Faculty of engineering andsurveying. University of Southern Queensland, Toowoomba, Queensland,Australia
Baland JM, Bardhan P, Das S, Mookherjee D (2008) Forests to the People:Decentralization and Forest Degradation in the Indian Himalayas. World Dev38(11):1642–1656
Bankoti TNS, Melkania U, Saxena AK (1986) Vegetation analysis along analtitudinal gradient in Kumaun Himalaya. Indian J Ecol 13:211–221
Bhandari BS, Mehta JP, Nautiyal BP, Tiwari SC (1997) Structure of Chir Pine (Pinusroxburghii Sarg.) community along an altitudinal gradient in GarhwalHimalaya. Int J Ecol Environ Sci 23:67–74.
Bolland LP, Ellis EA, Gholz HL (2007) Land use dynamics and landscape history inLa Montana, Campeche, Mexico. Landsc Urban Plan 82:198–207
Champion HG, Seth SK (1968) A revised survey of the forest types of India.Government of India Publications Division, New Delhi
Chand K, Chatranta M (2014) GIS & remote sensing technique to examineLanduse / Landcover Changes: A Case Study of emerging industrial hub ofDistrict Solan, Himachal Pradesh. Indian J Appl Res 4(6):218–220
Chase TN, Pielke RA, Kittel TGF, Nemani RR, Running SW (1999) Simulatedimpacts of historical land cover changes on global climate in northernwinter. Clim Dyn 16:93–105
Chavez PS (1988) An improved dark object subtraction technique for atmosphericcorrection of multispectral data. Remote Sens Environ 24:459–479
Chowdhry P (2008) Gender Discrimination in Land Ownership. SAGE Publications,India
Congalton RG, Green K (1999) Assessing the Accuracy of Remotely Sensed Data:Principles and Practices. Lewis Publications, Boca Raton, USA
Department of Forest Farming and Conservation (1994) Annual AdministrativeReport. Himachal Pradesh
Deshingkar P, Bradley PN, Chadwick MJ, Leach G (1997) Adapting to climatechange in a forest-based land use system: a case study of Himachal Pradesh,India. Stockholm Environment Institute, Stockholm
Fan F, Weng Q, Wang Y (2007) Land use and land cover change in Guangzhou,China, from 1998 to 2003, based on Landsat TM/ETM+ imagery. Sensors7:1323–1342
Giri C, Defourny P, Shrestha S (2003) Land cover characterization and mapping ofcontinental Southeast Asia using multi-resolution satellite sensor data. Int JRemote Sensing 24(21):4181–4196
Goldsmith FB (1998) Tropical rain forest. Chapman and hall, London
Shah and Sharma Forest Ecosystems (2015) 2:26 Page 11 of 12

Gouri MS, Morrison E, Mayers J (2004) Policy influences on forest-basedlivelihoods in Himachal Pradesh, India. International Institute for Environmentand Development, London
Gupta HK (2007) Deforestation and Forest Cover Changes in the HimachalHimalaya, India. Int J Ecol Environ Sci 33(2–3):207–218
Haynes R, Alig R, Moore E (1994) Alternative Simulations of Forestry ScenariosInvolving Carbon Sequestration Options. USDA Forest Service Gen. Tech. Rep.PNW-GTR-335, Pacific Northwest Research Station, Portland, Oregon.
International Panel on Climate Change (IPCC) (2001) Climate Change: TheScientific Basis. Contribution of Working Group I to the Third AssessmentReport of the Intergovernmental Panel on Climate Change. CambridgeUniversity Press, Cambridge, UK
Jensen JR (2007) Introductory Digital Image Processing: a remote sensingperspective. Science Press and Pearson Education Asia Ltd, Beijing
Joshi NR, Tiwari A (2011) Regeneration status and phytosociology in Quercusleucotrichophora (A. Camus) and Pinus roxburghii (Sarg.) mixed forests in twodifferent aspects influenced by forest fires in community managed forests ofKumaun Central Himalaya, India. Nature and Science 9(9):160–166
Kennedy D, Hanson B (2006) Ice and history. Science 311:1673Kumar S, Prashar D (2012) An analysis on changing trends of foodgrains in
Himachal Pradesh. Int J Pharm Life Sci 3(6):1739–1742McIver DK, Friedl MA (2002) Using prior probabilities in decision-tree classification
of remotely sensed data. Remote Sens Environ 81:253–261Melkania NP, Melkania U (1987) Man and environment in Himachal Pradesh,
India. In: Chadha SK (ed) Himachal Himalayas: ecology and environment.Today and Tomorrow’s Printers and Publishers, New Delhi, pp 81–99
Ojima DS, Kalvin KA, Turner BL (1994) The global impact of land use change.BioScience 44(5):291–356
Overseas Development Administration Report (1993) Himachal Pradesh ForestryProject. Forestry Development in India and the Project Area. British HighCommission, New Delhi
Pareta K (2014) Land Use and Land Cover Changes Detection using MultiTemporal Satellite Data. Int J Manag Soc Sci Res 3(7):10–17
Pareta K, Pareta U (2014) Climate Change Impact on Land and Natural Resourcein Chamba Tehsil of Himachal Pradesh State, India. Int J Sc Tech 2(4):38–48
Planning Commission, Government of India (2005) Himachal PradeshDevelopment Report. State Plan Division, Academic Foundation
Ramachandra TV, Kumar U, Joshi NV (2012) Landscape Dynamics in WesternHimalaya – Mandhala Watershed, Himachal Pradesh, India. A J G 12(1):1–8
Rogan J, Franklin J, Roberts DA (2002) A comparison of methods for monitoringmultitemporal vegetation change using Thematic Mapper imagery. RemoteSens Environ 80(1):143–156
Sala OE, Chapin FS, Armesto JJ, Berlow E, Bloomfield J, Dirzo R, Huber-Sanwald E,Huenneke LF, Jackson RB, Kinzig A, Leemans R, Lodge DM, Mooney HA,Oesterheld M, Poff NL, Sykes MT, Walker BH, Walker M, Wall DH (2000)Biodiversity: global biodiversity scenarios for the year 2100. Science287:1770–1774
Saxena AK, Pandey U, Singh JS (1978). On the ecology of oak forest in NainitalHills, Kumoun Himalaya. In: Singh JS, Gopal B (eds) Glimpses of Ecology: Prof.R. Misra Commemoration Volume. Jaipur International Scientific Publication,Jaipur, India, pp 167–180
Saxena AK, Singh SP, Singh JS (1984) Population structure of forests of KumaunHimalaya. Implications for management. J Environ Manage 19:307–324
Sharma H (2011) Crop Diversification in Himachal Pradesh: Patterns, Determinantsand Challenges. Ind Jn of Agri Econ 66(1):97–114
Sharma DP, Bren L (2005) Effect of seasonal spectral variations on land coverclassification. J Indian Soc Remote 33(2):203–209
Sharma RK, Sankhayan PL, Hofstad O, Singh R (2007) Land use changes in theWestern Himalayan region - a study at watershed level in the state ofHimachal Pradesh, India. Int J Ecol Environ Sci 33:197–206
Sharma RK, Sankhayan PL, Singh R (2010) Land Use Changes and ForestDegradation in a Himalayan Watershed: Analysis and Policy Alternatives. JNat Res Pol Res 2(3):263–280
Sharma R, Rishi MS, Ahluwalia AS, Lata R (2014) Comparative change in landuse/landcover in the buffer zone of Kashlog limestone mines, Darlaghat,Himachal Pradesh, India using remote sensing and GIS tools. Int J RemoteSens Geosci 3(6):27–30
Singh RB (1992) Dynamics of Mountain Geosystems. Ashish Pub, New DelhiSingh RB (1999) Land use change, diversification of agriculture and agroforestry
in North-west India. In: Haque T (ed) Land Use Planning in India. NCAEPR,New Delhi, pp 122–130
Singh DV, Sikka BK (1992) Wood balance study of Himachal Pradesh. HimachalPradesh University, Shimla, Agro Economic Research Centre
Singh JS, Singh SP (1984) An integrated Ecological study of Eastern Himalayawith Emphasis on Natural Resources. Kumaun University, Nainital
Singh JS, Rawat YS, Chaturvedi OP (1984) Replacement of oak forest with pine inthe Himalaya affects the nitrogen cycle. Nature 311:54–56
Singh SK, Chandel V, Kumar H, Gupta H (2014) RS & GIS based urban land usechange and site suitability analysis for future urban expansion of Parwanooplanning area, Solan, Himachal Pradesh (India). Intl J Dev Res 4(8):1491–1503
Sohl TL, Sohl LB (2012) Land-Use Change in the Atlantic Coastal Pine BarrensEcoregion. Geogr Rev 102(2):180–201
Sohl TL, Gallant AL, Loveland TR (2004) The Characteristics and Interpretability ofLand Surface Change and Implications for Project Design. Photogramm EngRem S 70(4):439–448
Stokes V (1983) Need for Substitute Packaging for Environmental Harmony. In:National Workshop on substituting forest timber for packaging ofhorticultural produce, tea, tobacco and textiles, Vigyan Bhawan, New Delhi,30–31 July 1983.
Tiwari JC, Singh SP (1982) Vegetation analysis of a forest lying in transition zonebetween lower and upper Himalayan moist temperate forest. In: Paliwal GS(ed) The Vegetational Wealth of Himalayas. Puja Publishers, New Delhi, pp104–119
Tolba MK, El-Kholy OA (1992) The World Environment 1972–1992: Two Decadesof Challenge. Chapman & Hall, London
Vasan S (1998) Political Ecology of Timber Rights in the Western Himalayas. In:Proceedings of the IGES International Workshop on Forest ConservationStrategies for the Asia and Pacific Region, Institute for Global EnvironmentalStrategies, Kanagawa, Japan, 21–23 July, 1998
Vitousek PM, Mooney HA, Lubchenco J, Melillo JM (1997) Human domination ofearth’s ecosystems. Science 277:494–499
Wu W, Shao G (2002) Optimal. Combinations of Data, Classifiers, and samplingmethods for Accurate Characterizations of deforestation” Can J Remote Sens28(4):601–609
Yang X (2001) Change Detection Based on Remote Sensing Information Modeland its Application on Coastal Line of Yellow River Delta. Earth ObservationResearch Center, Tokyo, China
Submit your manuscript to a journal and benefi t from:
7 Convenient online submission
7 Rigorous peer review
7 Immediate publication on acceptance
7 Open access: articles freely available online
7 High visibility within the fi eld
7 Retaining the copyright to your article
Submit your next manuscript at 7 springeropen.com
Shah and Sharma Forest Ecosystems (2015) 2:26 Page 12 of 12