Embed Size (px)
Citation preview

Land Use Change in Amazonia: Institutional Analysis and Modeling at Multitemporal and Spatial Scales (LUA/IAM)
Gilberto Câmara and Maria Isabel Sobral Escada II Reunião Anual de Avaliação do Programa FAPESP Sobre Mudanças ClimáticasProcess Number: 2008/58112-0Duration: 01/03/2010 a 28/02/2014
São Paulo, 18 e 19 de fevereiro de 2016

Team
Pesquisadores
Gilberto Câmara (OBT INPE/Univ Munster)
Yosio Shimabukuro (OBT INPE)
Roberto Araújo de Oliveira Santos Junior CST/INPE
Corina Freitas OBT/INPE
Luciano Dutra OBT/INPE
Sidnei Santana OBT/INPE
Myanna Lansen (CST/INPE)
Patrícia Pinho (CST/INPE)
Leila Fonseca (OBT/INPE)
Thales Korting (OBT/INPE)
Maria Isabel Sobral Escada (OBT/INPE)
Silvana Amaral IOBT/INPE)
Ana Paula Dutra Aguiar (CST/INPE)
Pedro Andrade Ribeiro Neto (CST/INPE)
Fernando Ramos (LAC/INPE)
Colaboradores
Rene Poccard Chapuis (Cirad)
Mateus Batistella - Embrapa
Eduardo Brondízio – Univ de Indiana
Andrea Siqueira – Universidade de Indiana
Dengsheng Lu – Universidade de Indiana
Tiago Carneiro (UFOPA)
Ima Vieira (MPEG)
Pos Doc, Doutorado, Mestrado
Carolina Pinho pos doc
Nathan Vogh – pós doc
Alexandre Noma – pós doc
Vagner Camilotti - doutorando
Ana Paula Dal´Asta - doutorando
Elói de La Nora – doutorando
Taise Pinheiro - doutorando
Victor Maus - doutorando
Mariane Reis - mestranda
Juliana Mota de Siqueira
Giovana Espíndola - phd
Thalita - mestrado
André Gavlak – mestrado
Sérgio costa - phd

LUA/IAM Main Goal
To study the coevolution of institutional arrangements and land change in Amazonia, to achieve a broader understanding of their
impacts to regional and global environmental changes.
Institutions: Rules and Norms system organized and incorporated by social structure. (Ostrom, 1990). (legal convention and informal constraint)
1. How the social actors deal with norms and rules?
2. How norms and rules affect land change ?
3. How to model land change based on the analysis of Institutional arrangements?

LUA´s Lines of research – 4 axis
1. Social analysis for identification and
analysis of institutional arrangements that
influence land change
2. Measurement and mapping of land change
using novel remote sensing and image
processing methods
3. Detection and analysis ofland occupation patterns and
trajectories emerging from land changes related to theinstitutional arrangements
Development of tools for detecting, mapping and modeling temporal and spatialland change patterns: GeoDMA and TerraME
4. Construction of computational models and scenarios that capture
how social interactions and Institutional arrangements act on
land change.
LUA combines different research areas and conceptual works with toolboox
and method building.

Axis 1. Analysis of institutional arrangements that influence land change
Floresta Estadual e Nacional
Reserva Extrativista, Florestal e de desenvolvimento Sustentável
Área de Proteção Ambiental, Especial e de Relevante Interesse Ecológico
Projeto de Assentamento - PA
Projeto de Assentamento Agroextrativista - PAE
Projeto de Desenvolvimento Sustentável - PDS
Projeto de Assentamento Coletivo - PAC
Terras Indígenas
UC Proteção Integral
Period Categories of territory occupation Actors
Up to 1960 Public Land Appropriation (posse) Rubber farms and extratives
population
1965 - 1985 Public or private colonization, market land - Private capital or
appropriation of public lands
INCRA
Fams, Large companies
1988 -2000 SNUC – New category of Protection area – Sustainable Use
Area
Extrative; quilombolas
2000 - 2012 Multiplication of PAE, PAF, RESEX, creation of new protection
areas and indigenous land
Extrative population, indigenous,
quilombolas population.
Mosaic of Territorial Unities
From 2000 to 2012 :
• 112 Protection Areas
• 196 Protection Areas of Sustainable Use
• 66 Indigenous Land
• 358 Agro-extractive Settlement Project – INCRA
• Regularization of lands
Santos Jr., R. A., et al “Productive forests, communities and land use change an institutional Arrangement Analysis
In Western Amazonia".
Map produced by Aguiar, A. P
Source: MMA, IBAMA, ICMBIO, INCRA, ITERPA FUNAI

Institutional Arrangements Governing Land Use in Territorial Units
2000
2010
Land Cover, Roads and Territorial Units
1985
Santos Jr, R. A.; Aguiar, A. P.Vogh.,

Axis 1, 2 and 3. Developing Hierarchical Land-Cover Classification Key and Change Classe: Draft of Cross-Axis Land Cover Legend Translation Effort for Amazon Basin (Uplands)
FAPESP Research Program in e-science - Grant 2014/08398-6
Big Earth observation data analytics for land use and land cover change information
Project duration: January 01, 2015 – 31 December 2018
Land Cover Meta-Language (LCML- FAO)
Landsat/TM – 30m
Modis – 250m
Field work
Reis et al, under development

Axis 2. Measurement and mapping of land change, using novel remote sensing and image processing methods
Combining optical and SAR data for land cover classification using polarimetric radar data (ALOS/PALSAR and RADARSAT2), fused with optical remote sensing
complex biophysical environment and the high and persistent cloud cover during the most part of the year.
Radar data is not sensitive to clouds
different fusion techniques
Radar image - color composition R(HH)-G(HV)-B(HH).

Measurement and mapping of land change, using novel remote sensing and image processing methods
Landsat TM image provides higher land cover classification accuracy than radar datasets
The accuracy is improved when textural images are combined with multispectral bands;
When optical sensor data is not available due to cloud cover, radar data are valuable for coarse land cover classification.
L-band data can provide better classification than C-band
the use of texture attributes is recommended to improve classification accuracy
Comparison of classification results for the Altamira study area: (left) Landsat TM image; (middle) PALSAR L-band data; (right) TM multispectral and PALSAR L-band HH fusion image with the wavelet-merging technique.
Lu et al. GIScience & Remote Sensing,2011

Associando padrões a processos de mudança de cobertura da terra
1. Geométrica
4. Difusa
3. Espinha-de-peixe2. Corredor
5. Manchas 6.Ilhas
1. Geométrica
4. Difusa
3. Espinha-de-peixe2. Corredor
5. Manchas 6.Ilhas
Axis 3. Deforestation patterns associated to Land Occupation(Lambim, 1994; Mertens e Lambim, 1999; Geist e Lambim, 2001)
1) Geométrica – Áreas de
fazendas com finalidade
Comercial – Expansão agrícola
2) Corredor – Colonização
Espontânea
3) Espinha-de-peixe –
Assentamento planejado
4) Difusa – agricultura tradicional,
Subsistência
5) Manchas/Fragmentos – Áreas
com Manchas residuais de
Floresta
6) Ilhas – Áreas peri-urbanas

Axis 3. Detection and description of occupation patterns and trajectories:Land change patterns and populational dynamic in the Sustainable Forest
District of Br 163 (DFS BR-163)
Typology of Land Occupation Patterns and Frontier stages based on Deforestation Data
Prodes 1997, 2000, 2003, 2007.
Land Occupation Patterns 1997, 2000, 2003, 2007
Gavlak et al (2011)

Dynamic of Potential Spatial Population Distribution using
Multivariated Model
Trajectories of Land Occupation Patterns
Secondary Vegetation Dynamic
Axis 3. Integration of land occupation patterns with land cover and population data in a cell space: The frontiers dynamic in a novel territory unit from 2000 to 2007.
The Sustainable Forest District of Br 163 road
Gavlak et al (2011), Amaral et al (2012), Population and Environment, 2012

Entorno de Santarém - A expansão da soja:
Impactos sobre a estrutura das terras
1990 1999 2010
1990 a 2010: aumento dos
padrões
associados à concentração
de terras para agricultura
e pecuária em larga escala
(geométrico, geométrico
contínuo e misto)
258330
124
Dal’Asta et al (2013)

Axis3. Detection and description of occupation patterns and trajectories: Mapping and characterizing urbanized nucleus
Dal’ Asta, A . P. et al – Remote Sensing, 2012
Field work
Spatial Unities of Occupation

Example: Riverine Communities on Lower Tapajós
Conjunto Variáveis Atributos
Comunidade Unidade de Conservação ausência [0]/ presença [1]
Margem Margem direita [0]/ margem esquerda [1]
Número de pessoas 0 [0] a 350 [0.8]/ 400 [0.81] a 1000 [1]/ >1000 pessoas[1]
Bolsa Família nada [0]/ pouco [0.3]/muito [0.6]/ maioria [0.8]/ todos [1]
Instituições ausência [0]/ presença [1]
Número de associações ausência [0]/ 5 [1]
Idade da comunidade 0 a 130 anos [0 - 0.77]/ 131 a 320 [0.78 - 1]
Saúde e educação
Ensino infantil ausência [0]/ presença [1]
Ensino fundamental 2º ciclo ausência [0]/ presença [1]
Merenda nada[0]/<10% [0.10]/ <30% [0.33]/>25 <50% [0.38]/<50% [0.47]/50% [0.5]/< 67% [0.63]/67% [0.67]/75% [0.75]/>80%
[0.79]/83% [0.83]/>67 <100% [0.87]/90% [0.92]/100%[1]
EJA ausência [0]/ presença [1]
Posto de Saúde ausência [0]/ presença [1]
Saúde e Alegria ausência [0]/ presença [1]
Infra-estrutura
Energia ausência [0]/ gerador [0.5]/ hidroelétrica [1]
Água poço e/ou rio [0]/ poço artesiano e/ou encanada [1]
Lixo descarte e/ou céu aberto [0]/ Queima e/ou enterra [0.5]/ coleta e/ou aproveitamento [1]
Telefone ausência [0]/ só celular [0.5]/ orelhão e/ou fixo [0.8]/ ambos [1]
Mercado, bar e restaurante ausência [0]/ 6 [1]
Campo de futebol ausência [0]/ presença [1]
Igrejas ausência [0]/ evangélica ou católica [0.5]/ evangélica e católica [1]
Mantimentos origem não compra [0]/outras cmm [0.25]/outras cmm e cidade; local e outras cmm; cmm, cidade e outras cmm [0.5]/cidade [0.7]/
local [1]
Uso da terra Arroz ausência [0]/ presença [1]
Mandioca ausência [0]/ presença [1]
Frutas ausência [0]/ presença [1]
Castanha ausência [0]/ presença [1]
Açaí ausência [0]/ presença [1]
Pesca ausência [0]/ presença [1]
Caça ausência [0]/ presença [1]
Gado ausência [0]/ comércio local [0.5]/ comércio para outras cmm [1]
Mineração ausência [0]/ presença [1]
Mapping and Characterizing urbanized nucleus
Field campaign:62 Tapajós49 Arapiuns55 Upland DFS br-163
Amaral et al, REBEP, 2013

Description of networks:Transport
Pinho, C. D. M, 2012 - Thesis
Connectivity
Index
)(
)(
inout
inout
GG
GGIc

Eixos 1 e 4. What are the relations between changes in land use and the evolution of institutional arrangements in Amazonia?
How exogenous forces influence agents’ decisions represented by land market, the moving frontier and the institutional arrangements?
How they operate in shaping the evolution of deforestation?
Agent-based models of deforestation (Sergio Costa’s PhD, 2012)
Migration
Small-scale
extensive
farming
Large-scale
extensive
farming
Intensive
farming
Speculation
Abandoning
Rural
activity
Initial state Final
state
Agent states in São Felix do Xingu

Deforestation:simulated x observed
2005
2000 2005
Observed deforestation patterns
Model results – Simulation 3
Special areas Deforestation
2000 2010
2010
Period Institutional Arrangement
1985-1996
1997-2004
2005-2010
Private capitalist occupation
Beef market chain organization
Deforestation control
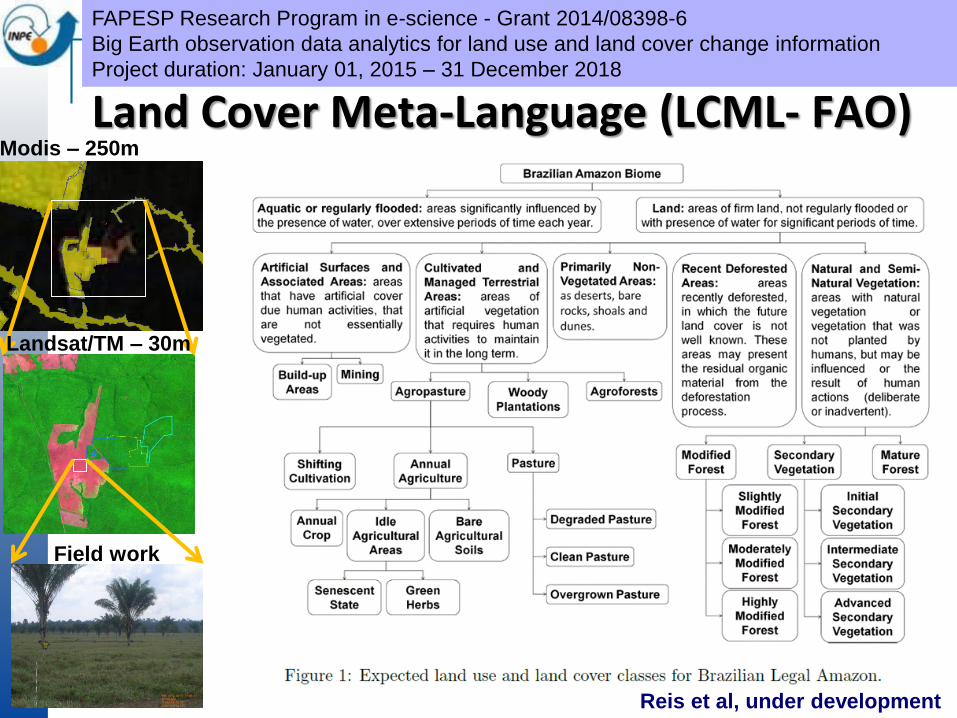
Amazônia in 2007 x All Variables
Variables
Transportation (11)
Distance Markets(7)
Demography (3)
Tecnology (2)
Environmental (20)
Public Policy(8)
Market (8)
Agrarian Structure(6)
Statistical analysis of deforestation
(Espindola et al., 2012)
Espíndola, G. et al, Applied Geography, 2012.
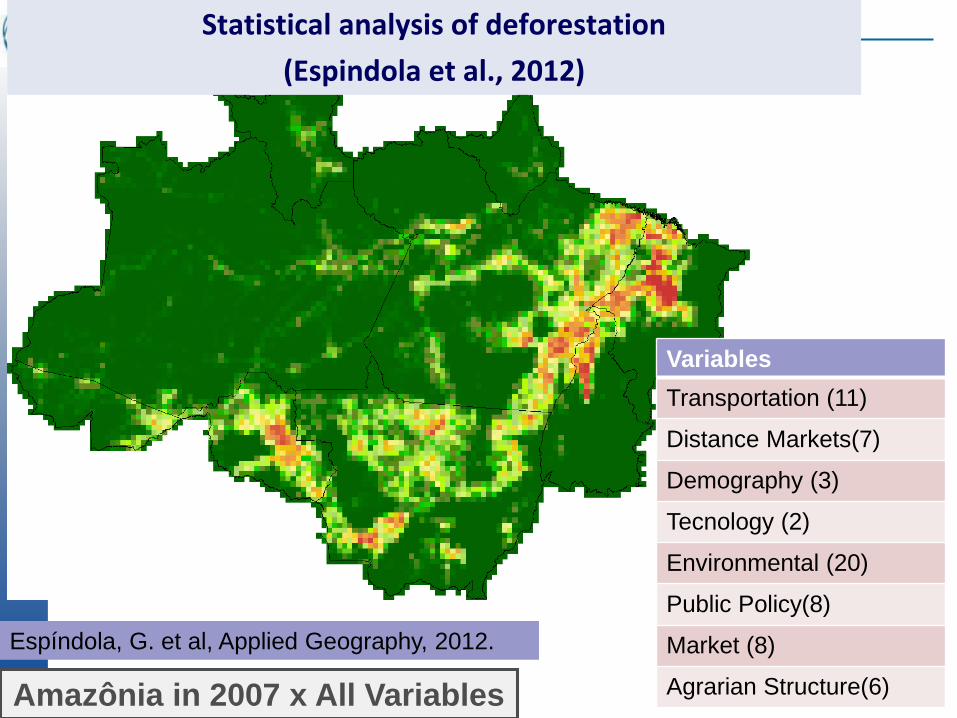
How have deforestation drivers changedbetween 1997 and 2007?
ModelR2 = 0.85 1997R2 = 0.88 2007
indigenous lands were
important in preventing
deforestation in 2007
Protected areas were
important in preventing
deforestation in 1997
Source: Espindola et al. (2012)

GLOBIOM: Global Biosphere Management Model
Partial equilibrium model: Agriculture, Forestry and Bioenergy sectors
MARKETS
Population & Economic Growth & Exogenous Demand Shocks
CommodityPrices and Quantities
Land Use
Environmental effects
LAND
SPA
TIA
L R
ESO
LUTI
ON
REG
ION
Wood Crops
Forest Cropland Pasture Other
Livestock
DEMAND
SUPPLY
source: IIASAREDD-PAC project (IIASA, INPE, IPEA)

Obrigada!
Indicadores de Produção
Teses 13
Teses em andamento 2
Dissertações de Mestrado 7
Pos-doc 2
Publicação - periódicos 39
Capítulo de livro 4
Artigos em Congresso 37
Relatórios técnicos 5
Dezembro de 2014