Embed Size (px)
Citation preview

Land Use Sector: Methods
Amintas Brandão Jr.Adjunct [email protected]
Technical Workshop for GHG Emissions Estimation:
Exploring the SEEG Framework for India
Workshop Support:
April 2015, New Delhi
Land Use ChangeGHG Emissions 1990-2013
Technical Team- Amintas Brandão Jr.- Brenda Brito- Carlos Souza Jr.
Acknowledgments - Universidade Federal de Viçosa (UFV) [Marcos Costa]- Imperial College (UK) [Isabel Rosa and Robert Ewers]- SOS Mata Atlântica- Laboratório de Processamento de Imagens e
Geoprocessamento (LAPIG)

Presentation Layout
1. Background
2. Method 1 – Inventory approach
3. Method 2 – Deforestation approach (proxy)
4. Lessons learned
5. Challegens
3

Background
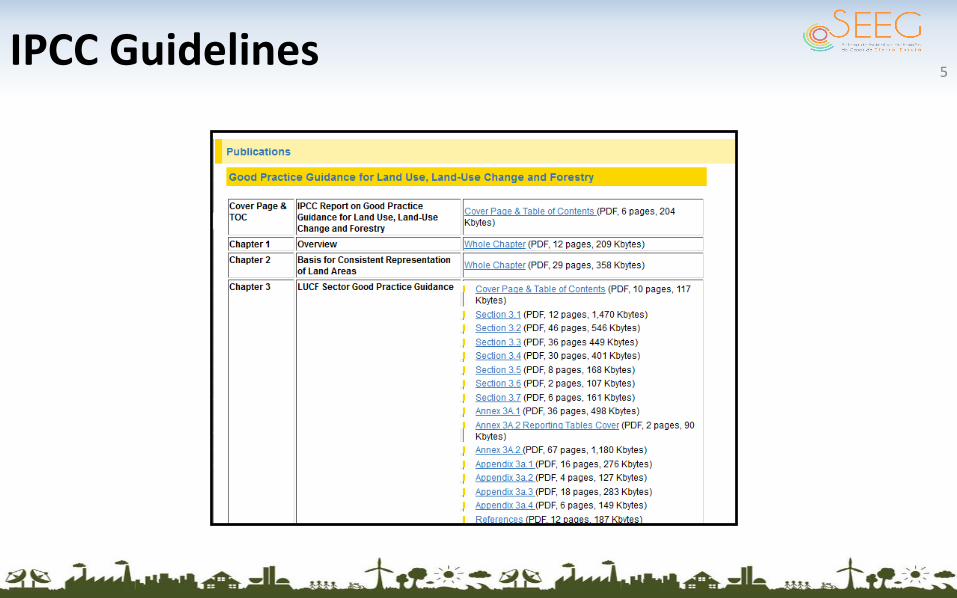
IPCC Guidelines5
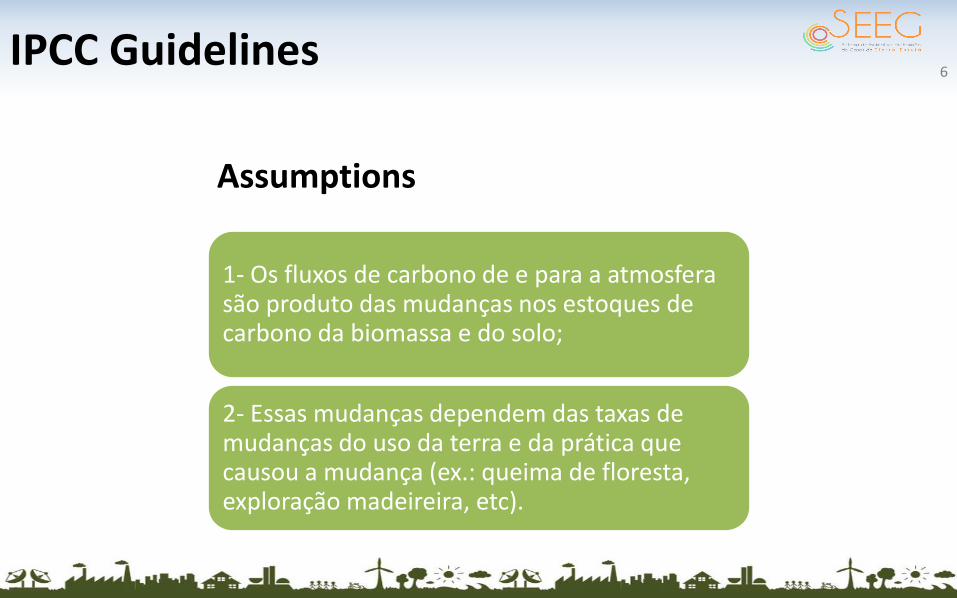
IPCC Guidelines
1- Os fluxos de carbono de e para a atmosfera são produto das mudanças nos estoques de carbono da biomassa e do solo;
2- Essas mudanças dependem das taxas de mudanças do uso da terra e da prática que causou a mudança (ex.: queima de floresta, exploração madeireira, etc).
6
Assumptions

IPCC: Tiers
Tier 3
Tier 2
Tier 1
7
Source: India (2012)
Method 1 – Inventory approach

Inventory approach (simplified)
IPCC: Tier 2
Land Use maps (primary data)
Biomass maps (Amazonia) and Literature (othersbiomes)
Emissions and Removals of GHG
9
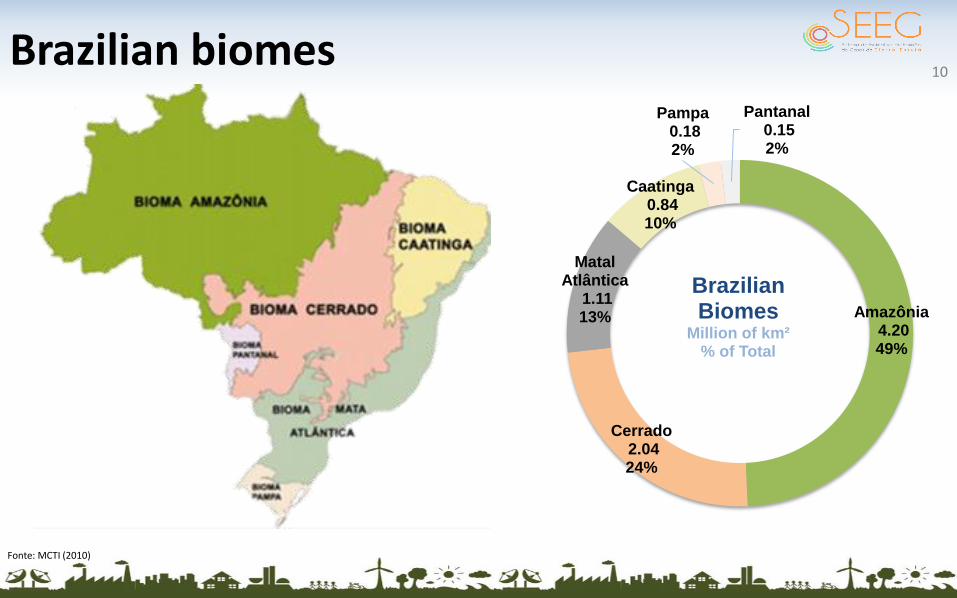
Brazilian biomes10
Fonte: MCTI (2010)
Amazônia4.20 49%
Cerrado2.04 24%
Matal Atlântica
1.11 13%
Caatinga0.84 10%
Pampa0.18 2%
Pantanal0.15 2%
Brazilian Biomes
Million of km²% of Total
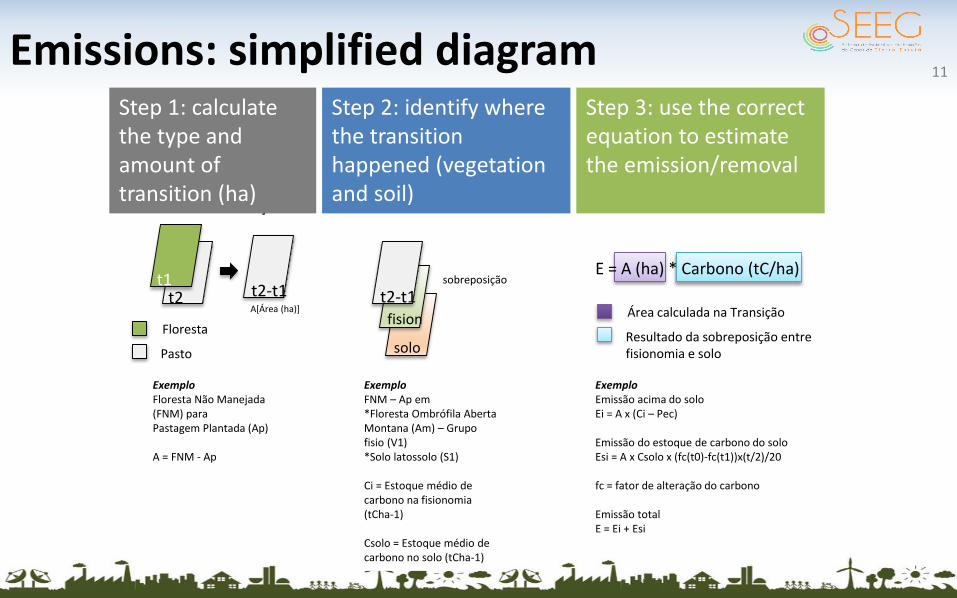
E = A (ha) * Carbono (tC/ha)
solo
fision
Emissions: simplified diagram11
t2 t2-t1t1
Passo 01 –Cálculo da transição
Passo 02 – Sobreposição com fisionomia e solo
sobreposição
Passo 03 – Cálculo da emissão
ExemploFloresta Não Manejada (FNM) paraPastagem Plantada (Ap)
A = FNM - Ap
ExemploFNM – Ap em*Floresta Ombrófila Aberta Montana (Am) – Grupo fisio (V1)*Solo latossolo (S1)
Ci = Estoque médio de carbono na fisionomia (tCha-1)
Csolo = Estoque médio de carbono no solo (tCha-1)
A[Área (ha)]
ExemploEmissão acima do soloEi = A x (Ci – Pec)
Emissão do estoque de carbono do soloEsi = A x Csolo x (fc(t0)-fc(t1))x(t/2)/20
fc = fator de alteração do carbono
Emissão totalE = Ei + Esi
Área calculada na Transição
Resultado da sobreposição entre fisionomia e solo
t2-t1
Floresta
Pasto
Step 1: calculate the type and amount of transition (ha)
Step 2: identify where the transition happened (vegetation and soil)
Step 3: use the correct equation to estimate the emission/removal
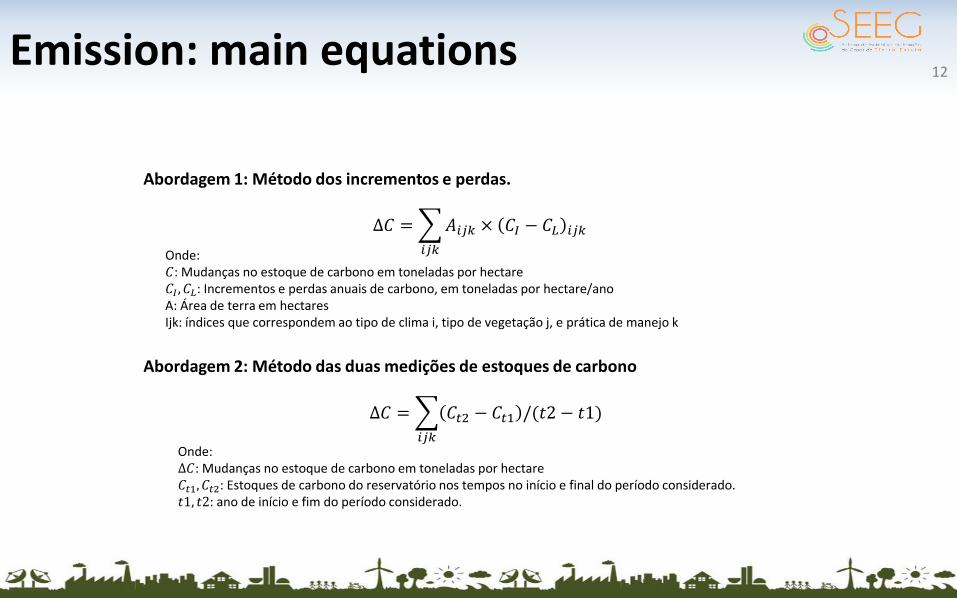
Emission: main equations
Onde:𝐶: Mudanças no estoque de carbono em toneladas por hectare𝐶𝐼 , 𝐶𝐿: Incrementos e perdas anuais de carbono, em toneladas por hectare/ano A: Área de terra em hectaresIjk: índices que correspondem ao tipo de clima i, tipo de vegetação j, e prática de manejo k
Δ𝐶 =
𝑖𝑗𝑘
𝐴𝑖𝑗𝑘 × 𝐶𝐼 − 𝐶𝐿 𝑖𝑗𝑘
Δ𝐶 =
𝑖𝑗𝑘
𝐶𝑡2 − 𝐶𝑡1 /(𝑡2 − 𝑡1)
Onde:Δ𝐶: Mudanças no estoque de carbono em toneladas por hectare𝐶𝑡1, 𝐶𝑡2: Estoques de carbono do reservatório nos tempos no início e final do período considerado.𝑡1, 𝑡2: ano de início e fim do período considerado.
Abordagem 1: Método dos incrementos e perdas.
Abordagem 2: Método das duas medições de estoques de carbono
12
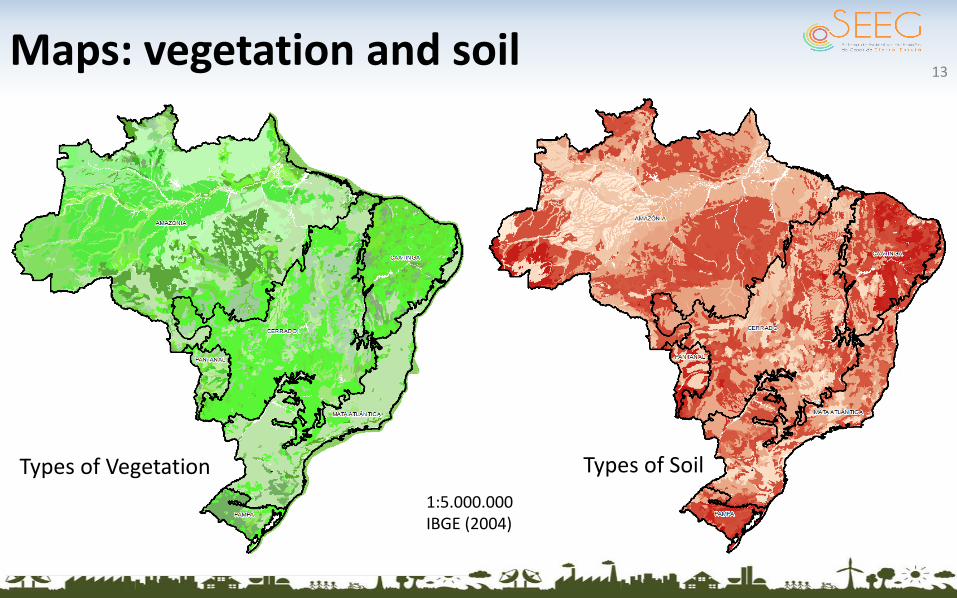
Maps: vegetation and soil13
Types of Vegetation Types of Soil
1:5.000.000IBGE (2004)
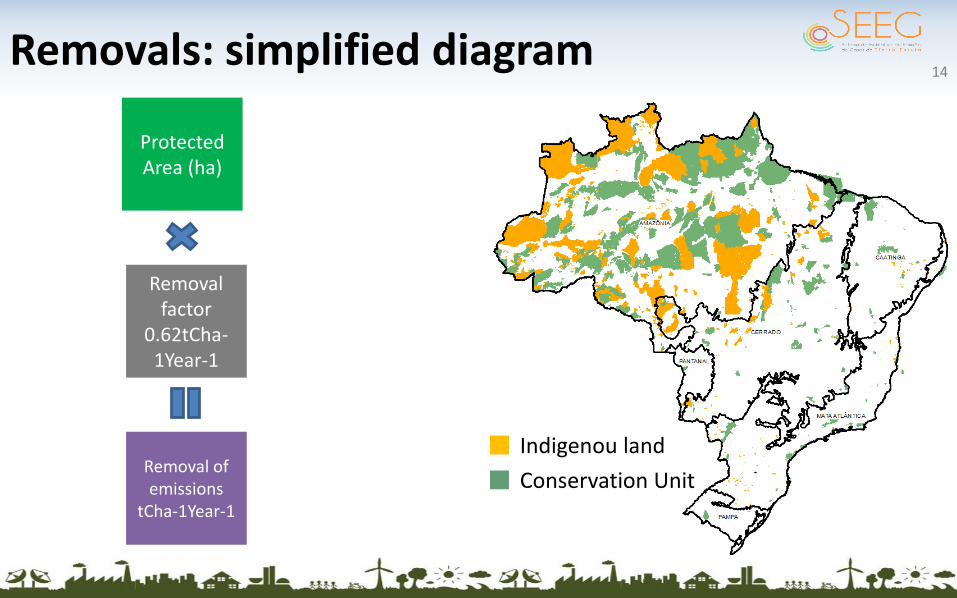
Removals: simplified diagram14
Indigenou land
Conservation Unit
Protected Area (ha)
Removal factor
0.62tCha-1Year-1
Removal of emissions
tCha-1Year-1
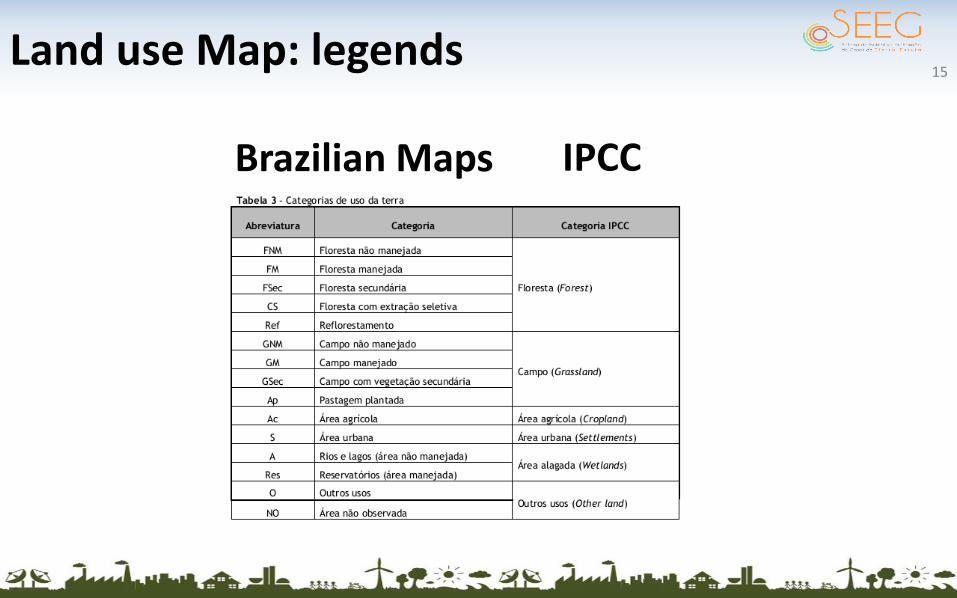
Land use Map: legends15
Brazilian Maps IPCC
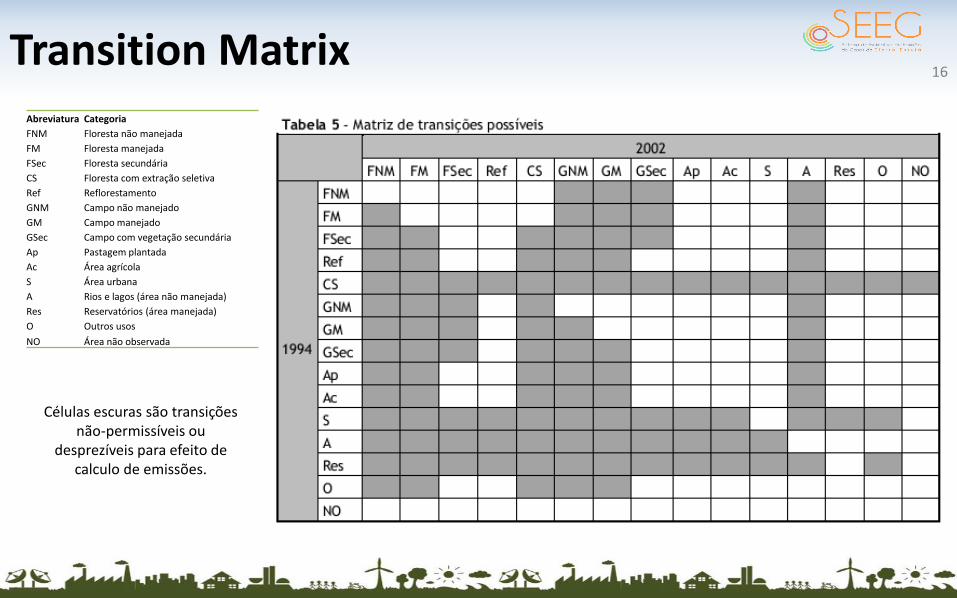
Transition Matrix
Células escuras são transições não-permissíveis ou
desprezíveis para efeito de calculo de emissões.
16
Abreviatura Categoria
FNM Floresta não manejada
FM Floresta manejada
FSec Floresta secundária
CS Floresta com extração seletiva
Ref Reflorestamento
GNM Campo não manejado
GM Campo manejado
GSec Campo com vegetação secundária
Ap Pastagem plantada
Ac Área agrícola
S Área urbana
A Rios e lagos (área não manejada)
Res Reservatórios (área manejada)
O Outros usos
NO Área não observada

Land Cover/Use Maps (example)
1994 2002
17
Scale: 1:250,000
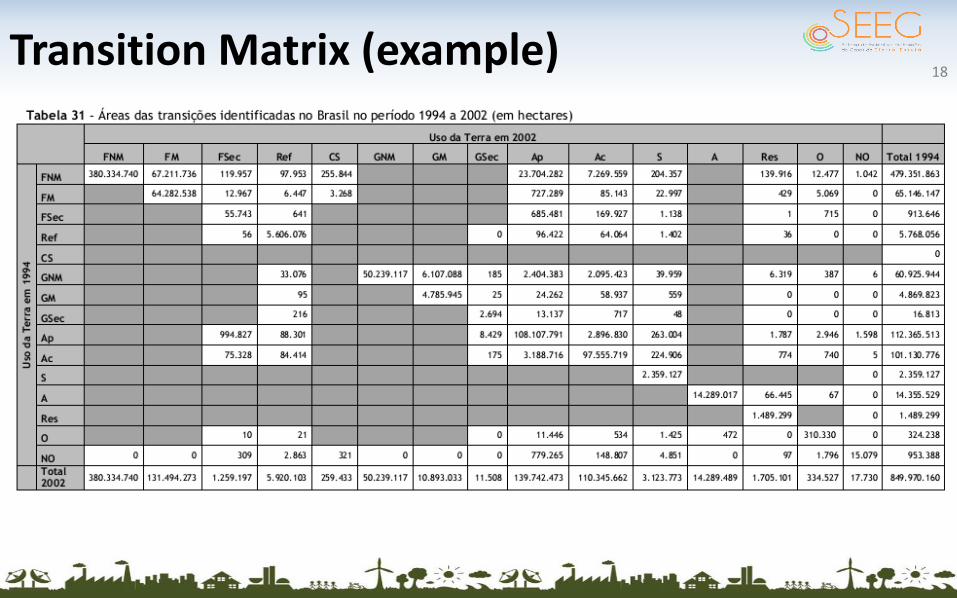
Transition Matrix (example)18
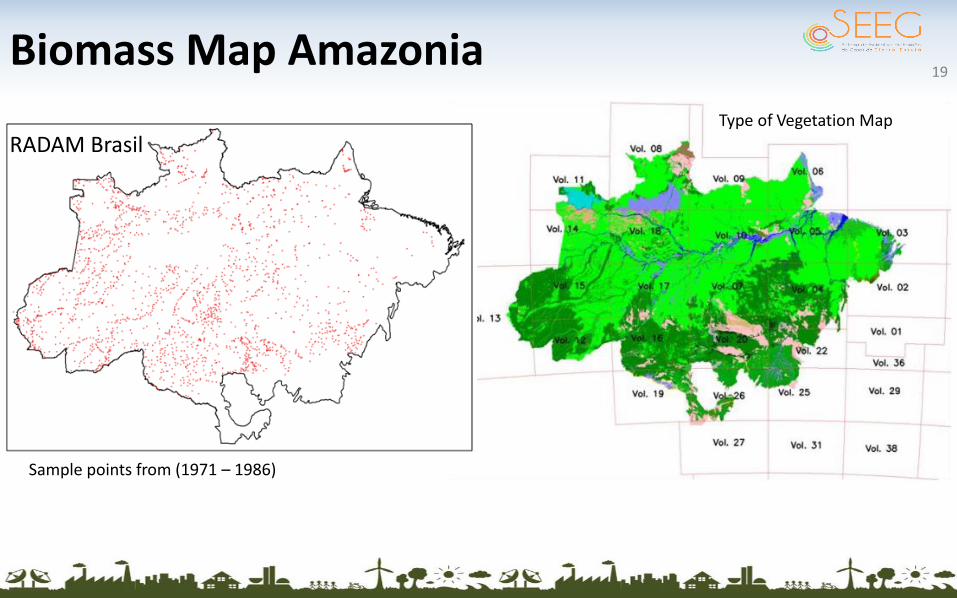
Biomass Map Amazonia
Sample points from (1971 – 1986)
Type of Vegetation Map
19
RADAM Brasil
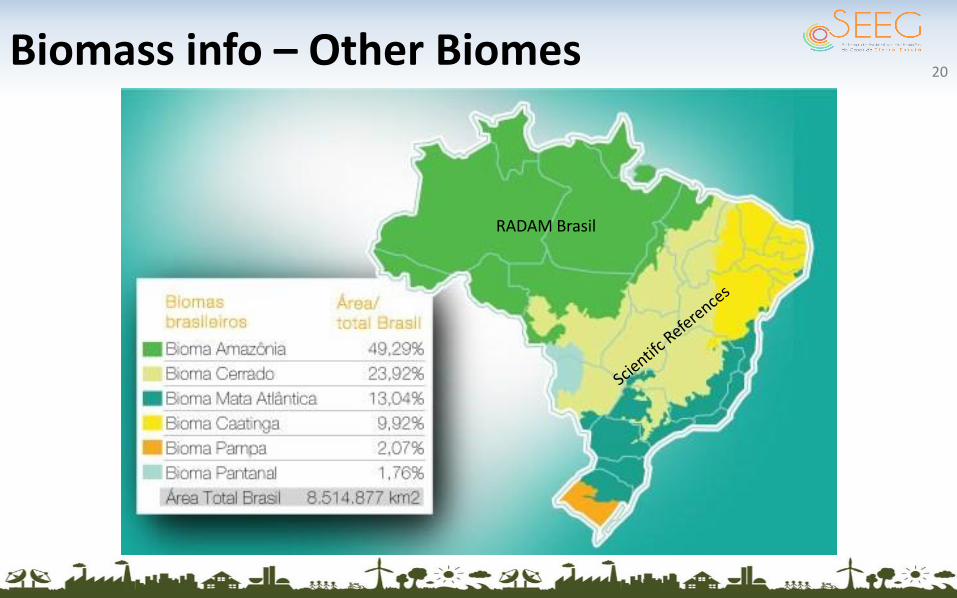
Biomass info – Other Biomes
RADAM Brasil
20

Transições A Ac Ap CS FM FNM FSec GM GNM GSec NO O Ref Res S
A 0 A*(S-O) 0
Ac0.0 A*(AvAgr-Pec) A*(AvAgr-Rebf*(T/2)) A*(AvAgr-RebG*(T/2)) A*(avAgr-O) A*(AvAgr-(IncrRef*(T/2))) A*(avAgr-Res) A*(avAgr-S)
Ap
A*(Pec-avAgr)
0.0 A*(pec-Rebf*(T/2)) A*(Pec-RebG*(T/2)) A*(Pec-O) A*(Pec-IncrRef(T/2)) A*(Pec-Res) A*(Pec-S)
CS A*(C-S)
FMA*(C-Pec)
A*(C-(C*pCS))
A*Remf*T A*(C-(Rebf*(T/2))) A*(C-O) A*(C-(IncrRef*(T/2))) A*(C-Res) A*(C-S)
FNM
A*(C-avAgr)
A*(C-Pec)A*(C-
(C*pCS))A*Remf*(T/2)
0.0 A*(C-(Rebf*(T/2))) A*(C-O) A*(C-(IncrRef*(T/2))) A*(C-Res) A*(C-S)
FSec
A*(C*avFsec-avAgr)
A*(C*avFsec-Pec) A*Refb*T A*(C-avFsec-O) A*(C*avFsec-(IncrRef*(T/2))) A*(C*avFsec-Res) A*(C*avFsec-S)
GM
A*(C-avAgr)
A*(C-Pec) 0.0 A*(C-RebG*(T/2)) A*(C-O) A*(C-IncrRef*(T/2)) A*(C-Res) A*(C-S)
GNM
A*(C-avAgr)
A*(C-Pec) 0 0 A*(C-RebG*(T/2)) A*(C-O) A*(C-IncrRef*(T/2)) A*(C-Res)
GSec
A*(C*avGsec-avAgr)
A*(C*avGsec-Pec) A*RebG*T A*(C-avGsec-O) A*(C*avGsec-incrRef*(T/2)) A*(C-avGsec-Res) A*(C*avGsec-S)
NO
O
A*(O-avAgr)
A*(O-Pec) A*(O-Rebf*(T/2)) A*(O-RebG*(T/2)) 0.0 A*(O-IncrRef*(T/2)) A*(O-Res) A*(O-S)
Ref
A*(avRef-avAgr)
A*(avRef-Pec) A*(AvRef-(Rebf*(T/2))) A*(AvRef-RebG*(T/2)) A*(avRef-O) 0.0 A*(avRef-Res) A*(avRef-S)
Equations for each transition
All equations are based on IPCC guidelines
21
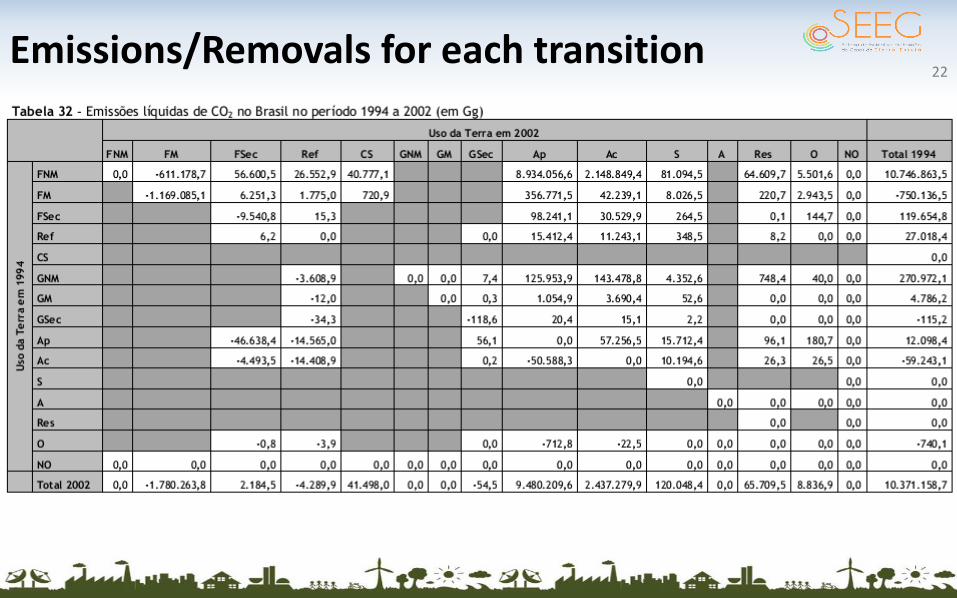
Emissions/Removals for each transition22
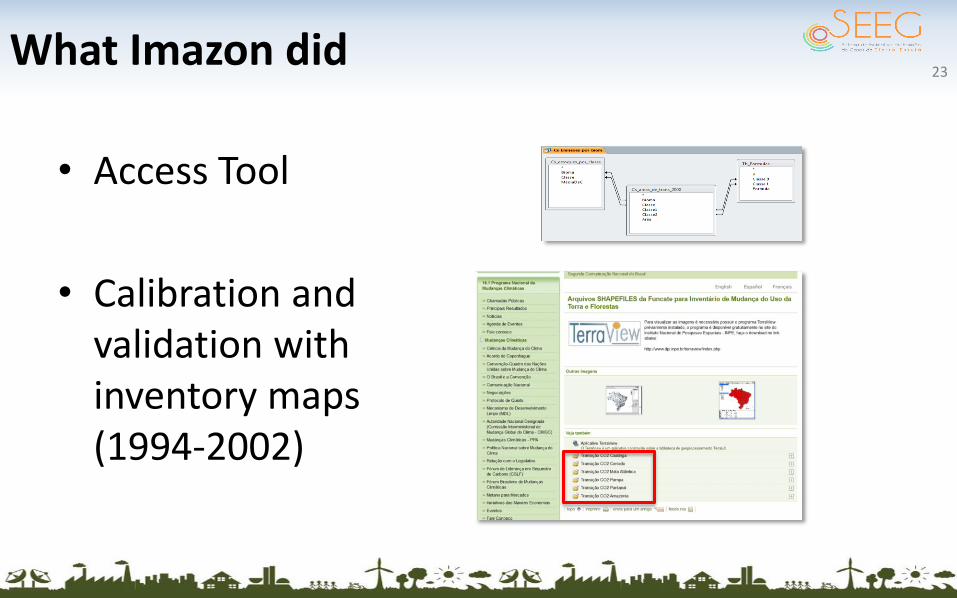
What Imazon did
• Access Tool
• Calibration andvalidation withinventory maps(1994-2002)
23
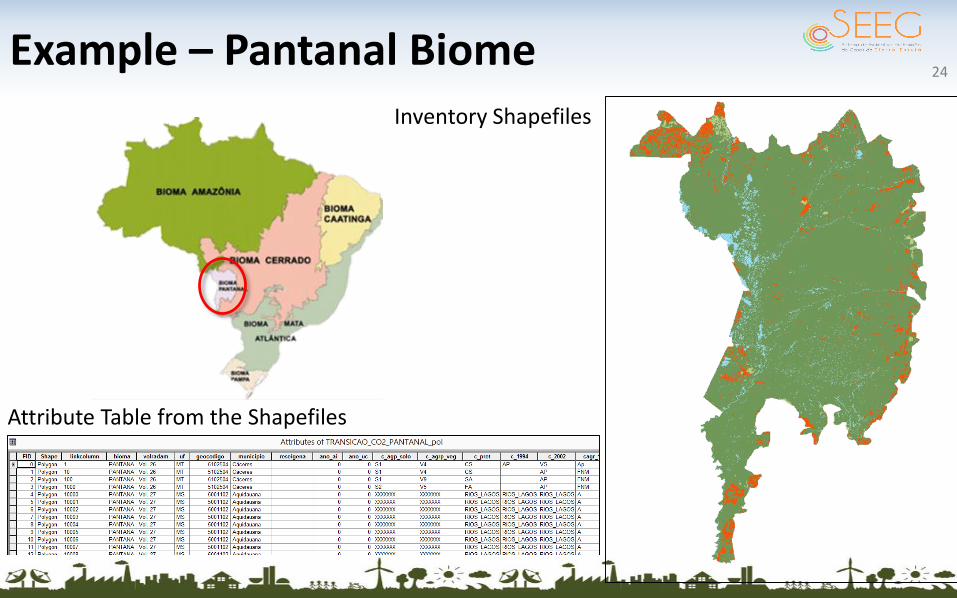
Example – Pantanal Biome24
Inventory Shapefiles
Attribute Table from the Shapefiles

Example – Pantanal Biome25
BrazilianInventory
Imazon Tool
#<1%
Method 2 – Deforestation approach (proxy)
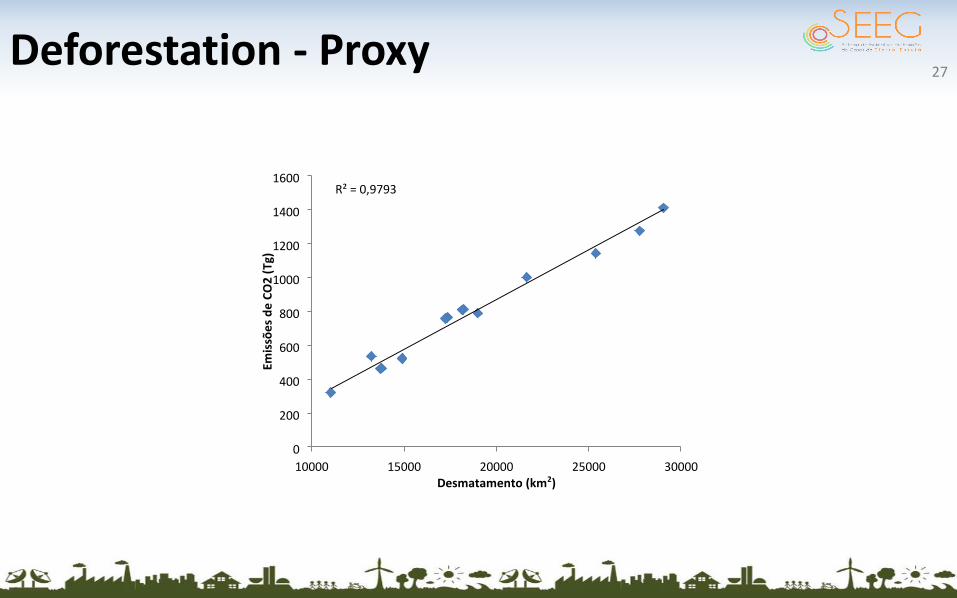
Deforestation - Proxy27
R² = 0,9793
0
200
400
600
800
1000
1200
1400
1600
10000 15000 20000 25000 30000 Desmatamento (km 2 )
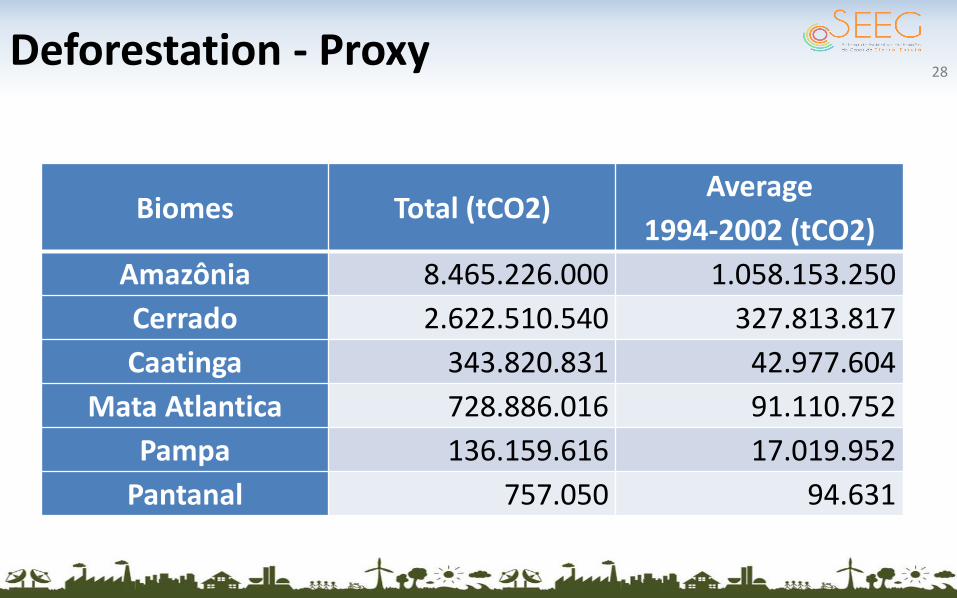
Deforestation - Proxy28
Biomes Total (tCO2)Average
1994-2002 (tCO2)
Amazônia 8.465.226.000 1.058.153.250
Cerrado 2.622.510.540 327.813.817
Caatinga 343.820.831 42.977.604
Mata Atlantica 728.886.016 91.110.752
Pampa 136.159.616 17.019.952
Pantanal 757.050 94.631
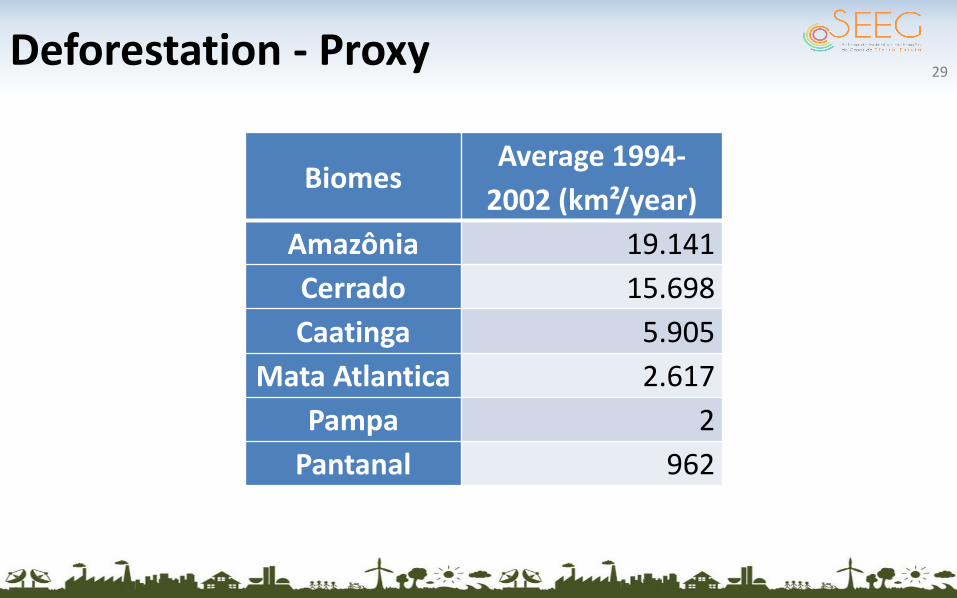
Deforestation - Proxy29
BiomesAverage 1994-
2002 (km²/year)
Amazônia 19.141
Cerrado 15.698
Caatinga 5.905
Mata Atlantica 2.617
Pampa 2
Pantanal 962
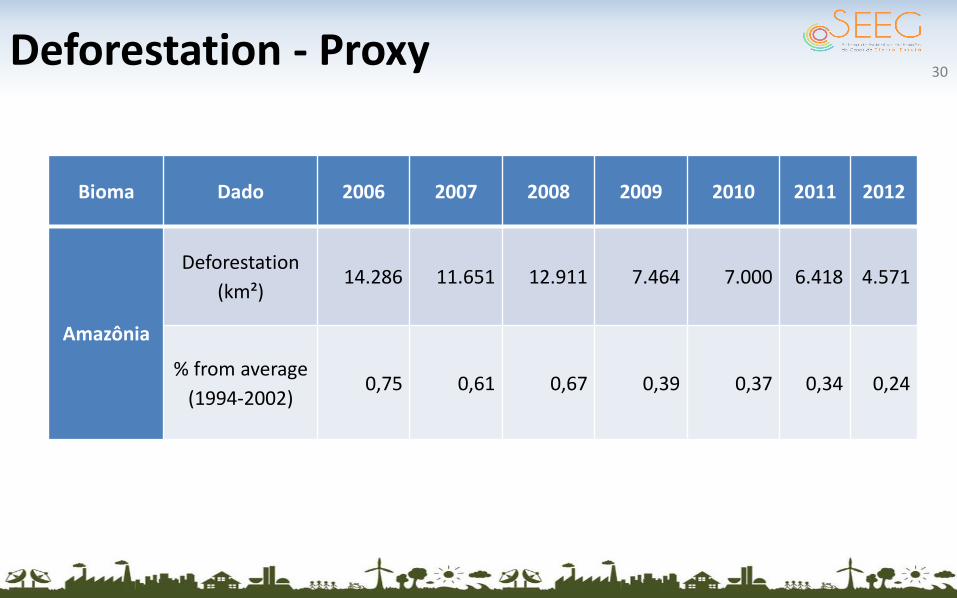
Deforestation - Proxy30
Bioma Dado 2006 2007 2008 2009 2010 2011 2012
Amazônia
Deforestation
(km²)14.286 11.651 12.911 7.464 7.000 6.418 4.571
% from average
(1994-2002)0,75 0,61 0,67 0,39 0,37 0,34 0,24
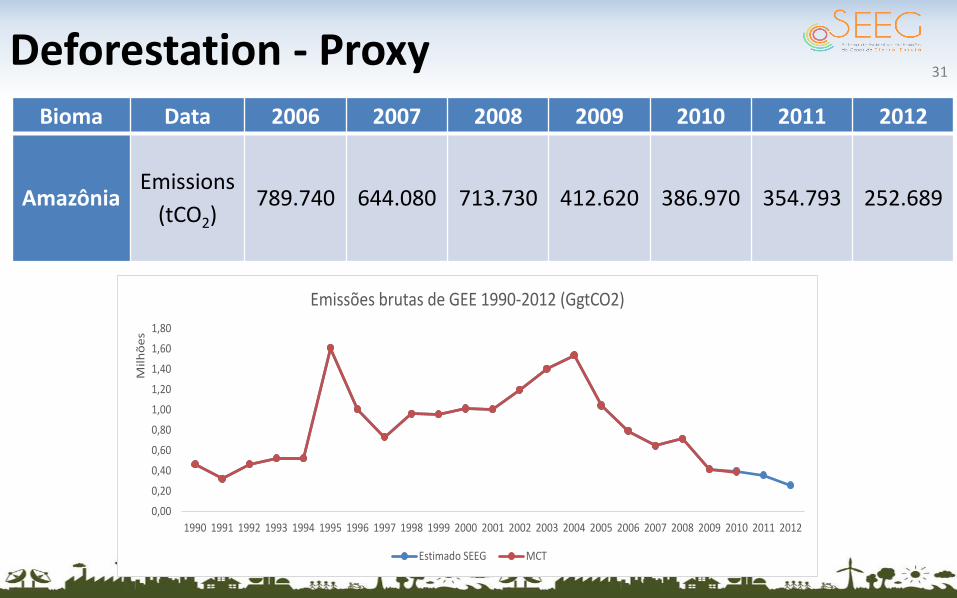
Deforestation - Proxy31
Bioma Data 2006 2007 2008 2009 2010 2011 2012
AmazôniaEmissions
(tCO2)789.740 644.080 713.730 412.620 386.970 354.793 252.689
0,00
0,20
0,40
0,60
0,80
1,00
1,20
1,40
1,60
1,80
1990 1991 1992 1993 1994 1995 1996 1997 1998 1999 2000 2001 2002 2003 2004 2005 2006 2007 2008 2009 2010 2011 2012
Mil
hõ
es
Emissões brutas de GEE 1990-2012 (GgtCO2)
Estimado SEEG MCT

32
Biome 2000 2001 2002 2003 2004 2005 2006 2007 2008 2009 2010 2011 2012 2013 Source
Amazônia PRODES
Caatinga PMDBBS
Cerrado PMDBBS andLapig
Mata Atlântica
PMDBBS / SOS Mata Atlântica
Pampa PMDBBS
Pantanal PMDBBS
TransitionForest - Deforestation
Estimated Annual Deforestation Rate (km²/n years)
Mapped Deforestation Rate (km²/year)
Deforestation Data Available to Estimate the GHG Emissions from 1990-2013
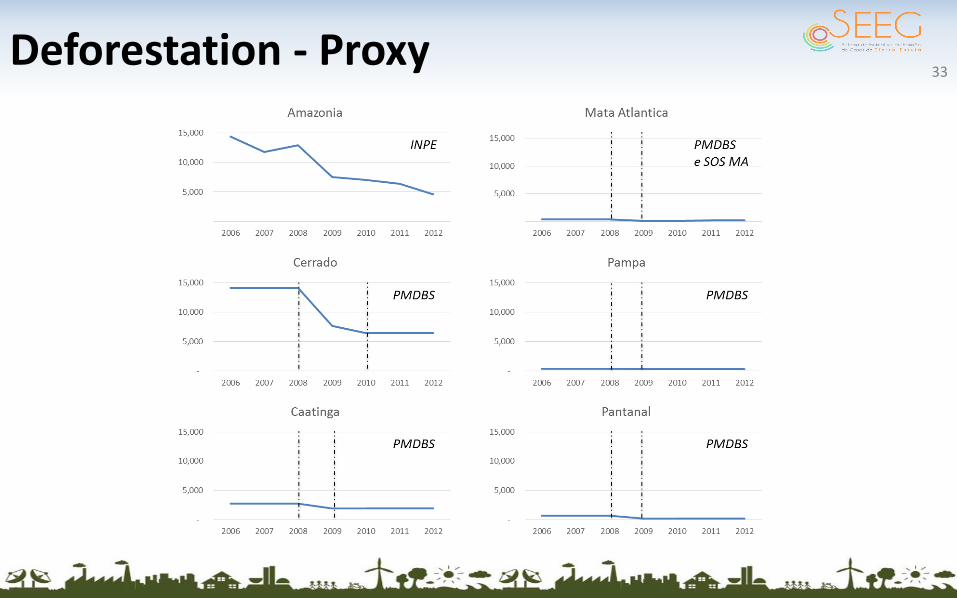
Deforestation - Proxy33

LUC>> RESULTS 34
1.25
2.20
1.16
2.03
1.15
0.54
0.00
0.50
1.00
1.50
2.00
2.50
19
90
19
91
19
92
19
93
19
94
19
95
19
96
19
97
19
98
19
99
20
00
20
01
20
02
20
03
20
04
20
05
20
06
20
07
20
08
20
09
20
10
20
11
20
12
20
13
Bill
ion
s
Emissions of GHG (LUC) : 1990-2013 (tCO2 GWP)
Total 1990-201330.2 Billion tCO2 (GWP)
LUC>> RESULTS 35
0.00
0.50
1.00
1.50
2.00
2.50
19
90
19
91
19
92
19
93
19
94
19
95
19
96
19
97
19
98
19
99
20
00
20
01
20
02
20
03
20
04
20
05
20
06
20
07
20
08
20
09
20
10
20
11
20
12
20
13
Bill
ion
s
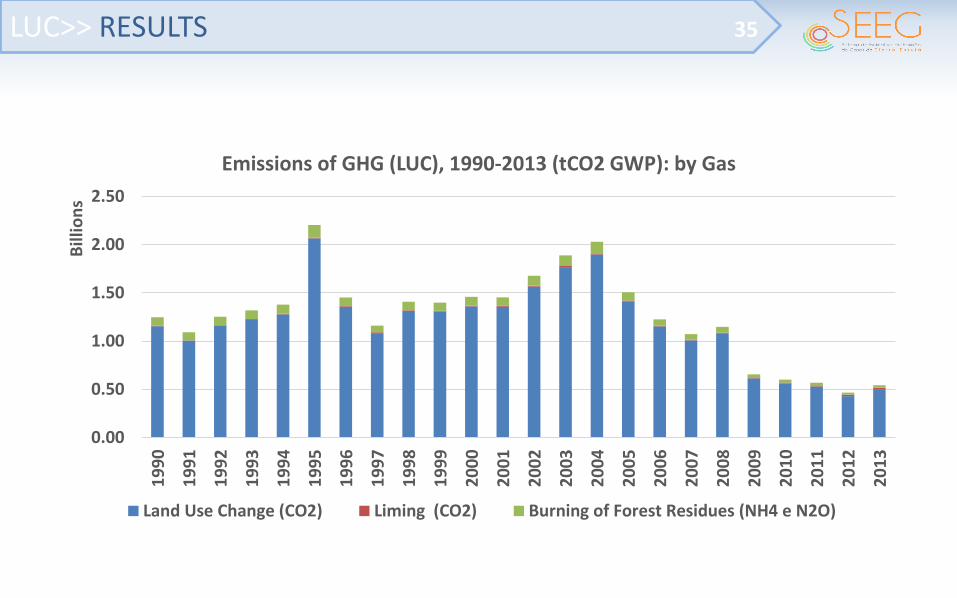
Emissions of GHG (LUC), 1990-2013 (tCO2 GWP): by Gas
Land Use Change (CO2) Liming (CO2) Burning of Forest Residues (NH4 e N2O)
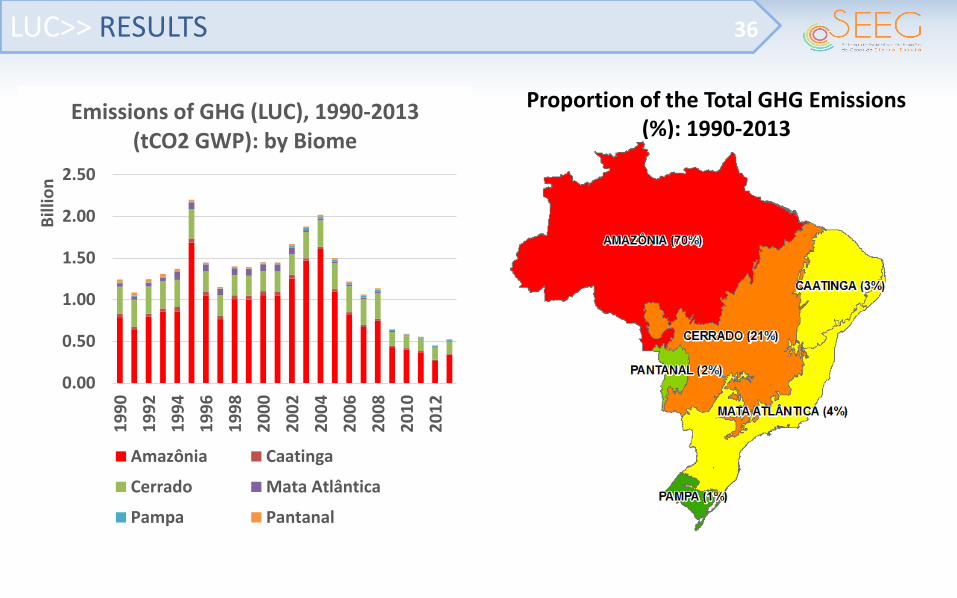
LUC>> RESULTS 36
0.00
0.50
1.00
1.50
2.00
2.50
19
90
19
92
19
94
19
96
19
98
20
00
20
02
20
04
20
06
20
08
20
10
20
12
Bill
ion
Emissions of GHG (LUC), 1990-2013 (tCO2 GWP): by Biome
Amazônia Caatinga
Cerrado Mata Atlântica
Pampa Pantanal
Proportion of the Total GHG Emissions (%): 1990-2013
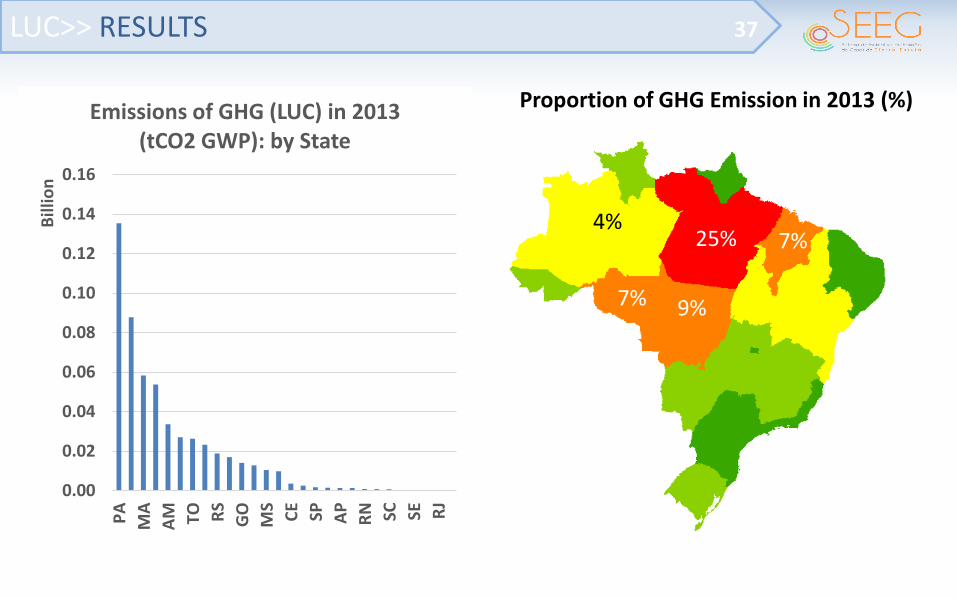
LUC>> RESULTS 37
0.00
0.02
0.04
0.06
0.08
0.10
0.12
0.14
0.16
PA
MA
AM TO RS
GO
MS
CE
SP AP
RN SC SE RJ
Bill
ion
Emissions of GHG (LUC) in 2013 (tCO2 GWP): by State
Proportion of GHG Emission in 2013 (%)
25%
9%
7%
7%
4%

LUC>> RESULTS 38
Variation 2012-2013
0.00
0.02
0.04
0.06
0.08
0.10
0.12
0.14
0.16
PA
MA
AM TO RS
GO
MS
CE
SP AP
RN SC SE RJ
Bill
ion
GHG Emission: variation 2012-2013 (tCO2 GWP) – by State
Emissões 2012 Emissões 2013
Total Variation+16,4%
Lessons learned
• IPCC method of Emissions/Removals
• Brazilian Minister of Technology approach of Estimations of Emissions/Removals
• Documentation – Important in all phases
• Network of institutions
39
Challenges
• Data quality and availability
• Methodologic improvements are necessary (ieRemoval Equations)
40

Land Use Sector: Methods
Thank You ! / Obrigado !
Amintas Brandão Jr.Adjunct [email protected]
Technical Workshop for GHG Emissions Estimation:
Exploring the SEEG Framework for India
Workshop Support:
April 2015, New Delhi