Embed Size (px)
Citation preview
I. Report No. 2. Government Accession No.
FHW A/TX-98/1327-2
4. Title and Subtitle
LAND VALUE AND LAND USE EFFECTS OF ELEVATED, DEPRESSED, AND AT-GRADE LEVEL FREEWAYS IN TEXAS
7. Author(s)
Carol A. Lewis, Jesse L. Buffington, Sharada R. Vadali, and Ronald E. Goodwin 9. Perfonning Organization Name and Address
Texas Transportation Institute The Texas A&M University System College Station, Texas 77843-3135
12. Sponsoring Agency Name and Address
Texas Department of Transportation Research and Technology Transfer Office P. 0. Box 5080 Austin, Texas 78763-5080
IS. Supplementary Notes
Technical Reoort Documentation Pa2e
I ~I. Fteci1)ien1t's c:atal"log_ No.
~ 6. Perfonning Organization Code
8. Performing Organization Report No.
Research Report 1327-2
10. Work Unit No. (TRAIS)
11. Contract or Grant No.
Study No. 0-1327
13. Type of Report and Period Covered
Interim: September 1992-August 1996 14. Sponsoring Agency Code
Research performed in cooperation with the Texas Department of Transportation and the U.S. Department of Transportation, Federal Highway Administration. Research Study Title: Social, Economic, and Environmental Effects of Elevated and Depressed Freeways
16. Abstract
To answer questions being raised by abutting residents and businesses about proposed elevated and/or depressed freeway improvements in the urban and suburban areas of Texas, a four-year study has been conducted to estimate the social, economic, and environmental effects of such freeway designs. Eight existing, two under-construction, and one approved-for-construction freeway sections have been studied on a before-, during-, and after-construction basis. The sections selected for study range from being predominantly residential suburban areas to predominantly commercialindustrial downtown areas. The specific effects of the study estimated for each study section include: (1) social impacts: population changes, neighborhood, accessibility, and neighborhood cohesion; (2) economic impacts: relocation and mitigation costs, business sales, property uses and values, tax revenues, employment and income, and user costs; and (3) environmental impacts: aesthetics, drainage and erosion, noise and air pollution, vibration, and hazardous spills. The literature review and a survey of highway agencies in other states were used to determine the appropriate procedures or models and mitigation measures to implement in estimating the social, economic, and environmental impacts of elevated and depressed freeways.
The results of the study, presented in six separate reports according to types of effect, can be used by highway planning and designing engineers to prepare environmental statements and documents of the expected social, economic, and environmental impacts of proposed elevated and depressed freeway projects. Also, the results can be disseminated at the public hearings for a proposed project. This report presents the findings of the land value and use effects of elevated, depressed, and at-grade level freeways. The findings from prior studies indicate that freeway grade level differences in abutting land values are significant for certain land uses. However, these differences are negative or positive, depending upon the type of abutting land use. The results of this study confirm those findings. 17. Key Words
Traffic, Grade Level, Elevated, Depressed, At-Grade Combination or Double, Impacts, Effects, Distance, Freeway Study Sections, Mitigation, Walls and Barriers, Aesthetics, Land Values, Land Uses, Zoning Ordinances, City, Urban, Suburban
18. Distribution Statement
No restrictions. This document is available to the public through NTIS: National Technical Information Service 5285 Port Royal Road Springfield, Virginia 22161
19. Security Classif. (of this report)
Unclassified 20. Security Classif.(of this page)
Unclassified 21. No. of Pages 22. Price
150 Fom1 DOT F 1700. 7 (8-72) Reproduction of completed page authorized

LAND VALUE AND LAND USE EFFECTS OF ELEVATED, DEPRESSED, AND AT-GRADE LEVEL FREEWAYS IN TEXAS
by
Carol A. Lewis Director of Transportation Research
Texas Southern University
Jesse L. Buffington Research Economist
Texas Transportation Institute
Sharada R Vadali Assistant Research Economist Texas Transportation Institute
and
Ronald E. Goodwin Research Associate
Texas Southern University
Research Report 1327-2 Research Study Number 0-1327
Research Study Title: Social, Economic, and Environmental Effects of Elevated and Depressed Freeways
Sponsored by the Texas Department of Transportation
In Cooperation with U.S. Department of Transportation
Federal Highway Administration
July 1997
TEXAS TRANSPORTATION INSTITUTE The Texas A&M University System College Station, Texas 77843-3135
CENTER FOR TRANSPORTATION TRAINING AND RESEARCH Texas Southern University
Houston, Texas 77004

IMPLEMENTATION STATEMENT
The findings of this study can be used by TxDOT to improve its procedures for estimating
and evaluating land value and use effects from proposed elevated, depressed and at-grade
freeways. The findings indicate that the grade level differences in abutting land values and uses
are significant in certain circumstances. All things being equal, the specific grade level designs of
each freeway study section do affect land values enough for transportation planners and design
engineers to carefully consider which freeway grade level is most feasible for the dominant
abutting land use being encountered. The findings of this study will be useful in planning and
conducting public hearings. Also, the findings can be incorporated into environmental impact
statements.
v

DISCLAIMER
The contents of this report reflect the views of the authors who are responsible for the facts
and accuracy of the data presented. The contents do not necessarily reflect the views or policies of
the Texas Department of Transportation or the Federal Highway Administration. This report does
not constitute a standard, specification, or regulation. It is not intended for construction, bidding,
or permit purposes.
vu
ACKNOWLEDGMENT
The authors want to thank Mr. Jon Underwood, Director, Research and Technology
Transfer Office, and staff members Lana Ashley and Klaus Alk.ier for assistance in handling
TxDOT administrative matters pertaining to the study. Special thanks are given to the TxDOT
technical panel members, Joe B. Thompson, Project Director, Melissa Neeley, Peggy D. Thurin,
and John P. Kelly, Original Project Director, for providing oversight and direction to the study.
The research team is especially appreciative of the many TxDOT district personnel for their help
in the selection of study sections and responding to various data requests during the life of this
study. These personnel are named by their respective districts or organizations as follows:
Dallas District:
Richard H. Rawles, Jr., Former Director of Construction; Gary W. Taylor, Project
Manager of North Central Project Office; and Terry L. May, District Right-of-way
Engineer, and the Dallas Area Appraisal District.
Houston District:
Hans C. Olavson, Director of District Transportation Planning; Dennis W. Warren,
Director of Construction; and Thomas N. Lou, Assistant to Director of Transportation and
Planning, and the Houston/Harris County Appraisal District.
Harris County Toll Road Authority:
Wesley E. Freise, Executive Director.
Lubbock District:
Carl R. Utley, District Engineer; V.G. Chetty, Former Deputy District Engineer; John E.
Rantz, Director of Operations and Construction; Steven P. Warren, Director of
Transportation Planning and Development; Ted Copeland, Traffic Engineer; Mike Craig,
Assistant District Design Engineer; Davis Melton, Environmental Coordinator; and Claude
C. Kneisley, Right-of-way Supervisor, and the Lubbock Appraisal District.
Vlll
San Antonio District:
John P. Kelly, District Engineer; Julie Brown, Director of Transportation Planning and
Development; Mary T. Richards, Environmental Coordinator; Gilbert G. Gavia, District Design
Engineer; Felix A. Lemra, District Design Section; and Herbie L. Belvin, District Right-of-way
Administrator. Additional thanks to the San Antonio Appraisal District.
The authors also wish to acknowledge the Federal Highway Administration for providing
funding and technical support for the study.
Other members of the Texas Transportation Institute gave valuable assistance to the study.
Dr. W.F. McFarland, Research Economist and Head of the Transportation Economics Program,
gave administrative support. Thanks are due Mr. Alan G. Nelson, Student Worker, for his hard
work in data entry and reduction and Mrs. Cheryl Kruse, Secretary for the Transportation
Economics Program, who took care of much of the paperwork for the study and also assisted with
the data entry. Thanks are due Diana G. Wallace, Assistant Research Specialist; Stephen E. Ranft,
Research Associate; Darrell W. Borchardt, Associate Research Engineer; and Paul A. Hawkins,
Assistant Research Scientist, for their help in collecting all of the traffic data needed for this study.
Thanks are due the Center for Transportation Training and Research staff - particularly,
Naomi W. Lede and Lei Yu for professional consultation; Khosro Godazi for technical assistance;
Zhe Shen, Barney McCoy, and Terrance Mims for data collection and entry; Raquelle R. Wooten
for computer mapping production; and DeLinda Marzette for editorial support.
Lastly, thanks are due Ms. Linda Pedro and Mr. Mack Lindsey of the Research Division of
the Texas State Comptroller's Office for their help in furnishing business gross sales and state
sales tax data needed for this study.
IX

TABLE OF CONTENTS
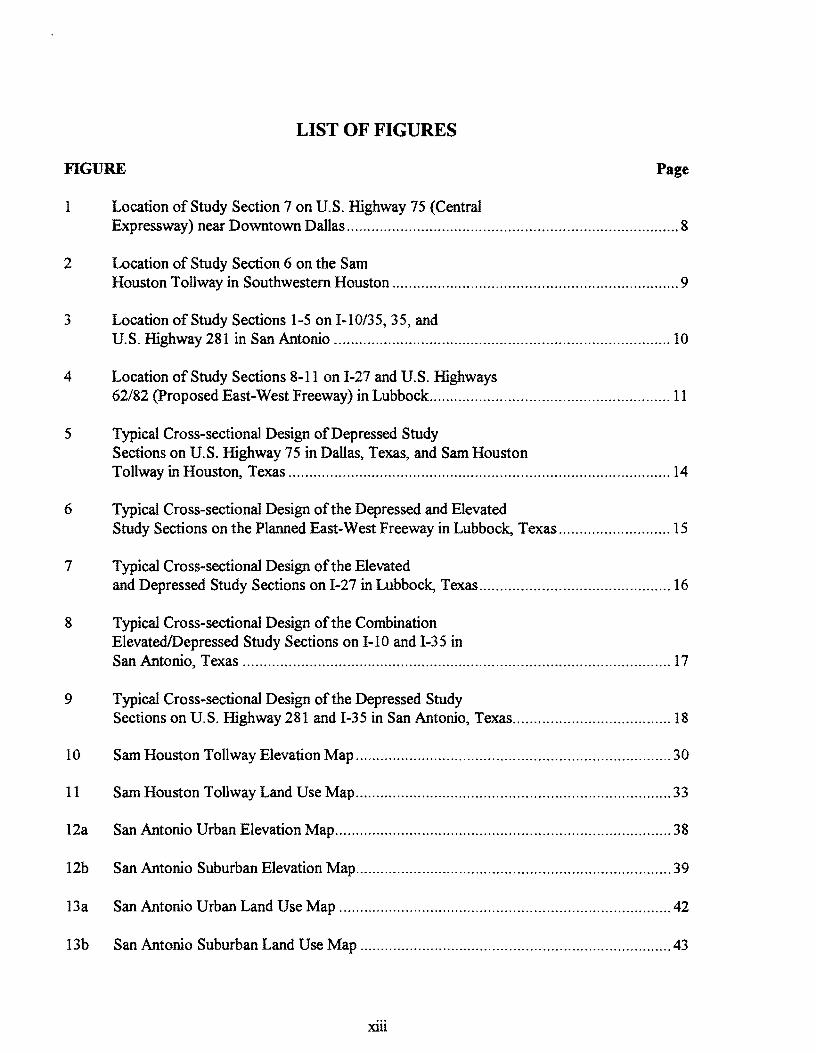
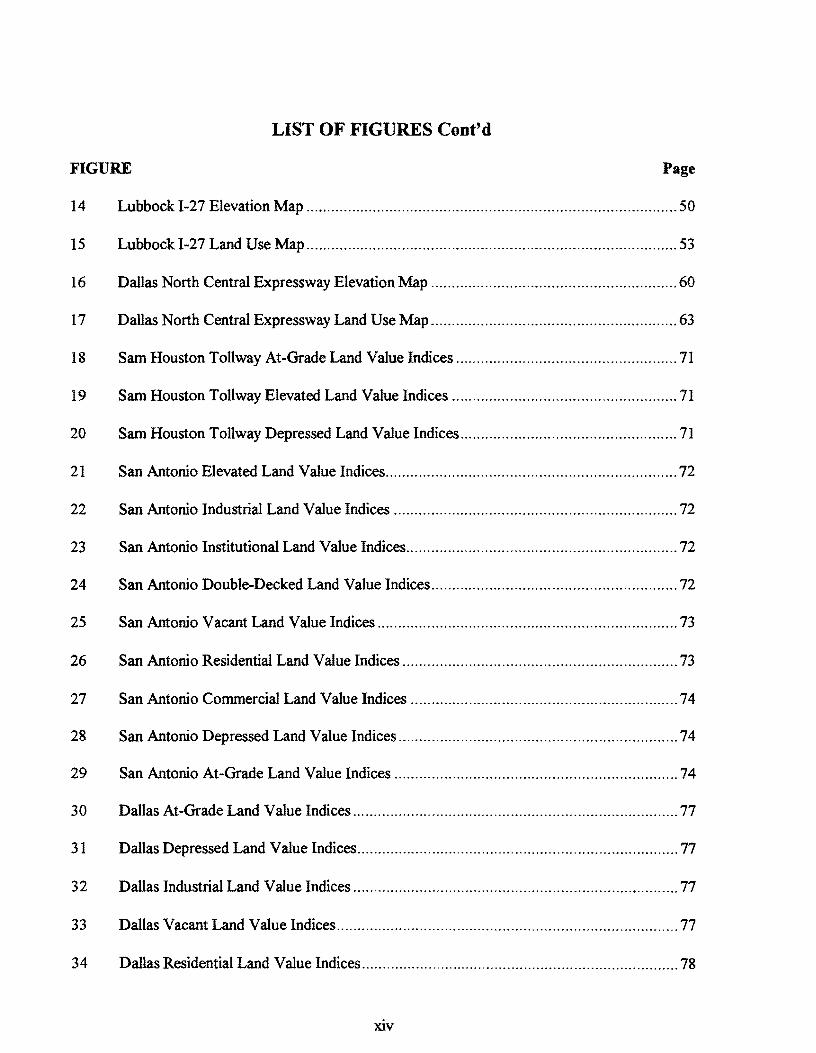
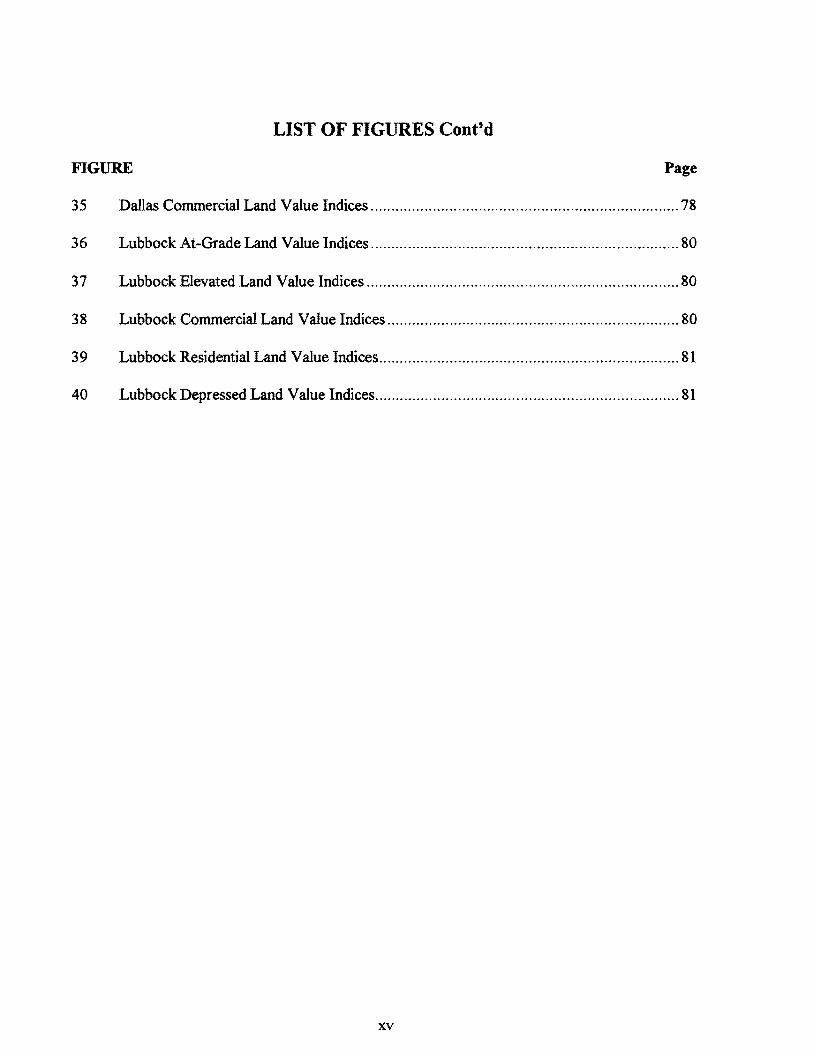
List of Figures .......................................................................................................................... xiii
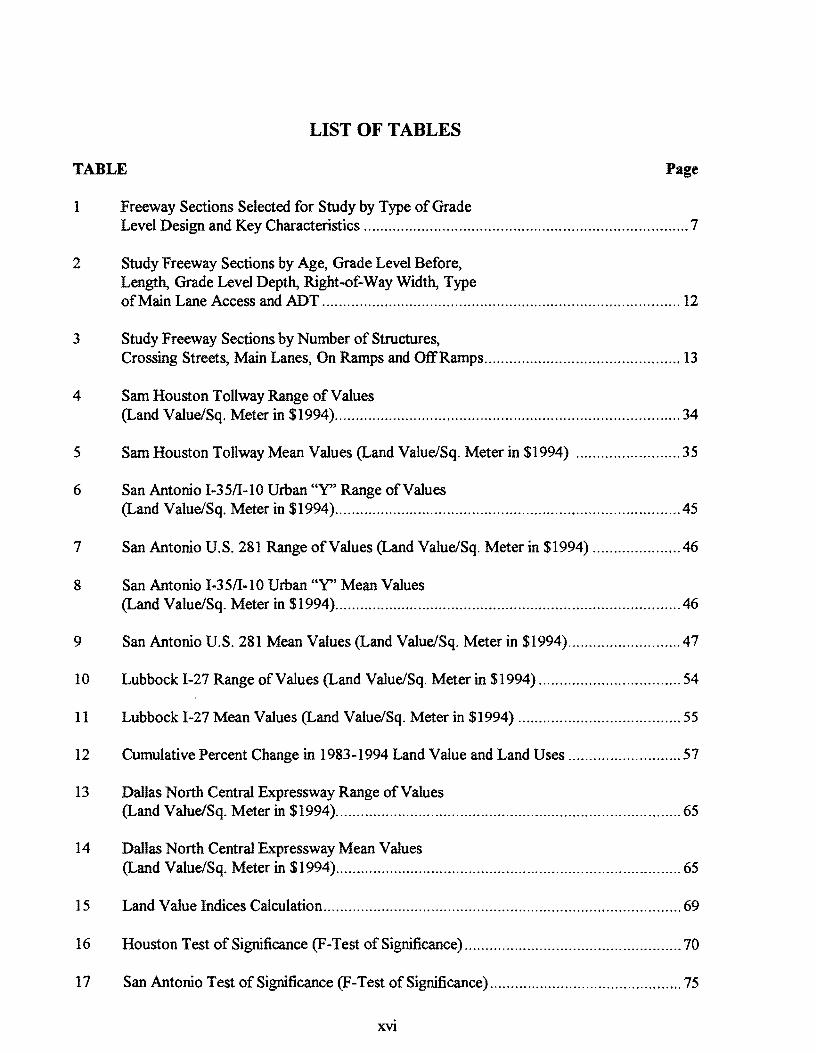
List of Tables ........................................................................................................................... xvi
Summary .................................................................................................................................. xix
Introduction ................................................................................................................................ 1
Study Problem Statement. ................................................................................................ 1
Study Objectives .............................................................................................................. 2
Selection of Freeway Study Sections ................................................................................ 3
Location and Characteristics of Study Freeway Sections .................................................. 3
Typical Cross-sectional Design of Study Freeway Sections ............................................. .4
General Methodology and Data Sources .......................................................................... 4
Reports of Findings .......................................................................................................... 5
Background and Literature Review ........................................................................................... 19
National Overview ......................................................................................................... 19
Texas Focus .................................................................................................................. 22
Multimodal Influences ................................................................................................... 23
Synopsis of Studies ........................................................................................................ 23
Research Thrust and Thesis ........................................................................................... 24
Methodology ................................................................................................................. 25
Study Limitations ........................................................................................................... 26
Major Findings .......................................................................................................................... 27
Houston ......................................................................................................................... 27
San Antonio ................................................................................................................... 36
X1
Lubbock ........................................................................................................................ 48
Dallas ............................................................................................................................ 58
Land Value Index Model ............................................................................................... 66
Summary of Mean Analysis and the Land Value Index Model.. .................................................. 85
Summary of Findings ................................................................................................................. 95
Recommendations ..................................................................................................................... 99
Bibliography ............................................................................................................................ 103
Appendix I: Survey of Statewide TxDOT District Engineers
for Freeway Sections for Inclusion in the Study ............................................................ 107
Appendix 2: Land Value Index Calculation .............................................................................. 113
Appendix 3: Record of Accounts Collected by City ................................................................. 121
Appendix 4: Implementation Methodology .............................................................................. 127
Xll
LIST OF FIGURES
FIGURE Page
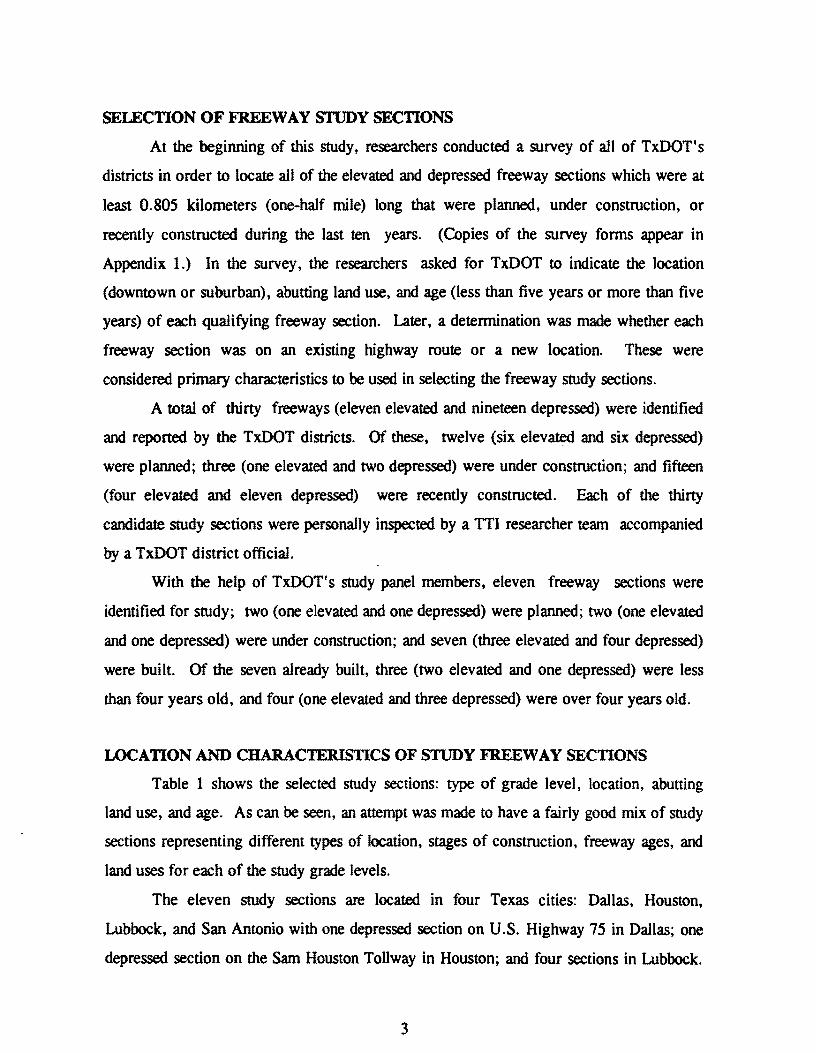
1 Location of Study Section 7 on U.S. Highway 75 (Central Expressway) near Downtown Dallas ................................................................................ 8
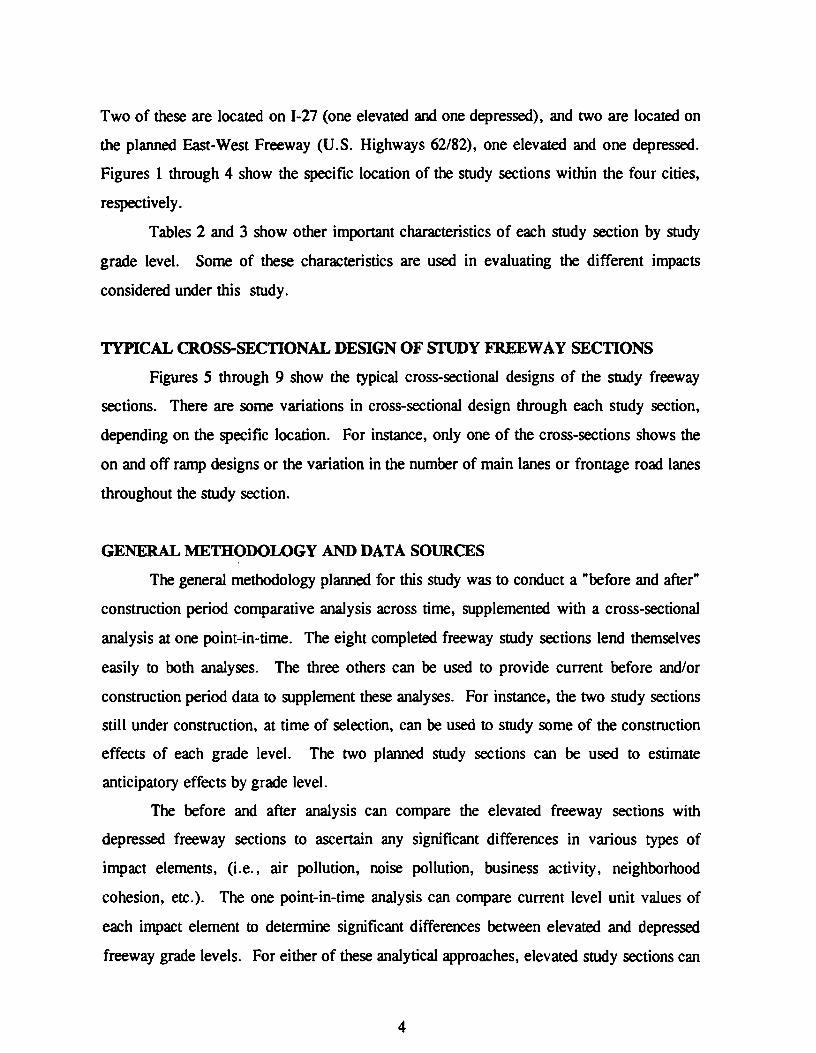
2 Location of Study Section 6 on the Sam Houston Tollway in Southwestern Houston ..................................................................... 9
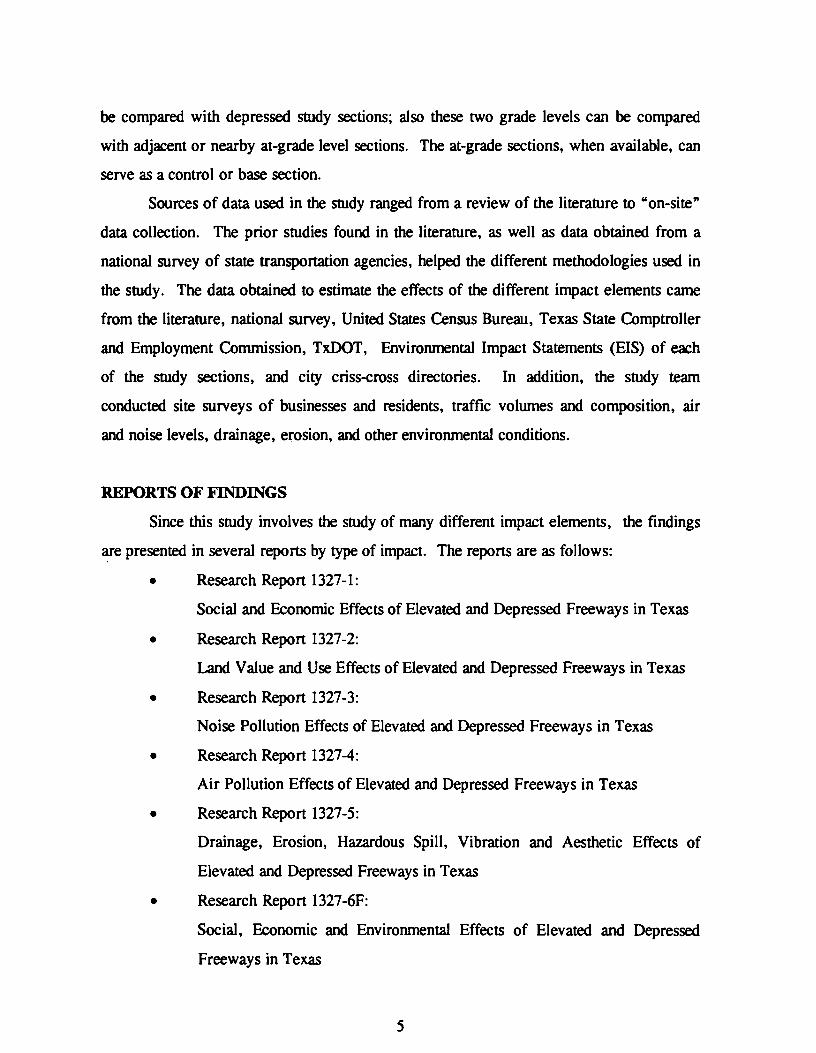
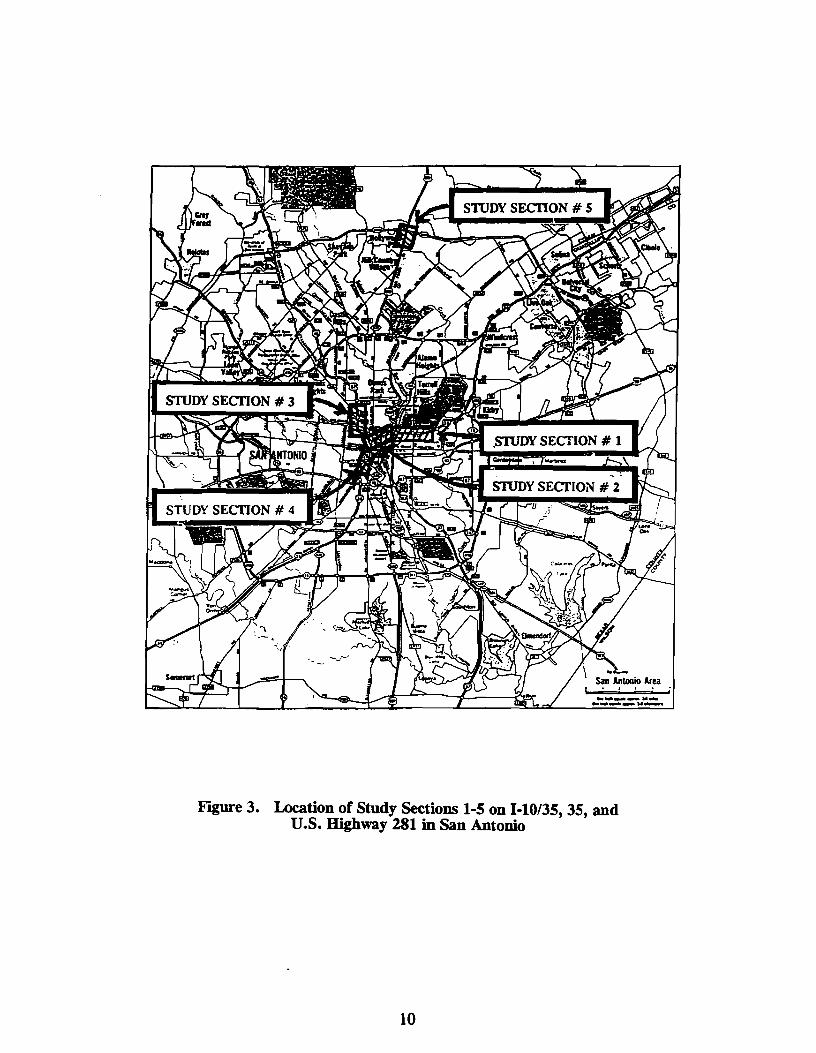
3 Location of Study Sections 1-5 on I-10/35, 35, and U.S. Highway 281 in San Antonio ................................................................................. 10
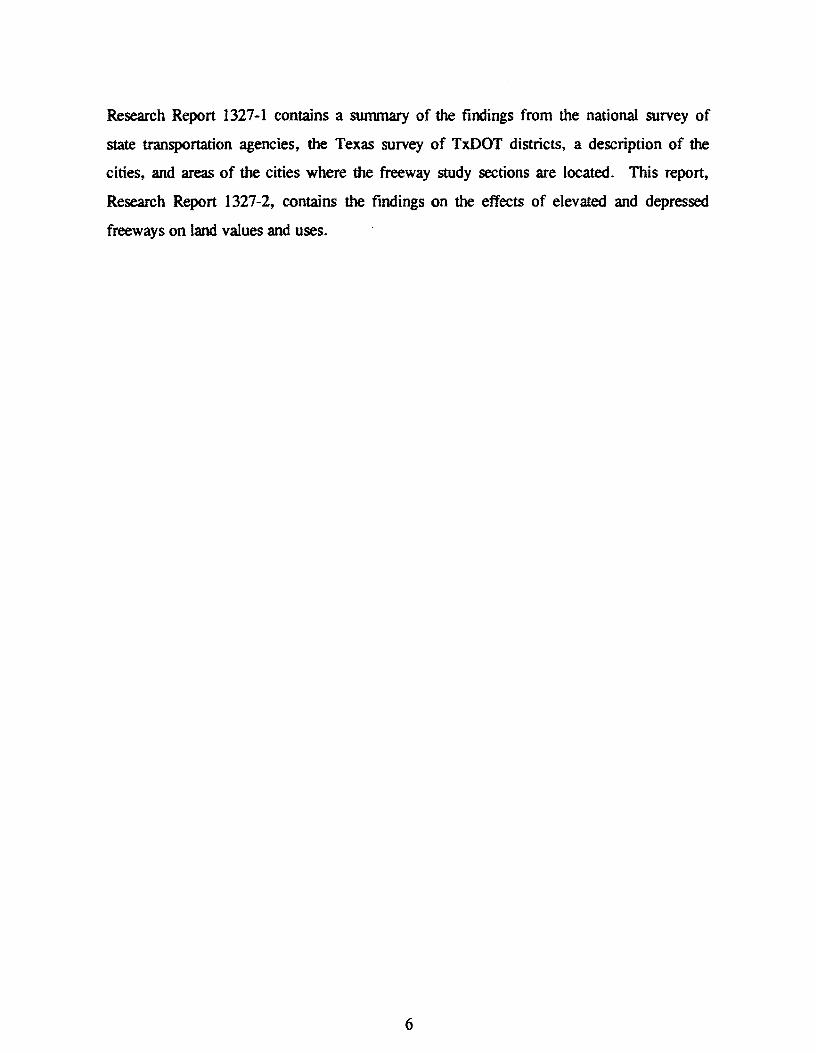
4 Location of Study Sections 8-11 on I-27 and U.S. Highways 62/82 (Proposed East-West Freeway) in Lubbock. ......................................................... 11
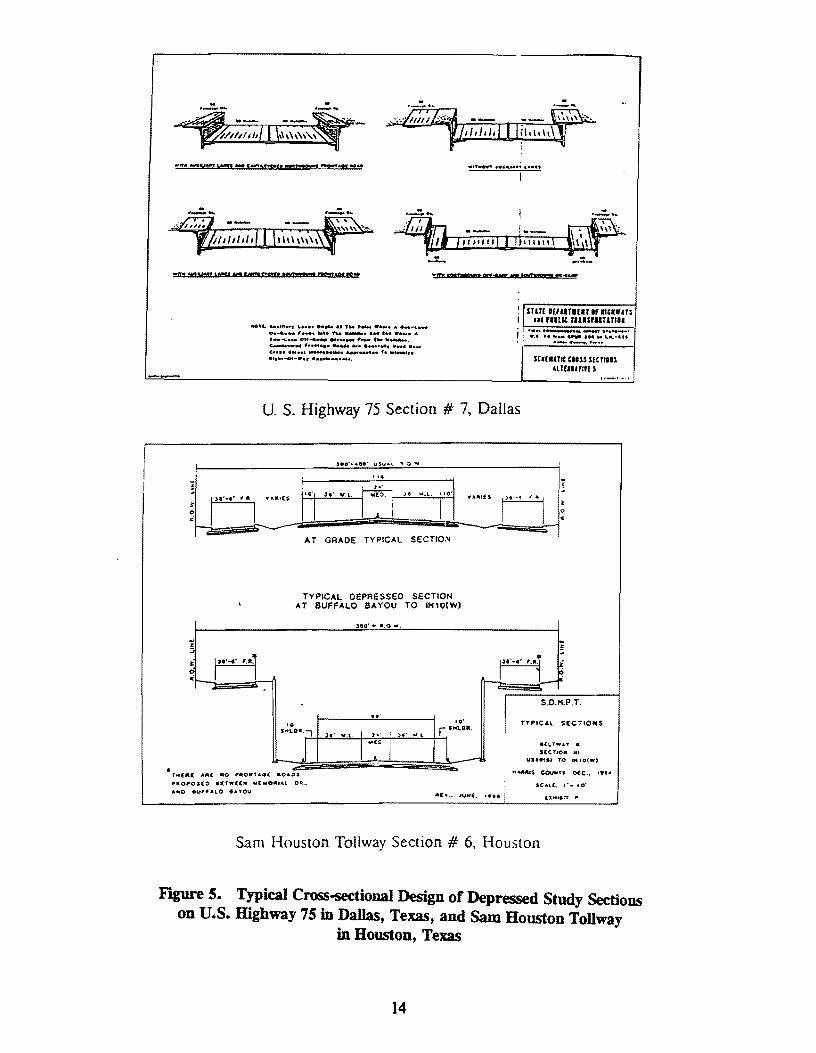
5 Typical Cross-sectional Design of Depressed Study Sections on U.S. Highway 75 in Dallas, Texas, and Sam Houston Tollway in Houston, Texas ............................................................................................ 14
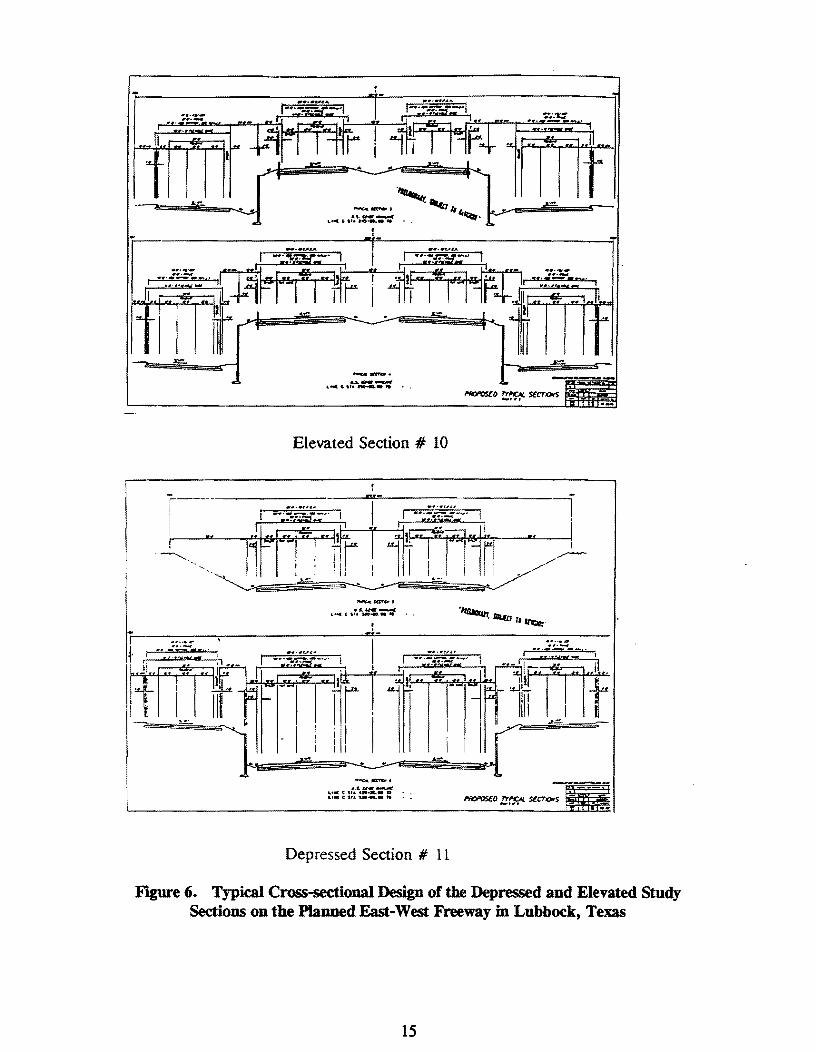
6 Typical Cross-sectional Design of the Depressed and Elevated Study Sections on the Planned East-West Freeway in Lubbock, Texas ........................... 15
7 Typical Cross-sectional Design of the Elevated and Depressed Study Sections on I-27 in Lubbock, Texas .............................................. 16
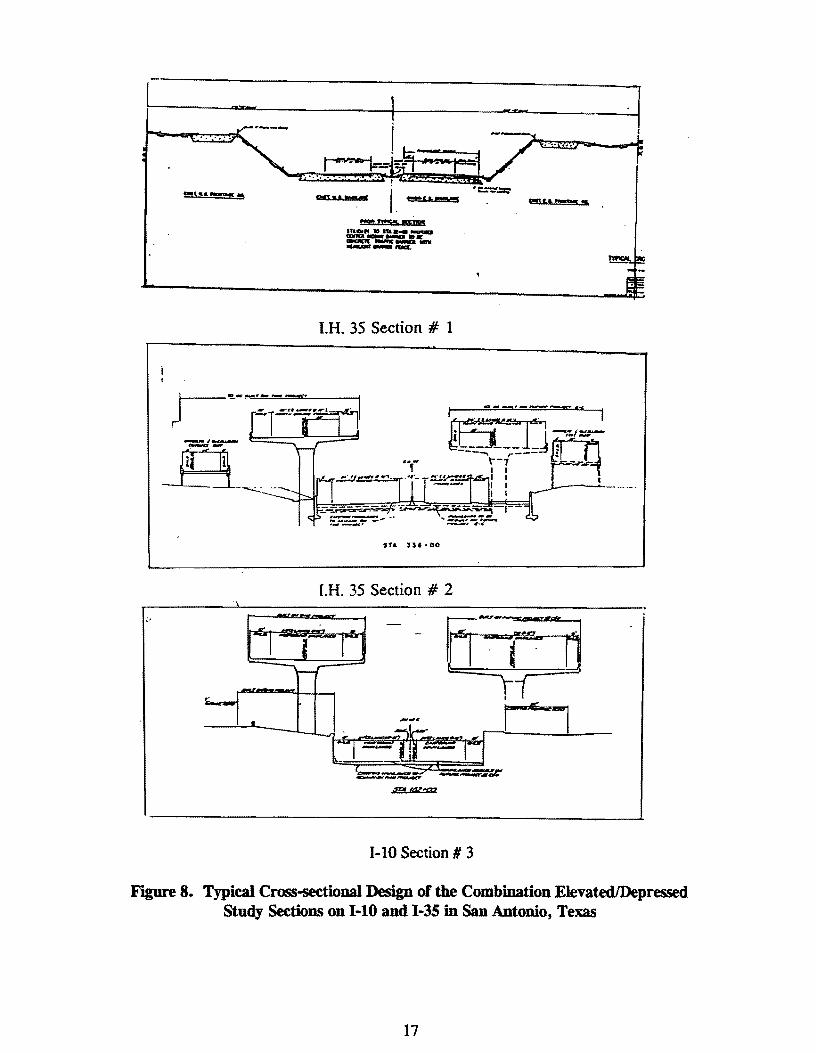
8 Typical Cross-sectional Design of the Combination Elevated/Depressed Study Sections on I-10 and I-35 in San Antonio, Texas ....................................................................................................... 17
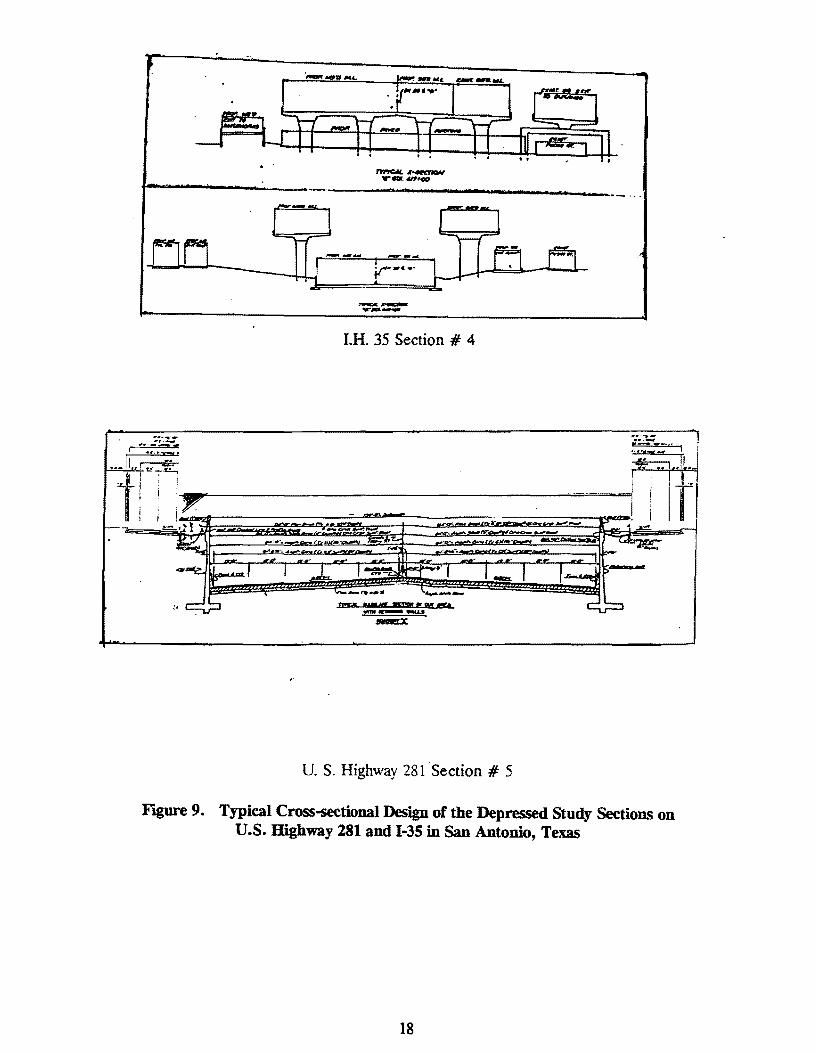
9 Typical Cross-sectional Design of the Depressed Study Sections on U.S. Highway 281and1-35 in San Antonio, Texas ...................................... 18
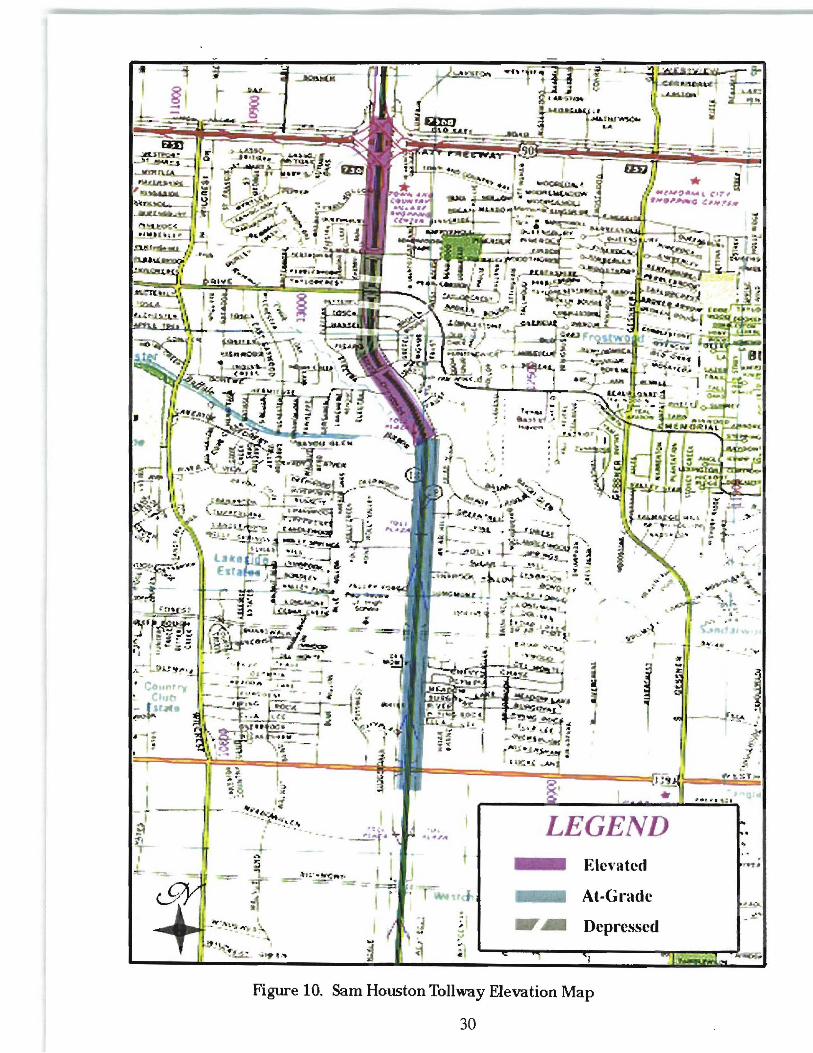
10 Sam Houston Tollway Elevation Map ............................................................................ 30
11 Sam Houston Tollway Land Use Map ............................................................................ 33
12a San Antonio Urban Elevation Map ................................................................................. 38
12b San Antonio Suburban Elevation Map ............................................................................ 39
13a San Antonio Urban Land Use Map ............................................................................... .42
13b San Antonio Suburban Land Use Map .......................................................................... .43
Xlll
LIST OF FIGURES Cont'd
FIGURE Page
14 Lubbock 1-27 Elevation Map ......................................................................................... 50
15 Lubbock 1-27 Land Use Map ......................................................................................... 53
16 Dallas North Central Expressway Elevation Map ........................................................... 60
17 Dallas North Central Expressway Land Use Map ........................................................... 63
18 Sam Houston Tollway At-Grade Land Value Indices ..................................................... 71
19 Sam Houston Tollway Elevated Land Value Indices ...................................................... 71
20 Sam Houston Tollway Depressed Land Value Indices .................................................... 71
21 San Antonio Elevated Land Value Indices ...................................................................... 72
22 San Antonio Industrial Land Value Indices .................................................................... 72
23 San Antonio Institutional Land Value Indices ................................................................. 72
24 San Antonio Double-Decked Land Value Indices ........................................................... 72
25 San Antonio Vacant Land Value Indices ........................................................................ 73
26 San Antonio Residential Land Value Indices .................................................................. 73
27 San Antonio Commercial Land Value Indices ................................................................ 74
28 San Antonio Depressed Land Value Indices ................................................................... 74
29 San Antonio At-Grade Land Value Indices .................................................................... 74
30 Dallas At-Grade Land Value Indices .............................................................................. 77
31 Dallas Depressed Land Value Indices ............................................................................. 77
32 Dallas Industrial Land Value Indices .............................................................................. 77
33 Dallas Vacant Land Value Indices .................................................................................. 77
34 Dallas Residential Land Value Indices ............................................................................ 78
XIV
LIST OF FIGURES Cont'd
FIGURE Page
35 Dallas Commercial Land Value Indices .......................................................................... 78
36 Lubbock At-Grade Land Value Indices .......................................................................... 80
3 7 Lubbock Elevated Land Value Indices ........................................................................... 80
38 Lubbock Commercial Land Value Indices ...................................................................... 80
39 Lubbock Residential Land Value Indices ........................................................................ 81
40 Lubbock Depressed Land Value Indices ......................................................................... 81
xv
LIST OF TABLES
TABLE Page
1 Freeway Sections Selected for Study by Type of Grade Level Design and Key Characteristics .............................................................................. 7
2 Study Freeway Sections by Age, Grade Level Before, Length, Grade Level Depth, Right-of-Way Width, Type ofMain Lane Access and ADT ...................................................................................... 12
3 Study Freeway Sections by Number of Structures, Crossing Streets, Main Lanes, On Ramps and OffRamps ............................................... 13
4 Sam Houston Tollway Range of Values (Land Value/Sq. Meter in $1994) ................................................................................... 34
5 Sam Houston Tollway Mean Values (Land Value/Sq. Meter in $1994) ......................... 35
6 San Antonio 1-35/I-10 Urban "Y'' Range of Values (Land Value/Sq. Meter in $1994) ................................................................................... 45
7 San Antonio U.S. 281 Range of Values (Land Value/Sq. Meter in $1994) .................... .46
8 San Antonio 1-35/I-10 Urban "Y'' Mean Values (Land Value/Sq. Meter in $1994) .................................................................................. .46
9 San Antonio U.S. 281 Mean Values (Land Value/Sq. Meter in $1994) .......................... .47
10 Lubbock 1-27 Range of Values (Land Value/Sq. Meter in $1994) .................................. 54
11 Lubbock l-27 Mean Values (Land Value/Sq. Meter in $1994) ....................................... 55
12 Cumulative Percent Change in 1983-1994 Land Value and Land Uses ........................... 57
13 Dallas North Central Expressway Range of Values (Land Value/Sq. Meter in $1994) ................................................................................... 65
14 Dallas North Central Expressway Mean Values (Land Value/Sq. Meter in $1994) ................................................................................... 65
15 Land Value Indices Calculation ...................................................................................... 69
16 Houston Test of Significance (F-Test of Significance) .................................................... 70
17 San Antonio Test of Significance (F-Test of Significance) .............................................. 75
xvi
LIST OF TABLES Cont'd
TABLE Page
18 Dallas Test of Significance (F-Test of Significance) ........................................................ 79
19 Lubbock Test of Significance (F-Test of Significance) .................................................... 82
20 Means Analysis Percent Change Before and After by City by Grade ............................... 85
21 Average Percent Change by Freeway Sections Selected for Study .................................. 87
22 1994 Mean Values/Sq. Meter by Grade .......................................................................... 88
23 Before and After Land Value Index Summary Change from Base Year .......................... 89
24 Before and After Land Value Summary Difference Between Elevated and Depressed Sections Compared to At-Grade Base ...................................... 91
25 Combined City Regression Approach: Before Construction and After Construction Land Value Index Summary ..................................................... 92
26 Adjacent Resident Preference for Freeway Type ............................................................ 93
xvu

SUMMARY
The Texas Department of Transportation is continually upgrading the existing highway
system in the state, especially in urban and suburban areas. Such freeway improvements are
made at varying grade levels, i.e., at-grade, elevated, and depressed, depending on terrain,
land use, and other variables. The current trend in design is toward elevated and depressed
sections to gain additional lanes. Even though many sections of the elevated and depressed
freeways have been built over the years, questions are still raised by abutting or nearby
residents and businesses about the possible negative impacts of such freeways. The literature
regarding land value impacts from freeways indicates that freeway grade has a consistent
influence on land value, with properties adjacent to at-grade and depressed sections at higher
values than elevated properties. Previous studies found that land use contnoutes to values,
with conunercial, industrial, and institutional uses favored over residential use. Further, it has
been documented that properties suffer during the freeway construction stage, but values
generally return to pre-construction levels after the fifth year of operation.
A study was conducted of freeway sections in Houston, San Antonio, Lubbock, and
Dallas, Texas, to determine the effect of freeway grade on land value. The findings support
the trends reported in previous literature but also offer additional insight. The "life cycle
effect," that freeway land value is impacted by construction but rebounds thereafter, was
confirmed through this analysis. Also consistent with findings from previous studies,
conunercial, institutional, and industrial uses tend to have higher values compared to other
land uses. Regarding grade leve~ in the aggregate, the findings support that elevated values
are less and show smaller percentage increases over pre-construction rates than properties at
grade or depressed. This study shows, however, that some residential and conunercial parcels
next to elevated freeways show stable to increasing values when compared to sections at other
grades.
XIX

INTRODUCTION
STUDY PROBLEM STATEMENT
The Texas Department of Transportation (TxDOT) is continually upgrading the
existing highway system in the state, especially in urban and suburban areas. This
upgrading involves improving existing highways or freeways on the existing route or on a
new route which parallels the old route (or bypassing the central city). Such freeway
improvements are made at varying grade levels, i.e., at-grade, elevated grade, and
depressed grade, depending on the terrain, land use, and other factors. The choice of
grade level at a particular point may be an attempt to mitigate negative noise and aesthetic
impacts on a residential neighborhood within available financial bounds. The current trend
in design is toward elevated and depressed sections to gain additional lanes. The elevated
sections may be either earthen or bridge in form. Sections of each type of grade level have
been built over the years since the late 1950s. Many are over twenty years old. However,
quite a few sections have been built during the last five to ten years, and some sections are
either under construction or in the planning stages.
Even though many sections of elevated and depressed freeways have been built over
the years in the state, more and more questions are being raised by abutting or nearby
residents and businesses about the possible negative impacts of such freeways. In recent
years, stiff resistance has been given to the proposed elevated section of the Dallas North
Central Expressway and more recently to the proposed elevated or depressed section of
U.S. Highway 287 in Wichita Falls. Also, the elevated sections of U.S. Highway 183 now
under construction in Austin have caused similar concerns.
Any highway improvement, regardless of grade level, not only impacts users but
also impacts abutting and nearby property owners, businesses, and residents in some
manner. Even the whole city or community may be impacted in some way during and after
construction. Elevated and depressed freeway designs raise particular questions concerning
noise and air quality impacts, but vibration in moving vehicles and/or in structures, and
flooding of depressed freeways are additional concerns. The recent flooding of a
depressed section of I-10 in Houston dramatized the latter problem. Soil erosion, at the
1
point of drainage discharge, can also cause a problem. Aesthetic qualities of elevated and
depressed sections are also matters of concern.
Impacts that result from elevated and depressed freeway improvements can be
classified into three major types: (1) social, (2) economic, and (3) environmental. A partial
list of the specific impacts of each of the major types is given below. The social impacts
are: population changes, neighborhood accessibility, neighborhood cohesion, and
community services. The economic impacts are: relocation and mitigation costs, business
sales, land uses and property values, tax revenues, employment and income, and user
costs. The environmental impacts are: aesthetics, drainage and erosion, air quality, noise
and vibration, and hazardous spills.
A preliminary search of the literature reveals very few case studies that have
measured many of the social, economic, and environmental impacts of depressed and
elevated freeways, especially those in Texas. Therefore, the highway decision-makers
have very little relevant impact data to write and support the environmental assessment
statements and to present at public hearings for proposed elevated and depressed sections of
existing or proposed freeways.
STUDY OBJECTIVES
The general objective of the study is to determine the social, economic, and
environmental effects of elevated and depressed freeways in urban and suburban areas.
The more specific objectives of the study are listed below.
1. Determine the appropriate estimating procedures or models and mitigation
measures to be used in this study to estimate the social, economic, and
environmental effects of elevated and depressed freeways.
2. Estimate the social, economic, and environmental effects of several existing,
contracted, and proposed elevated and depressed freeway sections situated in
urban areas of Texas, and recommend a final set of impact estimating
procedures for use by TxDOT.
2
SELECTION OF FREEWAY STUDY SECTIONS
At the beginning of this study, researchers conducted a survey of all of TxDOT' s
districts in order to locate all of the elevated and depressed freeway sections which were at
least 0.805 kilometers (one-half mile) long that were planned, under construction, or
recently constructed during the last ten years. (Copies of the survey fonns appear in
Appendix 1.) In the survey, the researchers asked for TxDOT to indicate the location
(downtown or suburban), abutting land use, and age (less than five years or more than five
years) of each qualifying freeway section. Later, a detennination was made whether each
freeway section was on an existing highway route or a new location. These were
considered primary characteristics to be used in selecting the freeway study sections.
A total of thirty freeways (eleven elevated and nineteen depressed) were identified
and reported by the TxDOT districts. Of these, twelve (six elevated and six depressed)
were planned; three (one elevated and two depressed) were under construction; and fifteen
(four elevated and eleven depressed) were recently constructed. Each of the thirty
candidate study sections were personally inspected by a TTI researcher team accompanied
by a TxDOT district official.
With the help of TxDOT' s study panel members, eleven freeway sections were
identified for study; two (one elevated and one depressed) were planned; two (one elevated
and one depressed) were under construction; and seven (three elevated and four depressed)
were built. Of the seven already built, three (two elevated and one depressed) were less
than four years old, and four (one elevated and three depressed) were over four years old.
LOCATION AND CHARACTERISTICS OF STUDY FREEWAY SECTIONS
Table 1 shows the selected study sections: type of grade level, location, abutting
land use, and age. As can be seen, an attempt was made to have a fairly good mix of study
sections representing different types of location, stages of construction, freeway ages, and
land uses for each of the study grade levels.
The eleven study sections are located in four Texas cities: Dallas, Houston,
Lubbock, and San Antonio with one depressed section on U.S. Highway 75 in Dallas; one
depressed section on the Sam Houston Tollway in Houston; and four sections in Lubbock.
3
Two of these are located on 1-27 (one elevated and one depressed), and two are located on
the planned East-West Freeway (U.S. Highways 62/82), one elevated and one depressed.
Figures 1 through 4 show the specific location of the study sections within the four cities,
respectively.
Tables 2 and 3 show other important characteristics of each study section by study
grade level. Some of these characteristics are used in evaluating the different impacts
considered under this study.
TYPICAL CROSS-SECTIONAL DESIGN OF STUDY FREEWAY SECTIONS
Figures 5 through 9 show the typical cross-sectional designs of the study freeway
sections. There are some variations in cross-sectional design through each study section,
depending on the specific location. For instance, only one of the cross-sections shows the
on and off ramp designs or the variation in the number of main lanes or frontage road lanes
throughout the study section.
GENERAL METHODOLOGY AND DATA SOURCES
The general methodology planned for this study was to conduct a "before and after"
construction period comparative analysis across time, supplemented with a cross-sectional
analysis at one point-in-time. The eight completed freeway study sections lend themselves
easily to both analyses. The three others can be used to provide current before and/or
construction period data to supplement these analyses. For instance, the two study sections
still under construction, at time of selection, can be used to study some of the construction
effects of each grade level. The two planned study sections can be used to estimate
anticipatory effects by grade level.
The before and after analysis can compare the elevated freeway sections with
depressed freeway sections to ascertain any significant differences in various types of
impact elements, (i.e., air pollution, noise pollution, business activity, neighborhood
cohesion, etc.). The one point-in-time analysis can compare current level unit values of
each impact element to determine significant differences between elevated and depressed
freeway grade levels. For either of these analytical approaches, elevated study sections can
4
be compared with depressed study sections; aJso these two grade levels can be compared
with adjacent or nearby at-grade level sections. The at-grade sections, when available, can
serve as a control or base section.
Sources of data used in the study ranged from a review of the literature to "on-site"
data collection. The prior studies found in the literature, as well as data obtained from a
national survey of state transportation agencies, helped the different methodologies used in
the study. The data obtained to estimate the effects of the different impact elements came
from the literature, national survey, United States Census Bureau, Texas State Comptroller
and Employment Commission, TxDOT, EnvironmentaJ Impact Statements (EIS) of each
of the study sections, and city criss-cross directories. In addition, the study team
conducted site surveys of businesses and residents, traffic volumes and composition, air
and noise levels, drainage, erosion, and other environmentaJ conditions.
REPORTS OF FINDINGS
Since this study involves the study of many different impact elements, the findings
are presented in several reports by type of impact. The reports are as follows:
• Research Report 1327-1:
Social and Economic Effects of Elevated and Depressed Freeways in Texas
• Research Report 1327-2:
Land Value and Use Effects of Elevated and Depressed Freeways in Texas
• Research Report 1327-3:
Noise Pollution Effects of Elevated and Depressed Freeways in Texas
• Research Report 1327-4:
Air Pollution Effects of Elevated and Depressed Freeways in Texas
• Research Report 1327-5:
Drainage, Erosion, Hazardous Spill, Vibration and Aesthetic Effects of
Elevated and Depressed Freeways in Texas
• Research Report 1327-6F:
Social, Economic and EnvironmentaJ Effects of Elevated and Depressed
Freeways in Texas
5
Research Report 1327-1 contains a sununary of the findings from the national survey of
state transportation agencies, the Texas survey of TxDOT districts, a description of the
cities, and areas of the cities where the freeway study sections are located. This report,
Research Report 1327-2, contains the findings on the effects of elevated and depressed
freeways on land values and uses.
6
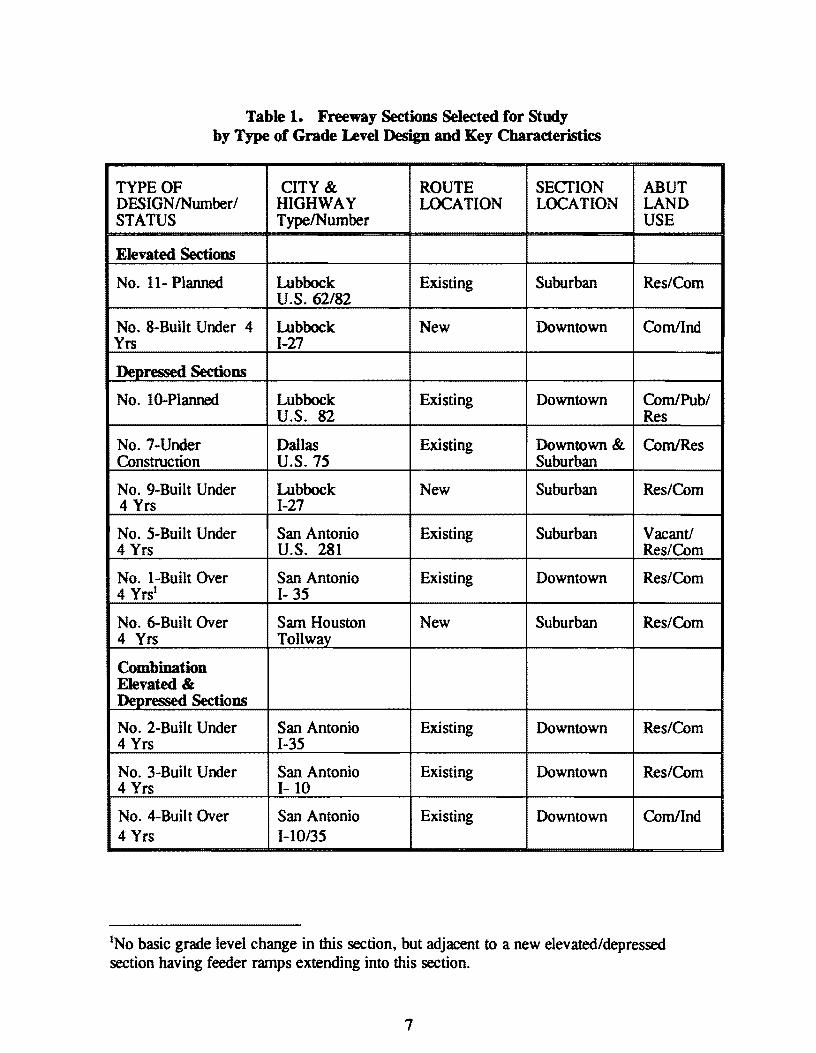
Table 1. Freeway Sectiom Selected for Study by Type of Grade Level Design and Key Characteristics
TYPE OF CITY & ROUTE SECTION ABUT DESIGN/Nwnber/ HIGHWAY LOCATION LOCATION LAND STATUS Type/Number USE
Elevated Sectiom
No. 11- Planned Lubbock Existing Suburban Res/Com U.S. 62/82
No. 8-Built Under 4 Lubbock New Downtown Com/Ind Yrs I-27
Depressed Sectiom
No. 10-Planned Lubbock Existing Downtown Com/Pub/ U.S. 82 Res
No. 7-Under Dallas Existing Downtown & Com/Res Construction U.S. 75 Suburban
No. 9-Built Under Lubbock New Suburban Res/Com 4 Yrs I-27
No. 5-Built Under San Antonio Existing Suburban Vacant/ 4 Yrs U.S. 281 Res/Com
No. I-Built Over San Antonio Existing Downtown Res/Com 4 Yrs1 I- 35
No. 6-Built Over Sam Houston New Suburban Res/Com 4 Yrs Tollway
Combination Elevated & Depressed Sectiom
No. 2-Built Under San Antonio Existing Downtown Res/Com 4 Yrs I-35
No. 3-Built Under San Antonio Existing Downtown Res/Com 4 Yrs I- 10
No. 4-Built Over San Antonio Existing Downtown Com/Ind 4 Yrs I-10/35
1No basic grade level change in this section, but adjacent to a new elevated/depressed section having feeder ramps extending into this section.
7
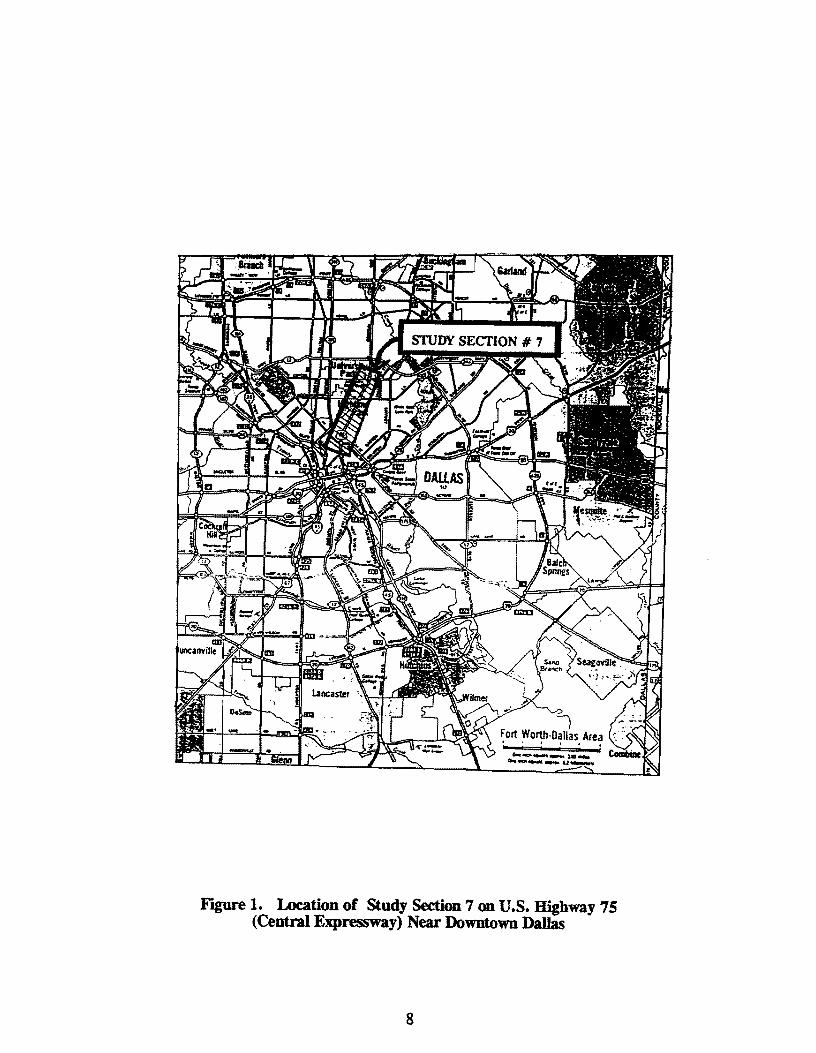
Figure 1. Location of Study Section 7 on U.S. Highway 75 (Central Expressway) Near Downtown Dallas
8
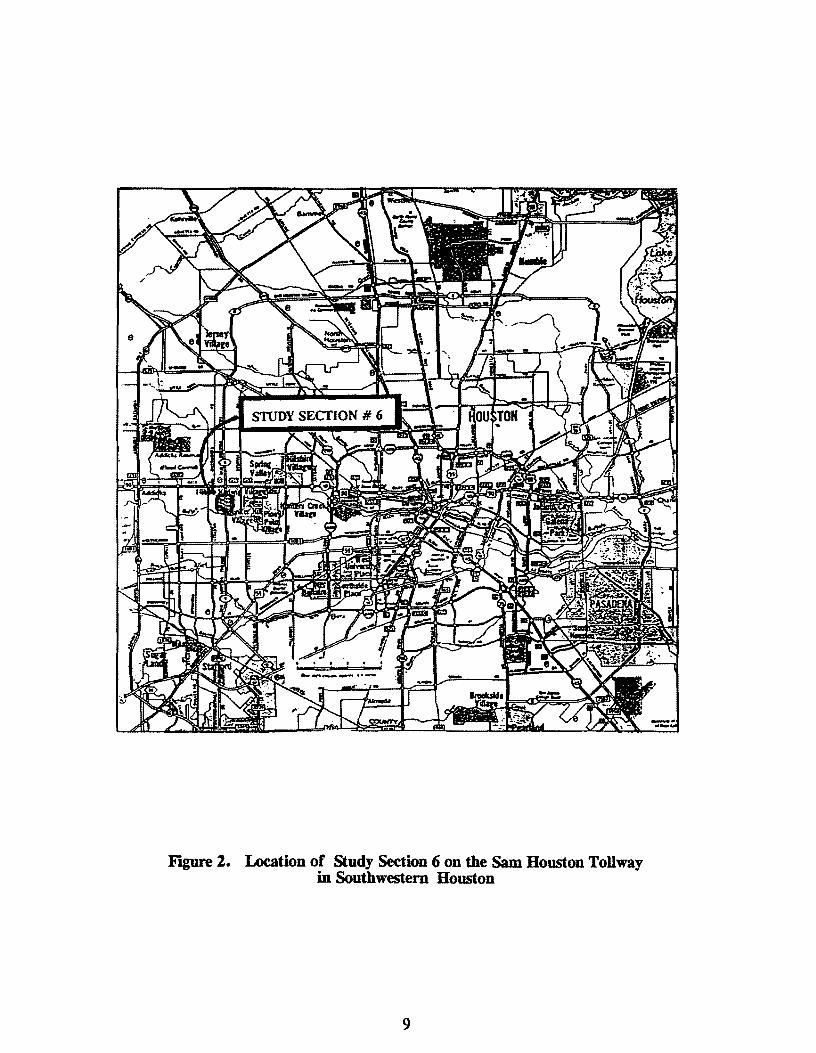
Figure 2. Location of Study Section 6 on the Sam Houston Tollway in Southwestern Houston
9
........ _u ... ........ _ .. ..._..
Figure 3. Location of Study Sections 1-5on1-10/35, 35, and U.S. Highway 281 in San Antonio
10
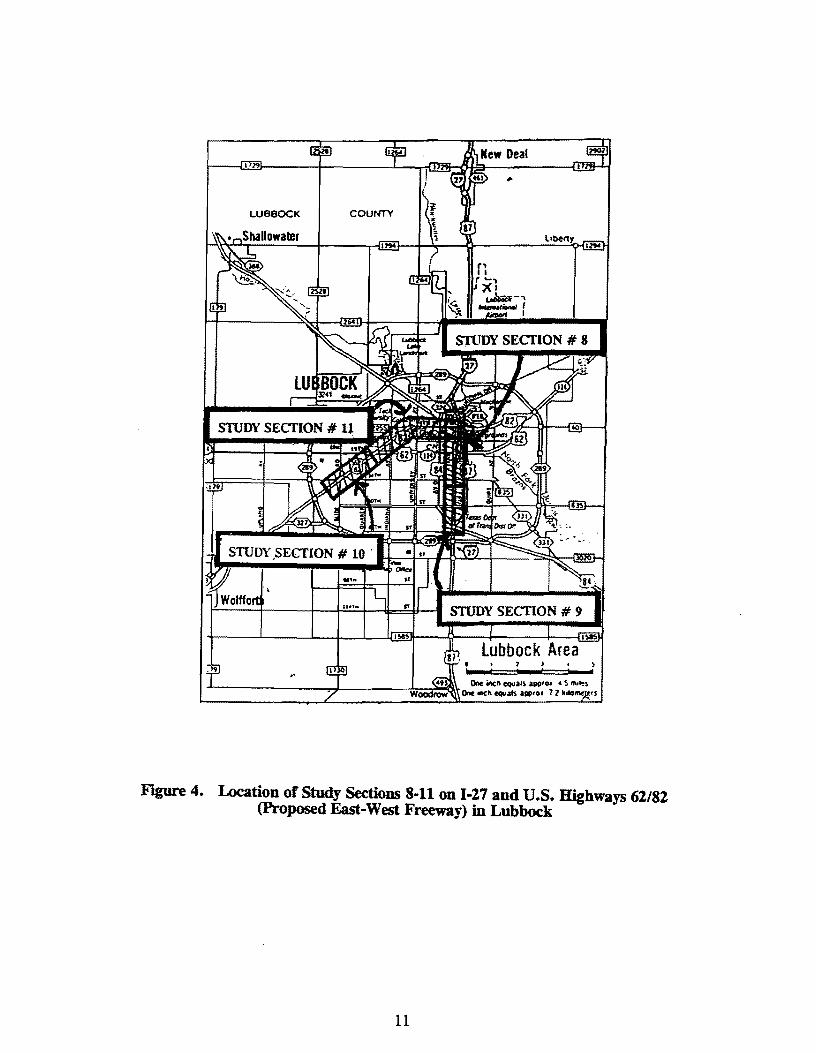
Figure 4. Location of Study Sections 8-11 on 1-27 and U.S. Highways 62/82 (Proposed East-West Freeway) in Lubbock
11
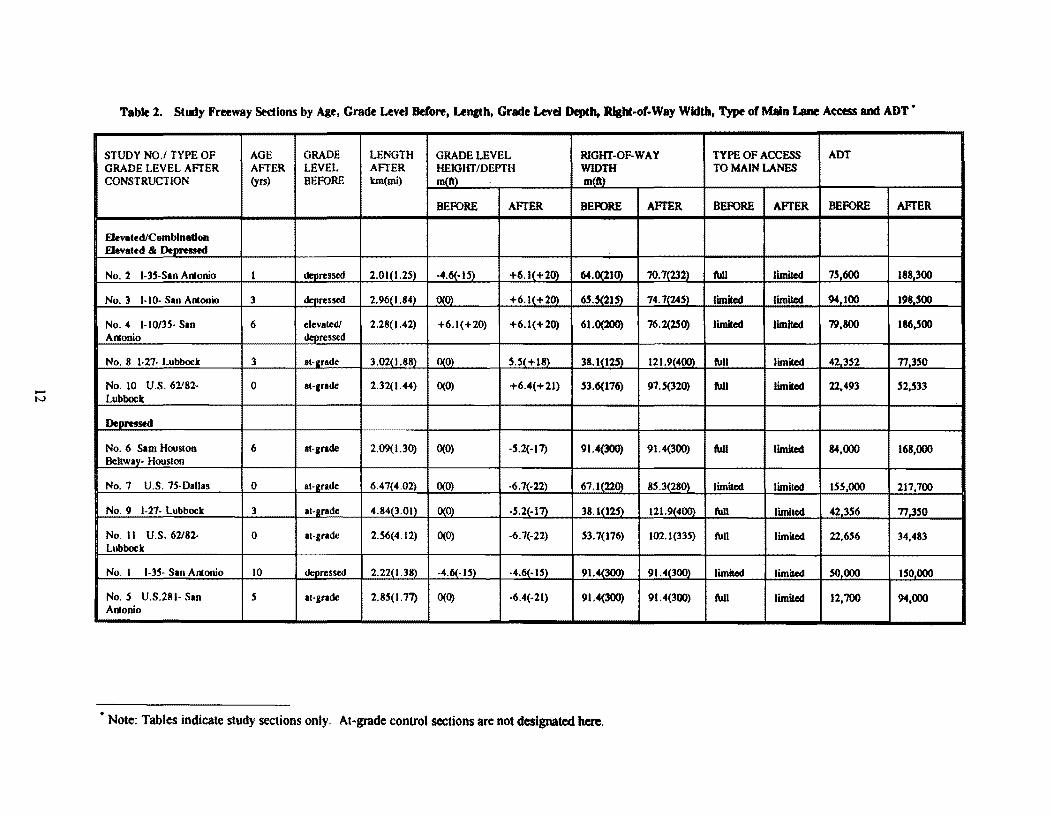
Table 2. Study Freeway Sections by Age, Grade Level Before, Length, Grade Level Depth, Rlaht-or-Way Width, Type or Main Lant Ac:ceu and ADT •
STUDY NO.I TYPE OF AGE GRADE LENGTH GRADE LEVEL RIGHT-OF-WAY TYPE OF ACCESS ADT GRADE LEVEL AFTER AFTER LEVEL AFTER HEIGHT/DEPTH WIDTH TO MAIN LANES CONSTRUCTION (yrs) BEFORE km( mi) mCft) mCft)
BEFORE AFTER BERJRE AFTER BER>RE AFTER BER>RE AFTER
Elevated/ComblnatJon FJevated & Denreaed
No.2 1-3.S-San Alllonio 1 denressed 2.01(1.25) -4.6(-15) I +6.1(+20) 64.0(110) 70.7(232) Ml limited 7.5,600 188 300
No. 3 1-10- San Antonio 3 denressed 2.96(1.84) 0(0) +6.1(+2()) 6.5."215) 74.7(24.5) limited limited 94,100 198 .500
No. 4 1-10/35- San 6 elevated/ 2.28(1.42) +6.1(+20) +6.1(+20) 61.0(200) 76.2(2.50) limited limited 79,800 186,.500 Alllonio deoressed
No. 8 1-27- Lubbock ] at-grade 3.02'1 .88) ()(0) .S.Sl+18) 38.1(12.5) 121.9(4()()) full limited 42 3.52 77,3.SO
- No. 10 U.S. 62182- 0 at-grade 2.32(1.44) 0(0) +6.4(+21) .53.6(176) 97 . .5(320) tull limited 22,493 .52,.533 N Lubbock
()epreged
No. 6 Sam Houston 6 at-grade 2.09(1.30) 0(0) -.S.2(-17) 91.4(300) 91.4(300) lull limited 84,000 168,000 Beltwav- Houston
No. 7 U.S. 75-Dallas 0 at-1nde 6.47(4.02) 0(0) -6.7(-22) 67.1(220) 85.3(280) limited limited lSS,000 217,700
No. 9 1-27- Lubbock 3 aH1.rade 4.84(3.01) ()(0) -S.2(-17) 38.1(12.5) 121.9( 400) lull limiled 42.3.S6 77.3.SO
No. II U.S. 62182- 0 at-grade 2.56(4.12) 0(0) -6.7(-22) .53.7(176) 102.1(33.S) full limiled 22,6.S6 34,483 Lubbock
No. I 1-3.S- San An1onio 10 """ressed 2.22(1.38) -4.6(-1.5) -4.6(-1.S) 91"tl300I 91.4(300) limited limited .so 000 1.SOOOO
No . .S U.S.281- San s at-grade 2.8.S(l .77) 0(0) -6.4(-21) 91.4(300) 91.4(300) lull limited 12,700 94,000 Alllonio
•Note: Tables indicate study sections only. At·grade control sections are not designated here.
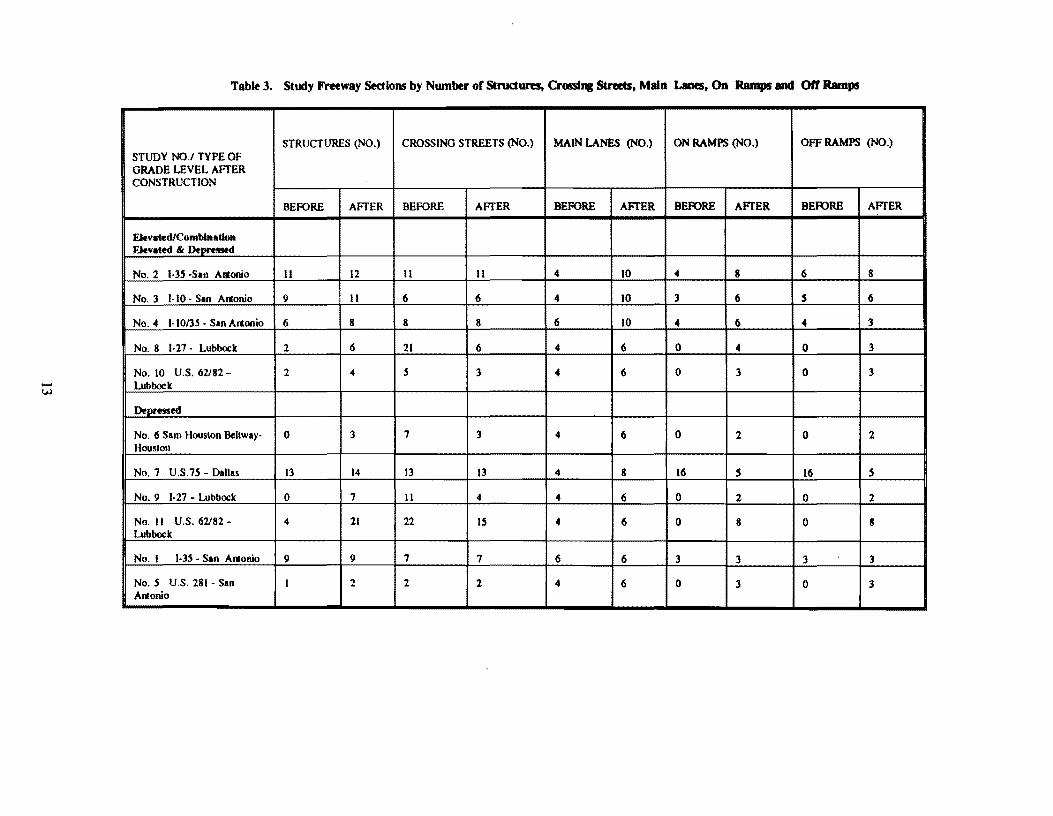
Table J. Study Freeway Std Ions by Number of Structures. Crossing Streets, Main Lanes, On Ramps and Off Ramps
STRUCTURES (NO.) CROSSING STREETS (NO.) MAIN LANES (NO.) ON RAMPS (NO.) OFF RAMPS (NO.) STUDY NO.I TYPE OF GRADE LEVEL AFTER CONSTRUCTION
BEFORE AFTER BEFORE AFTER BEFORE AFTER BER>RE AFTER BER>RE AFTER
Elevated/Comblnatlon Elev at
No. 2 - - 12 II II 4 10 4 8 6 8
No. 3 II 6 6 4 10 3 6 s 6
No. 4 1-10/3.S • San Aitooio 6 8 8 8 6 10 4 6 4 3
No. 8 1-27 · Lubbock 2 6 21 6 .. 6 0 4 0 3
No. 10 U.S. 62182 - 2 4 .s 3 4 6 0 3 0 3 -w Lubbock
Depl'flSed
No. 6 Sam Houston Beltway. 0 3 7 3 4 6 0 2 0 2 Houston
No. 7 U.S.75 - Dallas 13 14 13 13 4 8 16 s 16 s No. 9 1-27 - Lubbock 0 7 11 4 4 6 0 2 0 2
No. II U.S. 62182- 4 21 22 IS 4 6 0 8 0 8 Lubbock
No. I l-3S ·San Antonio 9 9 7 7 6 6 3 3 3 3
No . .S U.S. 281 • San I 2 2 2 4 6 0 3 0 3 Antonio
WfDr ptr M'":f*•..,,,.,...••_.
.Oft.: _ ....... , " ............. , ................. o--... -··-··- , ............................... " •••-C.••• .................... ·- , ............. . ~-..- .............. -· ._ .... , ...... ... c. ................................... ~··· .................. ,.... ...... .
1 SUU IEPUTIUTtf llGl•IU ul rllll( fUISPllUTIOI
...... , .---... ... ~ ...... _., ..•. , . ..,_ ~ .......... ~.,. ·-·-···-SClfllflt (IOU Sft rtOIS
•LTUrmns
U S. Highway 75 Section # 7, Dallas
:r--:j~!=·=··=··==·=·"al;-:1]
TYPICAL DEPRESSED SECTION AT BUFFALO BAYOU TO IH10(W)
)00" •A 0 _,
... •• W.l. J•' I :)4' W\,
• , ......... , S.D.H.P.T .
TYPICAL SECTIONS
&(1,,TW.t.Y •
StC.TJO• m vs••<S> TO *" tO(W)
"'"""•S C:OU..-r1 O(C:.. 1•1• • T"'[fll[ .tflll( •O ,..O•T•Q:( •O•os PllOr"0.1(0 aC:fW((N M(MOllU.A.I,, Oil_
UlllO au,.#A\,0 e.&YOU 11111[¥ •• .JUM(. •••• (J: .... ••rT ,.
Sam Houston Tollway Section # 6, Houston
Fagure 5. Typical Cross-sectional Design of Depr~d Study Sections on U.S. Highway 75 in Dallas, Texas, and Sam Houston Tollway
in Houston, Texas
14
- - -.,...~ ...... e>,c.ot.
I ..... ~.,..~ --· I l I .,.~-.;";':"' --~ I ...... ..;.=. .. .• ,,;r.,, .......... ,. _I 1 ., i I ........ - ·
J L 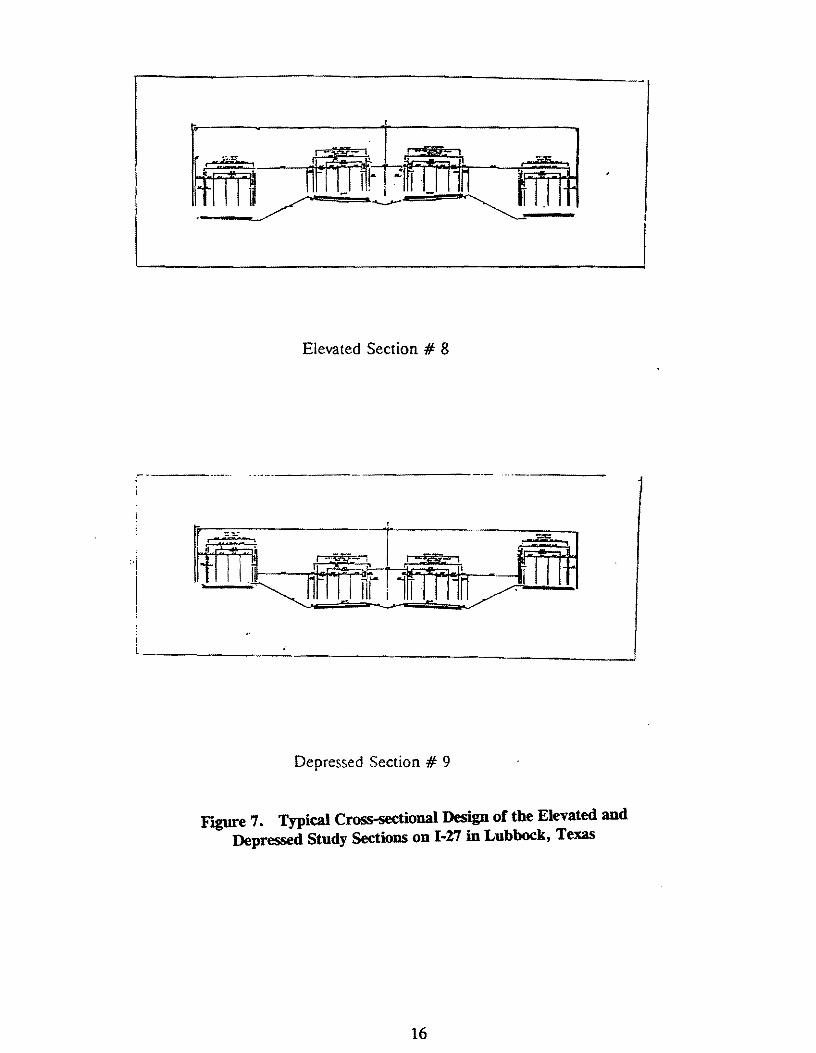
Elevated Section # 8
-------·- ····-- ·-- ·-------- ··---------
Depressed Section # 9
Figure 7. Typical Cross-sectional Design of the Elevated and Depressed Study Sections on I-27 in Lubbock, Texas
16
l -- -~ ,,,..,._
1 -1=Lrr=s .. 4 • .. • . ., ....
c.tc&~-.
!
I . t:....-:'..:Z:
PG•'Ne" . ..,..,,,,,,'!( 09tc.,,__5
LH. 35 Section # 1
I.H. 35 Section # 2
1-10 Section# 3
Figure 8. Typical Cross-sectional Design of the Combination Elevated/Depr~ Study Sections on 1-10and1-35 in San Antonio, Texas
17
__ ..,. __
l.H. 35 Section # 4
,...:~~--------~---i1~1.:1.-.;·.1·.l~L_ .. -,1 .. _ii,!:~:;; "7." .. I
I ' , I ! I
I • l IT
U. S. Highway 281 Section # 5
Figure 9. Typical Crcm-sectional Design of the Dep~d Study Sections on U.S. Highway 281 and 1-35 in San Antonio, Texas
18
BACKGROUND AND LITERATURE REVIEW
Examination of the literature shows that studies of freeway impacts on adjacent and
peripheral properties were initiated as earJy as the mid-1950s. These studies analyzed
changes in land use and land values from the perspective of properties adjacent to and
removed from the facility. Some studies focused on the freeway elevation, while some did
not. In large measure, however, the previous research indicates that the construction of a
freeway and its grade influence adjacent property values. In cases where the freeway opens
major travel corridors and improves travel, adjacent owners consider the facility to positively
impact their land values. However, the literature does not generally explore the relationship
or magnitude of other variables.
Land value is derived by a variety of variables which include, but are not limited to,
location and accessibility, overall economic health of the locale, growth rates, and
subsequent demand for various types of property (Miller, Jr., 1978). For those parcels that
are adjacent to a freeway, the elevation affects values generally due to visual and noise
effects; those properties removed from the freeway experience a lesser influence on property
values than those that are adjacent (Langley, Jr., 1981). A differentiation in values exists
also for properties that are adjacent to the freeway as a result of the type of land use and the
grade of the freeway. Commercial land uses typically command higher values than
residential uses. Sites next to depressed sections of freeway are expected to have higher
values than those next to at-grade sections, and elevated sections are anticipated to have
lesser value than properties in at-grade and depressed sections.
NATIONAL OVERVIEW
The impact of highway improvements on property values in the state of Washington
was the central point of research conducted by Palmquist (TRR 887). The study assessed the
change in property values near the freeway compared to values removed from the freeway. It
19
was found that benefits accrued to property values when the residents utilized the freeway to
commute. The benefits ranged from a 12%-15% increase in value depending on the
particular freeway under review (Tomassik, 1987). In contrast, when residents proximate to
the facility did not travel the freeway for the work trip, there was little or no change in
property value. Further, the houses adjacent to the freeway did not appreciate to the same
degree as those houses that were somewhat removed from the freeway. Commercial and
industrial values increased relative to study control sections by roughly 17%.
In order to maintain or increase the value of property adjacent to a freeway, certain
features need to be addressed during construction of a facility. For instance, the Draft
Environmental Impact Statement for a widening project (U.S. 54) in Kansas included a
pedestrian overpass which would maintain the accessibility for walking traffic upon
completion of the facility. While the pedestrian option may not be consequential for all
communities, it may be an important option to preserve the basic character of some
communities, thus contributing an item of value to those properties adjacent to the freeway.
Freeway related studies conducted in Arizona found that the inclusion of appropriate
mitigating techniques wt'!re followed by increases in property values proximate to new
freeways (Tomassik, 1987).
Downs (1982) adds credence to the importance of the physical design of the facility
as a contributing variable to adjacent properties1 decrease, maintenance, or increase in value.
He writes that the physical design of the transportation facility definitely affects the value of
land. He further notes that an artery will not influence land values unless other economic
variables are operating in tandem. Downs found that several characteristics can be found
which affect the value of land adjacent to a transportation facility. The higher land use
categories are associated with higher values than lower land use types. That is, commercial
property can be expected to exhibit greater value than residential. In addition, vacant land
adjacent to development will increase more rapidly in price than improved land.
Importantly, the research notes that governmental decisions and public policy can influence
20
the land value response. Strong land use controls that restrict lower value uses or that create
standards that encourage high value development create a market for more expensive land
uses. Tomassik (1987) concurs with this perspective after analyzing freeways in Arizona and
finding that the facilities create an incentive for market change but do not cause that change.
In fact, development was controllable by strong land use planning.
Another key subject covered by Downs' research is that the stage of construction
impacts the value of property. He notes several time periods which influence land values,
beginning with the route selection and planning periods, clearance, displacements and
constructions periods, and lastly the early and mature operation periods. Property often
decreases in value during pre-construction and construction but regains its worth after several
years. Other work found that the variation in residential prices was no longer observable after
the freeway had been in place for five years (Tomassik, op. cit.).
Of the freeway gradations, the depressed section is often considered to be most
desirable because the noise is absorbed and the visual impact of the freeway is lessened.
Survey responses in Arizona in the Tomassik research showed that the depressed section was
preferred. This premise is confirmed by Buffington et. al. in an examination of residents
located adjacent to freeways in Houston, Texas.
Institute of Transportation Engineers designed a study (1976) to examine the relative
importance of three categories in detennining the perception of freeways: environmental,
community, and commerce/industry. They learned that the environmental areas of noise, air,
and visual affect exerted the greatest influence on the perception of the freeway, and that the
community variables of vehicular and pedestrian circulation have the largest impact for
commerce and industry. They also found that population increased around the facilities,
although the mean educational level decreased and the racial composition and employment
classifications changed. This study was instrumental in showing that the presence or absence
of an elevated or depressed structure does not halt residential development or habitation of
21
existing structures. Further, it confirmed that emphasis on noise, air quality, and visual
impacts is well placed.
TEXAS FOCUS
A collection of previous studies has concentrated on projects in Dallas, Bryan/College
Station, and Houston. These studies have often employed models which were descriptive in
nature, showing the relationship between land use and land value, land use and traffic, and
land use and urban development (Buffington et al., 1978). One example of the early studies
addressing this question is the 1957 study by William G. Adkins which assesses the effects of
a 13.99 kilometer segment of the North Central Expressway (Dallas) on land values and land
use. This study also assesses the attitudes of businessmen and property owners affected by
the freeway. This research examined three contiguous bands adjacent to the freeway. In this
work, the land use assessment served as a backdrop to the land value changes. The study
indicated that, as expected, values adjacent to the freeway were higher than non-adjacent
property values. Individuals who responded to a survey about their properties were generally
favorable regarding the freeway construction, with most indicating that their property values
had increased. Further, business owners experienced growth and overall improvement in
travel accessibility.
Later work led by Buffington (1981) examined highway impacts by whether new
construction was in urban, suburban, or rural locations. Suburban locations exhibited the
greatest gain in property values and in development due to improved access. Commercial
developments were found to cluster near the interchanges, with residential developments
occurring between the commercial clusters. For urban areas, the "life cycle stage" of the
community had the primary influence on the changes that were observed; in areas where
there was little or no vacant land, the impact of the freeway on development or values was
insignificant. This study also found that urban area highway improvements stimulated an
22
increase in property values for undeveloped land and commercial areas but seemed to cause a
slight decrease in residential values.
MULTIMODAL INFLUENCES
A review of another elevated mode, rail, in an urban setting provides some elements
of similarity by which we might structure this analysis. Work by Silver et al. indicates that
the effects of an elevated facility from the perspective of the neighborhood should be viewed
from a land use, traffic, urban renewal, and environmental standpoint. Other rail studies have
found that the existing condition and strength of the neighborhood exert an intervening
influence on the relationship between elevated facilities and adjacent properties. That is,
strong stable neighborhoods with increasing property values experienced continued increases
when transportation access was improved, regardless of facility elevation. Moderately priced
communities maintained their value under that circumstance. However, adjacent properties
that were experiencing decreasing values were unaffected by the construction of the ~levated
facility and continued to experience deflating values (METRO Technical Working Paper,
1988).
SYNOPSIS OF STUDIES
Overall, the studies have pointed to a set of variables as relevant for analysis of the
basic research question. These included a basic assessment of the character of the
neighborhoods, relevant zoning or land use controls, land values, and socio-demographic
characteristics. Prior studies have noted that impacts may be short-term, intermediate-term,
or long-term. They have been explanatory and provided techniques to allow predictive
applications of the findings. The impacts have been social, environmental, or economic.
Additional variables, including general economic health of the city, type of land use and land
use controls, and prior land values act to influence the economic and social effects of freeway
facilities on adjacent properties. Freeway grade need not negatively impact adjacent land
23
values when the highest and best use is recognized. It is, therefore, critical that officials
recognize which land uses can maintain and increase value regardless of freeway elevation
(Ashley and Berard, 1965).
RESEARCH THRUST AND THESIS
The basic research questions to be addressed in this section of the study are whether
freeway grade impacts a cadre of social and economic variables. Several freeway sections in
Texas were identified which represented elevated and depressed construction in urban and
suburban locales. The primary characteristics to be studied include the following:
• Demographic characteristics from prior year to after project completion utilizing
population, income, and ethnicity for 1980 and 1990;
• The use of existing structures, including average household size and vacancy rates;
• Changes in land use categories; and
• Land values for 3-5 years prior to freeway construction (depending on data available)
and for the most recent year available (1994). The presence or absence of a strong land
use policy in the city will be examined as an important policy characteristic.
It is important to note that demographic or land value changes may also occur in response
to influences by variables in the general market. Thus, there will be some portion of changes
in land values or social characteristics that has not been included in this analysis. For
example, the population of Texas, like that of the United States as a whole, is becoming more
ethnically diverse. The populations of each of the urban areas in question can be expected to
have more African-Americans, Hispanics, and Asians when comparing the 1980 and 1990
data. The principal thesis is that freeway elevation does influence land value, with the
depressed condition being the preferred condition, the at-grade representing a neutral
influence, and the elevated structures representing the most negative effects across all
categories under investigation.
24
In an cases, sections which are largely at-grade will be designated as control sections.
These sections will then serve as the base of comparison for the elevated and depressed
freeway sections along the same route. Based on a review of literature, it is anticipated that
the following will occur:
• Population will be roughly the same in residential areas before and after freeway
construction. It is not anticipated that this effect will be sensitive to freeway grade.
• Mean household size and mean vacancy rates will be higher than citywide means;
also these mean values will be higher at locations adjacent to elevated structures than
at-grade and depressed structures.
• It is not anticipated that freeway grade will cause a change in land use.
• Land values in depressed sections are expected to be higher than land values adjacent
to elevated structures. Both elevated and depressed land values are expected to have
increased less than citywide totals for residential, but increased more than citywide
totals for commercial. That is, both elevated and depressed land will be expected to
have increased in value relative to the base year. However, depressed values will
have increased more than elevated and at-grade values. Elevated values are expected
to be lower than at-grade values.
METHODOLOGY
The study team solicited recommendations from District Engineers across Texas on
candidate freeway sections to include in the research. Desired sections were elevated,
depressed, or combined (elevated and depressed), in urban and suburban settings, and in
varying stages of development or operation. Four cities, including several freeway sections,
were identified as representing the range of conditions required for analysis. Each freeway
had some elevated, depressed, and at-grade portions. Data were collected from the four cities
selected which included land values in a year prior to the freeway construction and the most
current value for each tract adjacent to the roadway. AJso, researchers assembled census
25
level data for 1980 and 1990, the two principal years relevant for comparison with the land
value data.
STUDY LIMITATIONS
The study design called for 1980 data as the point of comparison for current values in
San Antonio. However, the defined areas were not combined under a unified appraisal
district in 1980. Thus, appraisals were conducted independently by the city of San Antonio
and Bexar County, and methodologies were not the same. Therefore, the prior year data
were not conducted on the same basis and would not have been suitable for the longitudinal
analysis. Appraisals from 1983 provided the first year that a set of appraisals could be
obtained that would yield the reliability to be used as the base year. It is not anticipated that
a great variation in values occurred between 1980 and 1983, but it must be recognized that
the earlier year may have some variations from the data utilized.
Data collectio~ required the assistance of the appraisal districts in the four cities
included in the study. These individuals were extremely helpful in acquiring the archived
data and in directing the study team in the retrieval of data that were accessible to the public.
The study design called for appraised values, on an annual basis, for each property value in
each city. The annual data would have provided a data set which would have increased
tracking of interim shifts in property values. Thus, the degree of potential measurement error
may be larger than intended in the original study design. However, such collection would
have required even greater blocks of time from appraisal district personnel or financial
resources outside the parameters of this study. Four or more years of data were available for
Houston and Lubbock~ however, only two years were obtained for Dallas and San Antonio.
The difference in data collection was due to the accessibility of records available through
each appraisal district.
26
MAJOR FINDINGS
It should be recognized that the freeway sections in Texas cities have differing
characteristics. Houston, San Antonio, Lubbock, and Dallas reflect their individual
economic, policy, cultural, and historical trends. Further, the freeway sections incl1:1ded in
the study are bordered by a variety of land uses, ethnic representations, and are in urban and
suburban parts of these cities. Special circumstances that can be identified will be included
for consideration along with the numerical evaluations.
HOUSTON
Study Area Description
The city of Houston began as a real estate venture when the Allen brothers of New
York bought 6642 acres ofland adjacent to Buffalo Bayou in 1836. The city has one of the
largest ports in the world and is considered the world's "Energy Capital." Houston has
developed as a center for the oil and petrochemical industries due to its central location and
proximity to the country's oil and natural gas fields. Houston is also known as "Space City"
for the three decades of space and lunar expeditions from Johnson Space Center.
Houston covers 1543 km2 (596.1 rni2) of territory and exercises development control
over an additional 3367 km2 (1300 mi2) of extra-territorial jurisdiction (ETJ). Houston's
population is approximately 1.5 million, an increase of 15% since 1986.
Houston is a diverse city, composed of 41 % White, 27% Black, 28% Hispanic, and
4% Asian and American Indian. Houston has attracted people from all over the world.
More than 50 ethnic and heritage organizations are active in Houston. Ancestral diversity
is exemplified by the 60+ foreign languages and over 100 countries of origin identified
among students in the Houston Independent School District.
Houston experienced tremendous growth in the late 1970s and early 1980s. Just over
3.4 million m2 (37.3 million ft2) of leasable office space was built outside downtown
27
Houston's Central Business District. This constituted almost 75% of total office space
constructed during the decade. Industrial uses are generally located along the Ship Channel,
spreading eastward adjacent to rail lines that radiate from the Port of Houston. During the
1970s, there was rapid residential construction activity followed by annexation in the north,
west, and far southwest which accounted for a large increase in single family land use
acreage during the boom. The largest land use in the city is single-family residential and
accounts for 20.5% of Houston's area (The Houston Almanac, 1994). Multi-family
replacement of older single family housing took place inside Loop 610. Many multi-family
complexes were built on outlying areas of lower land costs but with convenient access to a
freeway. Development in the 1990s has been targeted for higher income tenants and are
three-story rather than two-story construction. Density ranges from 8 to 14 hectare, with
common areas offering recreation. High rise condominiums are generally located on the
periphery of affiuent residential areas such as the Medical Center, Galleria, and Memorial
areas. Despite the trend toward decentralization of the city's population, the areas with the
highest employment concentrations tend to have intense development.
Today, Houston's land use pattern reveals a Central Business District encircled by
freeways that also radiate from this downtown loop. Two highway loops (I-610 and Beltway
8), as well as a proposed third loop (Grand Parkway), encircle the Houston area. Outside the
downtown loop, the Inner Loop (Loop 610) surrounds the oldest, most intensively developed
area, Houston's inner-city. New development and revitalization are occurring in many areas
inside the Inner Loop. The Outer Loop (Beltway 8) and even larger loop of the proposed
Grand Parkway are opening up undeveloped land in the outer regions of the city.
Throughout Houston, intersecting thoroughfares and freeways have provided strategic
locations for other commercial establishments, shopping malls, and business centers.
Houston enjoys excellent transportation access. The automobile is the most common
means of transportation. Roadway transportation is handled by freeways, tollways, and high
occupancy vehicle lanes, thoroughfares, and other rural roadways. Harris County serves as
28
the hub of the region's roadway system, where interstate highways 1-10 (Katy Freeway) and
1-45 (Gulf Freeway) converge. Houston has the most extensive freeway and toll road system
in the Southwest. Other highways serving metropolitan Houston are 1-610 (the Loop),
Beltway 8 (Sam Houston Toll Road), U.S. 59 (Eastex Freeway; Southwest Freeway), and
SH-225 (LaPorte Freeway). The proposed Grand Parkway will encircle Houston at a radius
of 40 to 56 km (25 to 30 mi) from the city centers. A portion of Beltway 8 is located on the
west side of the city and has been renamed the Sam Houston Tollway. The area of the
tollway between 1-10 and Westheimer has been identified for intensive study as part of this
research. The area is described more fully below.
Freeway Description
The Sam Houston Tollway opened for operation in 1989. The tollway is elevated
from 1-10 to approximately Kimberly Lane, where the structure transitions to depressed
sections and continues to Traviata Avenue; at this point the structure rises to cross Rumel
Creek and Buffalo Bayou. After crossing the creek and bayou, the freeway returns to at
grade to the study terminus at Westheimer (Figure 10). Traffic volumes of 106,530 vehicles
daily are recorded on the Sam Houston Tollway south of 1-10. At-grade sections near the
study sections were identified for control sections. The Houston control section is slightly
north ofBriar Forest to slightly north ofWestheimer (approximately 1.2 kilometers [.74 mi]).
Socio-Economic Assessment
The population for the city of Houston experienced a 2% increase from 1980 to 1990.
During the same period, the study area recorded an increase in population of 16%, and a 6%
increase in population density. There were no significant increases in the city's or the study
area's average persons per household. The racial composition of the study area recorded
substantial population increases in both the African-American and Hispanic groups of 75%
29
•
•
. . . J
LEGEND Elevated
At-Grade ·. . .. Depressed
Figure 10. Sam Houston Tollway Elevation Map
30
. ....
--f-~ .. · I
:1 .
...
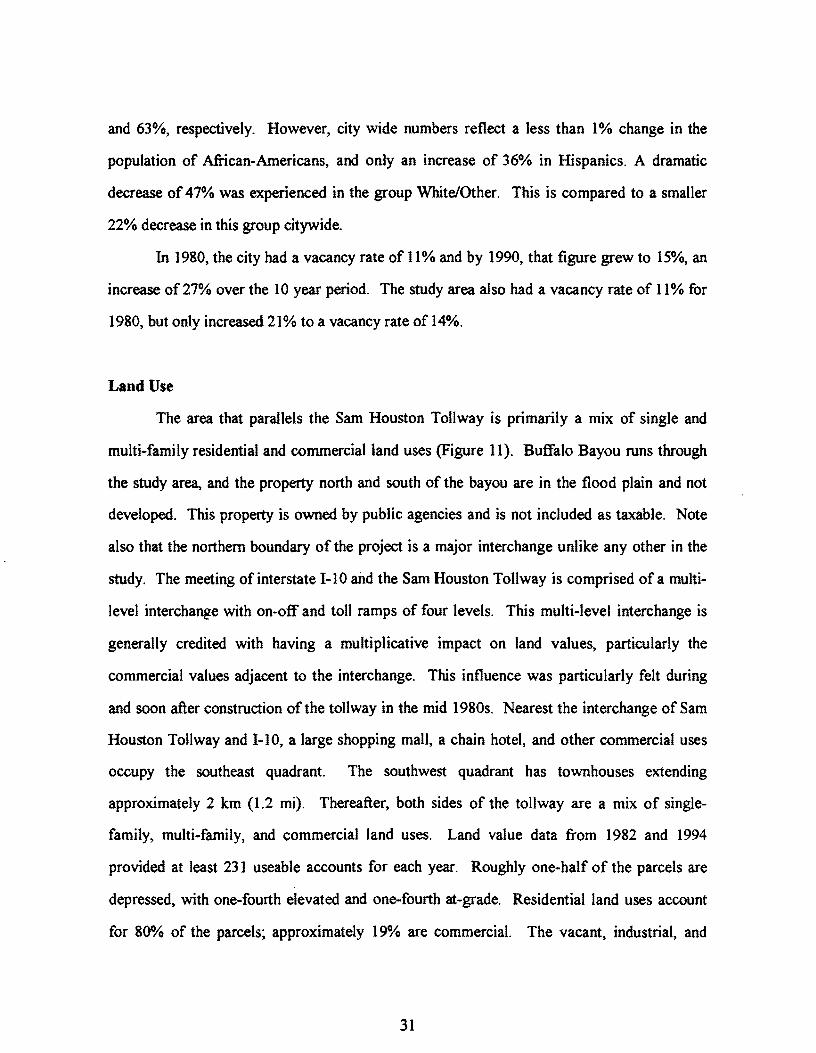
and 63%, respectively. However, city wide numbers reflect a less than 1 % change in the
population of African-Americans, and only an increase of 36% in Hispanics. A dramatic
decrease of 47% was experienced in the group White/Other. This is compared to a smaller
22% decrease in this group citywide.
In 1980, the city had a vacancy rate of 11 % and by 1990, that figure grew to 1 So/o, an
increase of 27% over the 10 year period. The study area also had a vacancy rate of 11% for
1980, but only increased 21% to a vacancy rate of 14%.
Land Use
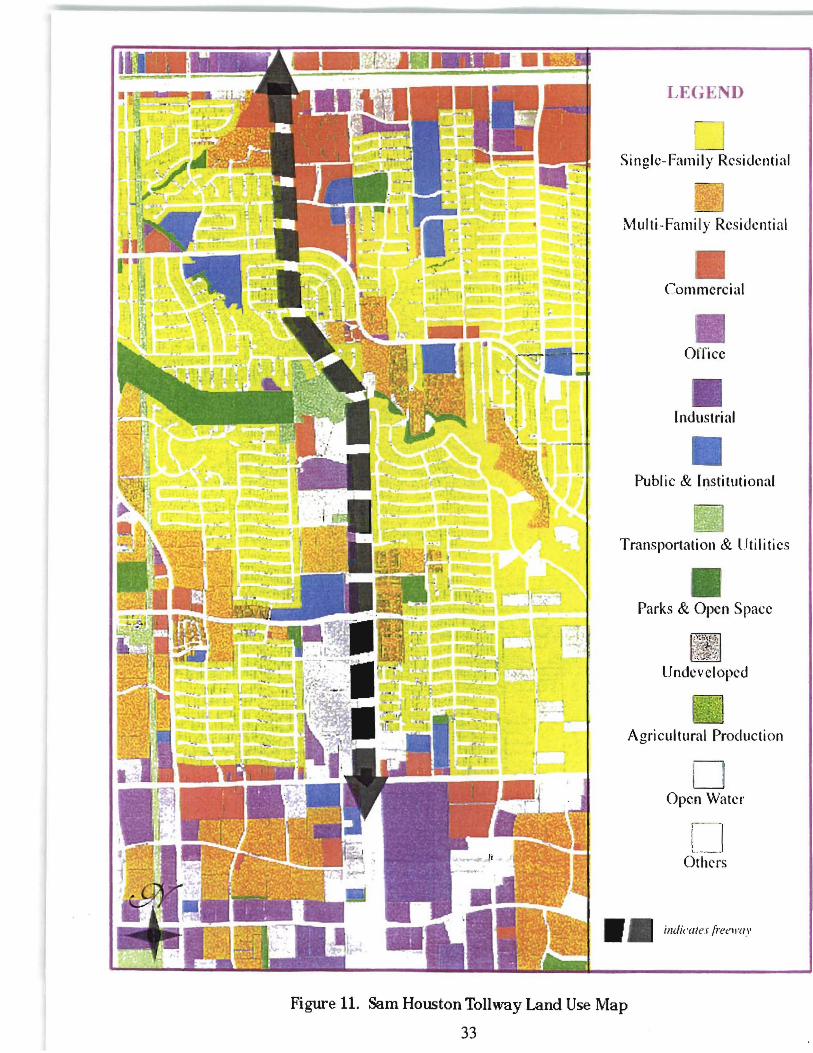
The area that parallels the Sam Houston Tollway is primarily a mix of single and
multi-family residential and commercial land uses (Figure 11). Buffalo Bayou runs through
the study area, and the property north and south of the bayou are in the flood plain and not
developed. This property is owned by public agencies and is not included as taxable. Note
also that the northern boundary of the project is a major interchange unlike any other in the
study. The meeting of interstate 1-10 and the Sam Houston Tollway is comprised of a multi
level interchange with on-off and toll ramps of four levels. This multi-level interchange is
generally credited with having a multiplicative impact on land values, particularly the
commercial values adjacent to the interchange. This influence was particularly felt during
and soon after construction of the tollway in the mid 1980s. Nearest the interchange of Sam
Houston ToJlway and 1-10, a large shopping mall, a chain hotel, and other commercial uses
occupy the southeast quadrant. The southwest quadrant has townhouses extending
approximately 2 km (1.2 mi). Thereafter, both sides of the tollway are a mix of single
family, multi-family, and commercial land uses. Land value data from 1982 and 1994
provided at least 231 useable accounts for each year. Roughly one-half of the parcels are
depressed, with one-fourth elevated and one-fourth at-grade. Residential land uses account
for 800/o of the parcels; approximately 19% are commercial. The vacant, industrial, and
31
institutional uses combined make up roughly 1% of the total properties (see Appendix 2).
See Figure 11-Sam Houston Tollway Land Use Map.
Land Value Assessment
The data are analyzed by assessing the means and by viewing the range of property
values; that is, the lowest and highest per square meter value for each grade or land use.
While not reported in this section, land values in Houston and in the study area were
increasing rapidly between the early to mid-1980s. In fact, a particularly large increase
occurred between 1982 and 1986. However, the latter year paralleled the beginning of a
recession in the oil-based economy of Houston. That recession, along with the freeway
construction, contributed to a decrease in value for most properties in Harris County when
the middle 1980s are compared to later years. Some local property experts suggest the
market in the early 1980s may have been inflated, and the economic downturn led to more
appropriate market conditions.
Range of Values
Table 4 displays the high and low land values per square meter by freeway grade and
land use. The range of values is broad within the 1982 (before construction) and 1994 (after
construction) time periods. In 1982, values ranged from a low of $1.22 per square meter to a
high of $301.31 per square meter; the values after construction range from $5.34 per square
meter to $228.83 per square meter. When comparing the before and after data, all but one
category (the high value for depressed parcels) increased after the freeway construction.
Observation of the range of values by land use category shows that properties in all
categories increased in value with the exception of the high end commercial property. Note,
the industrial land uses present in 1983 did not exist by 1994.
32
LEGEND
Single-Family Residential
Multi-Family Residential
Commercial
Office
• Industrial
Public & Institutional
Transportation & Utilities
Parks & Open Space
~ ~
Undeveloped
-:- rr. :' : 1'
Agricultural Production
D Open Water
L I Others
11111 i11din1/eJ[rei:wm•
Figure 11. Sam Houston Tollway Land Use Map
33
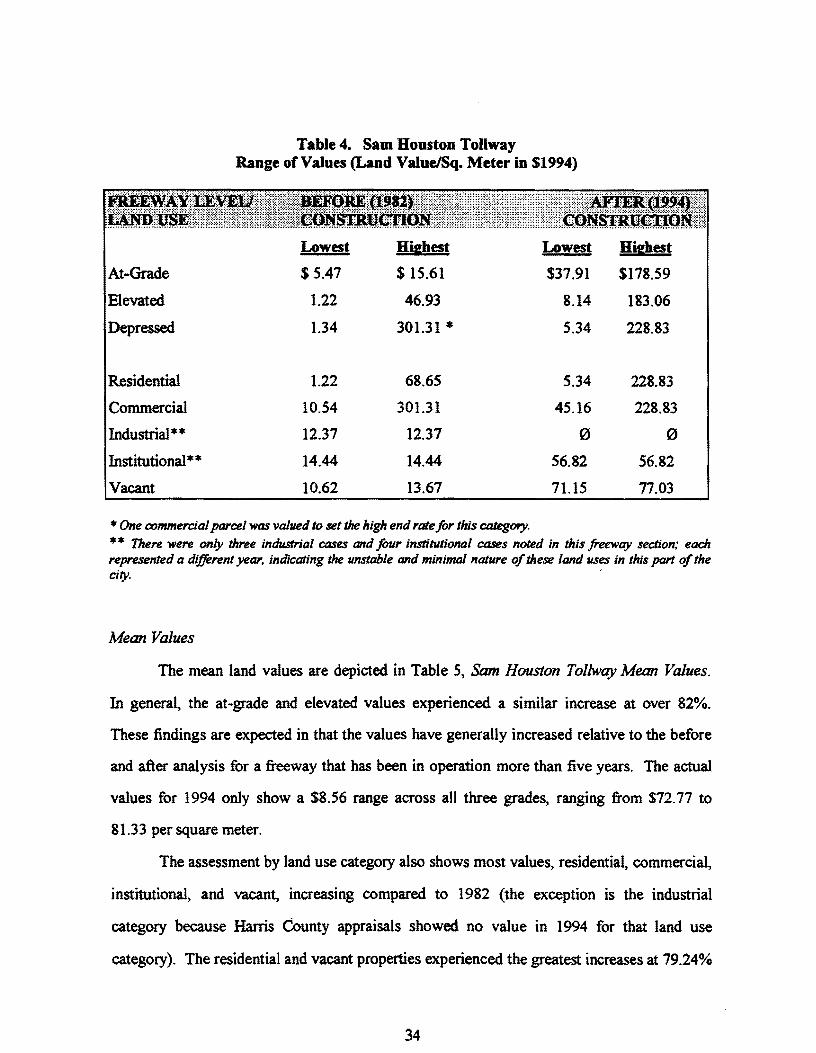
Table 4. Sam Houston Tollway Range of Values (Land Value/Sq. Meter in $1994)
At-Grade
Elevated
Depressed
Residential
Commercial
Industrial**
Institutional**
Vacant
Lowest
$ 5.47
1.22
1.34
1.22
10.54
12.37
14.44
10.62
Highest
$ 15.61
46.93
301.31 *
68.65
301.31
12.37
14.44
13.67
*One commercial parcel was valued to set the high end rate for this category.
Lowest
$37.91
8.14
5.34
5.34
45.16
0
56.82
71.15
Highest
$178.59
183.06
228.83
228.83
228.83
0
56.82
77.03
* * There were only three industrial cases and f<mr institutional cases noted in this freeway section; each represented a different year, indicating the unstable and minimal naJure of these land uses in this part of the cit}'. ·
Mean Values
The mean land values are depicted in Table 5, Sam Houston Tollway Mean Values.
In general, the at-grade and elevated values experienced a similar increase at over 82%.
These findings are expected in that the values have generally increased relative to the before
and after analysis for a freeway that has been in operation more than five years. The actual
values for 1994 only show a $8.56 range across aJl three grades, ranging from $72. 77 to
81.33 per square meter.
The assessment by land use category also shows most values, residential, commercial,
institutional, and vacant, increasing compared to 1982 (the exception is the industrial
category because Harris County appraisals showed no value in 1994 for that land use
category). The residential and vacant properties experienced the greatest increases at 79.24%
34
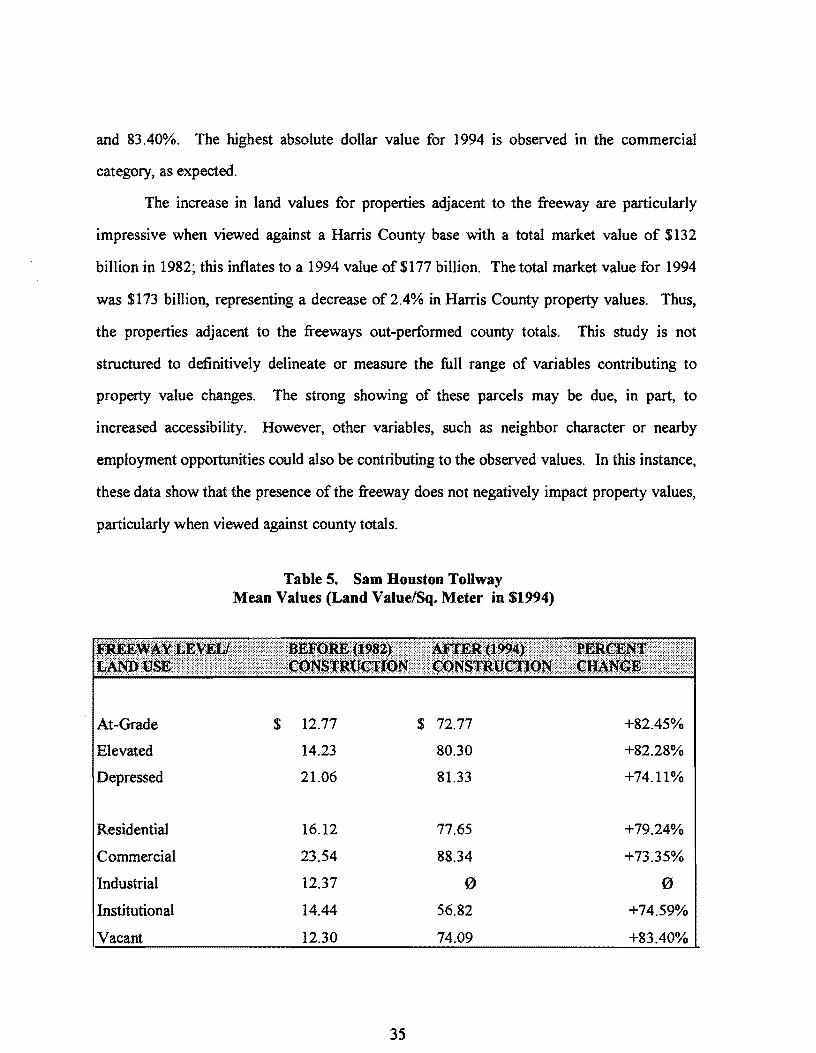
and 83.40%. The highest absolute dollar value for 1994 is observed in the commercial
category, as expected.
The increase in land values for properties adjacent to the freeway are particularly
impressive when viewed against a Harris County base with a total market value of $132
billion in 1982; this inflates to a 1994 value of $177 billion. The total market value for 1994
was $173 billion, representing a decrease of 2.4% in Harris County property values. Thus,
the properties adjacent to the freeways out-performed county totals. This study is not
structured to definitively delineate or measure the full range of variables contributing to
property value changes. The strong showing of these parcels may be due, in part, to
increased accessibility. However, other variables, such as neighbor character or nearby
employment opportunities could also be contributing to the observed values. In this instance,
these data show that the presence of the freeway does not negatively impact property values,
particularly when viewed against county totals.
Table 5. Sam Houston Tollway Mean Values (Land Value/Sq. Meter in $1994)
At-Grade $ 12.77 $ 72.77 +82.45%
Elevated 14.23 80.30 +82.28%
Depressed 21.06 81.33 +74.11%
Residential 16.12 77.65 +79.24%
Commercial 23.54 88.34 +73.35%
Industrial 12.37 0 0
Institutional 14.44 56.82 +74.59%
Vacant 12.30 74.09 +83.40%
35
SANANTONIO
San Antonio is located in the southern portion of the state, roughly 240 km (150 mi)
from the Mexican border, and the influence of Hispanic culture is a strong contributor to the
city's character. Of the city's total population, more than half possess Spanish surnames or
are Spanish speaking. The city is known for its abundance of military bases, including Kelly,
Randolph, Lackland, Brooks, Ft. Sam Houston, and Camp Bullis, which are major
contributors to the local economy. In the last two decades, the city's population has
increased 37.5% to 800,000 compared to the county's population increase of 3.2%. The
growth is consistent with the national trend that indicates population increases in the south
and western United States. The state of Texas is noted as one of the five fastest growing
states in the Union. These increases have intensified the number of automobiles on the road.
The San Antonio area is served by several radial freeways and two circumferential loops.
Study Area Description
Two freeway sections were assessed in San Antonio, a combination of 1-35 and 1-10,
which is referred to as the "Y11, and U.S. 281 in suburban San Antonio. The south end of the
"Y" is adjacent to downtown near the established commercial, industrial, and residential core.
Included in the area are breweries, multi-story banks, a medical complex, churches, a large
apartment complex, and commercial offices. Recreation in the area is focused on the city
parks and other public spaces. Columbus Park has been renovated and is well used by many
of the adjacent neighborhoods. There are also some recently landscaped areas along San
Pedro Creek. Major streets in the area from east to west are the north-south arterials of
Broadway, McCullough, Main, San Pedro, Flores, and Zarzamora. The major east-west
arterials are Houston, Commerce, Buena Vista, Martin, and Fredericksburg Road running in
a northwesterly-southeasterly direction. The streets and freeways reflect aged construction.
They tend to be narrower and lack a grid system that is considered more desirable in an urban
area.
36
· Recreation in the area of the transportation corridor is limited mainly to city parks.
Columbus Park is centered around Boccie Courts housing complex and St. Francisco Di
Paola Church. This church was the religious and social center of San Antonio's Italian
community. The park has been rebuilt and enhanced and is well used by many of the
adjacent neighborhoods. There are also some areas along San Pedro Creek that have been
recently landscaped. The U.S. 281 freeway area was sparsely developed prior to the
construction of the freeway. Previously, the four-lane, divided urban highway had at-grade
crossings and was known as the McAllister Freeway. The area had pockets of typical
suburban single-family homes. Several churches were within one or two blocks of the
freeway. The area began to undergo rapid change as this research neared its conclusion.
Vacant parcels began to be developed info commercial tracts. The principal arteries around
U.S. 281 are Blanco, Bitters, Heimer, Redland Road, and Bulverde Avenue. Several
commercial and residential dwellings are on the west side of U.S. 281, from Bitters Road to
Loop 1604 through the towns of Hill Country Village and Hollywood Park.
Freeway Description
The "Y'' study section begins at 1-10 and Kings Highway and is principally elevated
(although a small segment is at-grade) to Fredericksburg; from Fredericksburg to Frio, the
freeway is double decked, with an elevated and a depressed section (Figure 12). Between
Frio and approaching the intersection with 1-10, the structure comes to grade, then rises to
elevated at the 1-10 I I-35 intersection. Continuing along the I-35 study section, the structure
is double decked for a segment until reaching Broadway. From that point, the structure is
primarily depressed to Walters, although some segments are at-grade.
Bitters Road to Loop 1604 set the limits for U.S. 281 in this research. The freeway is
principally at-grade from Bitters Road to Thousand Oaks; the structure is elevated at
Thousand Oaks, then descends to depressed to the study end at Loop 1604. The San Antonio
37
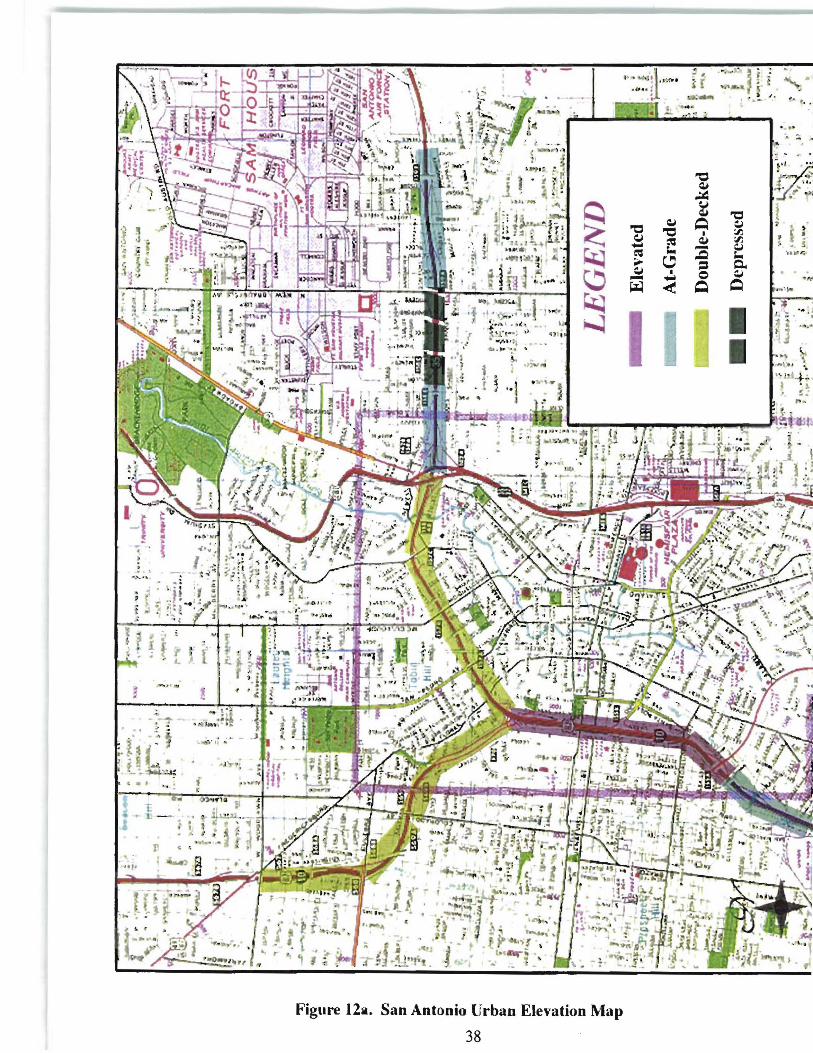
·' ~
~ .J
Figure 12a. San Antonio Urban Elevation l\.'lap
38
..
"Cl CJ -~ ~ ~ -~
. .•. :' ~
H -"Cl ~ ~
~ CJ ~ "Cl I
~ ~ . -... ~ ~ = I 0 .... < Q
J t • ll i•. . ' · .,,. .... ;
._ .... ·. ::;
.~
' -
~ . "Cl i ~ :- : 'JJ 'JJ •, .5 CJ :.. ... ... 0. :.,i
11\'' Q
I ·" .. :.'
o l
I
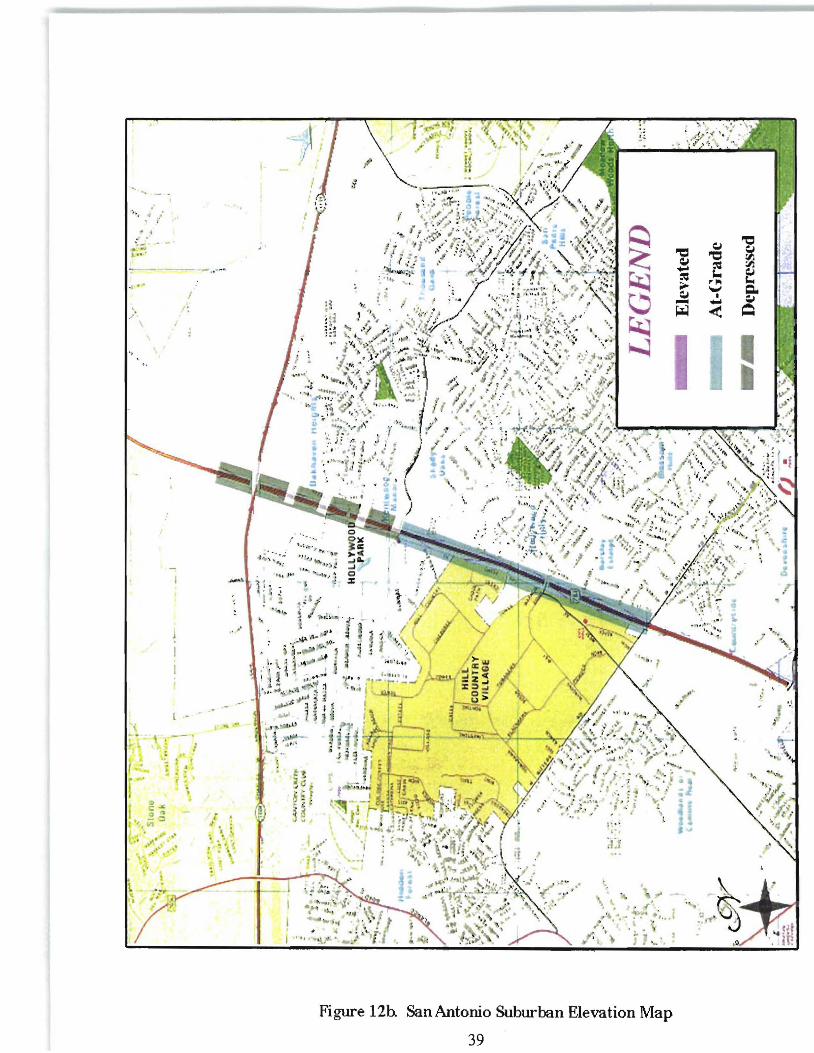
' . ·•• .. Ifft
.·. ~-;.; · .. .
· l ••
. /
"
i
....=;:;=-: - •• - .. ,
I / :
' ,.
, . : ' ~ ' .
.... •.
~ ~ ~ ~
·">•~ . .. ,. ' ·~ .
'·· ~
Figure 12h SanAntonio Suburban Elevation Map
39
"C '-I ~ ~ ... :J -~
,J ...
'-I "C '-I
"C ~ ::: I. ~ r~ ._, c.. I :J ~
< = I
control sections are along U.S. 281 north of Thousand Oaks to L1604 and between Walters
and Broadway, a distance of2.25 km (1.4 mi).
Socio-Economic Assessment
In San Antonio, a comparison was made between the city baseline, and the urban (1-
35 I 1-10) and suburban (U.S.281) study areas. In 1980, the suburban study area was so
sparsely populated it had a population density of less than one person per 2.6 km2 (1 mi2).
By 1990, the population density in the suburban study area had grown to 745 persons per
2.6 km2 (1 mi2), and city officials estimate this figure has continued to increase
dramatically since the 1990 data were reported. The population increased by 76% in the
suburban study area, while the increases in the urban study area and city baseline were
16 % each. The city experienced a decrease from 3 to 2. 8 in the average persons per
household category, while the urban study area remained constant at roughly 2.4 persons
per household in 1980 and 1990. The 1990 suburban study area persons per household
figure was also lower than the city's at 2.5 persons per household.
San Antonio experienced decreases in two of the three racial categories. From 1980
to 1990, the categories African-Americans and White/Other decreased as a percentage of
the entire population by almost 7% and 4%, respectively, while the Hispanic racial group
experienced an increase in their proportion of the population of 3 % . Despite the decreases
noted in percentage tenns, the number in each ethnic group increased in the urban study
area. For instance, in 1980, census tracts of the urban study area show that the groups
White/Other and African-Americans had less than 400 people, but by 1990, the African
American population had grown to over 5000 individuals, and those classified as
White/Other had increased to nearly 7000. The Hispanic racial group registered the
greatest increase, from roughly 11,000 in the urban area in 1980, to over 50,000 by 1990.
In the suburban study area, no ethnic groups were identified in the 1980 census; however,
40
by 1990 the group White/Other had a population of over 27,500, Hispani.cs numbered
6310, and African-Americans equaled 5(J7.
The vacancy rates for the city were 7% in 1980 but increased to over 10% by 1990.
The urban study area experienced a similar increase from 11 % to 14 % , while the suburban
study area experienced a dramatic decrease of 40% to approximately 7% in 1990. This
decrease can most likely be attributed to the building of new housing in the suburban study
area.
Land Use
The study section is characterized by a mix of land uses (Figure 13). The
southernmost land on the west side of the freeway, in the vicinity of South Laredo, is
somewhat under-developed compared to other portions of the study area. The east side is a
mix of stockyards, small retail, and light manufacturing. Moving north, the development on
the west side intensifies with motels, multi-family and single-family housing, commercial,
and institutional uses. Although many structures show signs of age and are not well
maintained, the west side of 1-35 I 1-10 has an area of newly constructed single-family
housing. From 1-10 and Fredericksburg Road to the 1-10I1-35 interchange, there are mainly
machinery manufacturers and wholesale distribution centers. Although a large area has been
cleared for future development, the section ofl-35 between its interchanges, with 1-10 on the
west and Broadway on the east, is primarily residential.
The housing in the areas adjacent to these transportation corridors is varied. Along 1-
35, between its interchange with 1-37 and U.S. 281 and the 1-10 connection to the south, are
older homes that at one time were spacious single-family dwellings. Many of these have
now been subdivided into multi-family units and rented out as apartments. Along 1-10, north
of its jointly designated section with 1-35, some of the single-family residences have been
well maintained.
41
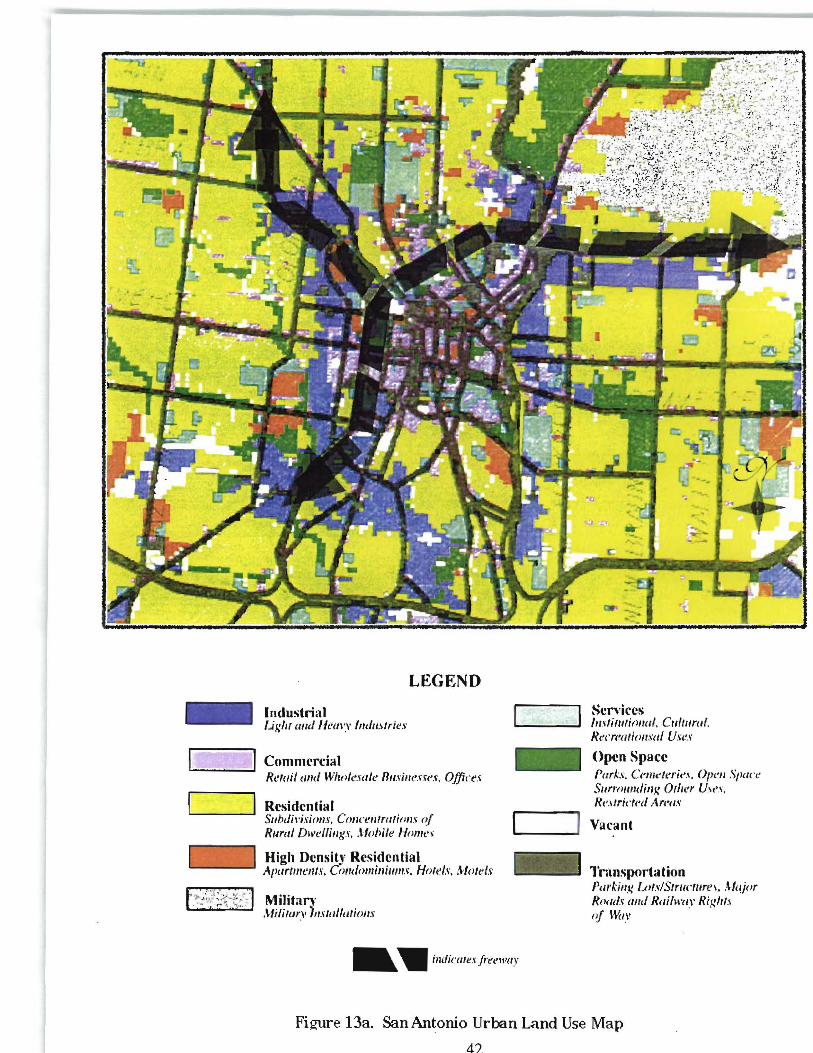
-LEGEND
Industrial /.iglir mu/ Neavy /11d11.11ries
Commercial Rc•tai/ mu/ \\l/10/e.mle R11.1·i1w.rn·s. Offic'es
Residential S11bdil'isiom, Co11ce11rratiom of Rural Dwellings . .\lohi/e f/ome ~
High Density Residential A.pe1rt111e111.1-. Cmui<>mi11i11111.~. Holt'l.1', ,\folds
Military .Wilitury 1mtallt11io11x
- • i11dicates freeway
Services /11sli1111/011al, C11f111ml. R11 creatim1.wi Uws
O(>(!n Space f>arks. Ce111c:rt1 ries. 011e1i S11cu ·1~ S11rro111uli11g Orher U1e1. Restricted Ar1•a.1·
Vacant
Transportation P1irki11g Lor.1'/Strucfllre1. lfojor Roads am/ Rail1n1r Rig/11.1 of \Vc1y
Figure 13a. San Antonio Urban Land Use Map
4?
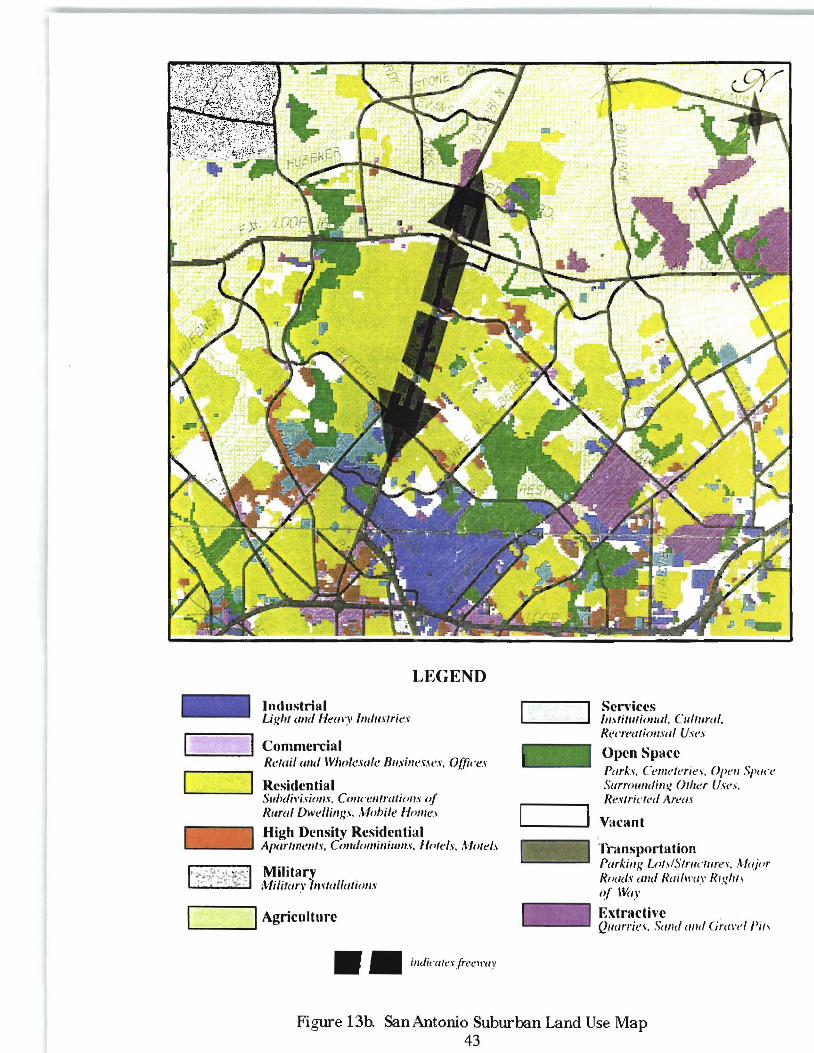
LEGEND
Industrial Light and Hemy /11d11.rtrieJ
Commercial Rt~tail a11d \Vilole.wle 811.\·i11e~.1c'l, Offin:.I'
Residential S11hdi1•iJiom, Co11ce11frctli<>1P.\' 'if Rural Dwl!!li11g.1', .\.lo/Jilt: Home.\
High Density Residential Apartments, Comlomir1i11111.\, Hotel.\". Mold.\·
• .,.;;t~.;i_ll~ · Military ' ... ~ · .- Alilitarv )m·te1lle1tio11.1·
.__ __ __.I Agriculture II'. indicak.~freeway
Sen ices lmtillltio1111/. C11ltrm1l. Re(TC'Cltionwl Uws
Open Space Porks, Cenle'lerie'" Open Sf>ll• '<' S11rm1111tli11g 01/ier Us<''· Re.1·trictecl Art:'(/.\'
Vacant
Transportation Porki11i; u11.,/Stmct11res . . .\IC1ior Road.I' <llld Roilll'e1y Rig/rt' of H'<q
Extracth·e . Q1wrrie.1, Semel cmcl Gnt\'e{ /'if\
Figure 13b. San Antonio Suburban Land Use Map 43

Land Value Assessment
The "throat" of the "Y" from the 1-10 I 1-35 intersection to Durango is largely
elevated, although the main lanes go into depressed sections to pass under major cross
streets. Bitters Road to Loop 1604 set the limits for U.S. 281 in this research. The freeway
is principally at-grade from Bitters Road to Thousand Oaks; the structure is elevated at
Thousand Oaks, then descends to depressed to the study end at Loop 1604. The review of
land value changes for U.S. 281 and 1-35 I 1-10 can be viewed against a background in
which total market values for Bexar County increased approximately 6.85% from $33.8
billion in 1983 ($ 1994) to $36.1 billion in 1994. When reviewing the property values, it
should be noted that the character of development is very different in the two San Antonio
study areas. The "Y'' is in the core urban area near downtown, while U.S. 281 is in a rapidly
growing suburb that was largely undeveloped in the early 1980s. The following sections
show the range of values for the two areas and then the mean values. The urban "Y''
assessment included 325 cases for each y~. Only eight valid properties existed for U.S. 281
in 1980, but the number of properties increased to 354 by 1990.
Range of Values
In the 1-35 I 1-10 area, the highest value at-grade increased for elevated and depressed
sections relative to 1983, while the lowest values all decreased. Both high and low end
values decreased for properties adjacent to the double decked section. Table 6 reflects the
land values per square meter for the double decked section before and after freeway
construction. When assessing the data by land use categories, note that the institutional
values increased materially; high end industrial also increased. Residential remained
essentially stable. The vacant and industrial properties decreased in value.
The section of U.S. 281 included in this research is either at-grade or depressed. The
at-grade property shows an increase in value because the accounts paralleling the freeway in
1994 were non-existent in 1983. The land was divided, and previous records were not
44
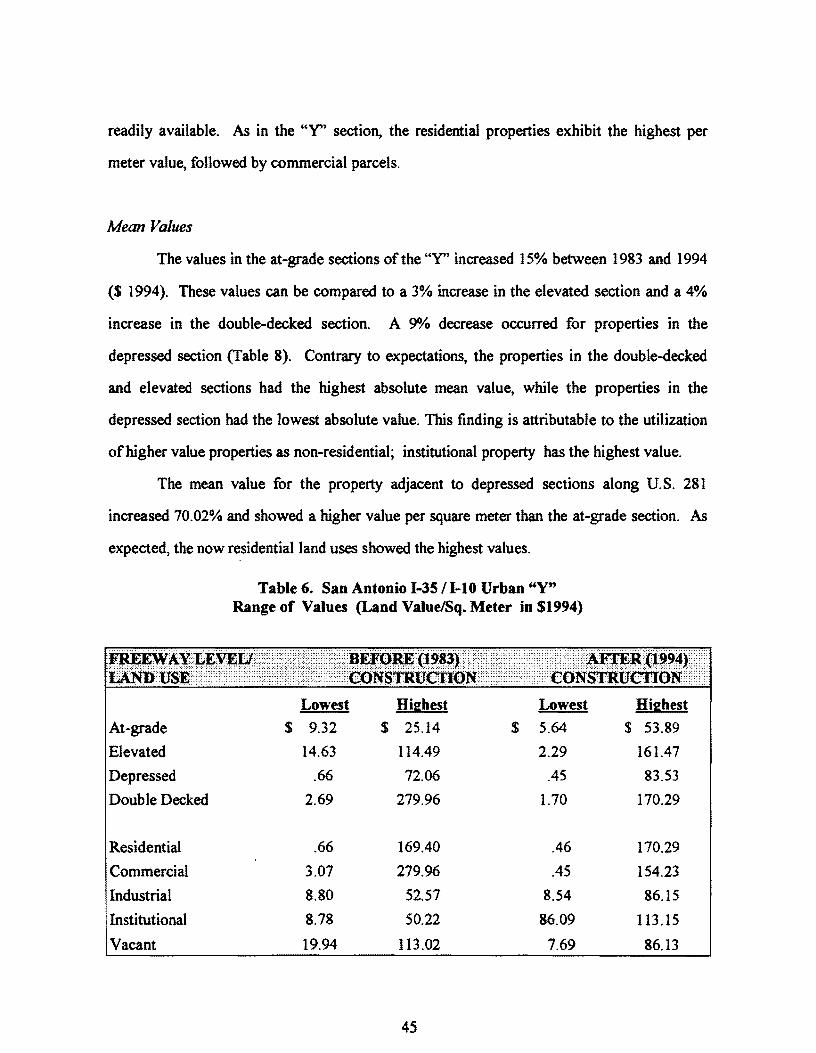
readily available. As in the "Y" section, the residential properties exhibit the highest per
meter value, foHowed by commercial parcels.
Mean Values
The values in the at-grade sections of the "Y" increased 15% between 1983 and 1994
($ 1994). These values can be compared to a 3% increase in the elevated section and a 4%
increase in the double-decked section. A 9°/o decrease occurred for properties in the
depressed section (Table 8). Contrary to expectations, the properties in the double-decked
and elevated sections had the highest absolute mean value, while the properties in the
depressed section had the lowest absolute value. This finding is attributable to the utilization
of higher value properties as non-residential; institutional property has the highest value.
The mean value for the property adjacent to depressed sections along U.S. 281
increased 70.02% and showed a higher value per square meter than the at-grade section. As
expected, the now residential land uses showed the highest values.
Table 6. San Antonio 1-35 /l-10 Urban "Y" Range of Values (Land Value/Sq. Meter in $1994)
~~t~tlit~PA••::WW'.l\lt'Wrnrn••::::·:~~~Q~'(!~~~): ... :•wt:;'::: :: ::::::::::·:•• •.• ,, f!AFlJER (19.941•····· :IA:Nn·usE ·· ... '"::•·:•·•··••··· ··::: •Hiti •:•mH· n•:mcossmumoN••m:u •:!•·!i!···•coN'SlltuettoNH·•!•!•
Lowest Hii:;hest Lowest Hi2hest
At-grade $ 9.32 $ 25.14 $ 5.64 $ 53.89
Elevated 14.63 114.49 2.29 161.47
Depressed .66 72.06 .45 83.53
Double Decked 2.69 279.96 1.70 170.29
Residential .66 169.40 .46 170.29
Commercial 3.07 279.96 .45 154.23
Industrial 8.80 52.57 8.54 86.15
Institutional 8.78 50.22 86.09 113.15
Vacant 19.94 113.02 7.69 86.13
45
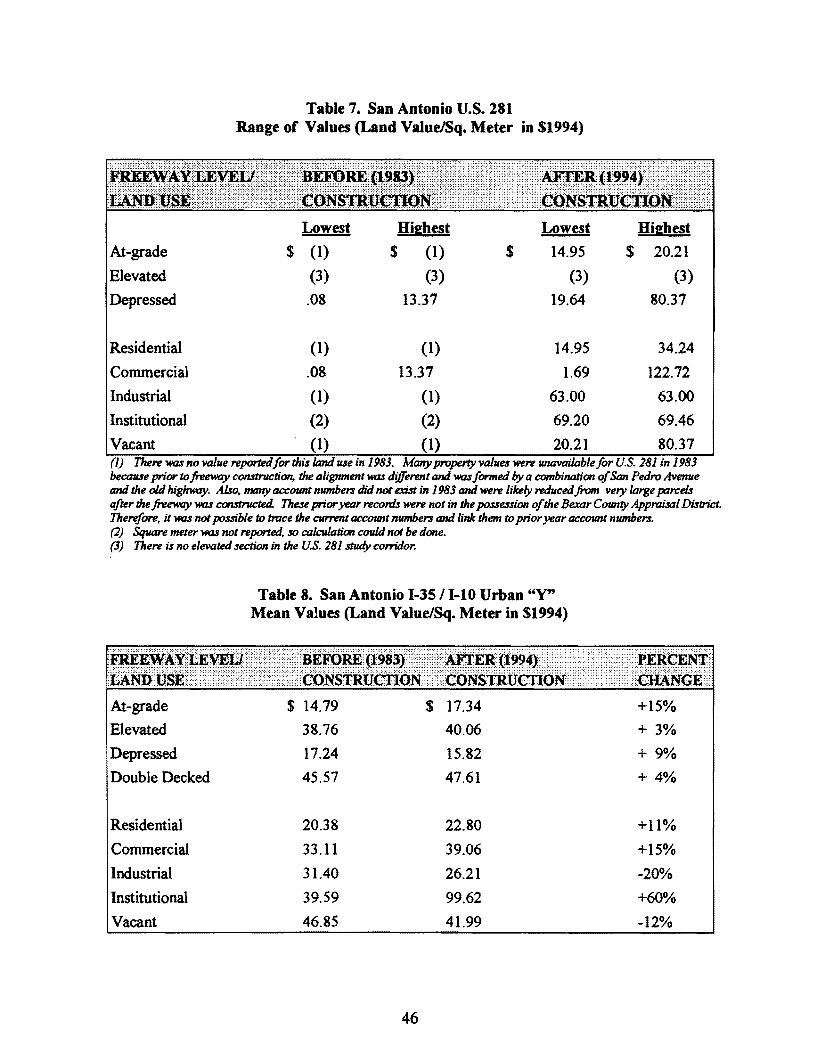
Table 7. San Antonio U.S. 281 Range of Values (Land Value/Sq. Meter in $1994)
Lowest Hi&hest Lowest Hi:hest
At-grade $ (1) $ (1) $ 14.95 $ 20.21
Elevated (3) (3) (3) (3)
Depressed .08 13.37 19.64 80.37
Residential (1) (1) 14.95 34.24
Commercial .08 13.37 1.69 122.72
Industrial (1) (I) 63.00 63.00
Institutional (2) (2) 69.20 69.46
Vacant (1) (1) 20.21 80.37 (1) There was no value reported for this land use in 1983. Many property values were unavailable for U.S. 281 in 1983 because prior to freeway construction, the alignment was different and was formed by a combination of San Pedro Avenue and the ol.d highway. Also, many account numben did not exist in 1983 and were likely reduced from very large parcels after the freeway was constructed. Thue prior year recorr/s were not in the possession of the Bexar County Appraisal District. Therefore, it was not possible to trace the current account numben and link them to prior year account numbers. (2) Square meter was not reported, so calculation could not be done. (3) There is no elevated section in the U.S. 281 study comdor.
Table 8. San Antonio 1-35/1-10 Urban "Y" Mean Values (Land Value/Sq. Meter in $1994)
At-grade $ 14.79 $ 17.34
Elevated 38.76 40.06
Depressed 17.24 15.82
Double Decked
Residential
Commercial
Industrial
Institutional
Vacant
45.57
20.38
33.11
31.40
39.59
46.85
46
47.61
22.80
39.06
26.21
99.62
41.99
+15%
+ 3%
+ 9%
+ 4%
+11%
+15%
-20%
+60%
-12%
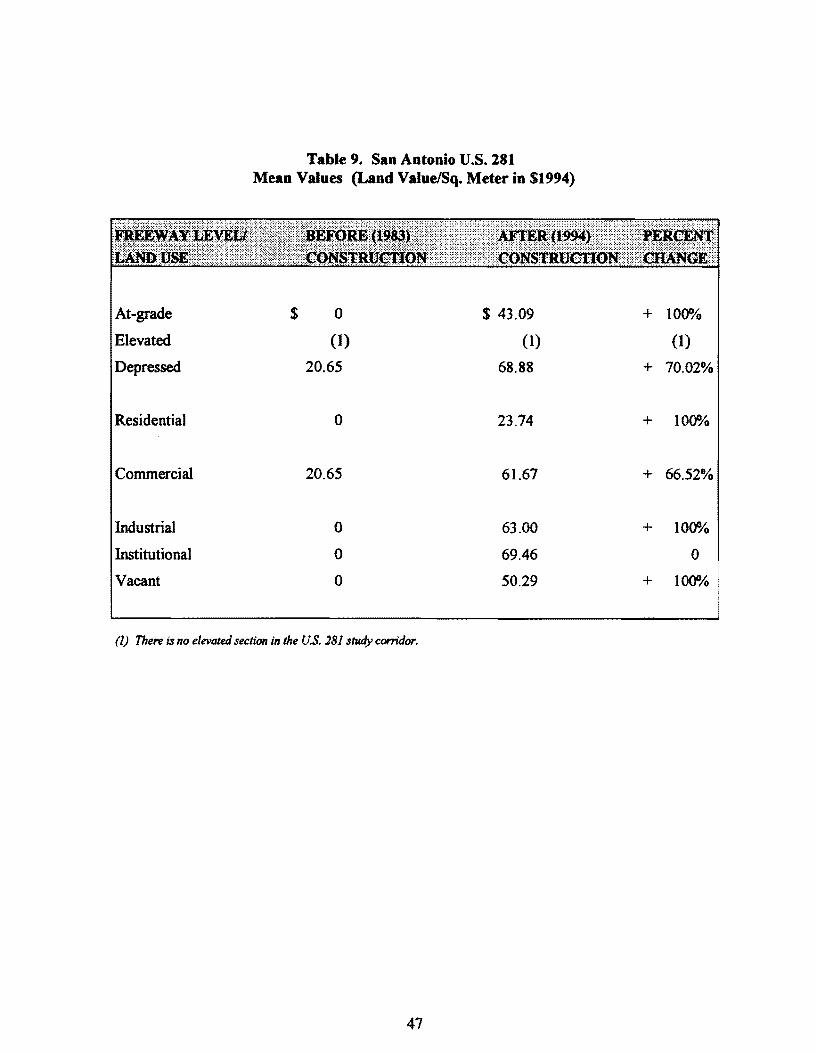
Table 9. San Antonio U.S. 281 Mean Values (Land Value/Sq. Meter in $1994)
At-grade $ 0 $ 43.09 + 1000/o
Elevated (1) (1) (1)
Depressed 20.65 68.88 + 70.02%
Residential 0 23.74 + 1000/o
Commercial 20.65 61.67 + 66.52%
Industrial 0 63.00 + 1000/o
Institutional 0 69.46 0
Vacant 0 50.29 + 1000/o
(1) There is no elevated section in the U.S. 181 study corridor.
47
LUBBOCK
Study Area Description
Lubbock is located in the center of a semi-arid geographic region known as the
Southern High Plains of the Texas Panhandle. Lubbock's terrain is relatively flat, with very
little natural slope. The only exception is the Y ellowhouse Canyon, which contains a tributary
of the Brazos River. A number of dry lakes dot the land surface, serving as natural drainage
and storage areas.
Lubbock has been known for many years as the "Hub City" of the South Plains since it
is the major distribution center for the region. The city is surrounded by vast amounts of rich
agricultural land. Agricultural products and related industries contribute a large portion of
the city's economic base.
The existing traffic distribution system within Lubbock consists of primarily a north
south, east-west grid pattern with major thoroughfares located at 1.6 km (1 mi) intervals.
Three major U.S. highways serve the city: U.S. 62 and U.S. 82, running east and west; U.S.
84 traveling northwest to southeast; and 1-27, with a north-south alignment. The Central
Business District in Lubbock has been slowly changing from a retail district to a center for
financial institutions, governmental offices, and professional office space. There are currently
no high-speed, large-volume transportation facilities serving the Central Business District
from the east or west. City officials considered the absence of such a facility as a deterrent
for downtown redevelopment, since safe and efficient access to and from the Central Business
District is essential to continuing vitality and growth. The reconstruction and upgrading of
U.S. 62 / 82 into a major freeway is planned to address this deficiency.
Approximately 12% of the Lubbock work force is employed in the Central Business
District, while present commercial and residential growth trends are to the south and
southwest. As these suburban areas continue to grow, 1-27 will become increasingly
important for travel to and from the core urban area. The opening ofl-27 has reduced travel
time for trips between the Central Business District and outlying areas of the city.
48
Two freeway sections are included in this study for Lubbock, I-27 and the proposed
U.S. 62 I 82. The I-27 corridor became operational in 1992, and U.S. 62 I 82 freeway was
announced in July 1995. Right-of-way purchase is currently underway for U.S. 62 I 82; thus,
the review of land values paralleling this corridor reflect the values from the mid-l 980s
compared to pending announcement of freeway construction and initial right-of-way
acquisition. When this study was initiated, the researchers anticipated that U.S. 62 I 82
would be in construction and would reflect land value responses immediately after right-of
way acquisition. However, the construction has not proceeded as rapidly as expected, and
only a partial land acquisition has occurred. The data presented in this section regarding
Lubbock U.S. 62 I 82 should be viewed from that perspective. Also, as in each of the other
study corridors, the unique social and economic conditions of Lubbock also affect the land
value.
Freeway Descriptions
The review of the I-27 freeway begins at Loop 289 North and extends south to l 14th
Street. From the northern limit at Loop 289, the structure is elevated to 38th Street. From
38th Street to slightly south of 66th Street, the freeway is depressed. After crossing over
Loop 289 South, the structure comes to grade and is at-grade to ll4th Street. A short
section of Loop 289 West was included to strengthen the at-grade control sections. The
maximum traffic volume is slightly north of the 1-27 intersection, with South Loop 289 at
52,000 vehicles daily.
Because the right-of-way for U.S. 62 I 82 is currently being purchased, the route for
the future freeway will be descnoed. The southwestern extent of the study area is defined by
the Lubbock city limit, which is roughly at Milwaukee Avenue. The freeway will continue in a
northeasterly direction paralleling U.S. 62 I 82, alternately named Brownfield Road. The
freeway will cross the downtown area along 4th Street; the research for this study ends at the
western edge of MacKenzie State Park (Figure 14).
49
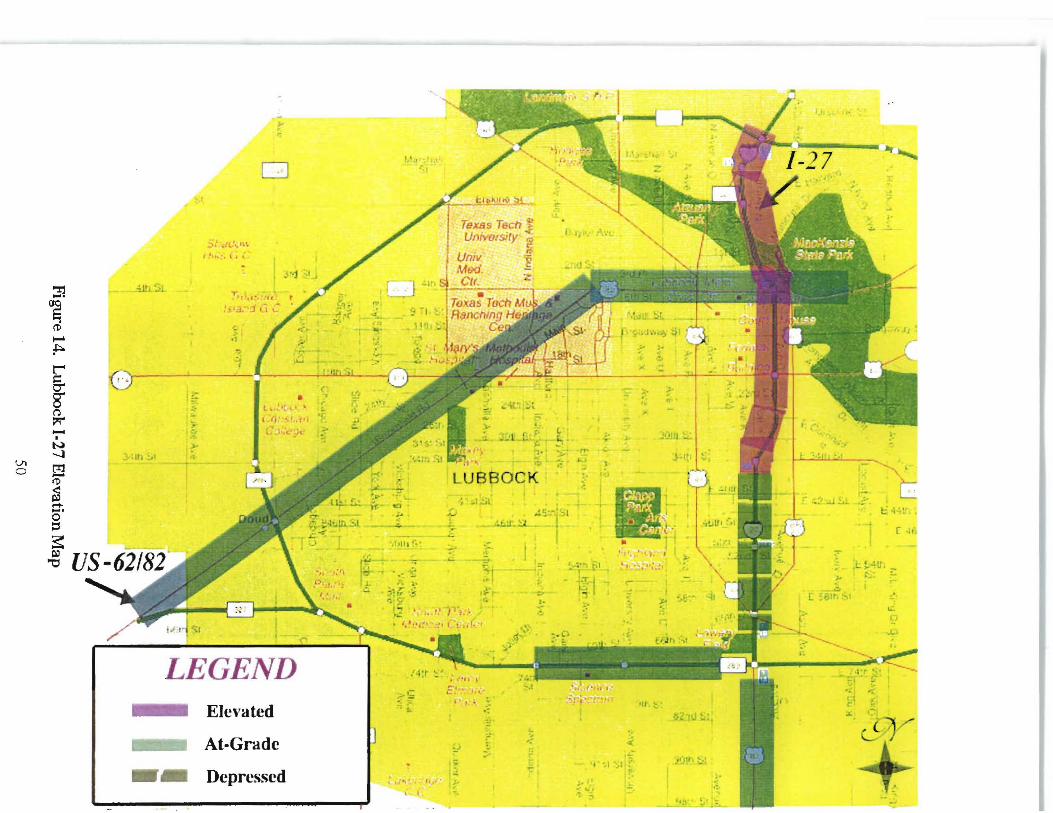
" .
_, .. j
::1
~ -:.ttl .JJ.
1•, It
"' J JI J
<t> I-' •I
~
r ., l • §.
8" (') ::i;"
• !_ ~ ' I
I (1 - ._- '" I
t..,) ---1
Vl ~ 0
tr ....
(!>
~ ... .... 0 ::s ., s: ,, .. i:a:i
""O ... ·. ;.. -::-··fr .,,
.-·~
Elc\'ated
At-Grade --- Depressed
~~l l L.
L UBBOCK
-· ·. .!.J
.· ".;.,
-;. I•
,. /J ••
.,·,
c ' - ,
·:
.: . ~
t ... ·:.-
"'
:r ,-
: .:.
;.
•II
I -
:-
I}~
t 1 ·1' ...
.:, i l
·-
...
i • • - ,..··\
L
r ..
.-
c_()
Socio-Economic Assessment
Many of the census tracts for the Lubbock study areas, 1-27 and U.S. 62 I 82
(which is in the land acquisition phase) are in common. Thus, the study area reference is
for both freeways. In Lubbock, the city population increased by 6.5%, while the average
persons per household decreased from 2. 7 to 2.6 persons per household. In contrast, the
study area experienced a 9% decrease in population and a decrease in average persons per
household of 3.3 in 1980 to 3.1 in 1990. The study area also experienced an increase of
11 % in vacancy rates during the period 1980 to 1990, compared to the nearly 18%
increase for the city as a whole. Lubbock, as a whole, experienced increases in two of the
three racial categories: Hispanics (16%) and African-Americans (3%). The group
White/Other increased in raw numbers by almost 1700, but as a percentage of the entire
city population, this group decreased by almost 6%. However, the racial mix in the study
area did not follow the city pattern: African-Americans decreased by 75 % ; Hispanics
increased (26%) as did White/Other (9.5%).
Land Use
Land use within the 1-27 corridor is now urban in character. Statistics indicate a
continual overall decrease in residential habitation and a transition to commercial development
within the corridor. This corridor also includes industrial uses. In fact, most motor freight
terminals in Lubbock are located within .8 km (.5 mi) of the corridor. These freight terminals
along with other industrial uses parallel both sides of I-27 near its northern terminus with
Loop 289 North. Continuing south, public use and park areas border the freeway to slightly
south of Parkway Drive. A small single family residential neighborhood is contiguous to the
west side of the freeway and adjacent to the Parkway, while public space is designated south
of the Parkway on the east. Continuing south, industrial and commercial properties border
both sides of the freeway to approximately 46th Street, although a small residential area
interrupts that flow on the east side at approximately 35th Street. From that point to U.S. 84
51
and U.S. 87, the predominant land use is residential. Commercial and industrial uses begin
and continue to south of Loop 289 South. Residential and commercial properties make up the
study corridor to 114th Street. Property adjacent to U.S. 62 I 82 corridor is primarily
commercial and industrial, with single family residential neighborhoods behind the commercial
and industrial frontage, from its southern boundary to 18th Street. The corridor passes
through Texas Tech University, crossing downtown at 4th Street, and ends at Parkway Drive
(Figure 14).
Land Value Assessment
This research examined more than 250 properties along 1-27 and 272 properties
adjacent to U.S. 62 / 82. Approximately 60% of the properties along 1-27 are residential; 33%
are commercial, and 5% industrial. The parcels are evenly distributed with 33% each at
grade, elevated, and depressed. The 1-27 freeway has been operational since 1992 and has not
yet matured. Thus, overall. land values have not returned to pre-construction levels. Further,
the overall market conditions for Lubbock may not have been optimal for redevelopment.
Total market value for all Lubbock properties was unavailable for 1987, so pure comparison
of values for the study corridor against the citywide base cannot be made. However, the total
market values were available for 1988 and were $4.8 billion (which inflates to $6.7 billion in
$1990) and $4. 9 billion in 1990. It can be seen that values for this brief period reflect
probably declining, and at best, stable values for the city of Lubbock overall.
52
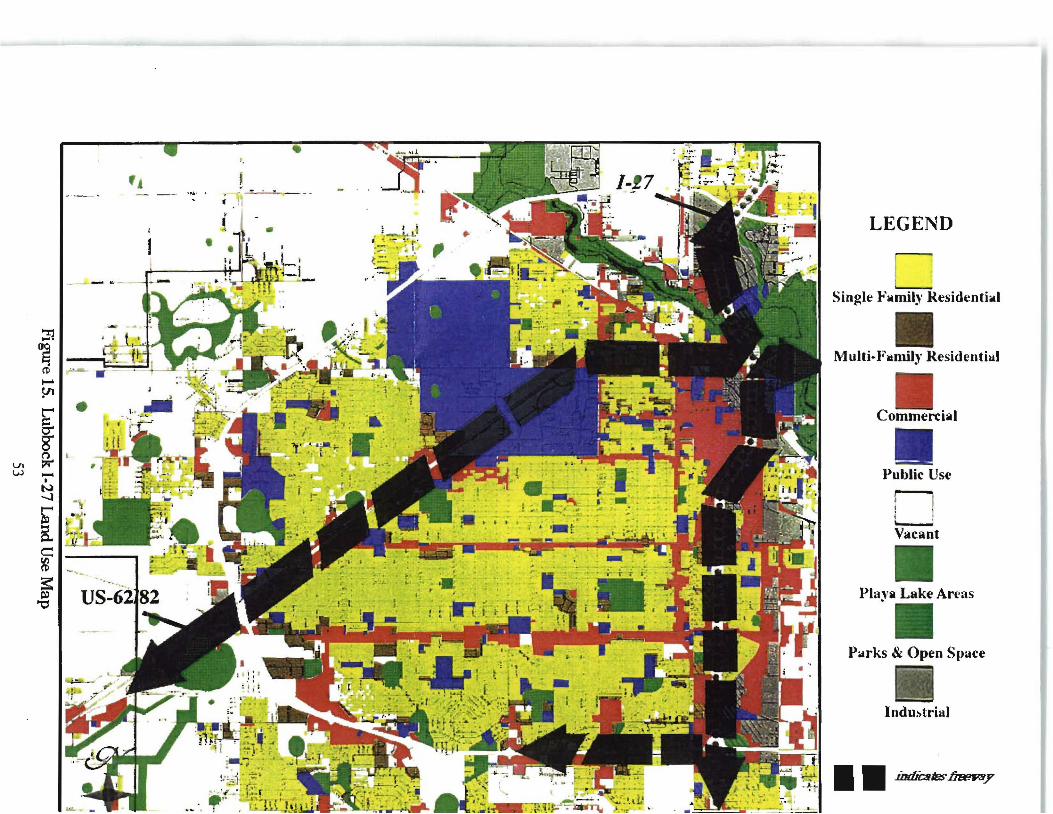
• f j J
. ~ ...::;..- ........ .___
f • •
:::1 ~
ct> ...... YI rl • ~
~ (')
Vl :ii;-\,;.)
LEGEND
.....____. Single FwmilJ Residenthal
Multi-.F~muly Residentiul
Commercial
Public Use
n ~ Vacant
PlaJa Lake Arl'as
P~rks & Open Space
lndu~trial
111 .iDtlicas~y
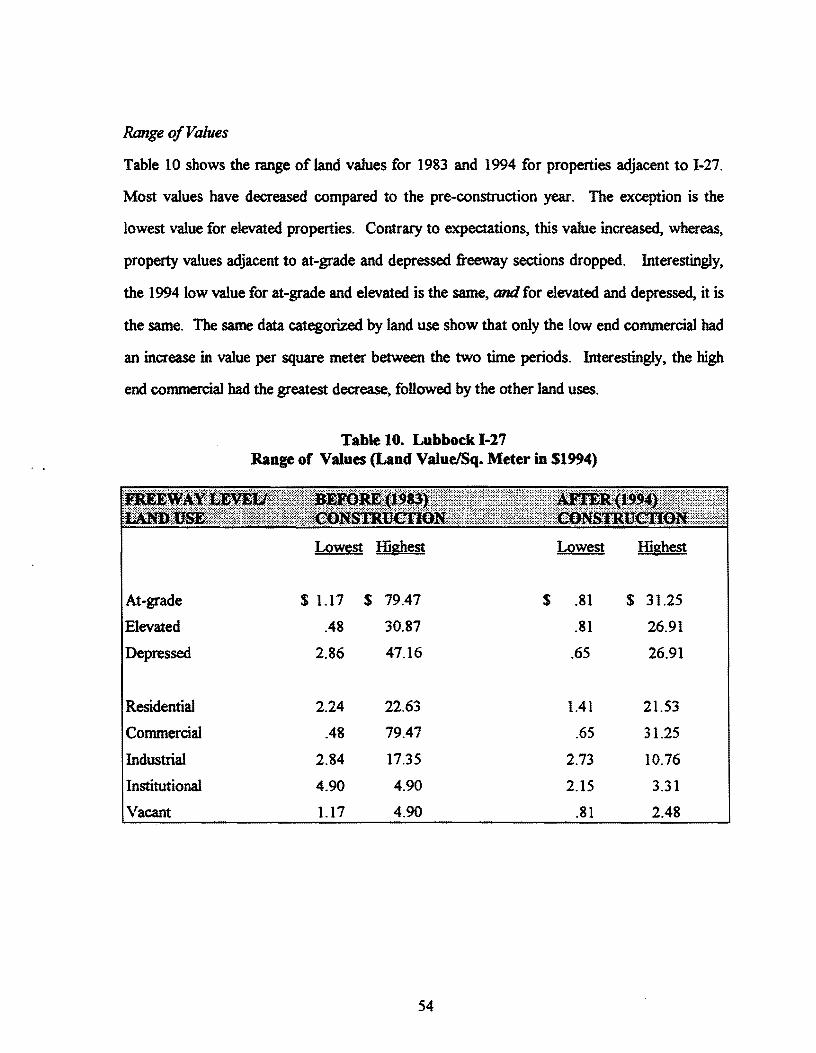
Range of Values
Table 10 shows the range ofland values for 1983 and 1994 for properties adjacent to 1-27.
Most values have decreased compared to the pre-construction year. The exception is the
lowest value for elevated properties. Contrary to expectations, this value increased, whereas,
property values adjacent to at-grade and depressed freeway sections dropped. Interestingly,
the 1994 low value for at-grade and elevated is the same, and for elevated and depressed, it is
the same. The same data categorized by land use show that only the low end commercial had
an increase in value per square meter between the two time periods. Interestingly, the high
end commercial had the greatest decrease, followed by the other land uses.
Table 10. Lubbock 1-27 Range of Values (Land Value/Sq. Meter in $1994)
Lowest Highest Lowest Highest
At-grade $ 1.17 $ 79.47 $ .81 $ 31.25
Elevated .48 30.87 .81 26.91
Depressed 2.86 47.16 .65 26.91
Residential 2.24 22.63 1.41 21.53
Commercial .48 79.47 .65 31.25
Industrial 2.84 17.35 2.73 10.76
Institutional 4.90 4.90 2.15 3.31
Vacant 1.17 4.90 .81 2.48
54
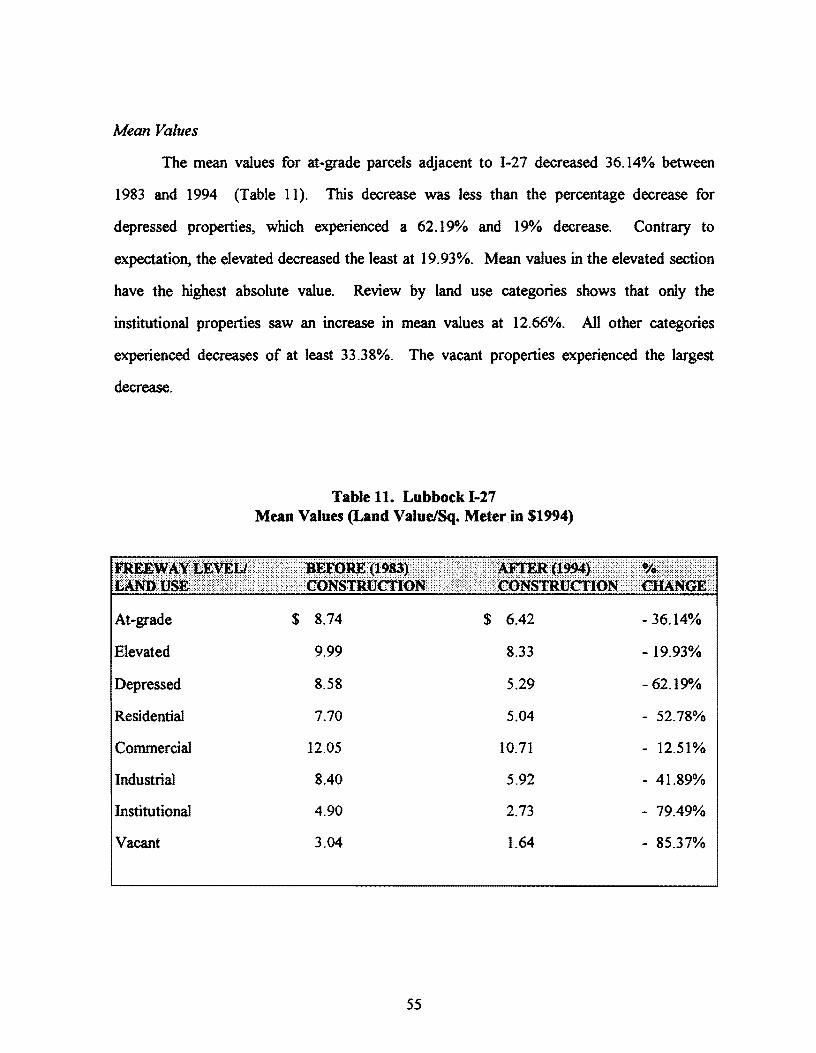
Mean Values
The mean values for at-grade parcels adjacent to 1-27 decreased 36.14% between
1983 and 1994 (Table 11). This decrease was less than the percentage decrease for
depressed properties, which experienced a 62.19% and 19% decrease. Contrary to
expectation, the elevated decreased the least at 19.93%. Mean values in the elevated section
have the highest absolute value. Review by land use categories shows that only the
institutional properties saw an increase in mean values at 12.66%. All other categories
experienced decreases of at least 33 .38%. The vacant properties experienced the largest
decrease.
Table 11. Lubbock 1-27 Mean Values (Land Value/Sq. Meter in $1994)
At-grade $ 8.74 $ 6.42 -36.14%
Elevated 9.99 8.33 -19.93%
Depressed 8.58 5.29 -62.19%
Residential 7.70 5.04 - 52.78%
Commercial 12.05 10.71 - 12.51%
Industrial 8.40 5.92 - 41.89%
Institutional 4.90 2.73 - 79.49%
Vacant 3.04 1.64 - 85.37%
55
U.S. 62182
The analysis for property along U.S. 62 I 82 shows the value before activity began for
freeway construction compared to any changes in value while right-of-way is being purchased.
Please recall that the official notification was provided in July 1995. Therefore, data
collection focused on 1987 and 1996 land values. At this point, the highway is at-grade. The
mean value shows a decreasing trend for the corridor between 1987 and 1996, falling 17.14%
per square meter. Because Lubbock represents one city in the early right-of-way purchasing
stage, generalizations about land value responses to this stage of construction are not made.
A larger data base including additional cities, preferably further into the acquisition process,
would provide a more extensive and reliable data base. Even then, the assessment of land
values in the right-of-way acquisition stage will be subject to varying project scheduling
streams. For instance, construction may begin for some projects while acquisition is
continuing. Others, as this Lubbock freeway, may proceed very slowly, with the acquisition
occurring over years. Depending on the construction staging plan, it may be appropriate to
consider right-of-way and construction land values as one stage.
Multi-Year Analysis
A master's thesis conducted as a part of this research analyzed the I-27 corridor on a
more extensive multi-year data set covering 1983-1994. The findings from this work are
consistent with the assessments in the previous section, although some increases in value were
observed during brief periods within the ten years. Overall however, mean values of property
adjacent to the elevated section declined steadily over the entire study period. Property
adjacent to the depressed section had periods of decline from 1983-1986, stabilization from
1987-1990, and decline from 1990-1994. Commercial property adjacent to the at-grade
section was stable from 1983 to 1990, rose from that time to 1993, and declined over the next
year. For residential land at-grade, values increased slightly from 1983 to 1985, decreased in
1986, then remained stable to 1991. Residential properties adjacent to depressed sections
56
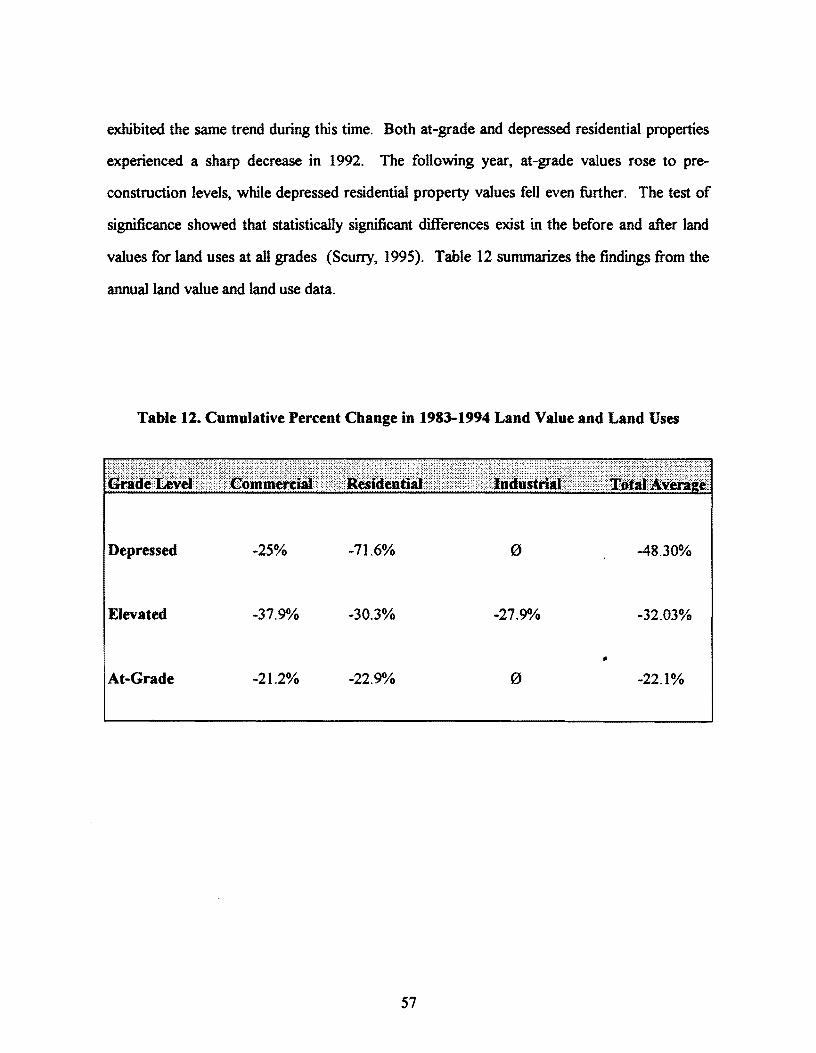
exhibited the same trend during this time. Both at-grade and depressed residential properties
experienced a sharp decrease in 1992. The following year, at-grade values rose to pre
construction levels, while depressed residential property values fell even further. The test of
significance showed that statistically significant differences exist in the before and after land
values for land uses at all grades (Scurry, 1995). Table 12 summarizes the findings from the
annual land value and land use data.
Table 12. Cumulative Percent Change in 1983-1994 Land Value and Land Uses
trr~:Hn~H~t/~:j,~;j:~:~:t~.j ::}:~@nn~rrHm.r ~~{:rn~:~{:i i:~:::::::::: j ;,~'1 !:~:~.~:~:::~:~})):~;::::: ::::::::~::·:.:: :. : : : = j{.i:~:~:~ : = = =: :.:.:: ~: :·:: :::::.:::.:·:::::.:.: :·: ;:; : : : : : · · • · : ..... : ··.-.'. · = · · · · .·.·.·.·.· ... :: :.:.::: :Y.:: :.: : :~):~:~~rti=i=l~~=}f tH~~ri~~r:~:~{.rr~+~nt
cilai:Dia1m~::::::1:it7tiffi~~tit1 ~-:=:::i:::1tl11~it1il:!iil:::=i.ii1!1!'"ti::·:;i~a~~t1~l11::~,\~~:[!\\i;;::matilllv~i~1
Depressed -25% -71.6% 0 -48.30%
Elevated -37.9°/o -30.3% -27.9°/o -32.03%
• At-Grade -21.2% -22.9°/o 0 -22.lo/o
57
DALLAS
Study Area Description
This study examines the area adjacent to the reconstruction of U.S. 75 (North Central
Expressway) from downtown to I-635 (Lyndon B. Johnson Freeway) in Dallas, Texas. The
project corridor is approximately 14.7 km (9.2 mi) long and extends from just north of the
Dallas Central Business District (CBD) through Highland Park and University Park to just
south of Richardson. This corridor varies from those previously examined in that it is in the
midst of reconstruction. Completion is anticipated in the year 2000, and consequently, it is
important to note that all land value data reflect this transitional state.
Pressure is expected on land values as a result of the freeway construction. However,
the reconstructed freeway is expected to help stimulate the continued revitalization of the
Dallas CBD because of the improved radial access.
The existing North Central Expressway project corridor is in a period of emerging
trends and economic activity. During the last several years, the expressway's residential areas
have been under transitional pressures. Redevelopment pressure from high-rise offices, retail
centers, and large scale regional activity centers has caused some significant changes along the
corridor.
The population growth within the expressway corridor is not expected to keep pace
with the city of Dallas. The cities of Richardson and Plano have been the fastest growing
areas in the study area, with respect to population. In summary, population trends within the
project area are expected to remain stabilized, with low nominal annual increases. It should
also be noted that the cities of Dallas, Highland Park, University Park, Richardson, and Plano
represent over 35 % of the population in the urban area, which includes all of Dallas and
Tarrant counties as well as portions of Denton, Collin, Rockwell, Kaufinan, Ellis, Johnson,
and Parker counties.
58
Daily traffic volumes are among the highest in the state at 179,000 vehicles slightly
north of Spur 366, 154,000 slightly south of Loop 12, and 126,000 .4 km (1/4 mi) south of
Loop 635 (1995 Annual ADT).
Freeway Description
The study area is bounded on the south by the intersection of U.S. 75 and Spur 366;
from this point to just prior to Haskell, the structure is elevated. The freeway descends
traveling under Haskell. Also, from Mockingbird to Park Lane, the freeway is principally
depressed; from Park Lane to the northern terminus at I-635, the structure is principally at
grade but rises on approach to major streets and is elevated over cross streets (Figure 16).
This latter section serves as the control for comparison purposes.
Socio-Economic Assessment
Between 1980 and 1990, the population for the city of Dallas increased by 10%,
and the average persons per household remained constant at a ratio of 2.5. The population
and average persons per household for the North Central Expresc;way study area increased
by 18% and 3%, which is more than the city as a whole. Further, there was a significant
increase of 32 % in the study area's population density. Dallas experienced a 34 % increase
in vacancy rates, from 7% in 1980 to 11 % in 1990. Conversely, the vacancy rates in the
study area decreased 15%, from 13% to 11 % during the same period. Unlike Houston,
the city of Dallas and its study area experienced little change in the population of African
Americans. In actuality, the city baseline remained essentially stable, decreasing by 1 % .
The Hispanic population increased in the city by 41 % and in the study area by 38%, while
the White/Other racial category decreased by 17% and 14 % for the city and study area.
The average range of median household annual income along the North Central
Expressway corridor is between $10,000 and $50,000. In the southern project area around
59
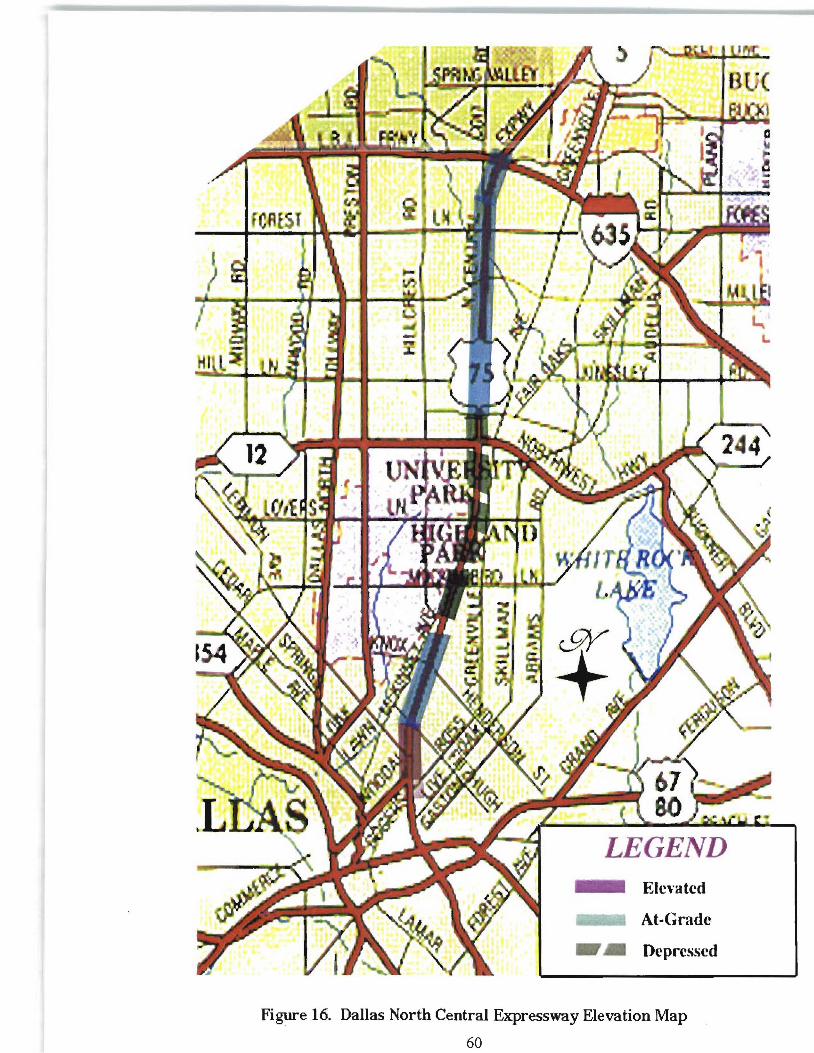
, ... .... . I . •.
Elcl·atcd
At-Grade
• • Depressed
Figure 16. Dallas North Central Expressway Elevation Map
60
Roseland Homes, the median household income is less than $10,000 a year, while in the Park
Cities and "M Streets," the annual income ranges between $30,000 and $50,00o+. North of
Northwest Highway, annual median household income ranges from $10,000 to $50,00o+,
with the higher income household typically on the west side of the expressway.
Land Use
Land use along the project corridor varies from light industrial in the northern end to
residential, retail/commercial, and park facilities spread along the length of the corridor. The
industrial sites are found at the northern end of the corridor by Forest Lane and the Lyndon B.
Johnson Freeway. Although the corridor lies within a highly developed retail, commercial,
and residential area of Dallas County, adjacent areas also include significant recreational and
institutional use.
The commercial sites include auto-oriented retail, shopping centers, single-office
buildings and office parks, and several hotels/motels. The frontage of the North Central
Expressway has almost 1.1 million m2 {12 million ft:2) of office space existing or under
construction and .23 million m2 (.5 million ft2) of existing retail space. The project area north
of Mockingbird Lane has the most recently developed portions of the corridor, and this area
reflects a decidedly different land use mix than the southern area. The primary structures
along the expressway in this area are high-rise office towers and large commercial and retail
structures, such as the Northpark Mall. Set back from the fronting structures are large multi
family apartments and condominiums.
Dense residential areas, both single-family and multi-family, are directly adjacent to the
right-of-way near downtown and University Park. Also north of Northwest Highway, there
are pockets of multi-family housing along the right-of-way. The corridor passes through
neighborhoods of townhouses and apartments in East Dallas and Vickery, reaching densities
of over 12000 people per km2 (7500 people per mi2). Highland Park and University Park are
known as "Park Cities." They are predominantly residential, with relatively small populations.
61
The Park Cities are located predominantly on the west side of the North Central Expressway
between Knox Street and Northwest Highway. The smaller cities of Highland Park and
University Park are considered to be "prestigious" neighborhoods. University Park includes
Southern Methodist University and the surrounding residential area.
The areas to the west of North Central Expressway from Fitzhugh to Northwest
Highway contain some of the most sought after residential areas in Dallas (Figure 17).
Land Value Assessment
There were 194 useable accounts obtained for 1985 and 204 for 1994 to evaluate the
properties along Dallas' North Central Expressway. Over 200/o are residential, 500/o
commercial, roughly 25% are vacant, and the remainder are industrial, institutional, or some
other category. Note that the assessment of this section presents the effect of construction on
land prices during the construction phase.
Range of Values
Table 12 shows the range of values for the two time periods by proposed freeway
grade and land use category. Decreases are observed for at-grade and depressed properties.
Note that properties adjacent to at-grade sections have a higher value per square meter than
properties that are depressed. From a land use perspective, the same pattern of decreasing
values is seen, with two interesting exceptions: the lowest value for commercial property has
risen, and the highest value for vacant properties has remained stable. Thus, parcels available
for development have defied the decreasing trend. This finding is consistent with several other
studies regarding impact of construction on land values. Because the freeway is under
construction and the pre-construction and post-construction grades are different, impact of
grade is not as relevant to the changes observed in the value as for other cities in this study.
These data will be useful should future researchers assess this question once the North
62
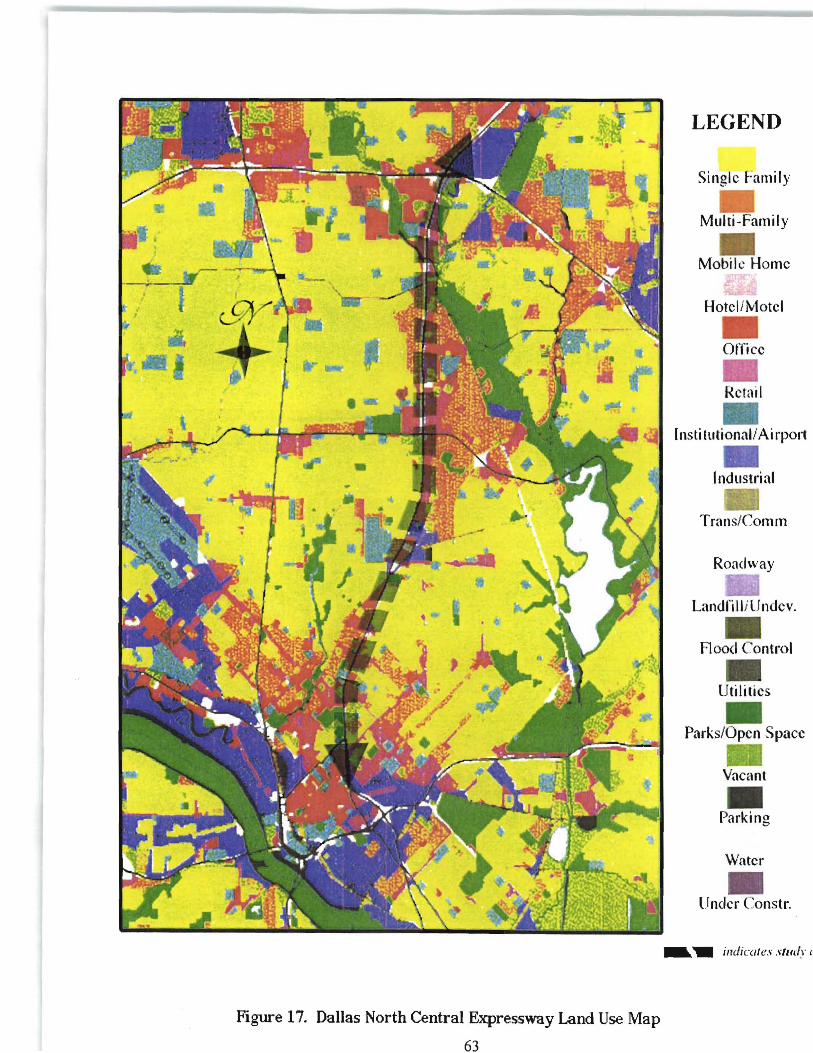
Figure 17. Dallas North Central Expressway Land Use Map
63
LEGEND
Single h unily • Multi ~Fami I y
• Mobik Home
Hotel /Motel • Office • Retail • [nsti tutionaliAi rport • Industrial
Trans/Comm
Roadway
LandfilliUndcv . • Flood Control • Utilities • Parks/Open Space
Vacant • Parking
Water • lJ nclcr Conslr .
... W i11dirntes study lJ
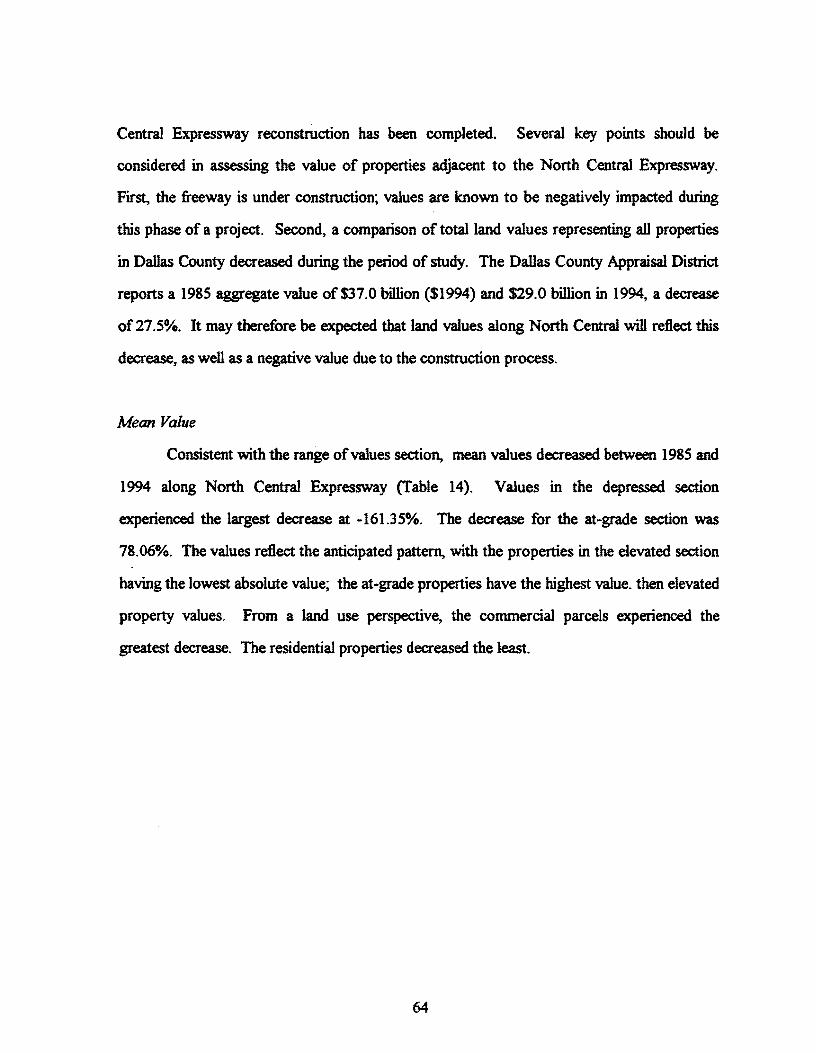
Central Expressway reconstruction has been completed. Several key points should be
considered in assessing the value of properties adjacent to the North Central Expressway.
First, the freeway is under construction; values are known to be negatively impacted during
this phase of a project. Second, a comparison of total land values representing all properties
in Dallas County decreased during the period of study. The Dallas County Appraisal District
reports a 1985 aggregate value of $37.0 billion ($1994) and $29.0 billion in 1994, a decrease
of27.5%. It may therefore be expected that land values along North Central will reflect this
decrease, as well as a negative value due to the construction process.
Mean Value
Consistent with the range of values section, mean values decreased between 1985 and
1994 along North Central Expressway (Table 14). Values in the depressed section
experienced the largest decrease at -161.3 5%. The decrease for the at-grade section was
78.06%. The values reflect the anticipated pattern, with the properties in the elevated section
having the lowest absolute value; the at-grade properties have the highest value. then elevated
property values. From a land use perspective, the commercial parcels experienced the
greatest decrease. The residential properties decreased the least.
64
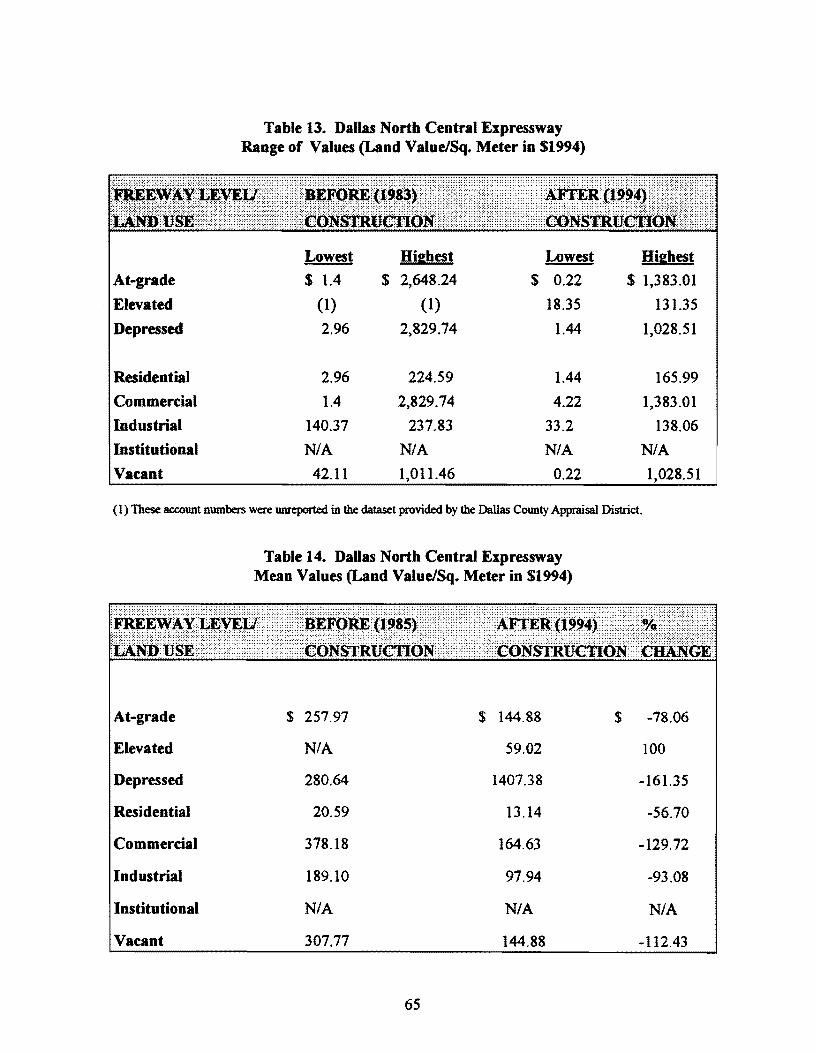
At-grade
Elevated
Depressed
Residential
Commercial
Industrial
Institutional
Vacant
Table 13. Dallas North Central Expressway Range of Values (Land Value/Sq. Meter in $1994)
Lowest Hi&hest Lowest
$ 1.4 $ 2,648.24 $ 0.22
(1) (1) 18.35
2.96 2,829.74 1.44
2.96 224.59 1.44
1.4 2,829.74 4.22
140.37 237.83 33.2
NIA NIA NIA 42.11 1,011.46 0.22
Hiahest
$ 1,383.01
131.35
1,028.51
165.99
1,383.01
138.06
NIA 1,028.51
(1) These account numbers were unreported in the dataset provided by the Dallas County Appraisal District.
Table 14. Dallas North Central Expressway Mean Values (Land Value/Sq. Meter in $1994)
'Mti1'~.:til~~tw• n:;;::m.i;J!~.F.· .. ,'..:.•.o,'. .. ··,···,·.n ...•...•... ',··,···,··,:··:·<!:~-$)i:[;:::i::i';;··':t·.,,,,,.,,~rnR•(j;~~)': ..... iii::::;~rn:,mm •.· •. ;:: :~N1j.'\1si:::·.•·:······ , •••• : •.•....... , •••..• , .•.•• :'·~: 1tbNSTRUCTION'•.:::.:·'• ... ;~··:·:···~·i1ico:Nsfiiurno'.N:;(:·tj~~·
At-grade $ 257.97 $ 144.88 $ -78.06
Elevated NIA 59.02 100
Depressed 280.64 1407.38 -161.35
Residential 20.59 13.14 -56.70
Commercial 378.18 164.63 -129.72
Industrial 189.10 97.94 -93.08
Institutional NIA NIA NIA
Vacant 307.77 144.88 -112.43
65
LAND VALUE INDEX MODEL
The purpose of this section is to evaluate the pre-construction and post-construction
behavior of the land values on elevated, depressed, and at-grade sections of the freeway
utilizing an economic, linear regression approach. A "land value index" model provides
the basis by which the freeway grades and land uses are examined. It was expected that
yearly changes in land value for elevated and depressed sections would differ significantly
from each other and from changes recorded for at-grade sections. Each combination of
components, as shown below, represents a distinct variable. For instance, an at-grade,
residential property in 1982 is treated as one variable; an elevated, residential property in
1982 is a second variable; or an at-grade, residential property in 1994 is a third variable.
In that manner, the number of variables for the specific city varies as follows:
#Variables= number of freeway grades (three for Houston, Dallas, and Lubbock and four for San Antonio as double-decked is added), number of land use categories, number of years of available data
• Ln (L;,:) = L L L (Tj * u, * Elev t ) + Utt j k l
L;'t =Land value per square foot for a given parcel
't = Time period
u, =Dummy for land use type. 4
T j = Dummy for time period, j
Elevt =Dummy for freeway elevation, l
Individual account number dummies are also included in the equation whenever
significant, to account for omitted variables. The model does not, however, establish a
causal relationship between "grade level of freeway constructed" and "land values." The
indices for the pre-construction year (the base year) were normalized to 100. The change
• Individual account dummies were included in the regression in order to span or parcel specific factors and to increase the explanatory power of the regression equation.
66
in the index for a given grade and land use in the post-construction year was the increment
in the coefficient of that variable. The calculation of the indices from the coefficients of
the variables is included in Appendix 2.
For all cities, the regression confirmed the findings in the range of values and mean
values review for raw data: that freeway grade cannot always be positively correlated with
land value and that no conclusive trends can be consistently confirmed regarding land use,
grade, and land value. To facilitate development of the indices, the output was
standardii:ed by using the first year coefficient as the base year (either 1982 or 1985} with a
value of 100. The land value indices are shown in Table 15.
Given the number of hypotheses that can be evaluated using the regression
methodology, the research team selected several key premises to test for each city. These
premises were based on the strength of the raw data available and the principal research
question regarding variations in property values according to freeway grade level. For
instance, in 1994 fewer than 3 % percent of the properties in Houston, suburban San
Antonio, or Dallas were found to be in the industrial and institutional categories.
Therefore, hypotheses shown in the tables of significance do not specifically address the
institutional and industrial properties in those cities.
Houston
The findings indicate that irrespective of freeway grade level, all land values
adjacent to the Sam Houston Tollway increased over 1982 levels. As noted in the mean
value analysis, properties have decreased from pre-construction highs in 1986. Figures 18
to 20 display the relationships of the property values by grade and by land use according to
the index which sets the base year (1982} at 100. The residential values are competitive
with commercial values in the elevated and the depressed sections. Table 16 shows the
results of tests of significance conducted for key hypotheses. It was found that there was
no significant variation in the residential and vacant properties across grades in the year
1994. Also, the value of properties that are at-grade are not significantly different across
land use categories. The variation in value was significant for commercial properties after
67
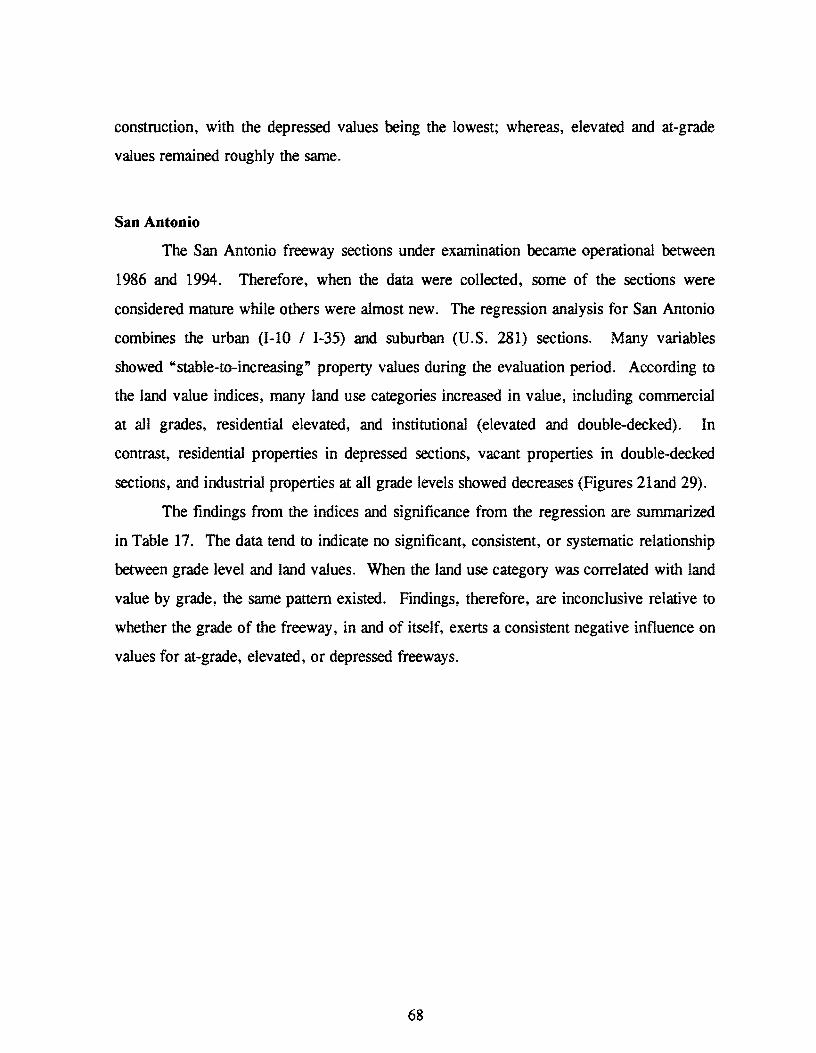
construction, with the depressed values being the lowest; whereas, elevated and at-grade
values remained roughly the same.
San Antonio
The San Antonio freeway sections under examination became operational between
1986 and 1994. Therefore, when the data were collected, some of the sections were
considered mature while others were almost new. The regression analysis for San Antonio
combines the urban (I-10 I I-35) and suburban (U.S. 281) sections. Many variables
showed "stable-to-increasing" property values during the evaluation period. According to
the land value indices, many land use categories increased in value, including commercial
at all grades, residential elevated, and institutional (elevated and double-decked). In
contrast, residential properties in depressed sections, vacant properties in double-decked
sections, and industrial properties at all grade levels showed decreases (Figures 21and 29).
The findings from the indices and significance from the regression are summarized
in Table 17. The data tend to indicate no significant, consistent, or systematic relationship
between grade level and land values. When the land use category was correlated with land
value by grade, the same pattern existed. Findings, therefore, are inconclusive relative to
whether the grade of the freeway, in and of itself, exerts a consistent negative influence on
values for at-grade, elevated, or depressed freeways.
68
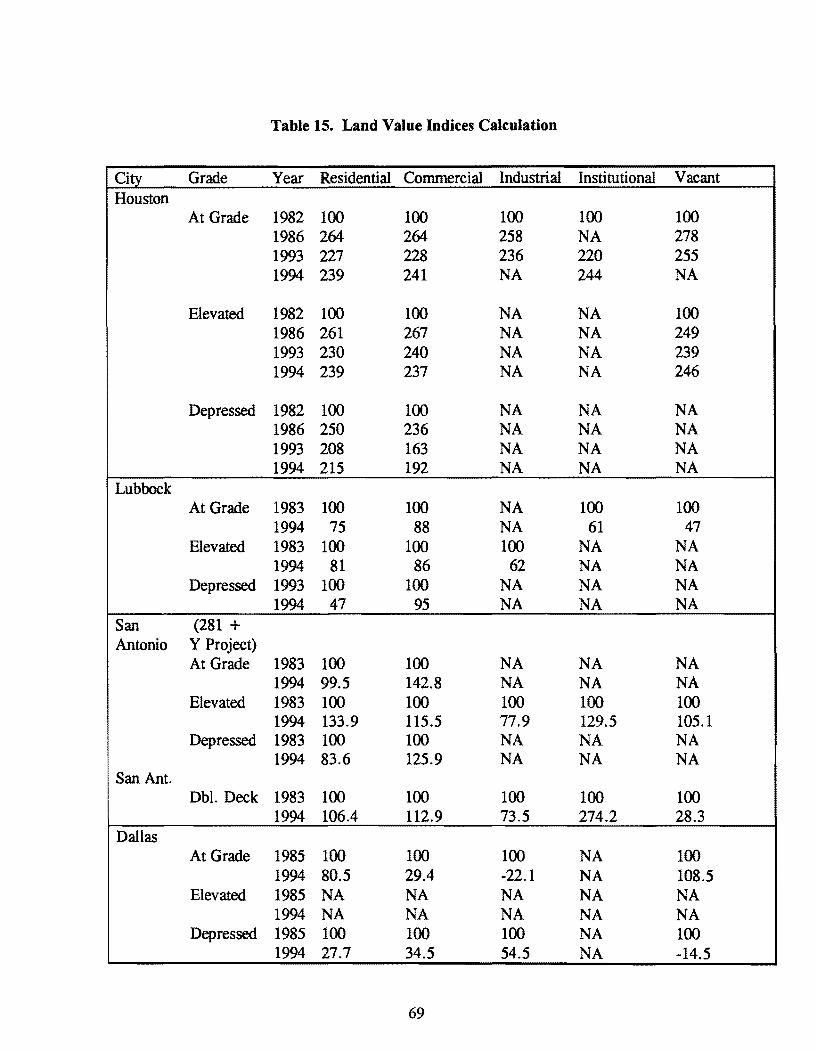
Table 15. Land Value Indices Calculation
City Grade Year Residential Commercial Industrial Institutional Vacant Houston
At Grade 1982 100 100 100 100 100 1986 264 264 258 NA 278 1993 227 228 236 220 255 1994 239 241 NA 244 NA
Elevated 1982 100 100 NA NA 100 1986 261 267 NA NA 249 1993 230 240 NA NA 239 1994 239 237 NA NA 246
Depressed 1982 100 100 NA NA NA 1986 250 236 NA NA NA 1993 208 163 NA NA NA 1994 215 192 NA NA NA
Lubbock At Grade 1983 100 100 NA 100 100
1994 75 88 NA 61 47 Elevated 1983 100 100 100 NA NA
1994 81 86 62 NA NA Depressed 1993 100 100 NA NA NA
1994 47 95 NA NA NA San (281 + Antonio Y Project)
At Grade 1983 100 100 NA NA NA 1994 99.5 142.8 NA NA NA
Elevated 1983 100 100 100 100 100 1994 133.9 115.5 77.9 129.5 105.1
Depressed 1983 100 100 NA NA NA 1994 83.6 125.9 NA NA NA
San Ant. Dbl. Deck 1983 100 100 100 100 100
1994 106.4 112.9 73.5 274.2 28.3 Dallas
At Grade 1985 100 100 100 NA 100 1994 80.5 29.4 -22.1 NA 108.5
Elevated 1985 NA NA NA NA NA 1994 NA NA NA NA NA
Depressed 1985 100 100 100 NA 100 1994 27.7 34.5 54.5 NA -14.5
69
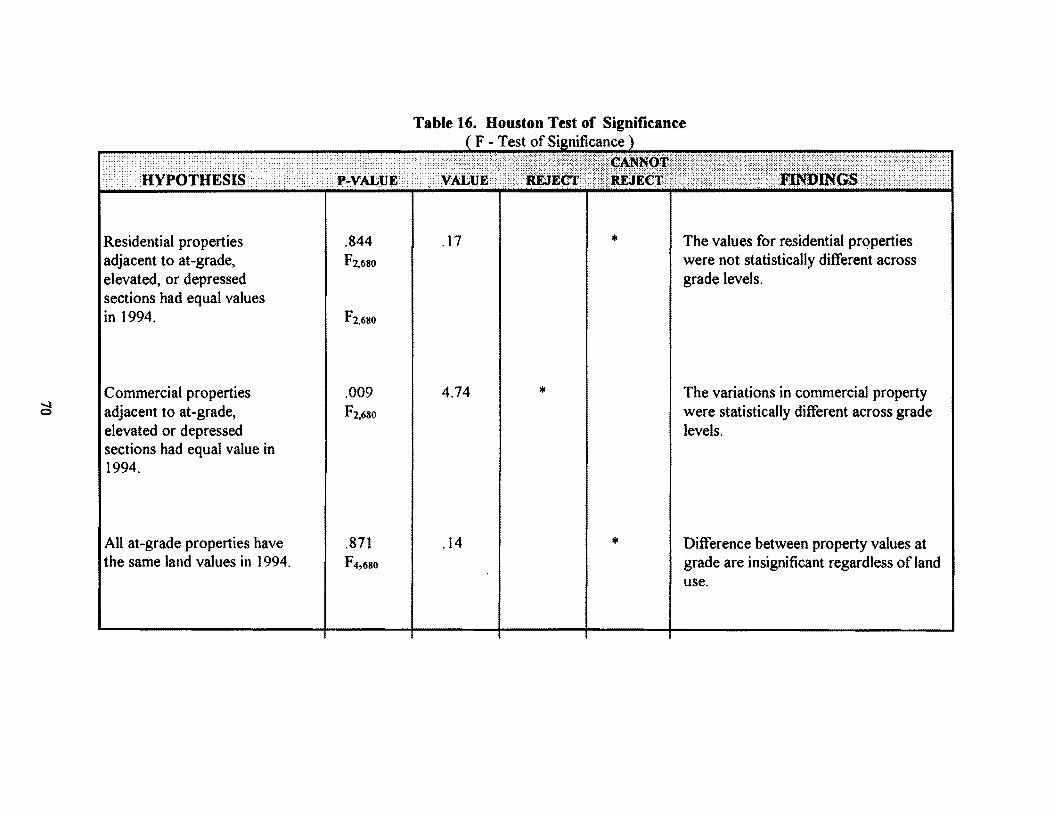
Table 16. Houston Test of Significance F - Test of Si nificance
~~~~~~~~ ... Residential properties adjacent to at-grade, elevated, or depressed sections had equal values in 1994.
Commercial properties adjacent to at-grade, elevated or depressed sections had equal value in 1994.
All at-grade properties have the same land values in 1994.
.844 F2,6SO
.009
F2,6llO
.871 f 4,6110
.17
4.74
.14
*
*
*
The values for residential properties were not statistically different across grade levels.
The variations in commercial property were statistically different across grade levels.
Difference between property values at grade are insignificant regardless of land use.
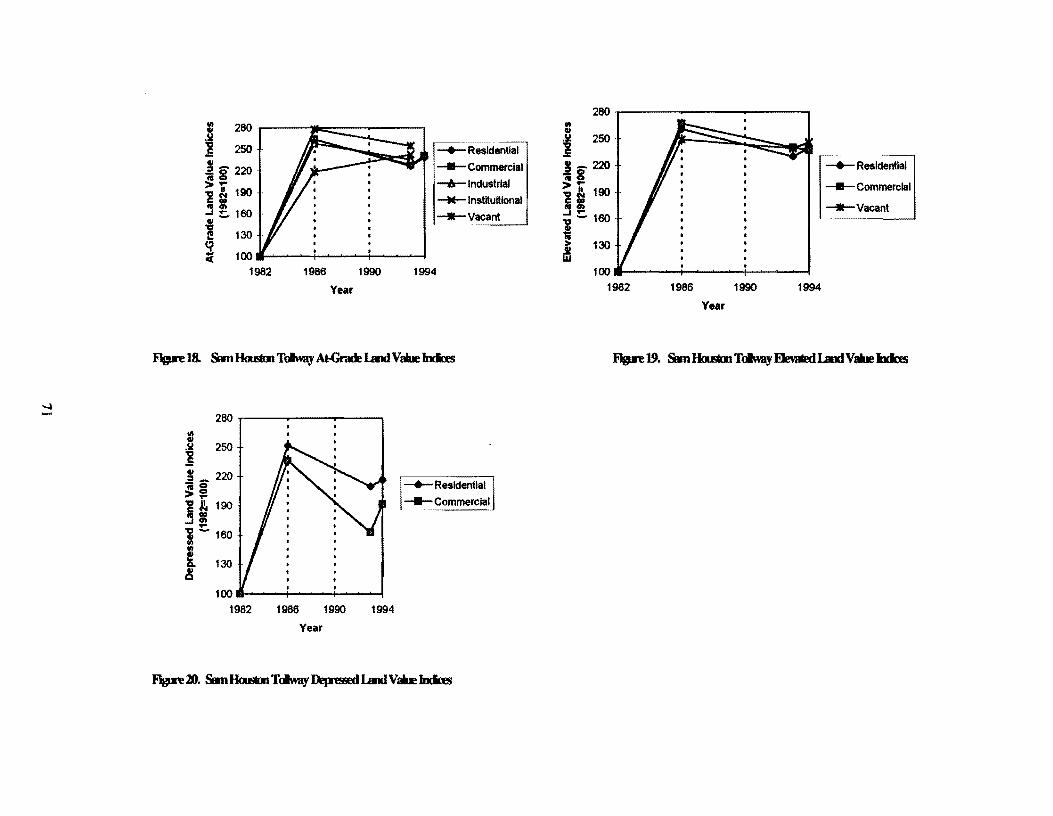
130 100 _.._ __________ t--................ .._
1982 1986 1990 1994
Year
100---........... --;..--..._..._i--'-~--~
1982 1986 1990 1994
Year
__._,Residential
-Commercial --6- lndustrlal
-M- lnstltultlonal
-Vacant
100---------+--........ ..._.._-+--_.__.....~--1
1982 1986 1990 1994
Year
__._,Residential
-Commercial
-Vacant
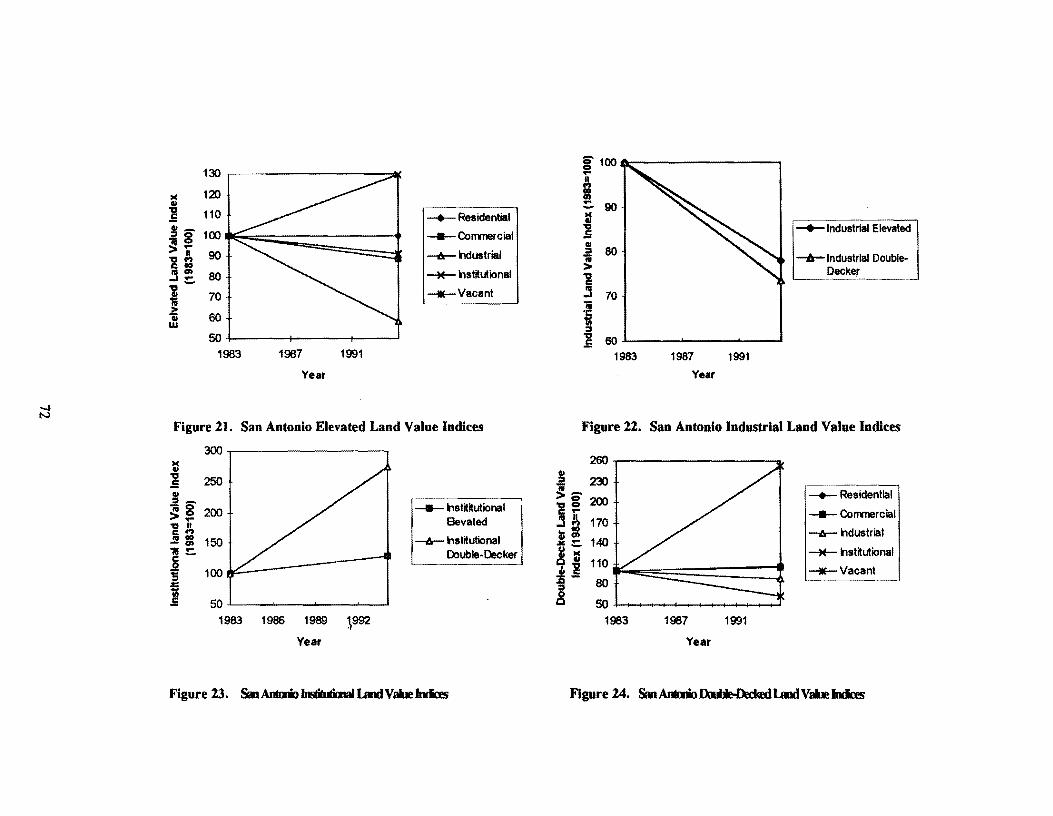
130 g 100 ...
120 ~ )( OI ., ::. 90 1 110 -+-Residential = ., - 100 :! -+-Industrial Elevated :I g -II-Corrmercial ~ .... .,
A 90 -&- n<fustrial :I 80 -6- lndustrlal Double-ii -g llO > Decker !I ~ 80 ~ nstitutional 1l -l 70 ---Vacant !I 70
ii 60 i w :I 50 "Cl 80 .5
1983 1987 1991 1983 1987 1991
Year Year
Figure 21. San Antonio Elevated Land Value Indices Figure 22. San Antonio Industrial Land Value Indices
300~~~~~~~~~~~
= 260 .,
"Cl 250 :I 230 .5 ~ O' .,
200 -+-Residential = O' -II- nstililutional ,, 0
~~ 200 I: P: -II- Corrmercial "Cl II 8evated !I llO 170 s: -6- nstitutional i O'> -Ir- ndustrial - O'> 150 .Ill: .... 140 fi ~ Double-Decker ~= ~ nstitutional j 110
100 :I 1 ---Vacant '5 .:t: 80 ~
:I
.E 50 8 50 1983 1966 1989 ,992 1983 1987 1991
Year Year
Figure 23. SanAnum~lmdVahlelnilas Figure 24. SanAl*-*>~I.aidVahlelnilas
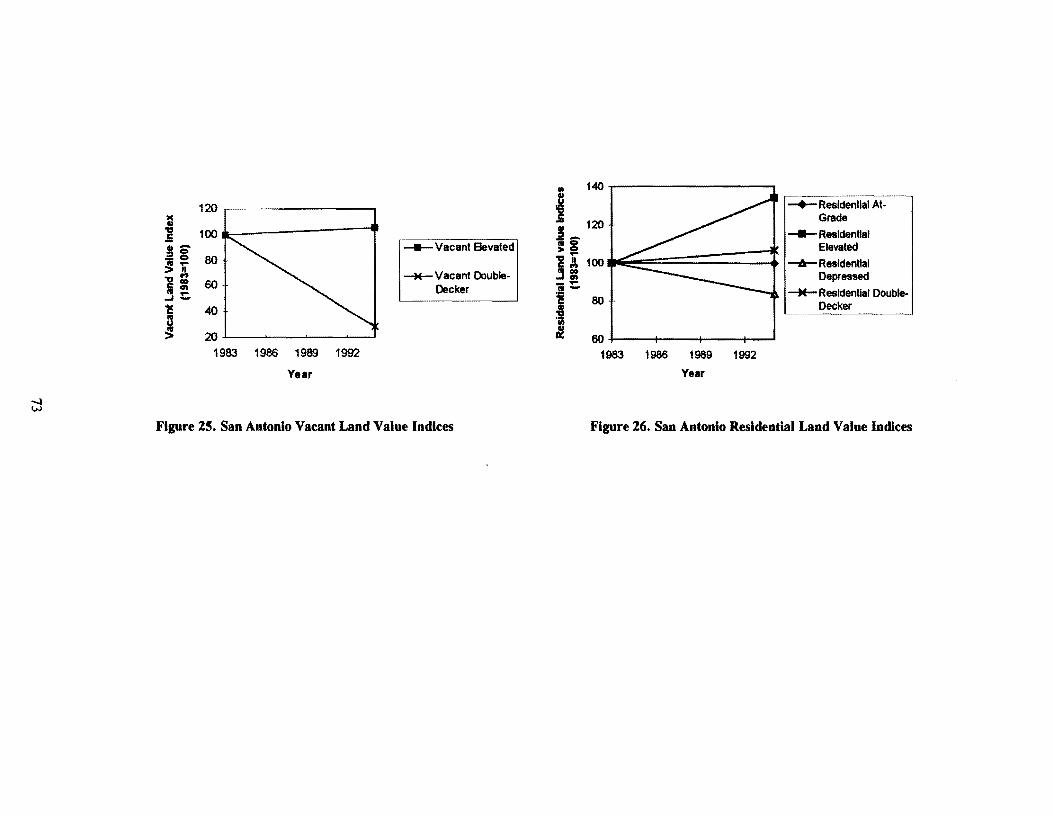
120
= 1 100
~g ----Vacant Bevated ii .... 80 >JJ, -'H- Vacant Double-1= 60 Decker ..J ~
15 40
~ 20 1983 1986 1989 1992
Year
Figure 25. San Antonio Vacant Land Value Indices
1983 1986 1989 1992
Year
-+-Residential AtGrade
-Resldentlal Elevated
--6-Residential Depressed
-M-Resldentlal DoubleDecker
Figure 26. San Antonio Residential Land Value Indices
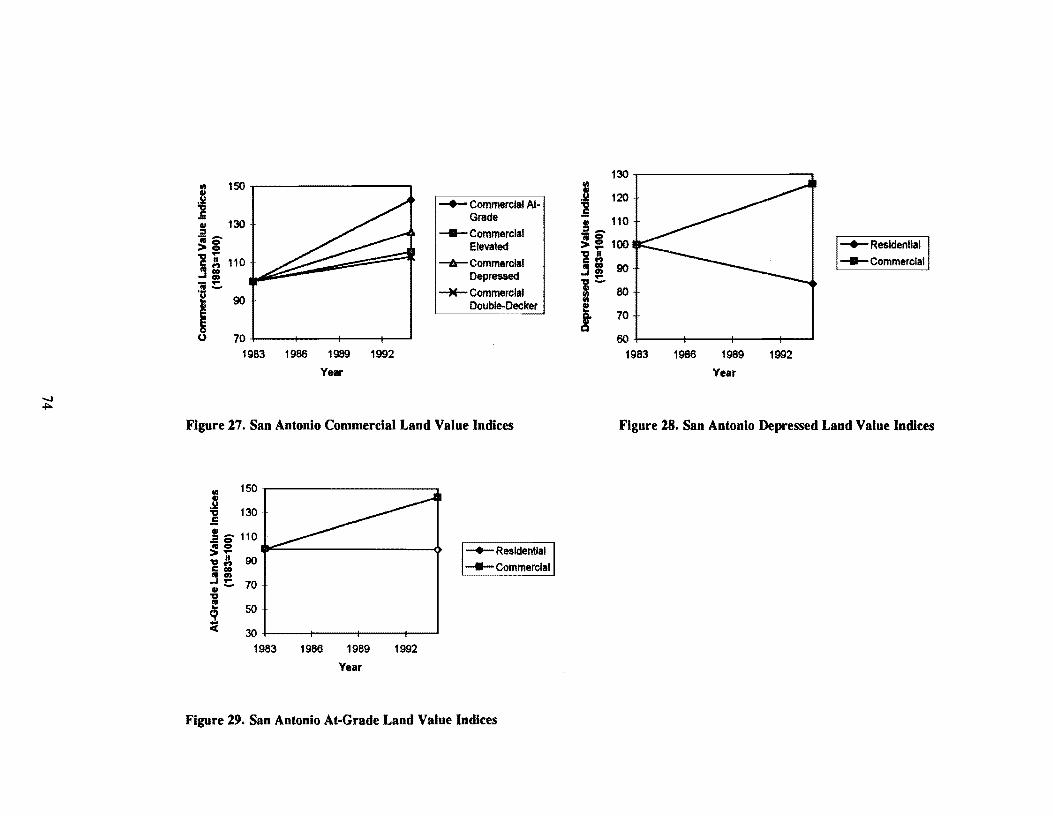
-..I +:>-
tll 150 • .Si!
1 ! 130
~i
__.__Commercial At-Grade
-Commercial Elevated
'i r. 110 !I i - ... . ! ..._
I 90
--/JJ:- Commercial Depressed
-M-Commerclal Double-Decker
u 70 1983 1986 1989 1992
Year
Figure 27. San Antonio Commercial Land Value Indices
50
30+-------+---------------------1983 1986 1989
Year
1992
__.__Residential
-Commerclat
Figure 2'. San Antonio At-Grade Land Value Indices
130 tll .a 120 1 • 110 ::i_
;; = 100 'i II
!I i 90
1~ 80
i 70
60 1983 1986 1989
Year
1992
__.__Residential
-Commercial
Figure 28. San Antonio Depressed Land Value Indices
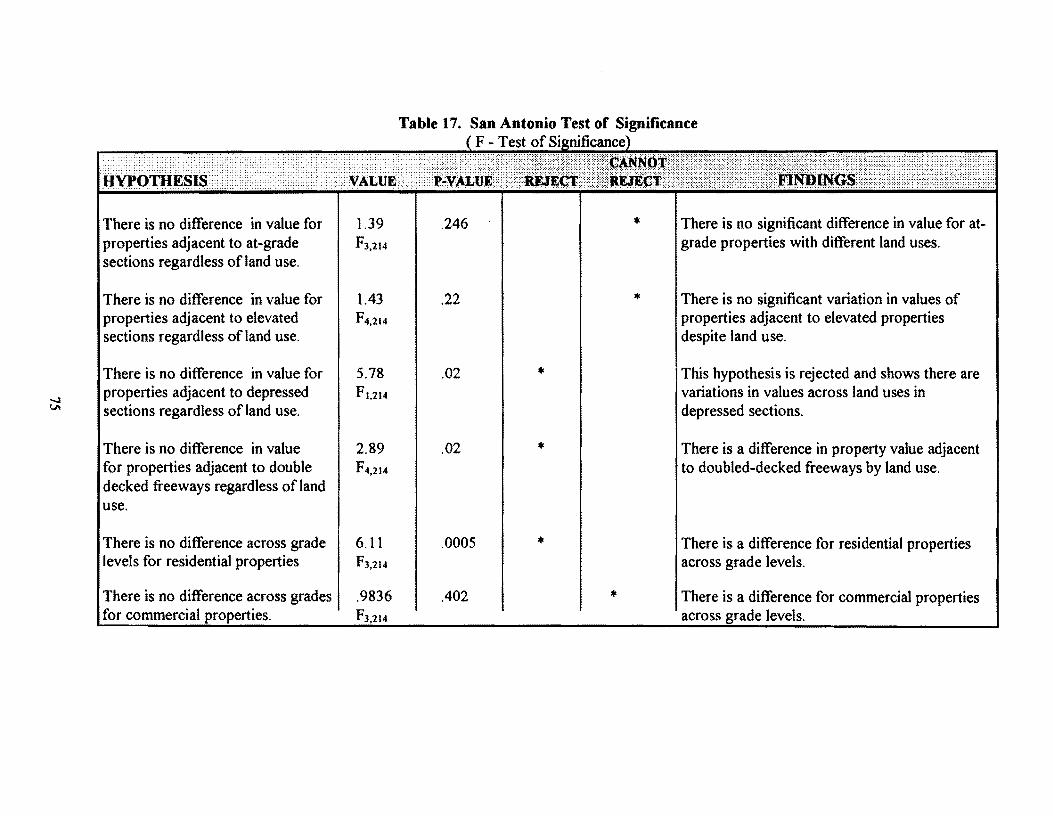
Table 17.
There is no difference in value for 1.39 .246 * There is no significant difference in value for at-properties adjacent to at-grade F3,214 grade properties with different land uses. sections regardless of land use.
There is no difference in value for 1.43 .22 * There is no significant variation in values of properties adjacent to elevated f4,214 properties adjacent to elevated properties sections regardless ofland use. despite land use.
There is no difference in value for 5.78 .02 * This hypothesis is rejected and shows there are
-..I properties adjacent to depressed ft,214 variations in values across land uses in
I.I> sections regardless of land use. depressed sections.
There is no difference in value 2.89 .02 * There is a difference in property value adjacent for properties adjacent to double F4,214 to doubled-decked freeways by land use. decked freeways regardless ofland use.
There is no difference across grade 6.11 .0005 * There is a difference for residential properties levels for residential properties f3,214 across grade levels.
There is no difference across grades .9836 .402 * There is a difference for commercial properties for commercial properties. f3,214 across grade levels.
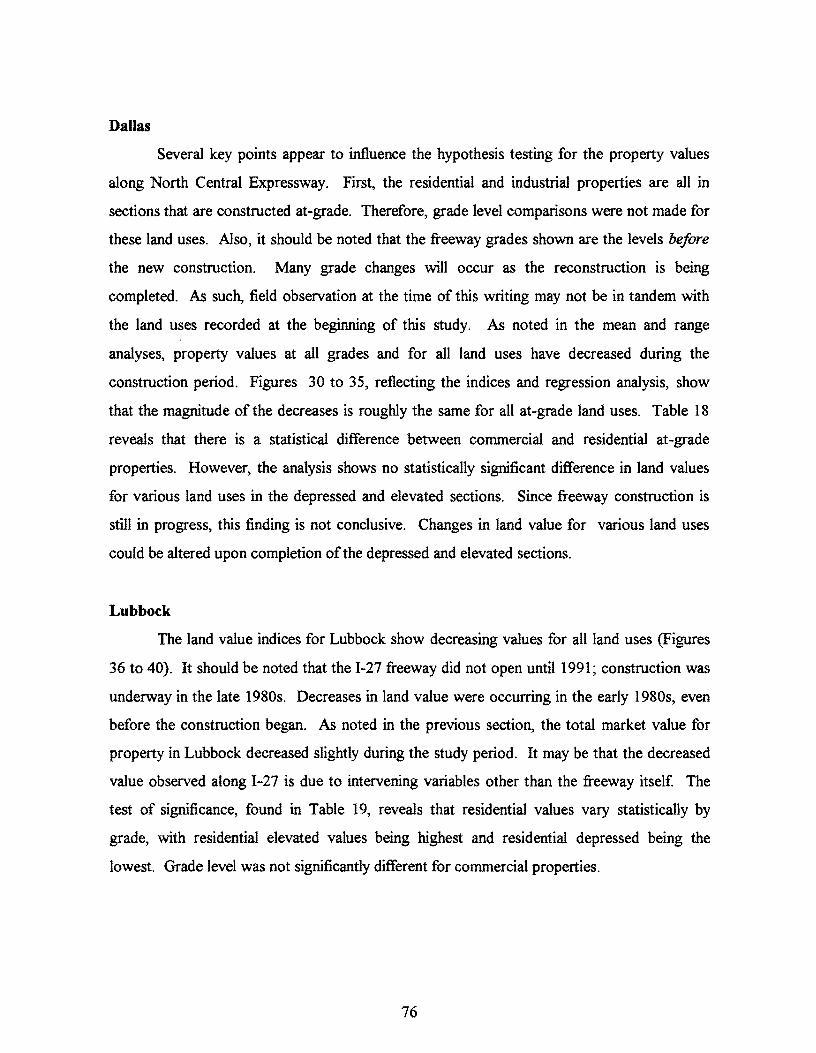
Dallas
Several key points appear to influence the hypothesis testing for the property values
along North Central Expressway. First, the residential and industrial properties are all in
sections that are constructed at-grade. Therefore, grade level comparisons were not made for
these land uses. Also, it should be noted that the freeway grades shown are the levels before
the new construction. Many grade changes will occur as the reconstruction is being
completed. As such, field observation at the time of this writing may not be in tandem with
the land uses recorded at the beginning of this study. As noted in the mean and range
analyses, property values at all grades and for all land uses have decreased during the
construction period. Figures 30 to 35, reflecting the indices and regression analysis, show
that the magnitude of the decreases is roughly the same for all at-grade land uses. Table 18
reveals that there is a statistical difference between commercial and residential at-grade
properties. However, the analysis shows no statistically significant difference in land values
for various land uses in the depressed and elevated sections. Since freeway construction is
still in progress, this finding is not conclusive. Changes in land value for various land uses
could be altered upon completion of the depressed and elevated sections.
Lubbock
The land value indices for Lubbock show decreasing values for all land uses (Figures
36 to 40). It should be noted that the I-27 freeway did not open until 1991; construction was
underway in the late 1980s. Decreases in land value were occurring in the early 1980s, even
before the construction began. As noted in the previous section, the total market value for
property in Lubbock decreased slightly during the study period. It may be that the decreased
value observed along 1-27 is due to intervening variables other than the freeway itself The
test of significance, found in Table 19, reveals that residential values vary statistically by
grade, with residential elevated values being highest and residential depressed being the
lowest. Grade level was not significantly different for commercial properties.
76
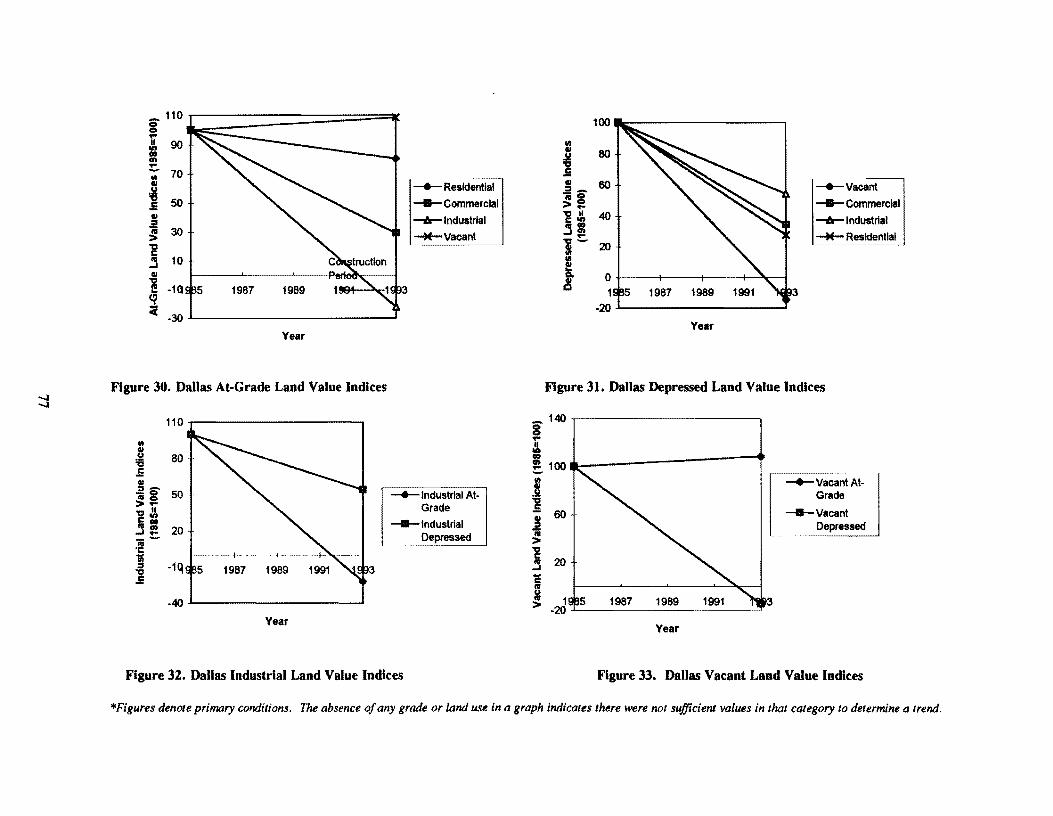
-....1 -....1
- 110 0 0 ,.. II 90 .,,
CIO en !:. 70 Ill GI .!It ,,
50 .5 GI
= ~ 30 ,, c Ill 10 _. Cll
~ -1Q <? Ci -30
Year
Figure 30. Dallas At-Grade Land Value Indices
110...-~~~~~~~~~--.
Ill
~ .5
Is 50 > r. i:
20 !I :? ;; -'C
J -1q ] 3
-40
Year
-4-Residential
-Commercial ......,_Industrial -M-Vacant
-4-lndustrlal AtGrade
-Industrial Depressed
Figure 32. Dallas Industrial Land Value Indices
100
Ill GI 80 .Si!
~ ~l ~ §--4-Vacant =-~g --"--' i I 40 ......,_Industrial s: ,.. -M-Residential 1- 20
l 0 ~ 1
-20
Year
Figure 31. Dallas Depressed Land Value Indices
8140 ,..
' ID !1oo~l;:-----------~ T :: .!it
i ! 60
;: l s 20
j -2J 9f:3..L_5 __ 1_98_7 __ 19_89 __ 1_99_1 __ ,.__.::J 3
Year
-4-Vacant AtGrade
-Vacant Depressed
Figure 33. Dallas Vacant Land Value Indices
*Figures denote primary conditions. The absence of any grade or land use in a graph indicates there were not sufficienl values in that category to determine a trend.
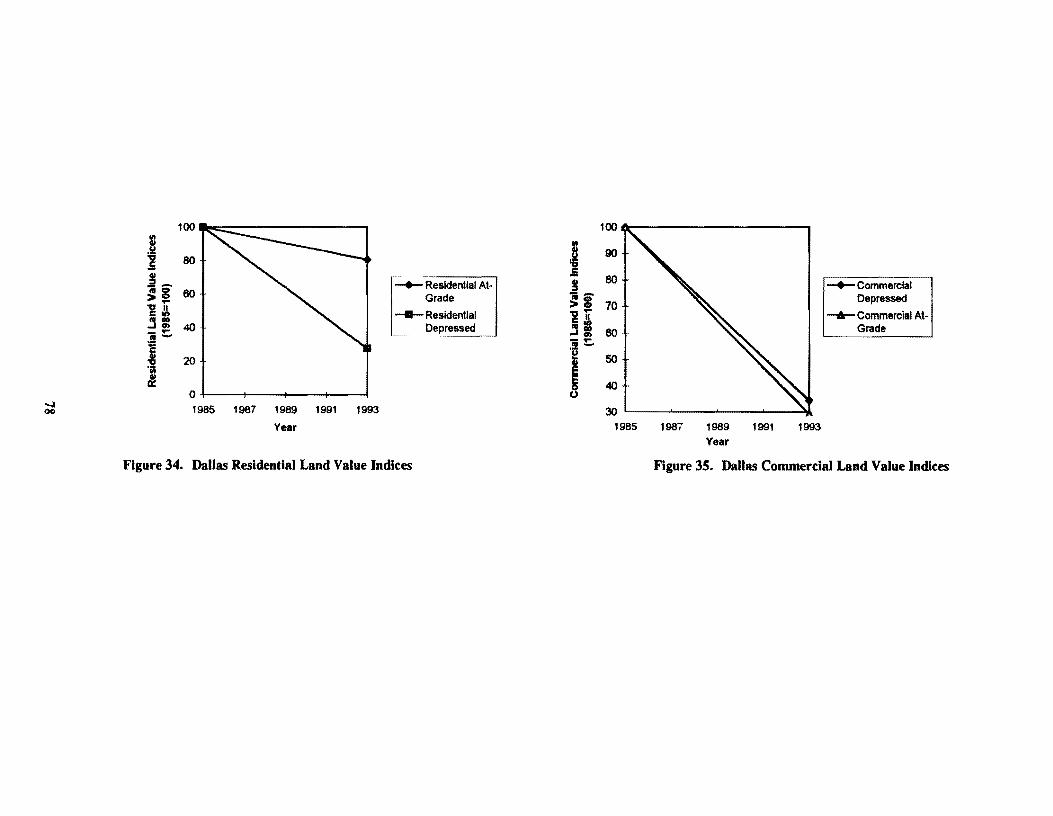
....... 00
100
.i 1 80
11-~g 80 .... "! 4 j= 40 - .... ca ..... i GI
20 :2 Ill
&! 0 1985 1987 1989 1991
Year
1993
~•. . . R .. e .sldentlal AtGrade
-Residential .. _Depressed
Figure 34. Dallas Residential Land Value Indices
100
.! 90 'O .5
:f !
~ -+-Commercial
~= Depressed
l 1i -6-Commerclal At-ca IO Grade _, = 60 - .... .!! .....
I 50
40
30 ' 1985 1987 1989 1991 1993
Year
Figure JS. Dallas Commercial Land Value Indices
There is no difference in land value at-grade .405 regardless of land use. FJ,108
'lllere is no difference in elevated land Lil value regardless ofland use. F1,I08
'lllere is no difference in land value 8.70 regardless of land use in depressed FJ.108
-..J sections. '° There is no difference in commercial land .948 values regardless of grade level. F2.1os
There is no difference in value for vacant 1.41 land at different grades. F2,1os
There is no difference in value for 19.8 residential Jund at different grades. F1,1oe
Table 18. Dallas Test of Significance F - Test of Si nificance
.749 *
.29 *
.0001 *
.391 *
.249
.0001 *
There is no significant difference in land value for commercial or residential land at-grade.
There is no significant difference in land values in elevated sections across land uses.
There is a significant difference in land values in depressed sections across land uses.
Commercial land values do not vary by grade.
Vacant land value does vary by grade.
There is a significant difference in residential land values at different grades.
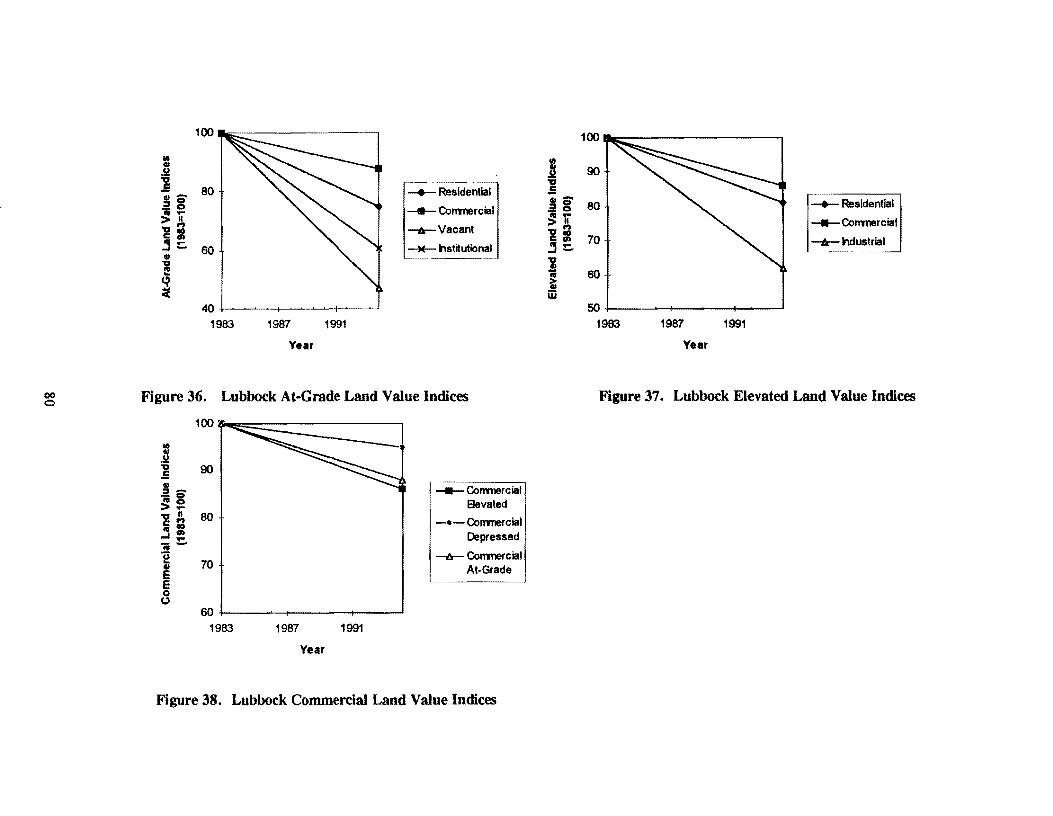
oc 0
100
: j! ,, Ji 80 -.--Residential !-_g
--Conmercial ..... >II i~ -tr-Vacant !I ~ -M-hstltutional 60 II ,, I! ~ :t
40 1983 1987 1991
Year
Figure 36. Lubbock At-Grade Land Value Indices
100
J ,, 90 Ji
II - - Conmercial ~§ Elevated ,, II 80 -•-Conmercial c I? .. co
.... O> Depressed .... 1- -tr- Conmercial II 70 At-Grade E E 0 (.)
60 1983 1987 1991
Year
Figure 38. Lubbock Commercial Land Value Indices
100
• J 90 ,, Ji !g 80 ~ .... -.. ~ 'Ii -Conmerciat ,, I? CCIO
!I~ 70 -tr-hdustrial ··-------~
J 60 t w 50
1983 1987 1991
Year
Figure 37. Lubbock Elevated Land Value Indices
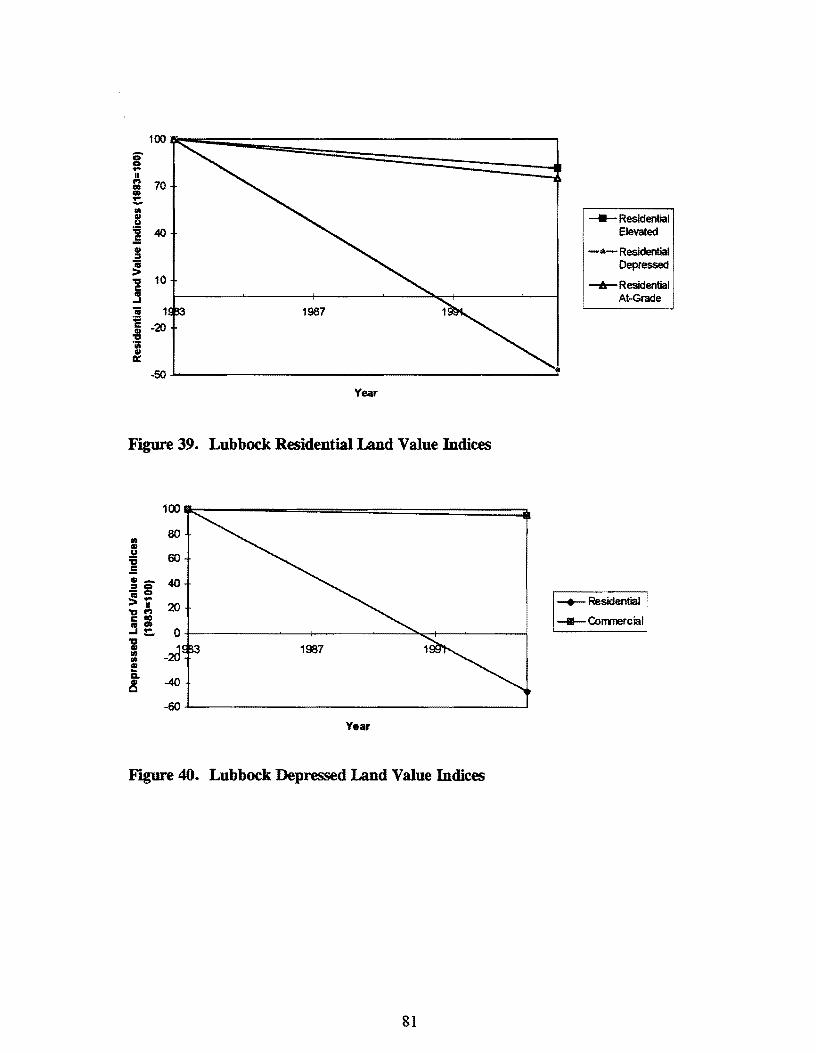
100
0 0 .... p ...,
70 CIO • c Ill Ill -Residential .~ ,, 40 Elevated .5 Ill -•-Residential :I
~ Depressed ,, 10 -6:-Residential c Ill At-Grade .... iii 1 il -20
I &
-50
Year
Figure 39. Lubbock Residential Land Value Indices
100
llt 80
Ill .2 60 ,, .5 111- 40 ::s 0 - 0 ~ 'li 20 -+- Residential · ,, ,., I: CIO -O:mmercial 111 CIO -'C 0 1
-~ en .,, • ... CL
-40 Ill c -60
Year
Figure 40. Lubbock Depressed Land Value Indices
81
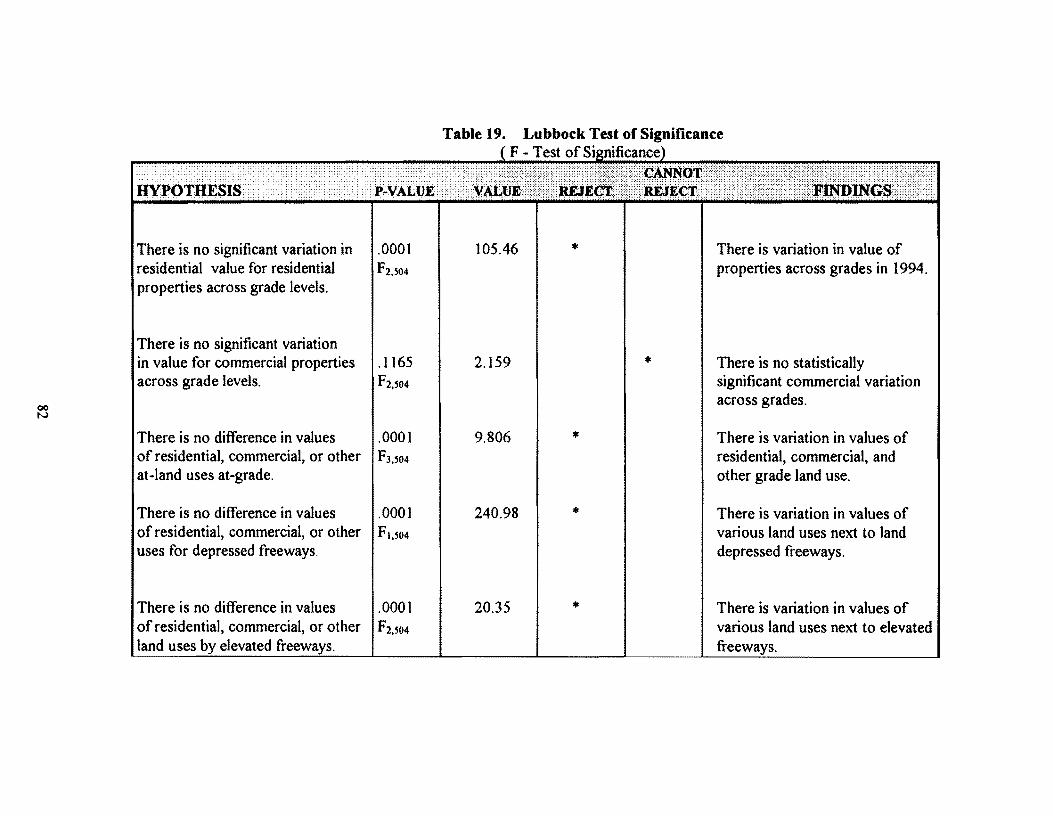
There is no significant variation in .0001 105.46 "' There is variation in value of residential value for residential F2,so4 properties across grades in 1994. properties across grade levels.
There is no significant variation in value for commercial properties .1165 2.159 "' There is no statistically across grade levels. F2,so4 significant commercial variation
00 across grades.
N
There is no difference in values .0001 9.806 * There is variation in values of of residential, commercial, or other F3,S04 residential, commercial, and at-land uses at-grade. other grade land use.
There is no difference in values .0001 240.98 "' There is variation in values of of residential, commercial, or other F1,so4 various land uses next to land uses for depressed freeways. depressed freeways.
There is no difference in values .0001 20.35 "' There is variation in values of of residential, commercial, or other F2,S04 various land uses next to elevated land uses by elevated freeways. freeways.
The findings summarized in Tables 16-19 show that freeway grade influences land
values in some cases, but not in all cases. Likewise, the land use category sometimes
correlated with land value by grade and other times did not. There is need to assess land
values along freeway corridors under more controlled conditions. Since some correlations
were possible, there is reason to suspect that intervening variables (not accounted for in the
model) may provide some explanation for the negative influences.
83

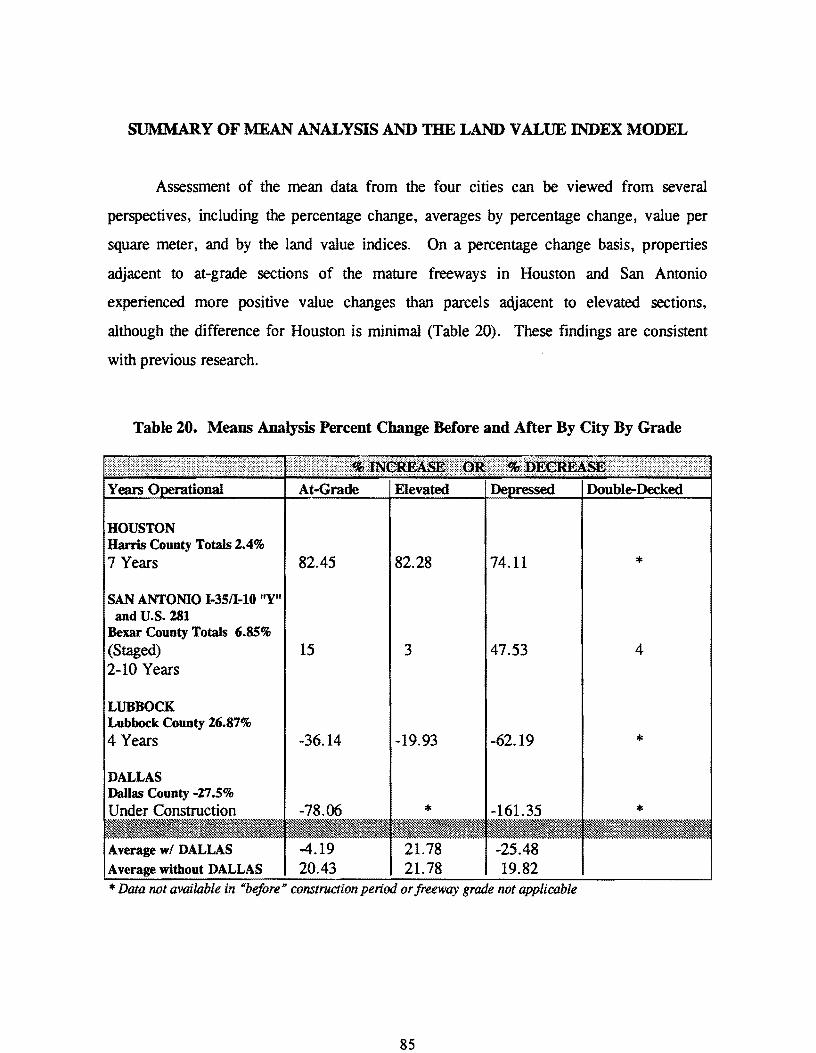
SlJM:MARY OF MEAN ANALYSIS AND THE LAND VALUE INDEX MODEL
Assessment of the mean data from the four cities can be viewed from several
perspectives, including the percentage change, averages by percentage change, value per
square meter, and by the land value indices. On a percentage change basis, properties
adjacent to at-grade sections of the mature freeways in Houston and San Antonio
experienced more positive value changes than parcels adjacent to elevated sections,
although the difference for Houston is minimal (Table 20). These findings are consistent
with previous research.
Table 20. Means Analysis Percent Change Before and After By City By Grade
At-Grade Elevated De ressed Double-Decked
HOUSTON Harris County Totals 2.4% 7 Years 82.45 82.28 74.11 * SAN ANTONIO 1-35/1-10 "Y"
and U.S. 281 Bexar County Totals 6.85% (Staged) 15 3 47.53 4 2-10 Years
LUBBOCK Lubbock County 26.87% 4 Years -36.14 -19.93 -62.19 * DALLAS Dallas County-%7.5% Under Construction -78.06 * -161.35 * ' -'$f.~}~~11.-~'3%~- ,; >; ~ ~ §!:1.!:.!:~$$;·<~~m. ~'i..!::::::.~··~-:::.~:-. ~.>;:-.: ... ~~~!$$.~ .. ~*''"!·::::::: ~~~~-.:
Average w/ DALLAS 21.78 -25.48 Average without DALLAS 21.78 19.82 * Data not available in "before" construction period or freeway grade not applicable
85
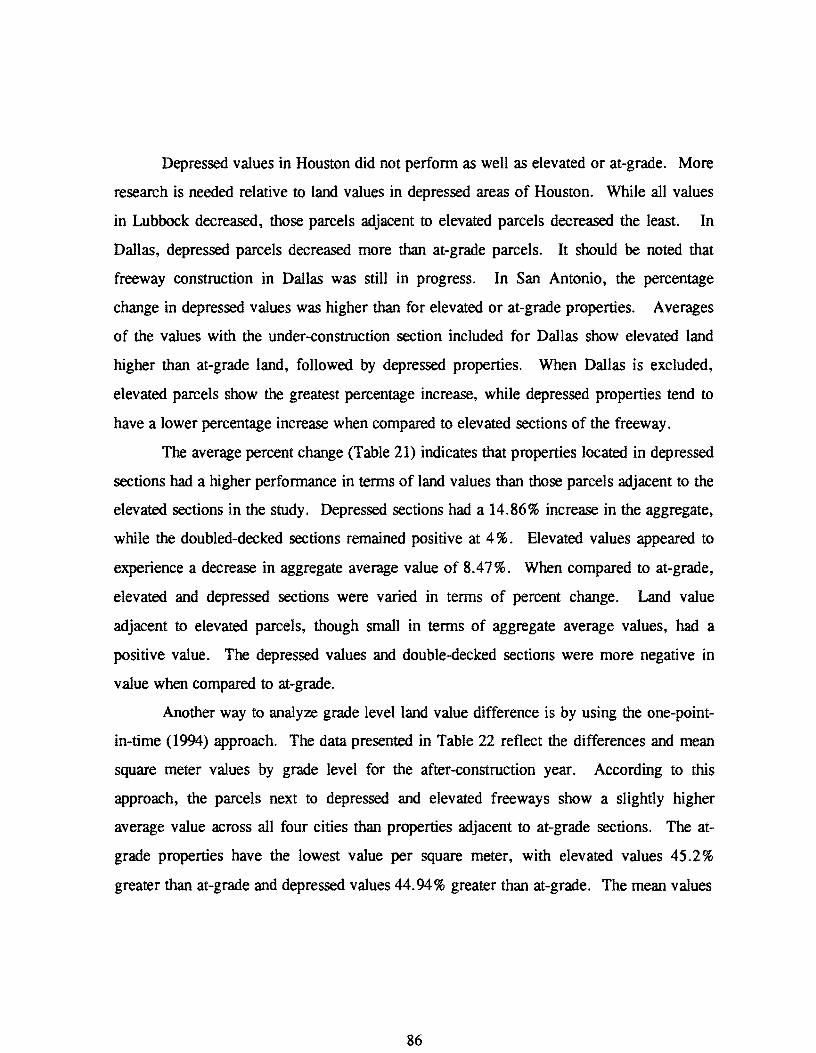
Depressed values in Houston did not perform as well as elevated or at-grade. More
research is needed relative to land values in depressed areas of Houston. While all values
in Lubbock decreased, those parcels adjacent to elevated parcels decreased the least. In
Dallas, depressed parcels decreased more than at-grade parcels. It should be noted that
freeway construction in Dallas was still in progress. In San Antonio, the percentage
change in depressed values was higher than for elevated or at-grade properties. Averages
of the values with the under-construction section included for Dallas show elevated land
higher than at-grade land, followed by depressed properties. When Dallas is excluded,
elevated parcels show the greatest percentage increase, while depressed properties tend to
have a lower percentage increase when compared to elevated sections of the freeway.
The average percent change (Table 21) indicates that properties located in depressed
sections had a higher performance in terms of land values than those parcels adjacent to the
elevated sections in the study. Depressed sections had a 14.86% increase in the aggregate,
while the doubled-decked sections remained positive at 4 % . Elevated values appeared to
experience a decrease in aggregate average value of 8.47%. When compared to at-grade,
elevated and depressed sections were varied in terms of percent change. Land value
adjacent to elevated parcels, though small in terms of aggregate average values, had a
positive value. The depressed values and double-decked sections were more negative in
value when compared to at-grade.
Another way to analyze grade level land value difference is by using the one-point
in-time (1994) approach. The data presented in Table 22 reflect the differences and mean
square meter values by grade level for the after-construction year. According to this
approach, the parcels next to depressed and elevated freeways show a slightly higher
average value across all four cities than properties adjacent to at-grade sections. The at
grade properties have the lowest value per square meter, with elevated values 45.2%
greater than at-grade and depressed values 44.94% greater than at-grade. The mean values
86
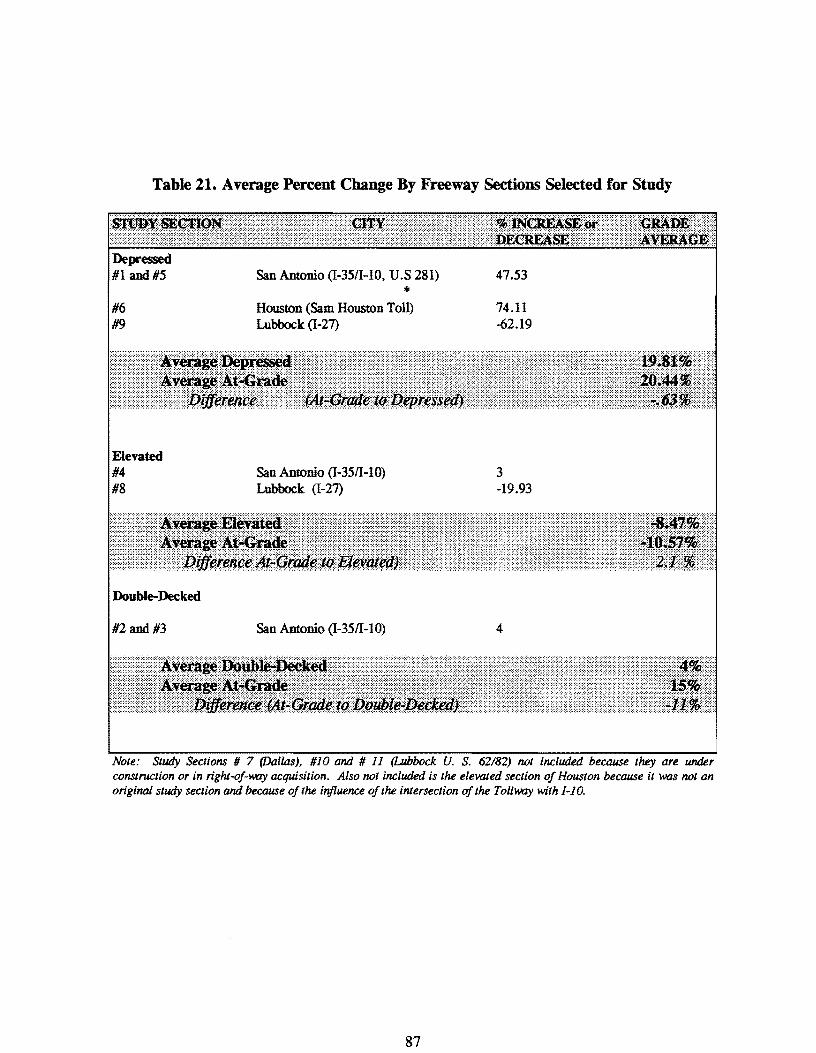
Table 21. Average Percent Change By Freeway Sections Selected for Study
Depressed #1 and#5
#6 #9
Elevated #4 #8
Double-Decked
#2 and #3
San Antonio (I-35/1-10, U.S 281)
* Houston (Sam Houston Toll) Lubbock (1-27)
San Antonio (l-35n-10) Lubbock (I-27)
San Antonio (l-35n-IO)
47.53
74.11 -62.19
3 -19.93
4
Note: Study Sections # 7 (Dallas), #10 and # 11 (Lubbock U. S. 62182) not included because they are under construction or in right-of-way acquisition. Also not included is the elevated section of Houston because it was not an original study section and because of the influence of the intersection of the Tollway with 1-10.
87
per square meter presented in this table show additional variation and different patterns
when viewed by individual city. However, the results tend to confirm the percentage
change findings in Tables 20 and 21 in that land next to elevated sections has experienced
the greatest percentage increase.
Table 22. 1994 Mean Values/Sq. Meter By Grade
GRAIE l.EVliL
At-grade $72.77 $17.34 43.09 6.42 $29.55 *
Elevated 80.30 40.06 * 8.33 42.90 $13.35 (45.2%)
DepresRd 81.33 15.82 68.88 5.29 42.83 $13.28 (44.94%)
Table 23 provides a more in-depth breakdown based on the regression-based land
value index model. For Houston, the residential indices were the same (139) for the
elevated and at-grade freeway levels. There was no land value advantage or disadvantage
for being elevated in comparison with at-grade control sections. In the case of the
depressed grade level, the residential index value of 115 was significantly below the at
grade value of 139. Lubbock residential values also are surprising in that although all
values are negative, suggesting a decline in land values per square meter, the residential
88
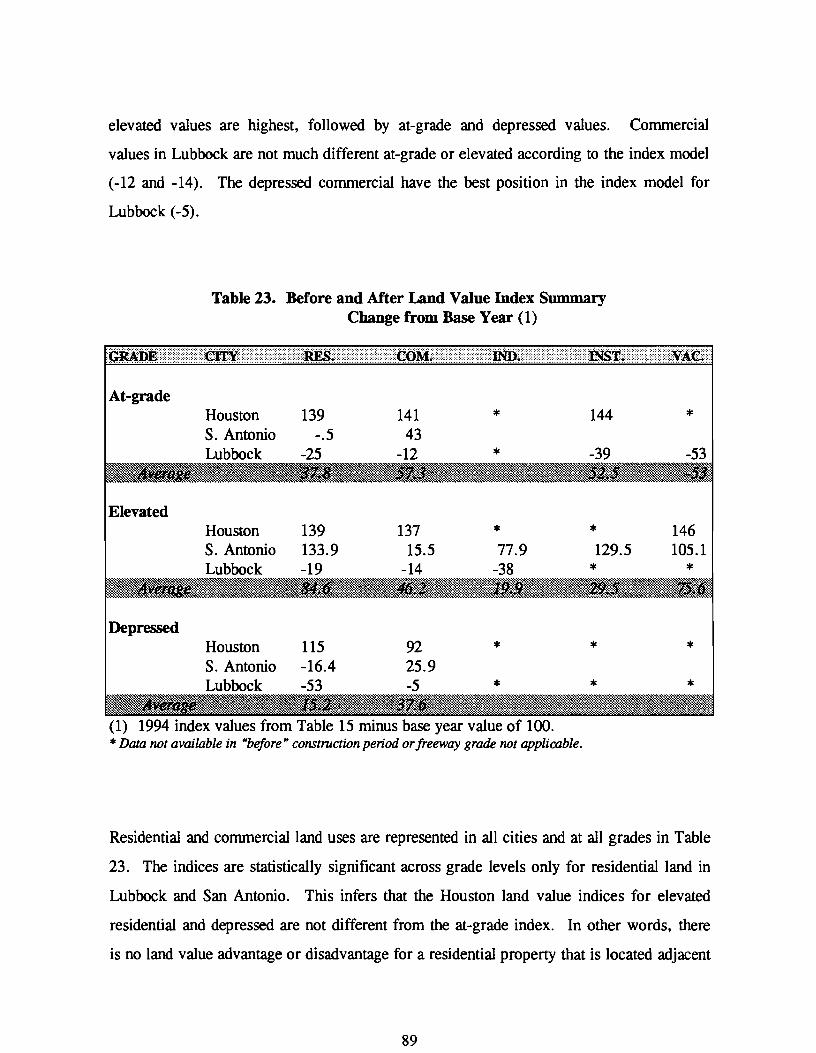
elevated values are highest, followed by at-grade and depressed values. Commercial
values in Lubbock are not much different at-grade or elevated according to the index model
(-12 and -14). The depressed commercial have the best position in the index model for
Lubbock (-5).
At-grade
Table 23. Before and Mter Land Value Index Summary Change from Base Year ( 1)
Houston 139 141 * 144 * S. Antonio -.5 43 Lubbock -25 -12 * -39 -53
~---'l ~"":::.'1%.~~~-~'V"-'-~•~~ · -~~~~ • ._•1%.Wrlllt'lt'\-~-~~~;~~,W~:--~1.~:~~,~-~ ~ '" ' *-."'%:.-1:.~ ;&.'@..~~ J~,,\._'q%_'%,~~~--~~,~ o::W:..":."-'*'*l.%:!:.~::m::..~....m:Tu.\1\;.:..&.~ '~ ~~ ~%:..-.:.":fu::..~, X:
Elevated Houston 139 137 * * 146 s. Antonio 133.9 15.5 77.9 129.5 105.l Lubbock -19 -14 -38 * *
:*w1•i:@:=~@'i~1~11~l"..,%%~--•1t §::::!:: :··. *:·. ·=¥~·-~:~::::.~~~~" .... ~=--··. :~fil:,:::::;:.:J~.:(. ·=· -~= : ::~ "*"-"'! .. :-:~".! .. -..:.: .. :: .. "-:::::.=$!.:S::"!::::=-.-....:::::..-.::::: ...... -:o:-: ... :-... .:~'.v... ..... ,~.§: ~--::..~ ... :-::: .. -:«~ .. x.
Depr~d
Houston 115 92 * * * s. Antonio -16.4 25.9 Lubbock -53 -5 * * * , ~~~ '"W-~~'"W!"""t.~ · ~ ~1'~-~1:'l"'<'=-~T~~lfil:~T@W@:>~>.:mti@*Ffu.."%-=:::::~'*91&W::Tu.%'9@:'l ,. :.,.,:x. ·. :. ·&\h~w&,:w~ ; :=··,•~~~~~'\~~;l~i@4--f)iitt~ti'i't¥M1fu~Rill1#[@\i'ti¥l•~lt'%:t
(1) 1994 index values from Table 15 minus base year value of 100. * Data not available in "before,. construction period or freeway grade not applicable.
Residential and commercial land uses are represented in all cities and at all grades in Table
23. The indices are statistically significant across grade levels only for residential land in
Lubbock and San Antonio. This infers that the Houston land value indices for elevated
residential and depressed are not different from the at-grade index. In other words, there
is no land value advantage or disadvantage for a residential property that is located adjacent
89
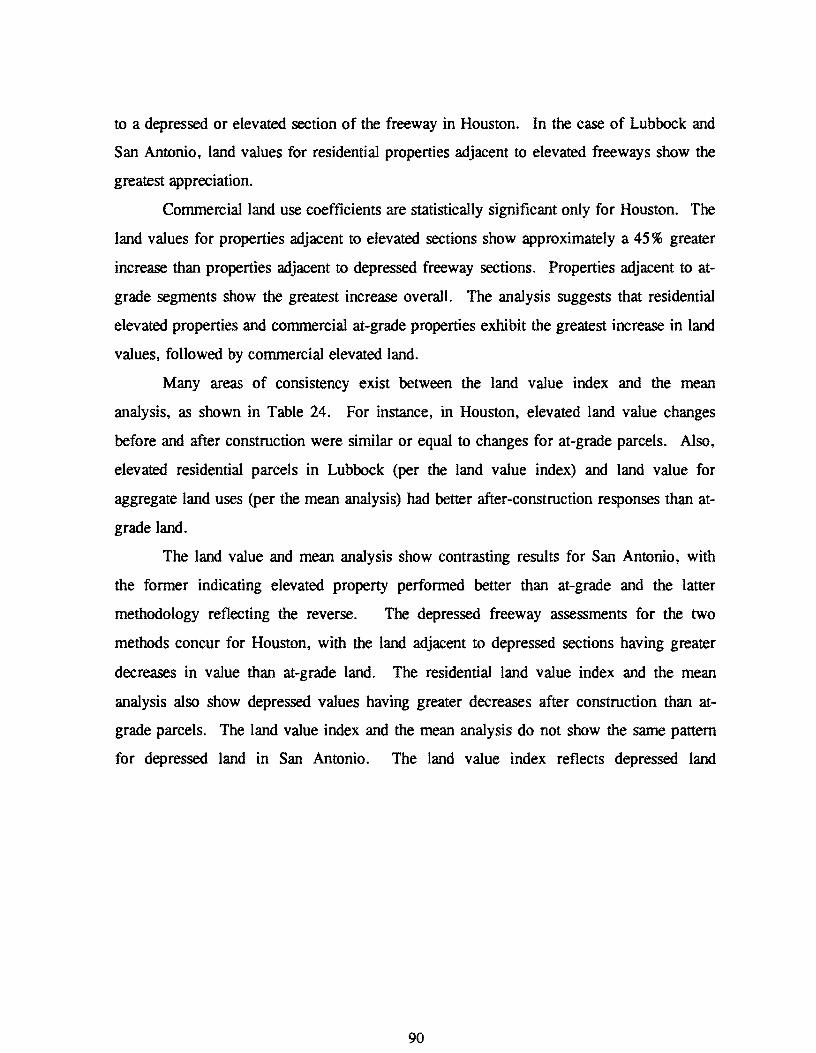
to a depressed or elevated section of the freeway in Houston. In the case of Lubbock and
San Antonio, land values for residential properties adjacent to elevated freeways show the
greatest appreciation.
Commercial land use coefficients are statistically significant only for Houston. The
land values for properties adjacent to elevated sections show approximately a 45% greater
increase than properties adjacent to depressed freeway sections. Properties adjacent to at
grade segments show the greatest increase overall. The analysis suggests that residential
elevated properties and commercial at-grade properties exhibit the greatest increase in land
values, followed by commercial elevated land.
Many areas of consistency exist between the land value index and the mean
analysis, as shown in Table 24. For instance, in Houston, elevated land value changes
before and after construction were similar or equal to changes for at-grade parcels. Also,
elevated residential parcels in Lubbock (per the land value index) and land value for
aggregate land uses (per the mean analysis) had better after-construction responses than at
grade land.
The land value and mean analysis show contrasting results for San Antonio, with
the former indicating elevated property performed better than at-grade and the latter
methodology reflecting the reverse. The depressed freeway assessments for the two
methods concur for Houston, with the land adjacent to depressed sections having greater
decreases in value than at-grade land. The residential land value index and the mean
analysis also show depressed values having greater decreases after construction than at
grade parcels. The land value index and the mean analysis do not show the same pattern
for depressed land in San Antonio. The land value index reflects depressed land
90
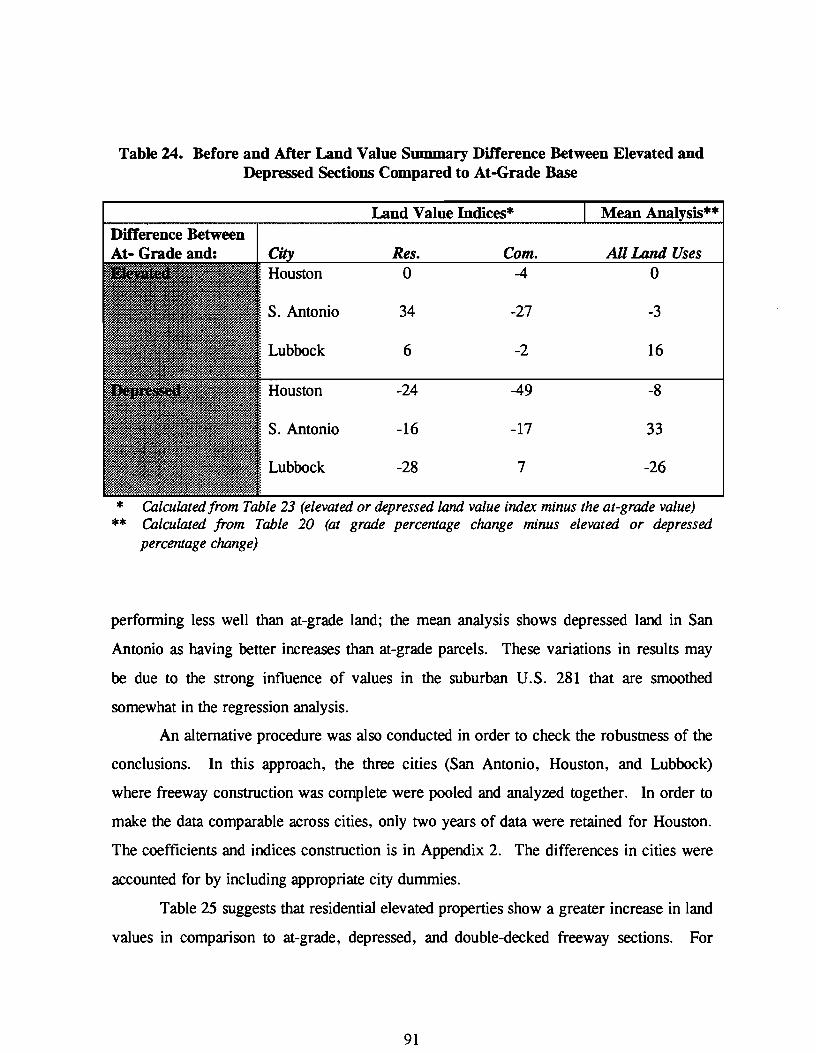
Table 24. Before and After Land Value Summary Difference Between Elevated and Depr~d Sections Compared to At-Grade Base
Land Value Indices* Mean Analysis** Difference Between At- Grade and: Res. Com. All Land Uses
0 -4 0
34 -27 -3
6 -2 16
-24 -49 -8
-16 -17 33
-28 7 -26
* Calculated from Table 23 (elevated or depressed land value index minus the at-grade value) ** Calculated from Table 20 (at grade percentage change minus elevated or depressed
percentage change)
performing less well than at-grade land; the mean analysis shows depressed land in San
Antonio as having better increases than at-grade parcels. These variations in results may
be due to the strong influence of values in the suburban U.S. 281 that are smoothed
somewhat in the regression analysis.
An alternative procedure was also conducted in order to check the robustness of the
conclusions. In this approach, the three cities (San Antonio, Houston, and Lubbock)
where freeway construction was complete were pooled and analyzed together. In order to
make the data comparable across cities, only two years of data were retained for Houston.
The coefficients and indices construction is in Appendix 2. The differences in cities were
accounted for by including appropriate city dummies.
Table 25 suggests that residential elevated properties show a greater increase in land
values in comparison to at-grade, depressed, and double-decked freeway sections. For
91

commercial properties, at-grade parcels show the greatest appreciation followed by
elevated parcels, then depressed and double-decked properties.
The combined city analysis supports the results shown in previous tables. In
general, the various approaches lead to the same conclusions: elevated residential
properties show the greatest appreciation over the base year. Residential depressed land
values exhibited the least appreciation.
Table 25. Combined City Regression Approach: Before Construction and After Construction Land Value Index Summary ( 1)
32 107 * 109 -2 63 37 -33 30 53
(31) (-70) (55) 26 22 * * *
(-6) (-85) 8 6 -12 152 -37
(-24) (-101) (-35)
(Difference From At-Grode) (1) 1994 index values minus base year value of 100. *Data not available in "before" construction period or freeway grade not applicable.
For commercial land, at-grade parcels showed the greatest increase, followed by
property adjacent to elevated sections. Previous research confirms that commercial
properties benefit from the greater visibility afforded by at-grade and elevated locations.
A survey conducted as a part of this research (reported in 1327-1) found that many
residents generally prefer depressed freeways to elevated freeways, especially residents in
Houston and Dallas. However, more than 25 % of respondents in Houston, San Antonio,
and Lubbock indicated 1W preference between freeway grades. Survey results are shown in
Table 26.
92
Table 26. Adjacent Resident Preference for Freeway Type
Houston Dallas San Antonio Lubbock Overall ............................................................................................................... H ...................................................................................................... H ............... H ......... H .......... - ........................................................................................... ..
Depr~d 58% 58% 17% 26% 32%
Elevated 13% 15% 29% 21% 23%
No Preference 26% 16% 41% 32% 33%
Not Sure 3% 11% 13% 21% 12%
The land value analysis in this report shows that residential land adjacent to elevated
freeways experienced greater after-construction increases than residential land at other
grades. Other previous research has shown that the positive residential land value response
may be partially attributed to increased accessibility. The land value findings suggest that
other variables are off-setting the general negative reaction to elevated freeways.
93

SUMMARY OF FINDINGS
The literature regarding land value impacts was largely developed between the 1950s
and early 1980s. Some clear patterns emerged from these early studies that set the direction
for this research and structured the analysis. The concepts under analysis include the
following:
• A "life cycle" effect is present in which property values decrease during
construction and rebound to pre-construction values in roughly five years after
operation begins. Depending on the land use and the local economy, values may
continue to rise. Cities with strong land use controls were expected to have more
favorable land value responses and fewer decreases in land value.
• Freeway grade has a consistent impact on land value, with the depressed sections
having the highest land value for residential, and at-grade having the highest value
for commercial properties; the least valuable property for all land uses is elevated.
The rationale is that the less visible the freeway and the less noise, emissions, and
other negative effects are experienced, the higher the value to residential owners.
Commercial uses prefer the high visibility available at-grade.
• It is known that land use influences value. Generally, commercial land use
commands the highest value regardless of elevation. The land value response of
residential properties has been found to be related to the level of accessibility to
the freeway. If the freeway is constructed in such a manner as to require circuitous
routing or otherwise hinder access by adjacent residents, residential values will
have a negative reaction. If access is considered good by residential dwellers, the
property value may respond favorably to proximity to the freeway.
The findings are based on a mean value analysis and an index model based on
regression analysis of data drawn from freeway sections in four cities. The analysis of freeway
95
segments in Texas supports the trends reported in previous literature but offers additional
insight. Certain freeway sections followed the expected pattern, in some cases; however,
other sections were identified which did not conform to expectations.
Life Cycle EfTect: One area that matches trends noted in previous research is the
"Life Cycle Effect." This phenomenon was examined by nature of the Houston section that
has been operational for seven years and the San Antonio 1-10 I 1-35 section openings which
were staggered over a two to ten year period. These two cities represent values during the
more mature operational stages. The Lubbock 1-27 has been operational for 4 years and is
still in the period of adjustment after construction. Dallas' North Central Expressway is under
construction as this report is being written and, thus, will reflect values during such a stage.
Findings are as described below:
• Based on the mean value analysis, the mature :freeways in Houston and San
Antonio show values that are generally higher than pre-construction values (in
constant $). Such was the case for all land uses in Houston and commercial,
residential, and institutional uses in San Antonio. Exceptions are in the depressed
section, and industrial and vacant land uses for San Antonio.
• Lubbock's 1-27 adjacent values, which have not yet reached the fifth operation
year following construction, have not returned to pre-construction year levels.
The mean value analysis shows that properties of all land uses and all freeway
grades decreased in value over the study period. However, the observed values
must be viewed from the perspective that total aggregate market value decreased
for the county as a whole during the study period. Thus, the drop in value does
not appear to be fully attributable to the development of the freeway. Lubbock has
strong land use controls and has set mandates for redevelopment of property along
this corridor, which may explain the smallest decrease in value (12.51% for
commercial uses) when compared with pre-construction levels. All other land uses
decreased more than 40%. The zoning requirements for commercial property
establish distance and design standards that encourage more attractive and upscale
commercial property than what existed prior to freeway construction.
96
By Freeway Grade: There are three methods by which the findings from the
freeway grade assessment can be viewed: by percentage change, by mean value per square
meter, and by regression land value indices. As anticipated, based on previous literature,
the percentage change data show parcels adjacent to at-grade and depressed freeways
experience greater percentage increases or smaller percentage decreases before and after
construction than elevated parcels. An aggregate of Houston, San Antonio, and Lubbock
values shows an 18.13% increase in at-grade and a 4.6% increase in depressed sections,
but a decrease of 8.47% in elevated values.
While these general trends hold in the aggregate, parcels may exhibit variances, as
described below:
• Properties next to elevated sections do not always exhibit deflated values
compared to other grades. Parcels adjacent to elevated properties sometimes
have higher values than properties next to at-grade or depressed sections. In the
San Antonio urban area, the percentage change in the elevated section
experienced a 3 % increase in value compared to a 9 % decrease in the depressed
section. This type of observation is supported by the regression land value
index in Lubbock which shows the elevated residential values as slightly higher
than at-grade and much higher than in depressed sections.
• While depressed properties sometimes showed the highest mean value per
square meter, as in suburban San Antonio and Houston, other areas show a
different pattern. For instance, in Lubbock and urban San Antonio, elevated
property has the highest value.
97
• The regression indices for Houston indicate the residential values were the same
at the elevated and at-grade freeway levels. Lubbock exhibited its highest index
for residential elevated, followed by residential at-grade and depressed.
• San Antonio had the only double-decked sections in the study. The percentage
change data showed that values adjacent to the two level structures increased
4%, less than the at-grade (15%), but slightly more than elevated (3%) and
much more than depressed (-9%).
By Land Use: The mean values per square meter are consistent with findings from
previous studies in that commercial, institutional, and industrial uses tend to have the
higher values compared to other land uses, regardless of grade. Such is the case for mean
values in all cities. Another finding is the high value of vacant property in Dallas that
accounts for more than 25% of the parcels along the North Central Expressway. Most of
this property is :zoned for commercial development which would conform to the previous
findings of commercial property as a preferred land use adjacent to freeways. Vacant
parcels also show strong value per square meter in Houston and San Antonio.
98
RECOMMENDATIONS
This study set out to determine how variations in freeway grade influence land value.
A related issue was the influence of land use on that process. Many previous decisions
regarding freeway construction have been made based on prior research and conventional
wisdom that a community would be best served if the freeway was depressed or at-grade.
The data from this study essentially concur with that point and lead to the following
recommendations.
• TxDOT should continue to construct freeways at-grade and depressed as the
preferred conditions where terrain, cost, and other conditions allow. However,
this research contains evidence that elevated parcels have strong land values, in
some cases. Thus, freeway grade as an independent variable does not
necessarily negatively impact land value. Indeed, some residential and
commercial property values were noted to have faired well next to elevated
configurations. TxDOT should seek to verify those variables that mitigate the
potential negative land value effect of elevated structures.
• Since negative influence was mitigated on some elevated property values in this
research, TxDOT should conduct additional studies to determine the nature and
magnitude of these mitigating variables. Other research has noted that land
value is influenced by land use policy, accessibility to the freeway, life cycle,
and any number of additional variables. Since freeway grade works with other
variables to predict land value response, what are these additional variables,
what specifically is the contribution of freeway grade, and how are the freeway
and variables working in tandem to impact land values? Issues should be
included such as whether the majority of the right-of-way was available at the
start of the project, as opposed to a large number of "takes" being required. In
Houston, a large amount of the right-of-way had been reserved, and in San
Antonio, the footprint of the existing freeway formed the primary path. The
99
additional acquisitions were minimized in both cases. If this is a valid rationale,
the land next to the Dallas North Central Expressway should rebound well when
construction has been completed.
• TxDOT should consider city economy as an indicator of land value response
adjacent to a freeway. It is known that city economic conditions and a series of
other variables play a role in property values. To what degree was not the focus
of this study. The question of background economic condition of the region
could be investigated in greater detail. In the two cities (Houston and San
Antonio) where adjacent values were the strongest regardless of grade, the
aggregate market values in the cities rose. In the two cities where adjacent
values were down (Lubbock and Dallas), aggregate market values were down as
well.
• Next, does the character of the adjacent community serve to strengthen the
properties adjacent to the freeway and off set potential negative effects? The
Memorial residential communities in Houston represent some of the more
affluent in that city and border much of the residential that is adjacent to the
freeway. Likewise, the expensive property in downtown San Antonio may
exert some influence on values next to I-35 and I-10.
• TxDOT may utili7.C findings from this process as a base of comparison in
projecting the land value response of potential new freeways utilizing the
methodology in Appendix 4.
• Additional research with a more extensive data base could be conducted to
further verify the "life cycle effect" in Texas. Another point of consideration
for TxDOT is what can be done to mitigate the life cycle effect. Tremendous
efforts are already underway to maintain as accessible an environment for
businesses, residents, and others as possible during construction phasing.
100
Schedules are developed to minimize disruptions; driveways are maintained to
allow entrance and egress. Overall community mobility goals have long
accepted short-term construction interruptions as part of the price of progress.
Still, additional methods to relieve the impact of construction may be beneficial.
101

BIBLIOGRAPHY
Adkins, William G. Effects of the Dallas Central Expressway on Land Values and Land Use. TTI Research Project 101, Bulletin 6, September 1957.
Ashley, Roger H. and William F. Berard. Proximity Study No. 203. Michigan State Highway: A Comparison of Economic Effects of an Above Grade Freeway on a Residential Subdivision versus Alternate Land Uses. U.S. Department of Commerce, Bureau of Public Roads. March 1965.
Buffington, Jesse L., Cary W. Herndon, and Michael E. Weiss. Non-user Impacts of Different Highway Designs as Measured by Land Use and Land Value Changes. Research Report 225-2. Research Study Number 2-8-77-225. State Department of Highways and Public Transportation in Cooperation with Federal Highway Administration. March 1978.
Buffington, Jesse L. and Cary W. Herndon, Jr. Land Use Impact of Improving Sections Three of Westheimer Road in a Developing Area in Houston, Texas. (Interim) Research Report 225-16. Research Study 2-8-77-225, State Department ofHighways and Public Transportation. January 1981.
Buffington, Jesse L., Dock Burke, William G. Adkins, and Hugo G. Meuth. Experiences and Opinions of Residents along Elevated, Depressed, and On-Grade Freeway Sections in Houston, Texas. Texas Transportation Institute, Texas A&M University, College Station, Texas. 1971.
Chui, Margaret K., Jeffery L. Memmott, and Jesse L. Buffington. Predicting the Effects of Roadway Improvements on Land Use and Traffic Volumes. Research Report 225-27. Study No. 2-8-77-225. July 1983.
Cohen, Jacob and Patrica Cohen. Applied Multiple Regression/Correlation Analysis for the Belzavorial Sciences. Lawrence Erlbaum Associates, Publishers. Hillsdale, New Jersey. 1983.
Downs, Anthony. How Transportation Arteries Impact Land Value: Urban Transportation Perspectives and Prospects. Edited by Herbert Levinson and Robert A. Weant. Eno Foundation for Transportation, Inc., Westport, Connecticut, 1982.
103
Federal Highway Administration and State Highway Commission of Kansas. Draft Environmental Impact Statement. Widening and Other Improvements of. 05 78 mile of Kellogg (US. 54/K96) and .0433 mile of Hillside. October 1972.
The Houston Almanac. City of Houston Planning and Development Department. January 1994
ITE Project Committee 4E-A, Pedestrian Overcrossings-Criteria and Priorities. An ITE Infonnational Report. Traffic Engineering. October 1972.
ITE Technical Council Committee 6A9, Environmental Impacts of Elevated and Depressed Urban Freeways. Traffic Engineering. Infonnational Report, February 1976.
Krueckeberg, Donald A. and Arthur L. Silvers. Urban Planning Analysis: Methods and Models. John Wtley & Sons, Inc. New York. 1974.
Langley, C. J. Highway and Property Values: The Washington Beltway Revisited. Transportation Research Board, National Academy of Sciences-National Research Council, Washington, D. C. January 1981.
Metropolitan Transit Authority. Technical Memorandum. Service Development. 1988
Miller, S. F. Effects of Proposed Highway Improvement on Property Values. National Cooperative Highway Research Program Report No. 114, Transportation Research Board, National Research Council. Washington, D. C. 1971.
Palmquist, Raymond. The Im[Xlct of Highway Improvements on Property Values in Washington State. Transportation Research Record 887.
Roberts, James E. Double-Decking the Freeways. Civil Engineering, November 1991, p.48.
Rollins, John B., Jeffery L. Memmott, and Jesse L. Buffington. Effects of Roadway Improvements on Adjacent Land Use: An Aggregative Analysis and the Feasibility of Using Urban Development Models. (Interim) Research Report 225-22. Research Study 2-8-77-225. State Department of Highways and Public Transportation. May 1981.
104
Scurry, Floyd David. The Economic Effects of Elevated and Depressed Freeways on Adjacent Property Owners. (Thesis, May 1995). Submitted to the Office of Graduate Studies of Texas A & M University.
Silver, Marschall L., Ted B. Belytschko, and Michael Gelick. An Integrated EngineeringP/anning Approach to the Preservation, Improvement, and Replacement of Elevated Transportation Stroctures.
Tomassik, Jack. Mountain West. Socioeconomic and Land Value Impact of Urban Freeways in Arizona. Prepared for Arizona Department of Transportation, October 1987.
105

APPENDIXl
Survey of Statewide TxDOT District Engineers for Freeway Sections for Inclusion in the Study
107

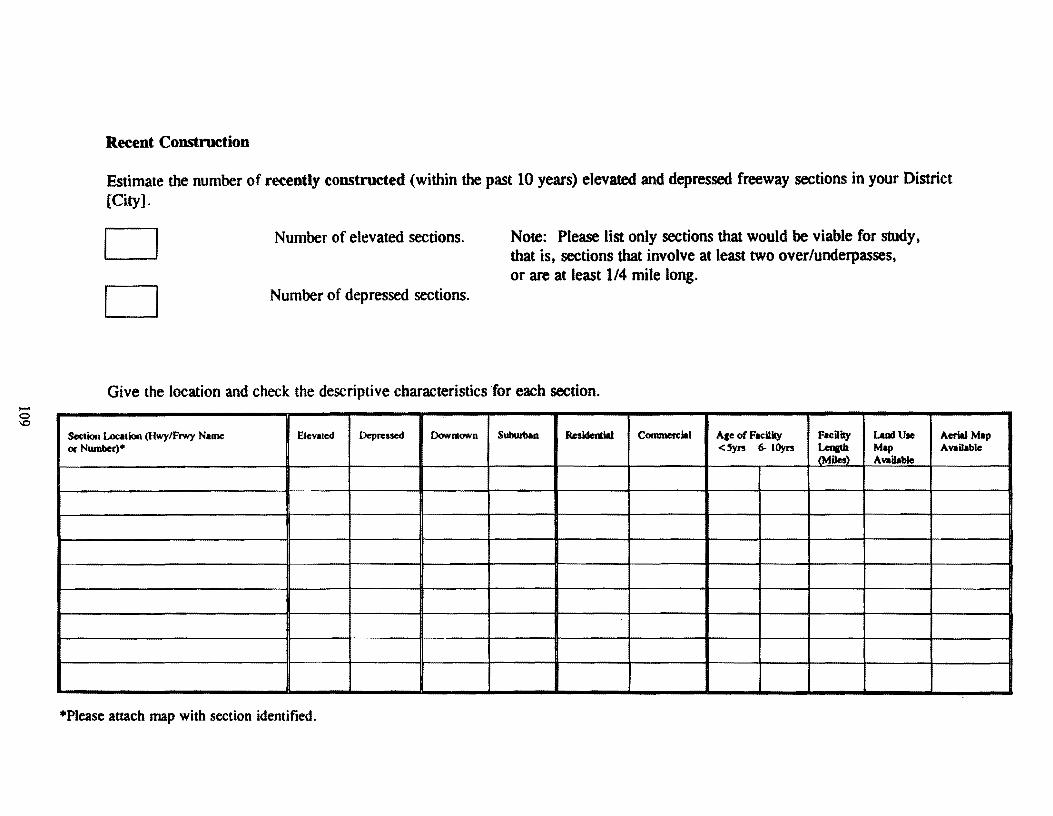
-~
Recent Construction
Estimate the number of recently constructed (within the past 10 years) elevated and depressed freeway sections in your District [City].
D Number of elevated sections.
D Number of depressed sections.
Note: Please list only sections that would be viable for study, that is, sections that involve at least two over/underpasses, or are at least 1 /4 mile long.
Give the location and check the descriptive characteristics for each section.
Section Location (Hwy/Frwy Name: Elevated Depressed Dow.-awn Sullwt>an Rcsidemlal Commercial Ace of Facility Facility Lao4 U1e or Number)• <'yrs 6- IOyrs ~ Map
IMjJes) Available
•Please attach map with section identified.
Aerial Map Available
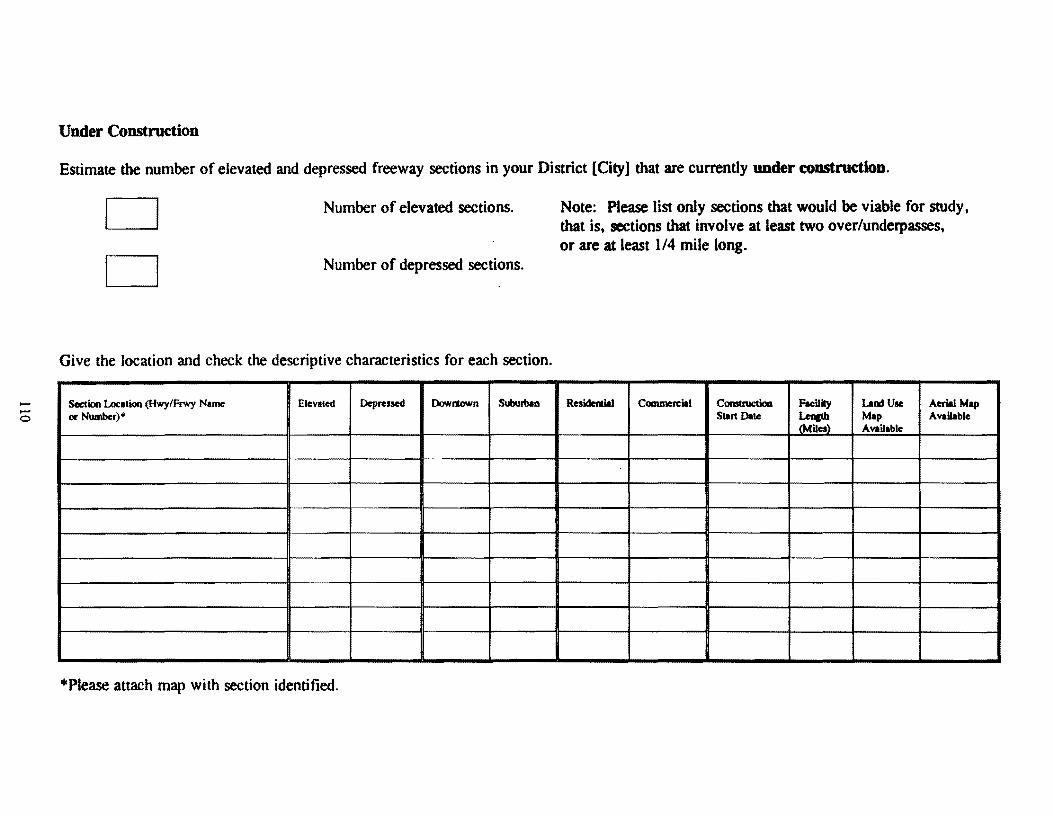
--0
Under Construction
Estimate the number of elevated and depressed freeway sections in your District [City] that are currently under construction.
D Number of elevated sections.
D Number of depressed sections.
Give the location and check the descriptive characteristics for each section.
Section Location (Hwy/Frwy Name Elevated Depressed Dolli mown Subwban or Number)•
•Please attach map with section identified.
Note: Please list only sections that would be viable for study. that is, sections that involve at least two over/underpasses, or are at least 114 mile long.
Residcfltial Commercial Comuuction Facilily Land Use Aerial Map Start Date Ltnatb Map Available
<Miles) Available
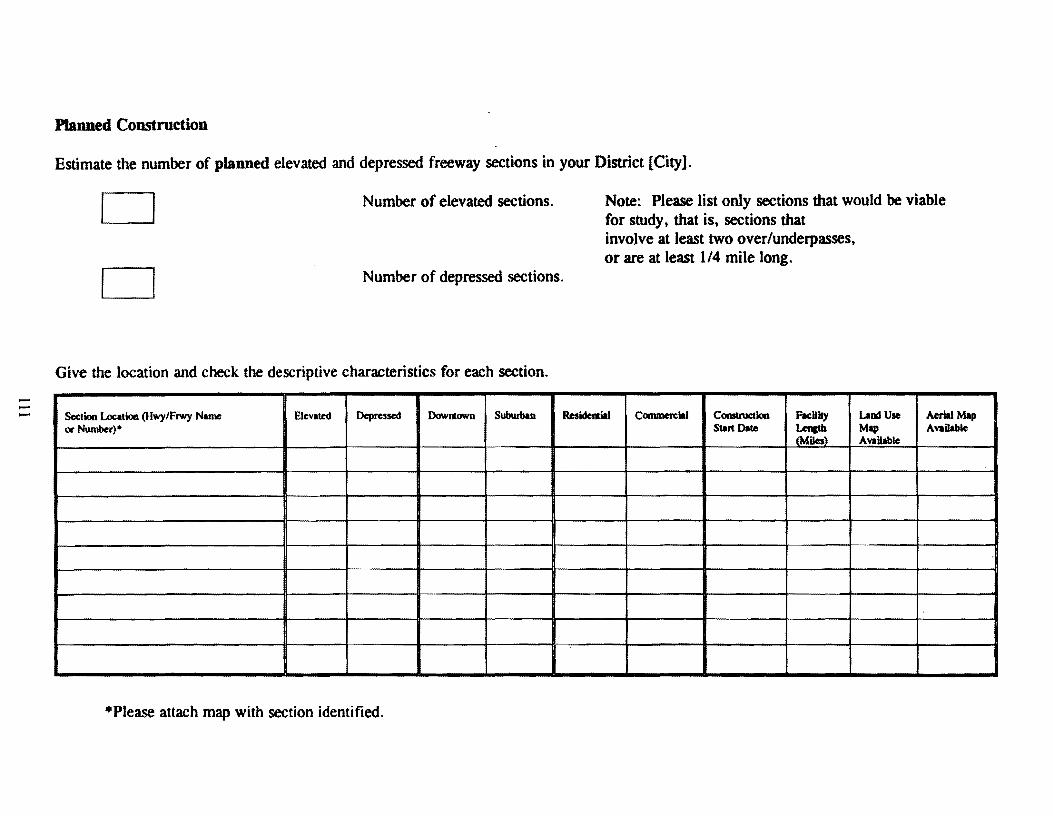
---
Planned Construction
Estimate the number of planned elevated and depressed freeway sections in your District [City].
D Number of elevated sections.
D Number of depressed sections.
Give the location and check the descriptive characteristics for each section.
Note: Please list only sections that would be viable for study, that is, sections that involve at least two over/underpasses, or are at least 114 mile long.
Section Location (Hwy/Frwy Name Elevated Depressed Dowmown Subwban Retiderlial Commcn:ial Comtruction Facility uodUse Aerial Map or Number)• Sun Date ~ Map Available
lMiles) Available
•Please attach map with section identified.

APPENDIX2
Land Value Index Calculation
113

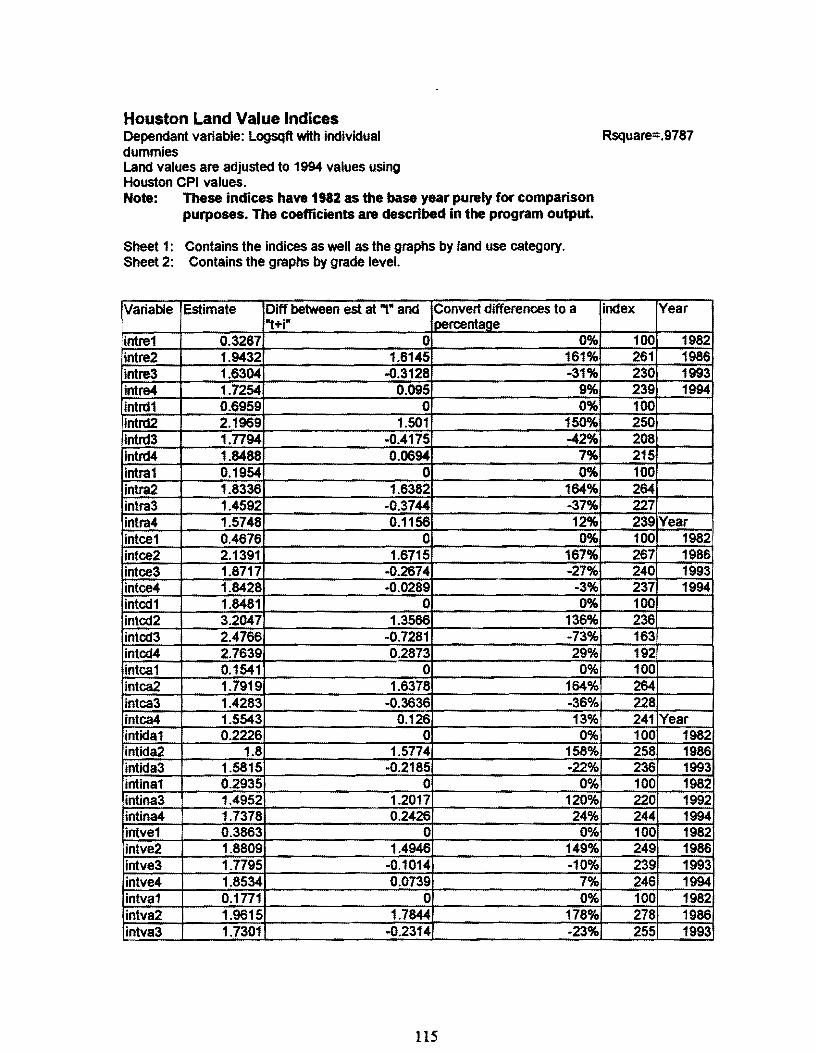
Houston Land Value Indices Dependant variable: Logsqft with individual Rsquare=.9787 dummies Land values are adjusted to 1994 values using Houston CPI values. Note: These indices have 1982 as the base year purely for comparison
purposes. The coefficients are described in the program output.
Sheet 1: Contains the indices as well as the graphs by land use category. Sheet 2: Contains the graphs by grade level.
'Variable Estimate Diff between est at .,. and Convert differences to a "t+i" loercentaae
intre1 0.3287 0 0% intre2 1.9432 1.6145 161% intre3 1.6304 -0.3128 -31% intre4 1.7254 0.095 9% intrd1 0.6959 0 0% intrd2 2.1969 1.501 150% intrd3 1.7794 -0.4175 -42% intrd4 1.8488 0.0694 7% intra1 0.1954 0 0% intra2 1.8336 1.6382 164% intra3 1.4592 -0.3744 -37% intra4 1.5748 0.1156 12% intce1 0.4676 0 0% intce2 2.1391 1.6715 167% intce3 1.8717 -0.2674 -27% intce4 1.8428 -0.0289 -3% intcd1 1.8481 0 0% intcd2 3.2047 1.3566 136% intcd3 2.4766 -0.7281 -73% intcd4 2.7639 0.2873 29% intca1 0.1541 0 0% intca2 1.7919 1.6378 164% intca3 1.4283 -0.3636 -36% intca4 1.5543 0.126 13% intida1 0.2226 0 0% intida2 1.8 1.5774 158% intida3 1.5815 -0.2185 -22% intina1 0.2935 0 0% intina3 1.4952 1.2017 120% intina4 1.7378 0.2426 24% intve1 0.3863 0 0% intve2 1.8809 1.4946 149% intve3 1.7795 -0.1014 -10% intve4 1.8534 0.0739 7% intva1 0.1771 0 0% intva2 1.9615 1.7844 178% intva3 1.7301 -0.2314 -23%
ll5
index Year
100 1982 261 1986 230 1993 239 1994 100 250 208 215 100 264 227 239 Year 100 1982 267 1986 240 1993 237 1994 100 236 163 192 100 264 228 241 Year 100 1982 258 1986 236 1993 100 1982 220 1992 244 1994 100 1982 249 1986 239 1993 246 1994 100 1982 278 1986 255 1993
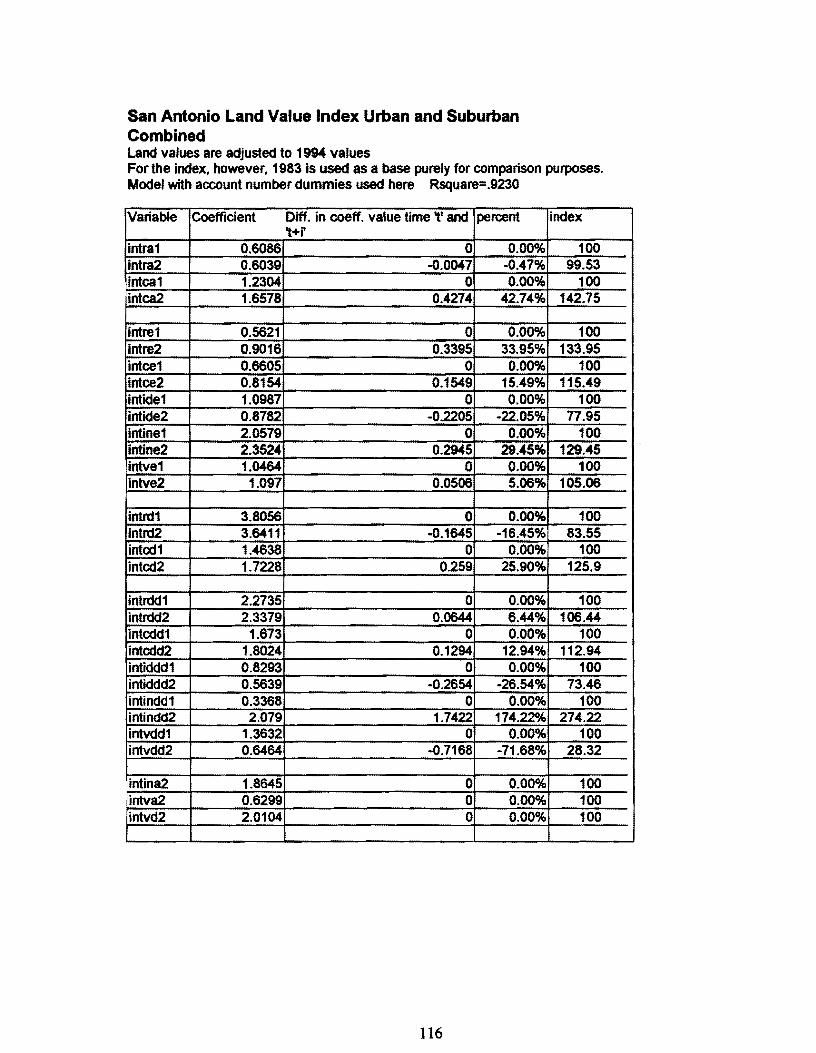
San Antonio Land Value Index Urban and Suburban Combined Land values are adjusted to 1994 values For the index, however, 1983 is used as a base purely for comparison purposes. Model with account number dummies used here Rsquare=.9230
Variable Coefficient Diff. in coeff. value time 't' and percent index 't+i'
intra1 0.6086 0 0.00% 100 intra2 0.6039 -0.0047 -0.47% 99.53 intca1 1.2304 0 0.00% 100 intca2 1.6578 0.4274 42.74% 142.75
intre1 0.5621 0 0.00% 100 intre2 0.9016 0.3395 33.95% 133.95 intce1 0.6605 0 0.00% 100 intce2 0.8154 0.1549 15.49% 115.49 intide1 1.0987 0 0.00% 100 intide2 0.8782 -0.2205 -22.05% 77.95 intine1 2.0579 0 0.00% 100 intine2 2.3524 0.2945 29.45% 129.45 intve1 1.0464 0 0.00% 100 intve2 1.097 0.0506 5.06% 105.06
intrd1 3.8056 0 0.00% 100 intrd2 3.6411 -0.1645 -16.45% 83.55 intcd1 1.4638 0 0.00% 100 intcd2 1.7228 0.259 25.90% 125.9
intrdd1 2.2735 0 0.00% 100 intrdd2 2.3379 0.0644 6.44% 106.44 intcdd1 1.673 0 0.00% 100 intcdd2 1.8024 0.1294 12.94% 112.94 intiddd1 0.8293 0 0.00% 100 inticldd2 0.5639 -0.2654 -26.54% 73.46 intindd1 0.3368 0 0.00% 100 intindd2 2.079 1.7422 174.220-4 274.22 intvdd1 1.3632 0 0.00% 100 intvdd2 0.6464 -0.7168 -71.68% 28.32
intina2 1.8645 0 0.00% 100 intva2 0.6299 0 0.00% 100 intvd2 2.0104 0 0.00% 100
116
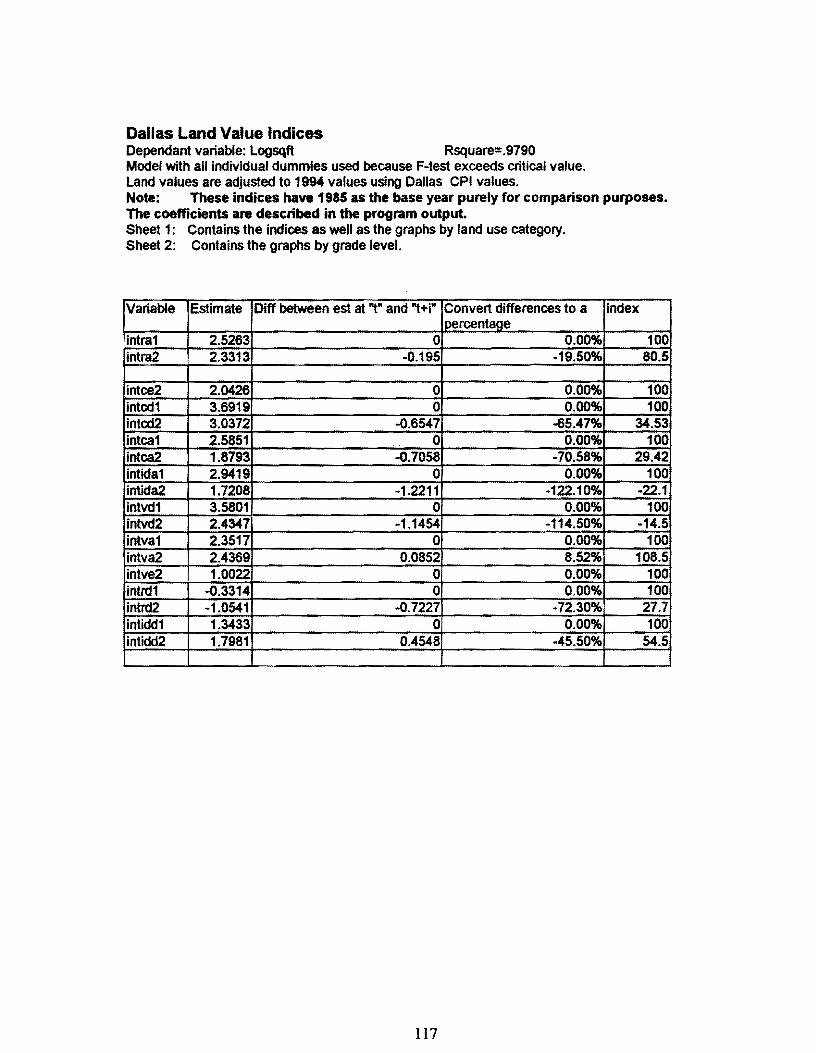
Dallas Land Value Indices Dependant variable: Logsqfl Rsquare=.9790 Model with all individual dummies used because F-test exceeds critical value. Land values are adjusted to 1994 values using Dallas CPI values. Note: These indices have 1985 as the base year purely for comparison purposes. The coefficients ant described in the program output. Sheet 1: Contains the indices as well as the graphs by land use category. Sheet 2: Contains the graphs by grade level.
Variable Estimate Diff between est at "t" and "t+i" Convert differences to a oercentage
intra1 2.5263 0 0.00% intra2 2.3313 -0.195 -19.50%
intce2 2.0426 0 0.00% intcd1 3.6919 0 0.00% intcd2 3.0372 -0.6547 -65.47% intca1 2.5851 0 0.00% intca2 1.8793 -0.7058 -70.58% intida1 2.9419 0 0.00% intida2 1.7208 -1.2211 -122.10% intvd1 3.5801 0 0.00% intvd2 2.4347' -1.1454 -114.50% intva1 2.3517 0 0.00% intva2 2.4369 0.0852 8.52% intve2 1.0022 0 0.00% intrd1 -0.3314 0 0.00% intrd2 -1.0541 -0.7227 -72.30% intidd1 1.3433 0 0.00% intidd2 1.7981 0.4548 -45.50%
117
index
100 80.5
100 100
34.53 100
29.42 100
-22.1 100
-14.5 100
108.5 100 100
27.7 100
54.5
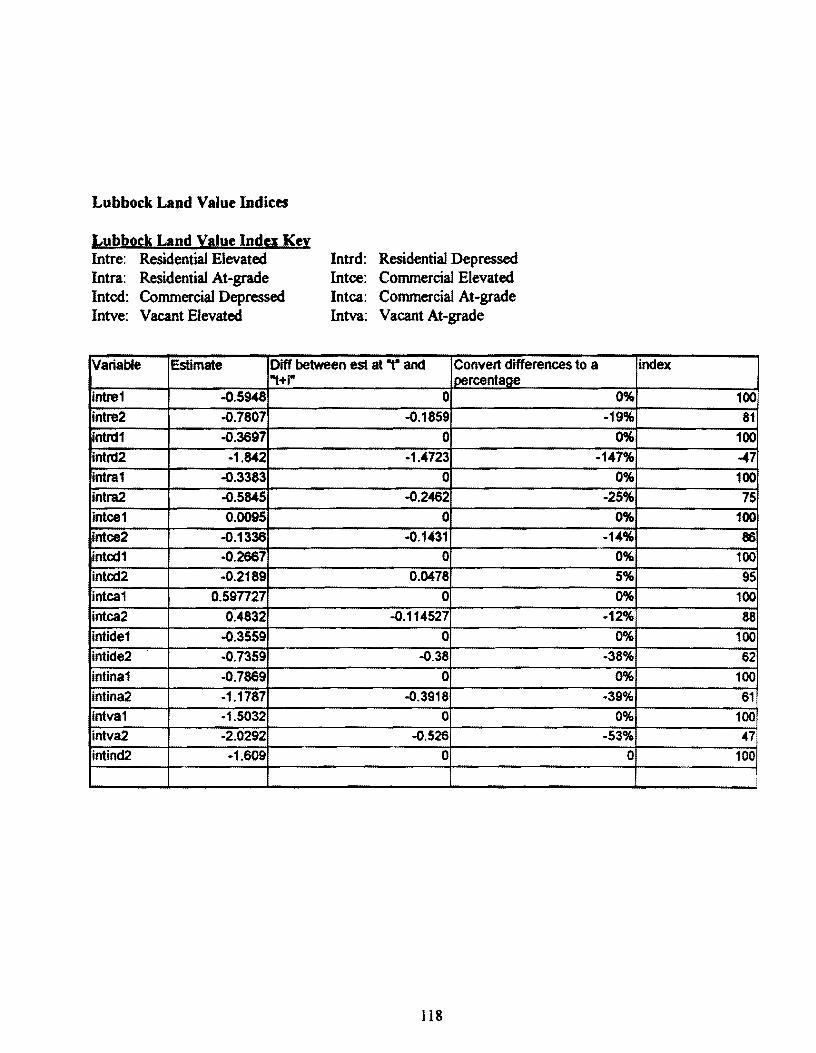
Lubbock Land Value Indices
Lubbock Land value Index Key Intre: Residential Elevated Intra: Residential At-grade lntcd: Commercial Depressed lntve: Vacant Elevated
Intrd: Residential Depressed Intce: Commercial Elevated Intca: Commercial At-grade Intva: Vacant At-grade
Variable Estimate Diff between est at i· and Convert differences to a i+;• oercentaae
intre1 -0.5948 0 0%
intre2 -0.7807 -0.1859 -19%
intnt1 -0.3697 0 0%
intrd2 -1.842 -1.4723 -147%
intra1 -0.3383 0 0%
intra2 -0.5845 -0.2462 -25%
intce1 0.0095 0 0%
intce2 -0.1336 -0.1431 -14%
intcd1 -0.2667 0 0%
intcd2 -0.2189 0.0478 5%
intca1 0.597727 0 0%
intca2 0.4832 -0.114527 -12%
intide1 -0.3559 0 0%
intide2 -0.7359 -0.38 -38%
intina1 -0.7869 0 0%
intina2 -1.1787 -0.3918 -39%
intva1 -1.5032 0 0%
intva2 -2.0292 -0.526 -53%
intind2 -1.609 0 0
118
index
100
81
100
-47
100
75
100
86 100
95
100
88 100
62 100
61
100
~7
100
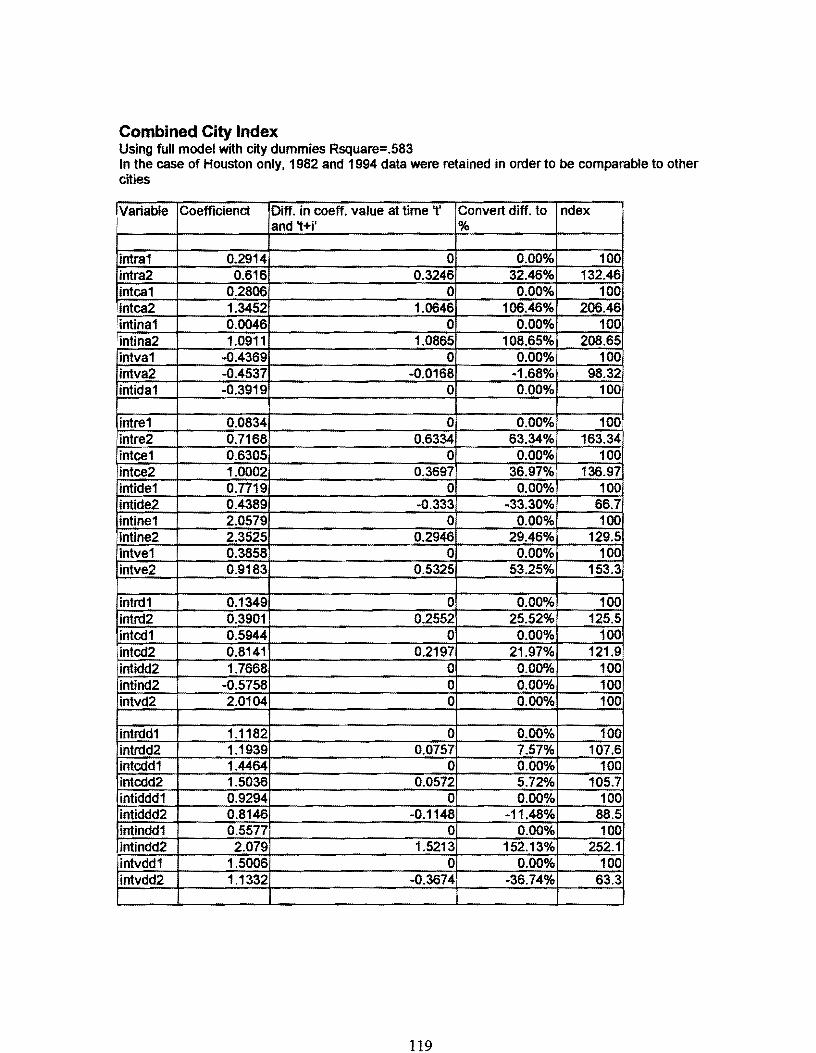
Combined City Index Using full model with city dummies Rsquare=.583 In the case of Houston only, 1982 and 1994 data were retained in order to be comparable to other cities
I Variable Coefficienct Diff. in coeff. value at time 't' Convert diff. to ndex and 't+i' %
intra1 0.2914 0 0.00% 100 intra2 0.616 0.3246 32.46% 132.46 intca1 0.2806 0 0.00% 100 intca2 1.3452 1.0646 106.46% 206.46
1intina1 0.0046 0 0.00% 100 1intina2 1.0911 1.0865 108.65% 208.65 intva1 -0.4369 0 0.00% 100 intva2 -0.4537 -0.0168 -1.68% 98.32 intida1 -0.3919 0 0.00% 100
intre1 0.0834 0 0.00% 100 intre2 0.7168 0.6334 63.34% 163.34 intce1 0.6305 0 0.00% 100 intce2 1.0002 0.3697 36.97% 136.97 intide1 0.7719 0 0.00% 100 intide2 0.4389 -0.333 -33.30% 66.7 intine1 2.0579 0 0.00% 100 intine2 2.3525 0.2946 29.46% 129.5 intve1 0.3858 0 0.00% 100 intve2 0.9183 0.5325 53.25% 153.3
intrd1 0.1349 0 0.00% 100 intrd2 0.3901 0.2552 25.52% 125.5 intcd1 0.5944 0 0.00% 100 1intcd2 0.8141 0.2197 21.97% 121.9 intidd2 1.7668 0 0.00% 100 intind2 -0.5758 0 0.00% 100 intvd2 2.0104 0 0.00% 100
intrdd1 1.1182 0 0.00% 100 intrdd2 1.1939 0.0757 7.57% 107.6 intcdd1 1.4464 0 0.00% 100 intcdd2 1.5036 0.0572 5.72% 105.7 intiddd1 0.9294 0 0.00% 100 intiddd2 0.8146 -0.1148 -11.48% 88.5 intindd1 0.5577 0 0.00% 100 intindd2 2.079 1.5213 152.13% 252.1 intvdd1 1.5006 0 0.00% 100 intvdd2 1.1332 -0.3674 -36.74% 63.3
119

APPENDIXJ
Record of Accounts Collected By City
121

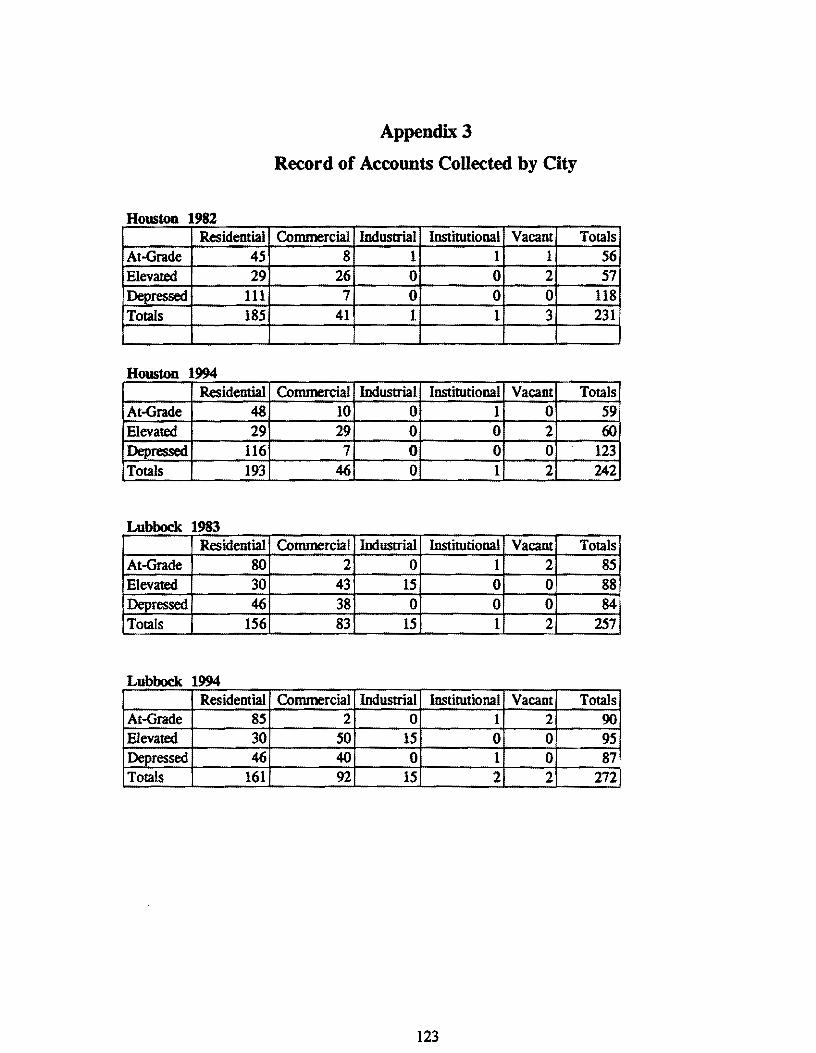
Appendix3
Record of Accounts Collected by City
Houston 1982 Residential Commercial Industrial Institutional Vacant Totals
At-Grade 45 8 1 1 1 56 Elevated 29 26 0 0 2 57 Depressed 111 7 0 0 0 118 Totals 185 41 l 1 3 231
Houston 1994 Residential Commercial Industrial Institutional Vacant Totals
At-Grade 48 10 0 1 0 59 Elevated 29 29 0 0 2 60 Depressed 116 7 0 0 0 123 Totals 193 46 0 1 2 242
Lubbock 1983 Residential Commercial Industrial Instirutional Vacant Totals
At-Grade 80 2 0 1 2 85 Elevated 30 43 15 0 0 88 Depressed 46 38 0 0 0 84' Totals 156 83 15 1 2 257,
Lubbock 1994 Residential Commercial Industrial Institutional Vacant Totals
At-Grade 85 2 0 1 2 90 Elevated 30 50 15 0 0 95 Depressed 46 40 0 1 0 87 Totals 161 92 15 2 2 272
123
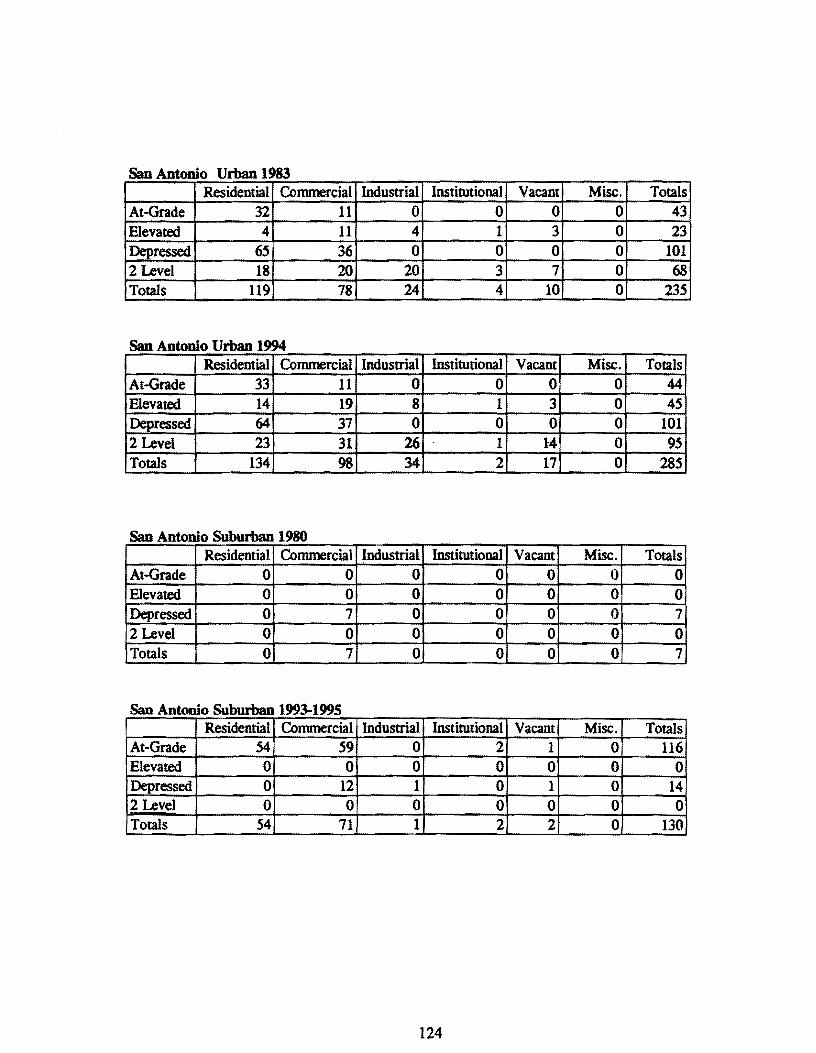
San Antonio Urban 1983 Residential Conunercial Industrial Institutional Vacant Misc. Totals
At-Grade 32 11 0 0 0 0 43 Elevated 4 11 4 1 3 0 23 ·Depressed 6S 36 0 0 0 0 101 2 Level 18 20 20 3 7 0 68 Totals 119 78 24 4 10 0 23S
San Antonio Urban 1994 Residential Conunercial Industrial Institutional Vacant Misc. Totals
At-Grade 33 11 0 0 0 0 44 Elevated 14 19 8 1 3 0 4S Depressed 64 37 0 0 0 0 101 2 Level 23 31 26 1 14 0 9S Totals 134 98 34 2 17 0 28S
San Antonio Suburban 1980 Residential Conunercial Industrial Institutional Vacant Misc. Totals
At-Grade 0 0 0 0 0 0 0 Elevated 0 0 0 0 0 0 0 Depressed 0 7 0 0 0 0 7 2 Level 0 0 0 0 0 0 0 Totals 0 7 0 0 0 0 7
San Antonio Suburban 1993--1995 Residential Conunercial Industrial Institutional Vacant Misc. Totals
At-Grade S4 S9 0 2 1 0 116 Elevated 0 0 0 0 0 0 0 Depressed 0 12 1 0 1 0 14 2 Level 0 0 0 0 0 0 0 Totals 54 71 1 2 2 0 130
124
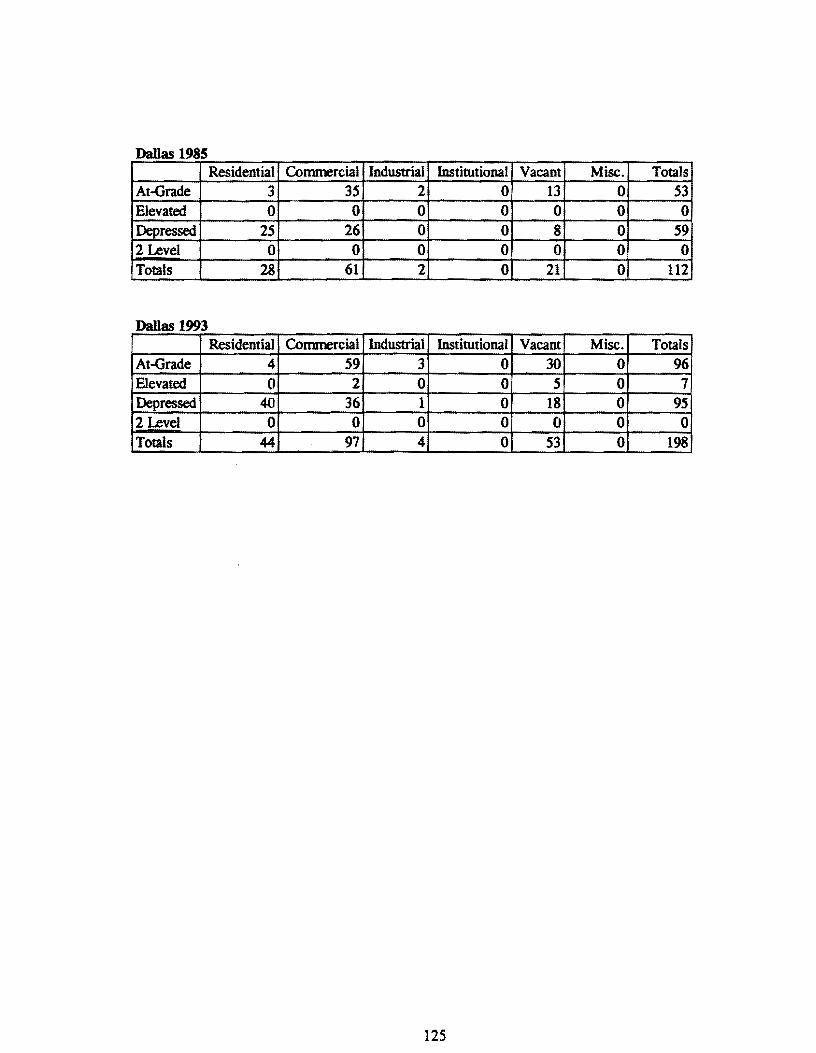
Dallas 1985 Residential Commercial Industrial Institutional Vacant Misc. Totals
At-Grade 3 35 2 0 13 0 53 Elevated 0 0 0 0 0 0 0 Depressed 25 26 0 0 8 0 59 2 Level 0 0 0 0 0 0 0 Totals 28 61 2 0 21 0 112
Dallas 1993 Residential Commercial Industrial Institutional Vacant Misc. Totals
At-Grade 4 59 3 0 30 0 96 Elevated 0 2 0 0 5 0 7 Depressed 4-0 36 1 0 18 0 95 2 Level 0 0 0 0 0 0 0 Totals 44 97 4 0 53 0 198
125

APPENDIX4
Implementation Methodology
127

APPENDIX4
IMPLEMENTATION METHODOLOGY
The findings in this report may be used along with the findings from previous literature to assess the potential impact of new construction or a change in freeway grades on adjacent land values. Implementation steps include the collection of base land value data, local economic projections, the analysis of mean values, and a land value index model. These steps are described below.
Collect Base Land Value Data
The principal researcher should collect, where available, annual land value data by land use for up to five years prior to the anticipated start of construction. Compile the profile of land values by land use during this pre-construction period. Trends may be plotted on a graph to facilitate viewing. Land values that have been increasing may respond positively to improved accessibility resulting from freeway construction. Land values that have been in decline may be even more vulnerable during construction. Determine the mean value by proposed grade and by land use, and in accordance with design drawings.
Obtain Local Economic Projections
Short and long tenn projections for the local economy should be obtained. In this ·study, when freeway sections were more than five years old and overall county economies improved over pre-construction levels, land values exceeded pre-construction amounts. Also, where county market values declined, properties adjacent to freeways depreciated. Ultimately, if the county economy is projected to decline, additional years will be required for property values to return to pre-construction levels.
Mean Values
The mean analysis and land value index model corroborated previous studies' findings that short-tenn decreases in value occurred for adjacent properties during and immediately after construction. However, five to ten years after construction, values began to rebound. The mature freeway sections in San Antonio and Houston provide the basis for the level of increases that may be considered. When viewing the minimum increases in these two cities, a 15 % increase occurred for properties adjacent to at-grade freeways; elevated properties experienced at least a 3 % increase, and depressed properties received at minimum a 48% increase. Such increases can be anticipated in situations where market values are projected to increase.
129
Land Value Index Model
The Land Value Index Model presented in this study may be used to examine preconstruction and post-construction levels of significance. The land value impacts for properties adjacent to at-grade, elevated, and depressed freeways in other locations in Texas may be evaluated by utilizing the equation presented in the Land Value Index section of this document. The model may yield stronger results when provided several years of pre-construction and several years of post-construction data. Additional details on econometric models, land use models, and mean value analysis may be found in Urban Planning Analysis: Methods and Models, (Krueckeberg and Silvers, 1974) and Applied Multiple Regression/Correlation Analysis for the Behavioral Sciences, (Cohen and Cohen, 1983).
130