Embed Size (px)
Citation preview
Landfill Gas Potential using the Philippine Landfill Gas Model
16th Annual LMOP Conference and Project Expo
January 2013
Presentation by Hala Sfeir, Brown And Caldwell
• Introduction • Objectives • The Philippine Model • Data • Results • LandGEM results • Recommendations
Landfill Gas Potential using the Philippine Landfill Gas Model
Brown and Caldwell 3
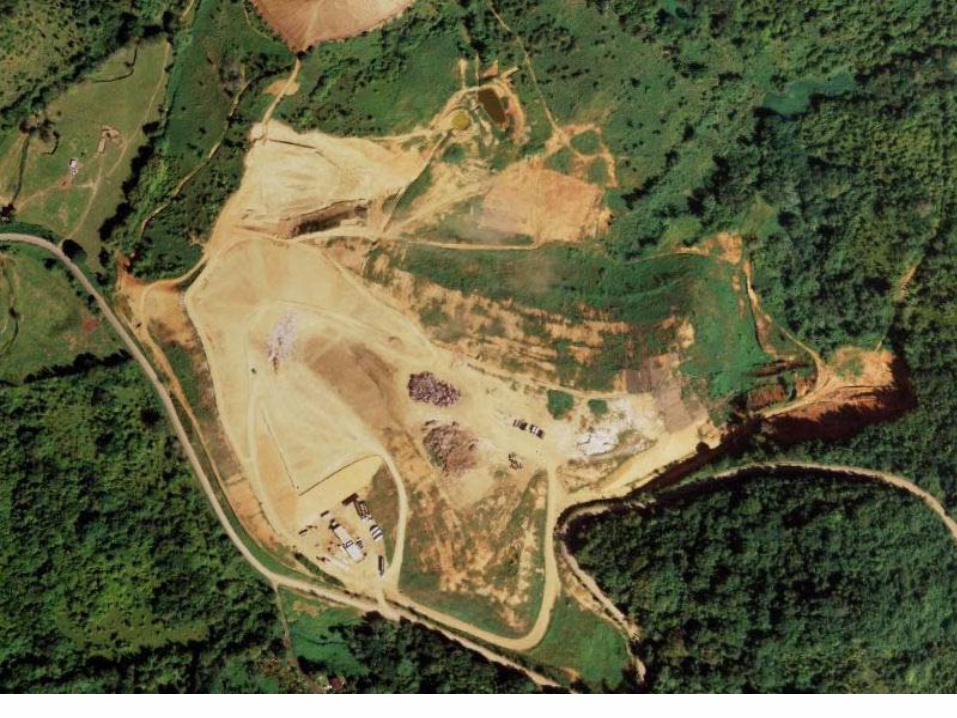
• The landfill started approximately in the early 1940s. The Dump was the primary solid waste disposal facility for the residents until waste acceptance ceased in August 2011.
• Documentation of the type, size, location, and duration of fires is mostly unavailable. However, observations of certain test pits in the northwest corner indicate that open burning of trash occurred, and neighbors have reported that burning of the waste was a standard practice for a period of time.
Introduction
Brown and Caldwell 4
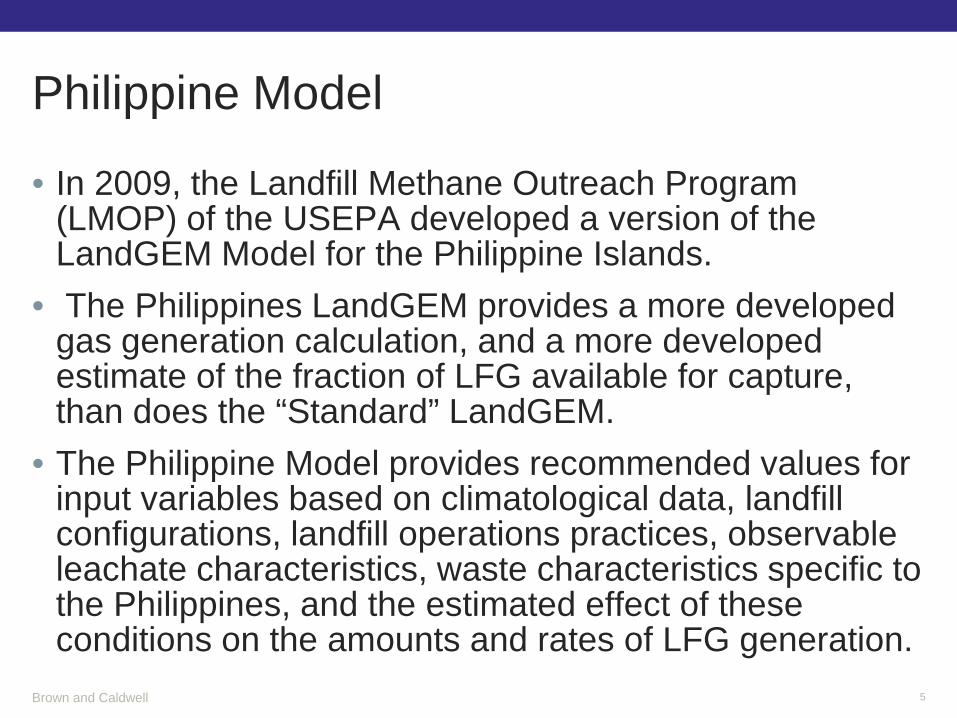
• In 2009, the Landfill Methane Outreach Program (LMOP) of the USEPA developed a version of the LandGEM Model for the Philippine Islands.
• The Philippines LandGEM provides a more developed gas generation calculation, and a more developed estimate of the fraction of LFG available for capture, than does the “Standard” LandGEM.
• The Philippine Model provides recommended values for input variables based on climatological data, landfill configurations, landfill operations practices, observable leachate characteristics, waste characteristics specific to the Philippines, and the estimated effect of these conditions on the amounts and rates of LFG generation.
Philippine Model
Brown and Caldwell 5
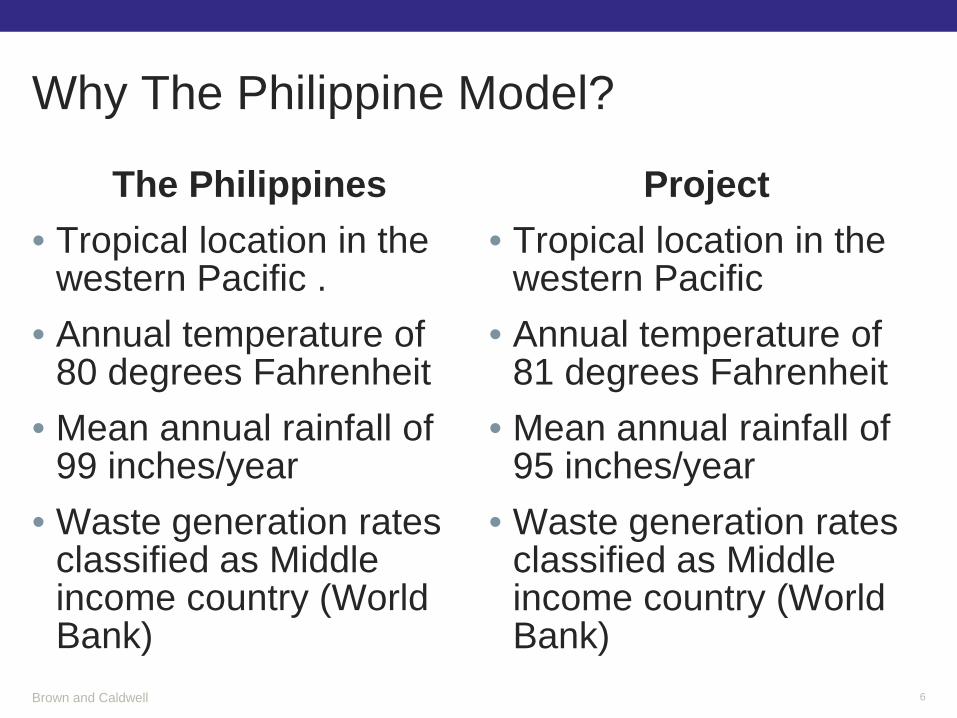
The Philippines • Tropical location in the
western Pacific . • Annual temperature of
80 degrees Fahrenheit • Mean annual rainfall of
99 inches/year • Waste generation rates
classified as Middle income country (World Bank)
Why The Philippine Model?
Project • Tropical location in the
western Pacific • Annual temperature of
81 degrees Fahrenheit • Mean annual rainfall of
95 inches/year • Waste generation rates
classified as Middle income country (World Bank)
Brown and Caldwell 6
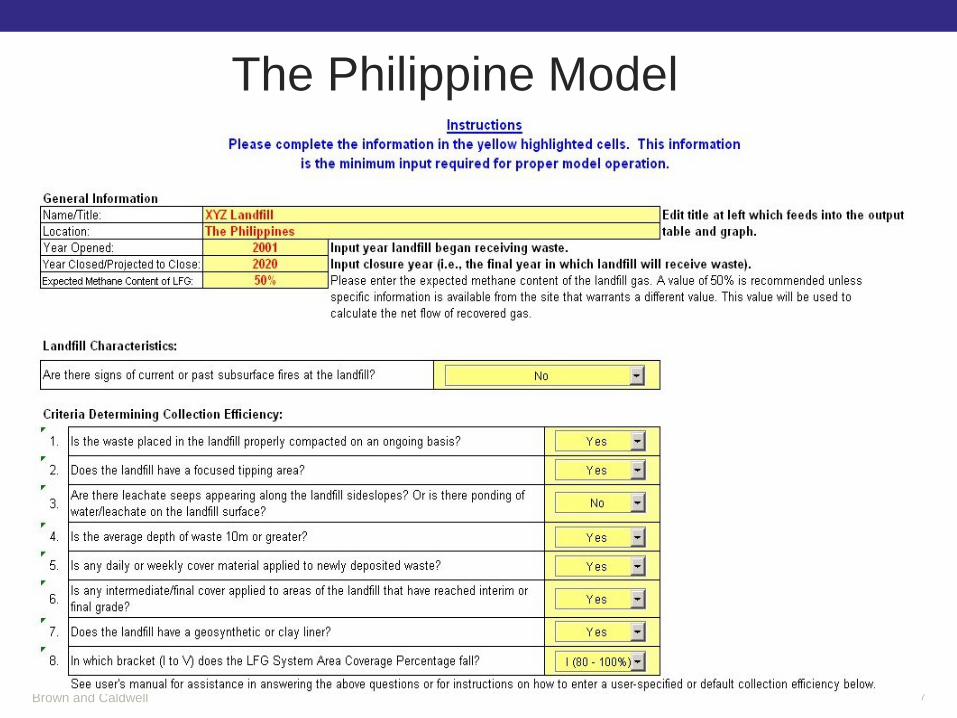
The Philippine Model
Brown and Caldwell 7
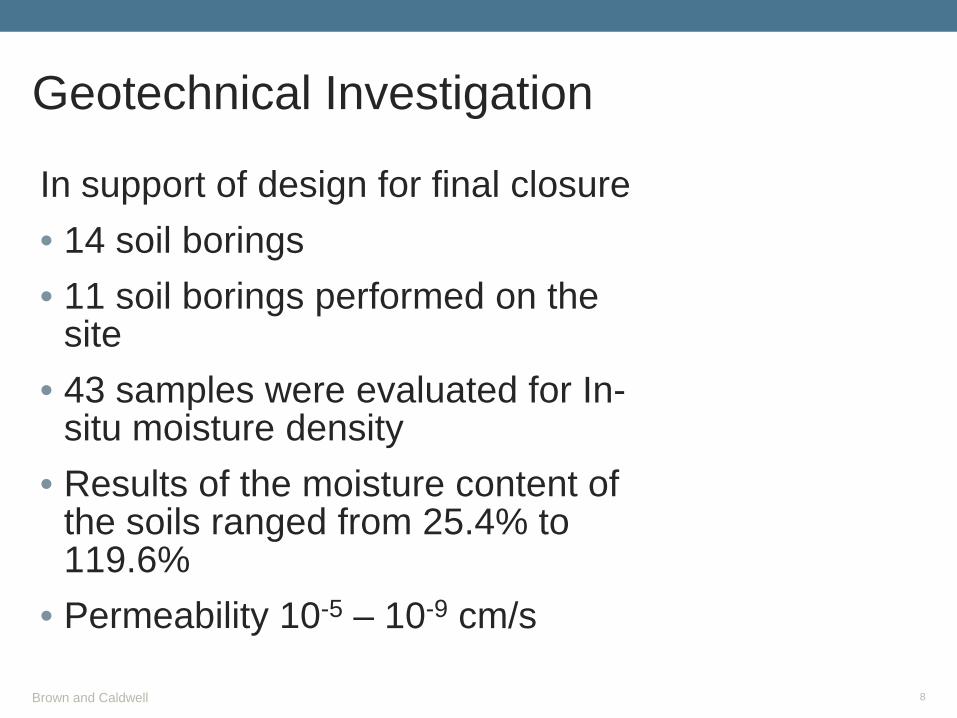
In support of design for final closure • 14 soil borings • 11 soil borings performed on the
site • 43 samples were evaluated for In-
situ moisture density • Results of the moisture content of
the soils ranged from 25.4% to 119.6%
• Permeability 10-5 – 10-9 cm/s
Geotechnical Investigation
Brown and Caldwell 8
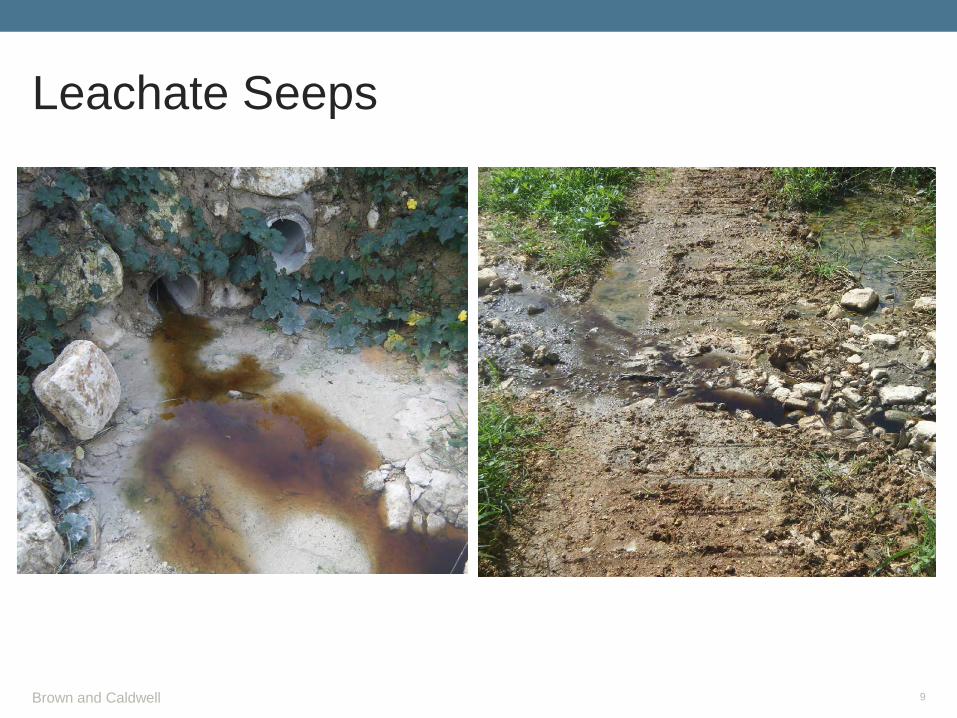
Leachate Seeps
Brown and Caldwell 9
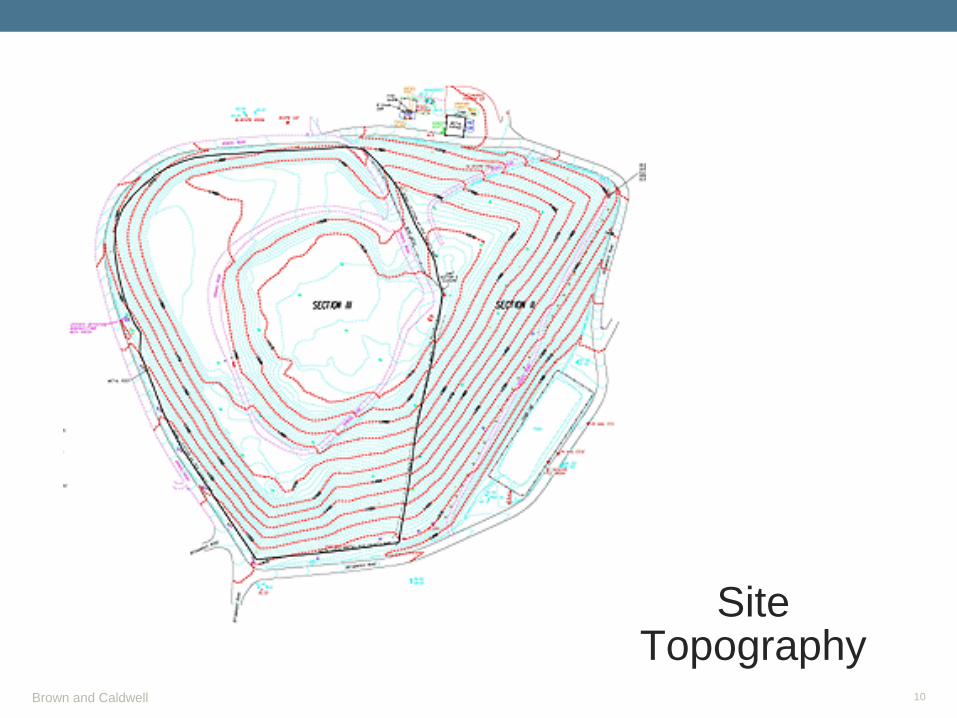
Site Topography
Brown and Caldwell 10
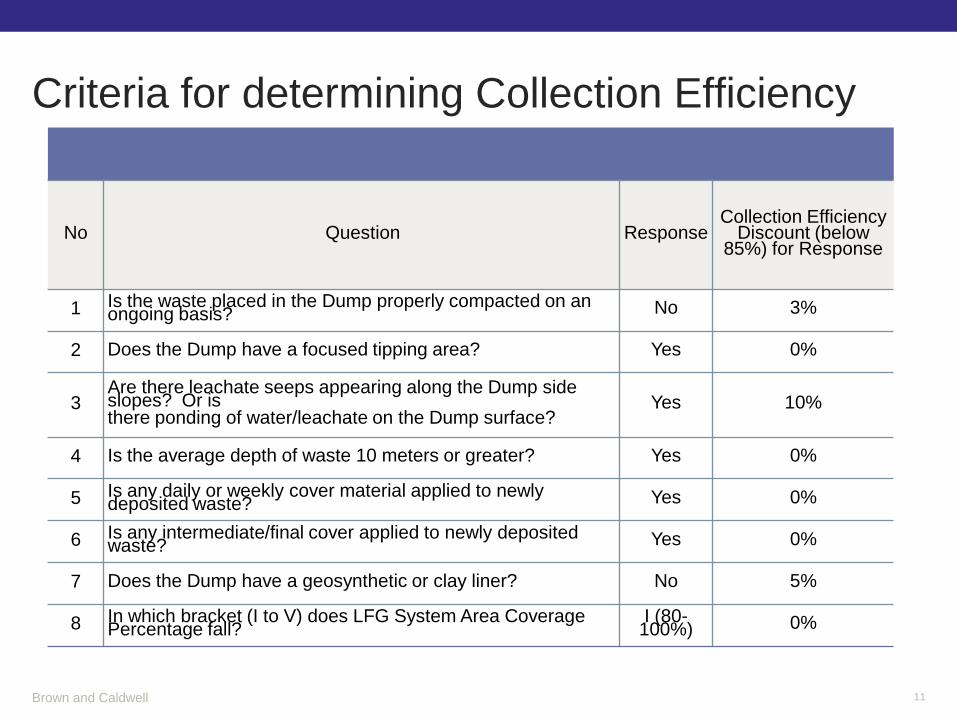
Criteria for determining Collection Efficiency
Brown and Caldwell 11
No Question Response Collection Efficiency
Discount (below 85%) for Response
1 Is the waste placed in the Dump properly compacted on an ongoing basis? No 3%
2 Does the Dump have a focused tipping area? Yes 0%
3 Are there leachate seeps appearing along the Dump side slopes? Or is there ponding of water/leachate on the Dump surface?
Yes 10%
4 Is the average depth of waste 10 meters or greater? Yes 0%
5 Is any daily or weekly cover material applied to newly deposited waste? Yes 0%
6 Is any intermediate/final cover applied to newly deposited waste? Yes 0%
7 Does the Dump have a geosynthetic or clay liner? No 5%
8 In which bracket (I to V) does LFG System Area Coverage Percentage fall?
I (80-100%) 0%
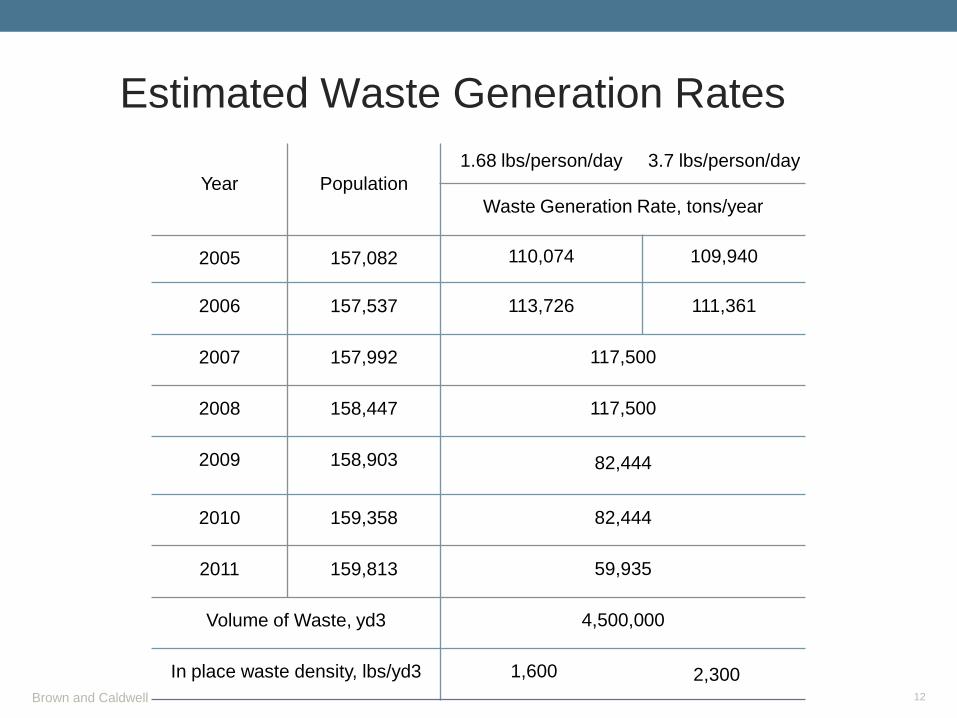
Estimated Waste Generation Rates
Brown and Caldwell 12
Year
Population 1.68 lbs/person/day 3.7 lbs/person/day
Waste Generation Rate, tons/year
2005
157,082 110,074 109,940
2006
157,537 113,726 111,361
2007
157,992 117,500
2008
158,447 117,500
2009
158,903 82,444
2010
159,358 82,444
2011
159,813 59,935
Volume of Waste, yd3 4,500,000
In place waste density, lbs/yd3 1,600 2,300
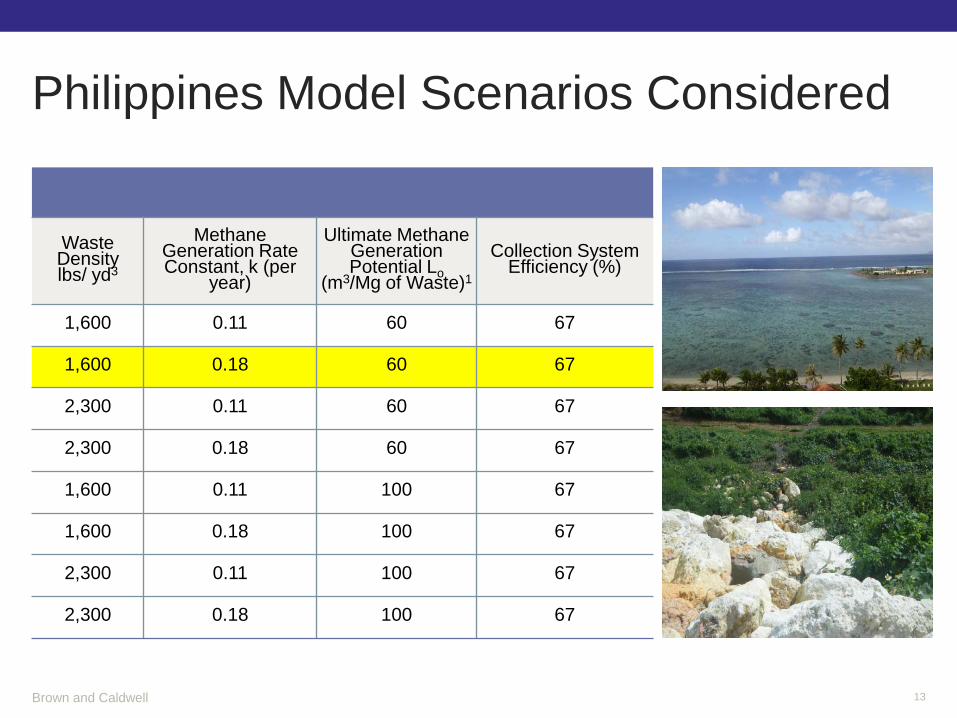
Philippines Model Scenarios Considered
Brown and Caldwell 13
Waste Density lbs/ yd3
Methane Generation Rate Constant, k (per
year)
Ultimate Methane Generation Potential Lo (m3/Mg of Waste)1
Collection System Efficiency (%)
1,600 0.11 60 67
1,600 0.18 60 67
2,300 0.11 60 67
2,300 0.18 60 67
1,600 0.11 100 67
1,600 0.18 100 67
2,300 0.11 100 67
2,300 0.18 100 67
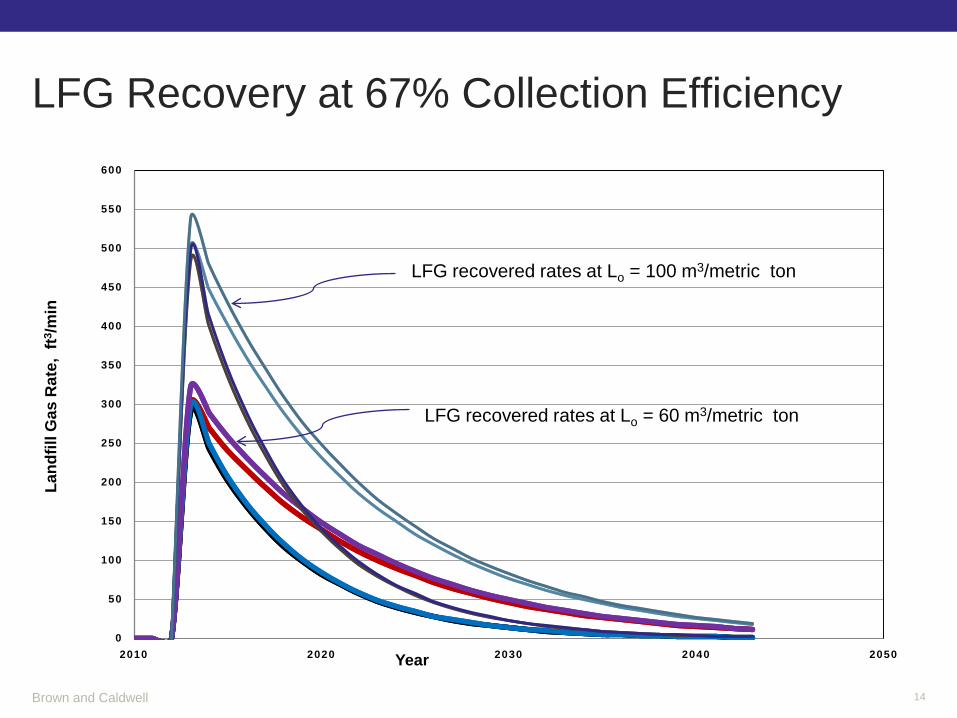
LFG Recovery at 67% Collection Efficiency
Brown and Caldwell 14
0
50
100
150
200
250
300
350
400
450
500
550
600
2010 2020 2030 2040 2050
Land
fill G
as R
ate,
ft3
/min
Year
LFG recovered rates at Lo = 100 m3/metric ton
LFG recovered rates at Lo = 60 m3/metric ton
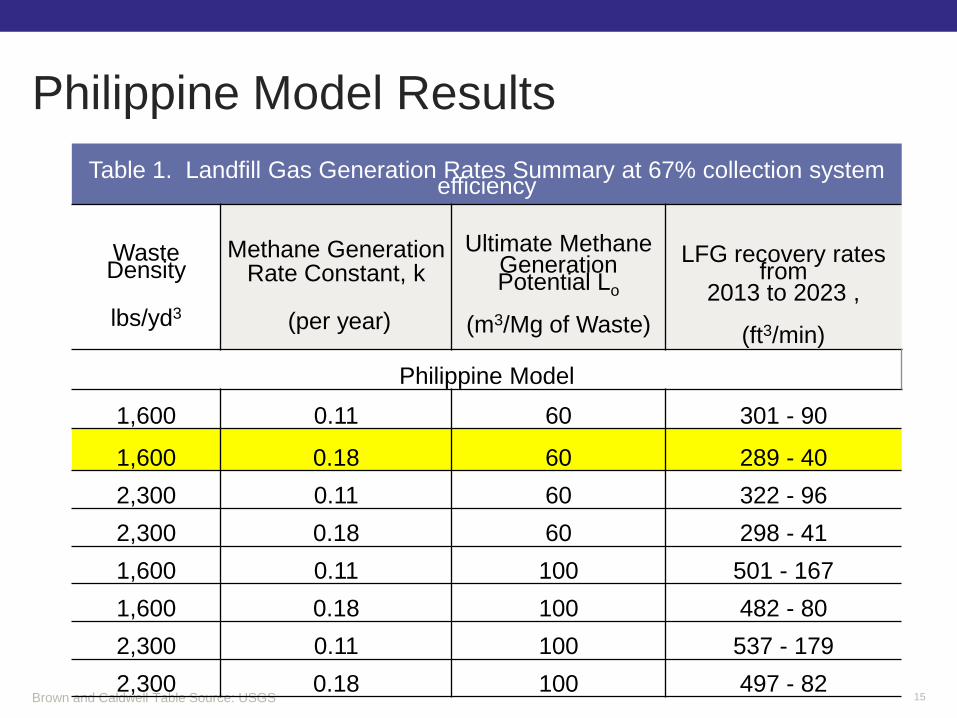
Philippine Model Results
Brown and Caldwell Table Source: USGS 15
Table 1. Landfill Gas Generation Rates Summary at 67% collection system
efficiency
Waste Density
lbs/yd3
Methane Generation
Rate Constant, k
(per year)
Ultimate Methane
Generation Potential Lo
(m3/Mg of Waste)
LFG recovery rates from
2013 to 2023 ,
(ft3/min)
Philippine Model 1,600 0.11 60 301 - 90
1,600 0.18 60 289 - 40 2,300 0.11 60 322 - 96 2,300 0.18 60 298 - 41 1,600 0.11 100 501 - 167 1,600 0.18 100 482 - 80 2,300 0.11 100 537 - 179 2,300 0.18 100 497 - 82
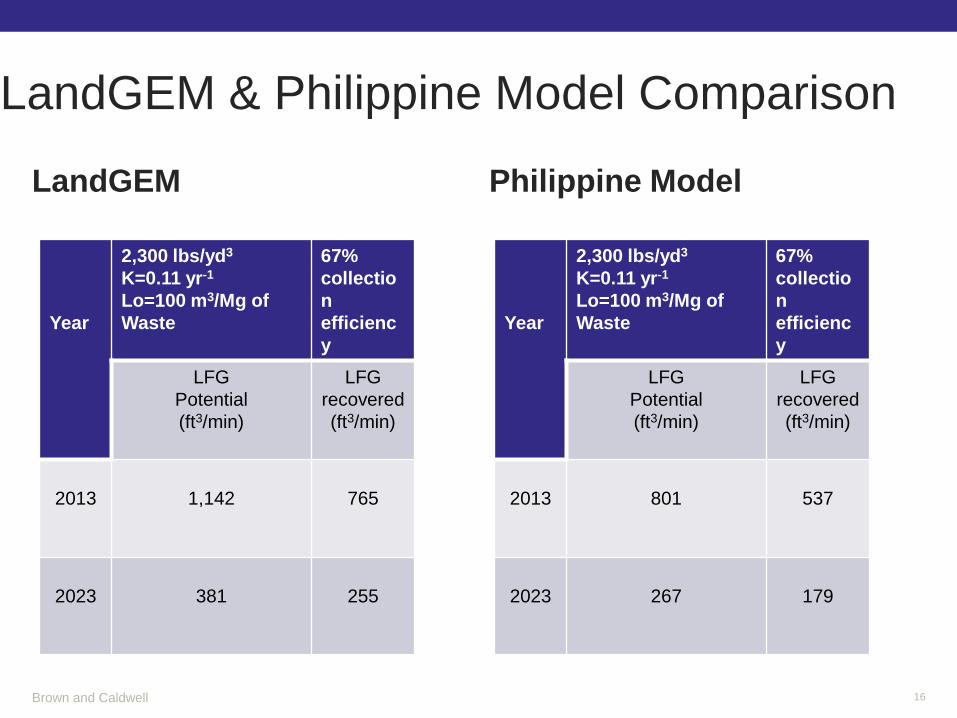
LandGEM
Year
2,300 lbs/yd3
K=0.11 yr-1
Lo=100 m3/Mg of Waste
67% collection efficiency
LFG Potential (ft3/min)
LFG recovered (ft3/min)
2013
1,142
765
2023
381
255
LandGEM & Philippine Model Comparison
Philippine Model
Brown and Caldwell 16
Year
2,300 lbs/yd3
K=0.11 yr-1
Lo=100 m3/Mg of Waste
67% collection efficiency
LFG Potential (ft3/min)
LFG recovered (ft3/min)
2013
801
537
2023
267
179
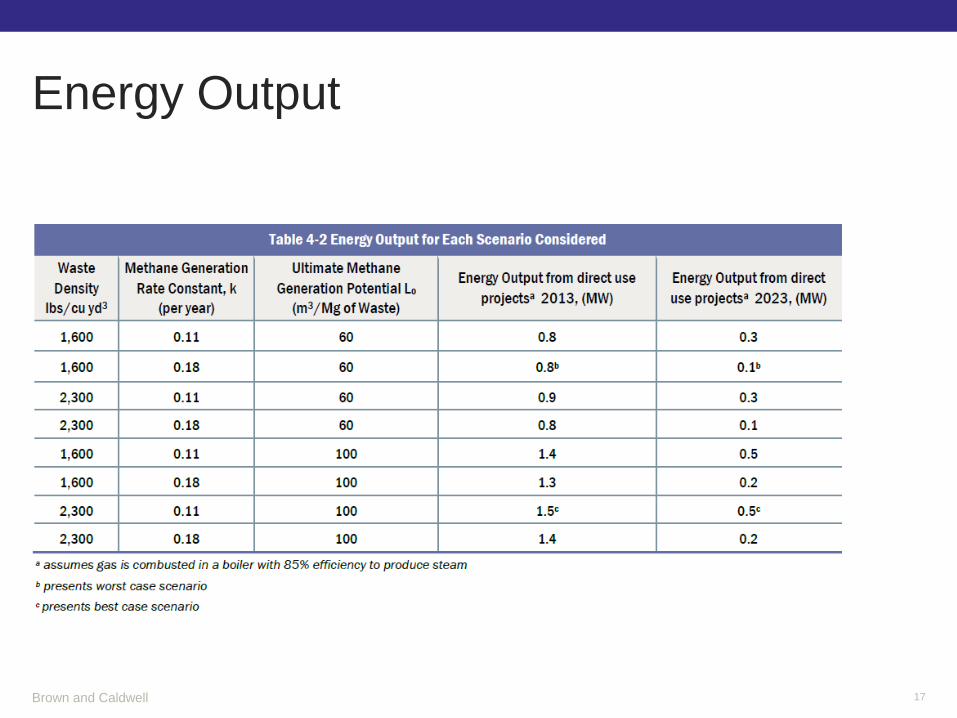
Energy Output
Brown and Caldwell 17
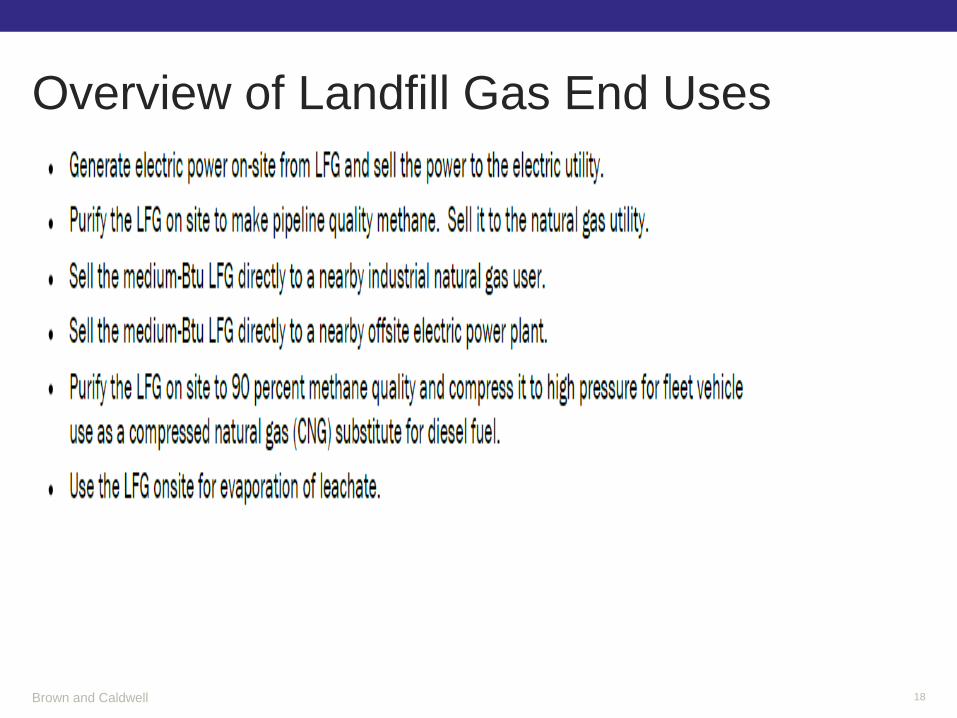
Overview of Landfill Gas End Uses
Brown and Caldwell 18
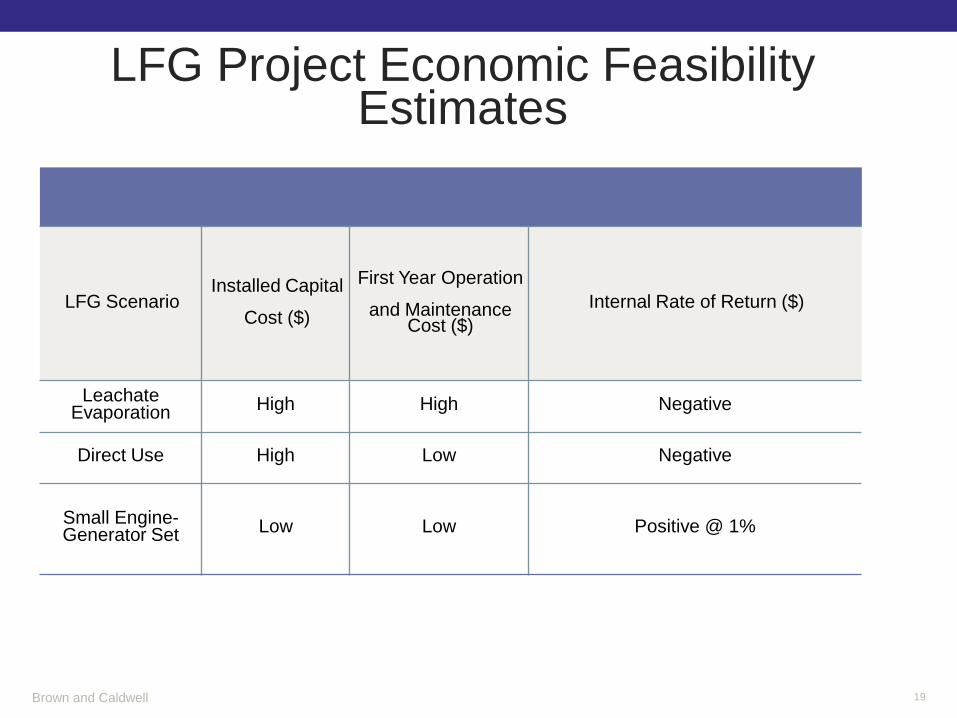
LFG Scenario Installed Capital
Cost ($)
First Year Operation
and Maintenance Cost ($)
Internal Rate of Return ($)
Leachate Evaporation High High Negative
Direct Use High Low Negative
Small Engine- Generator Set Low Low Positive @ 1%
Brown and Caldwell 19
LFG Project Economic Feasibility Estimates

Questions
Brown and Caldwell 20