Embed Size (px)
Citation preview
LANDSAT APPLICATION OF REMOTE SENSING TO SHORELINE FORM ANALYSIS
Contract No. NAS5-20999 4/3/75 - 6/2/76
Investigation No. 21240
Quarterly Report Due 9/2/75
Robert Dolan P r i n c i p a l Investigator
and
Jeffrey Heywood
Department of Environmental Sciences University of Virginia
Charlottesville, VA 22903
August 15, 1975
REPRODUCED BY m. us Department of Commerce
National Technical Informalion SeNEe SpnnSfield, Virginia 22161
“Madc rvailrble under NASA r ~ a ~ b n l l in the interest of early and wide djs. m i n a t i o n of Earfh Resources Sum PrQgram information and wim hbiu(1 for any uw mh thcmum
https://ntrs.nasa.gov/search.jsp?R=19750025391 2018-06-25T04:29:55+00:00Z

Quarterly Report
LANDSAT APPLICATION OF REMOTE SENSING TO SHOmLINE-FORM ANALYSIS
Introduction
This is our first quarterly report sub-
mitted under Landsat Investigation No. 21240,
which officially began on 3 April 1975. The
overall objective of the investigation is to
demonstrate the feasibility of applying
remote sensing to shoreline-form analysis and
to assess the usefulness of remote sensing
in predicting'the location of storm damage
along the east coast of the United States.
Requisite for the success of this study are
coastal storms of sufficient size to generate
changes in landforms and the acquisition of
data at three different scales that will be
used to monitor these changes, Since such storms
are not expected to occur until the fall and
winter seasons, and since we have only recently
begun to receive part of our imagery (Landsat),
this report will emphasize the in-house preparation
we have made to handle the imagery and analyze
the storms when they begin to arrive. It will
review the objectives of the investigation,
Preparation
for
Imagery
and
Storms

major questions that we hope to answer, the
method of approach, a description of the study
sites, expected results, and the status of
imagery and accomplishments to date.
The Problem
The primary objectives of this investigation
are to determine whether or not we can predict
areas of storm damage along the mid-Atlantic
coastline based on interpretation of historic Predict
Storm
Damage and recent remote-sensing imagery.
imagery that we are using is aerial phokography
The historic
ranging in scale from 1:.5,000 to 1:20,000.
Recent imagery will include color infra-red
photography enlarged to scales of 1:5,000 and
1:60,000 and Landsat imagery enlarged to
1:250,000.
After each major storm, an assessment will
be made of the storm's physical impact upon the
coast through the interpretation of follow-up
imagery and field verification.
shoreline and vegetation line will be recorded.
Data will be collected at specific sites to
Record
Landform
Change
Changes in
quantify changes in "typical" overwash processes.
Other visible changes in coastal landforms,
2

such as longitudinal movement of shoreline
sand waves will be mapped.
Accomp Zishments
In addition, the historic data bank for
coastal erosion/accretion, which has been esta-
blished for selected sites along the mid-Atlantic
coast, will be maintained. The relative merits
of using the three different scales of imagery
Maintain
Data
Bank
in accomplishing our objectives will be evalu-
ated.
Following are some of the specific questions
Issues
to
Resolve
we will address during the investigation:
1. Can locations of overwash events and
storm damage be predicted based on
the analysis of historical imagery? ... &.sed on the analysis of the most
recent set of imagery?. ..based on
what scale of imagery? Which method
is most reliable?
2. Can we in turn classify coastal zones
into categories of vulnerability with
respect to physical processes, such as
(a) highly stable, (b) relatively
stable, (c) highly unstable? Can
3
1
Three
Scales
such a measure of stability be quanti-
fied for purposes of comparison?
3 . Can reliable shoreline erosion/accre-
tion rates be established and can the
future location of the shoreline be
predicted?
Can we detect longitudinal movement of 4 .
crescentic shoreline landforms in the
current time frame of our study? ... at what scale?
How does vegetation and island stability
in general relate to shoreline stability?
5.
6. How useful is Landsat imagery in an-
swering the above questions?
Can we arrive at a single optimum scale 7 .
at which changes in coastal landforms
should be monitored?
Method of Approach
The investigation will be based primarily
on the interpretation and mapping of remotely
sensed imagery at three different scales. Low- of
Imagery altitude photography at original scales ranging
from 1:7,500 to 1:20,000 will be enlarged to
1:5,000. High-altitude photography will be

studied at 1:60,000. Landsat imagery will be
. enlarged to 1:250,000.
Three corresponding study areas have been
defined (Fig. 1) . Landsat imagery will be used
to analyze the coast from Cape Henlopen, Dela-
ware, to Cape Fear, North Carolina. High-alti-
tude photography will cover the same area but
focus especd.a;lly ton' IAssateague Island and
Hatteras Island. Low-altitude photography will
also cover Hatteras and Assateague but will be
Three
Corresponding
Study
Areas
used specifically to coincide with field verifi-
cation at selected sites. One site will be an
overwash fan located three kilometers north of
the Maryland State Park on Assateague. Another
site will be in the vicinity of Cape Hatteras,
North Carolina. Additional sites will be in-
cluded depending on time, funding available
for field work, and continuing analysis of new
imagery.
Since the investigation is concerned with
monitoring change in coastal landforms, a method
enabling rapid comparison of photographs of the
same area taken at different points in time
must be employed. The method adopted for this
study was developed for low-altitude imagery
Monitor
Change
under the auspices of a National Park Service

VlRGl NIA
' 6 ' F$. I : S t u d y A r e a .
ATLANTIC OC€AN

grant and supported in large part by the
imagery and facilities avalable through
NASA-Wallops. The method is described below for
a scale of 1:5,000 but will also be adapted
where possible to the two smaller scales used
in this study.
Due to the varying scales of the historical
photography and the need to measure relatively
straight segments of an otherwise curved shore-
line, base maps at the scale of 1:5,000 were
Overlay
Maps
created that divided the coastline into segments
of 3.6 km. The base maps were drawn from
enlarged sections of the most recent 7.5-minute
series USGS topographic maps available. The
K&E Kargyl Reflecting Projector was used for all
enlarging purposes. Each base map has angular
hash marks and is bordered by a rectangular frame,
11.4 cm x 6.7 cm, both of which are used fo r pur-
poses of alignment. The frame of each base map
is oriented with the long side parallel to the
coastline and positioned over the barrier island
in such a manner that the shoreline and vegeta-
tion line will fit within the frame for all
years of photography and so that adjacent frames
are overlapping with coincident hash marks. The

long side of the frame, parallel to the coast-
line and lying entirely over the ocean, then
becomes the base line from which all future
measurements are made and, in turn, the "bot-
tom" of the base map.
For each base map, aerial photography of a
selected date is enlarged until the best possible
fit of natural and cultural features between
photo and base map is obtained on the projector. Overlay
Maps The shoreline and vegetation line are then drawn
on an overlay map.
each historical photograph of the same area.
This process is repeated for
The shoreline was identified by the "line"
that separates the white beach sand from the
gray (in panchromatic film) or light blue (in
color infrared film) beach sand and represents
the high-water mark at the time the photograph
was taken. This line was easily recognizable
on all but the most gradually sloping beach
fronts.
The vegetation line was identified by a
"smoothed line" that separates the white beach - o r dune sand f r o m the grey (in panchromatic
film) or purple-red (in color infrared film) \
8

1 ' I
Recording
vegetation and represents the beginning of the
zone where relatively contiguous stands of
shrubbery or thick grasses interspersed with
.
shrubbery were fairly well established.
An orthogonal grid system with divisions
equal to 100 meters fo r a distance of 3,600
meters in the "x" direction (along the shore-
line) and divisions equal to 5 meters for a dis-
tance of 2,100 meters in the "y" direction
(across the shore) at a scale of 1:5,000 was Data
drawn on a sheet of clear acetate with a frame
identical in size to that of each base map and
overlay map.
along the shore, the points at which the shore-
line and the vegetation line intersected the
across-the-shore transect were recorded. Values
of these points range from 0 to 2,100 meters to
At every 100-meter location
the nearest 5 meters.
A computer program has been written which
lists the following information for every base
map (statistics include mean, variance, standard
deviation, number of transects over which mean
is calculated, maximum value, and minimum value:)
Data
Tabulation
<
1. Location of vegetation line (VL) and
shoreline (SL) and overwash penetration
9
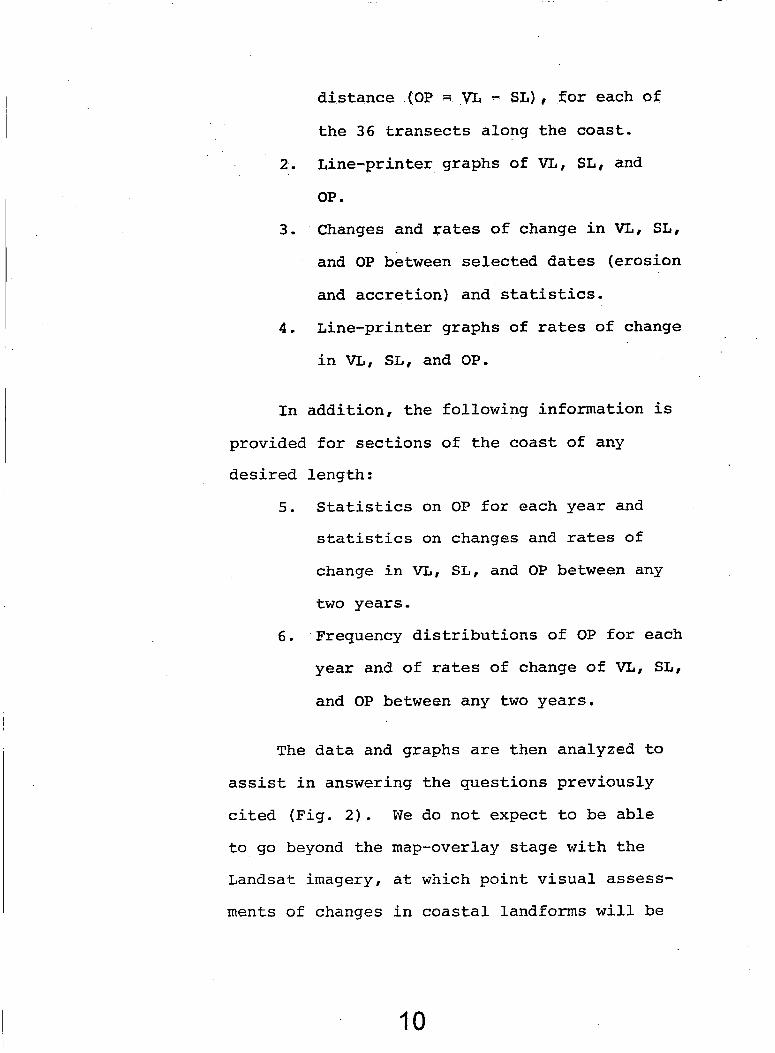
2.
3.
4 .
In
distance (OP = VL - SL), f o r each of
the 36 transects along the coast.
Line-printer graphs of VL, SL, and
OP . Changes and rates of change in m# SL,
and OP between selected dates (erosion
and accretion) and statistics.
Line-printer graphs of rates of change
in VL, SL, and OP.
addition, the following information is
provided for sections of the coast of any
desired
5.
6.
length :
Statistics on OP for each year and
statistics on changes and rates of
change in VL, SL, and OP between any
two years.
Frequency distributions of OP for each
year and of rates of change of VL, sL8
and OP between any two years.
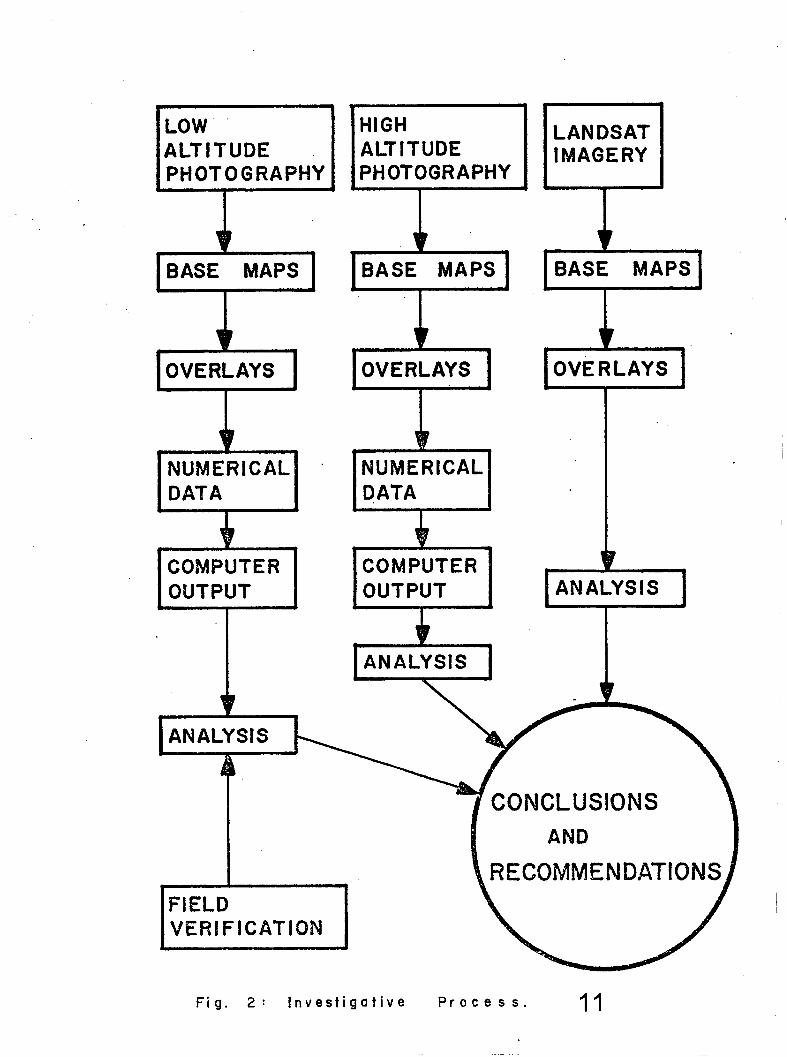
The data and graphs are then analyzed to
assist in answering the questions previously
cited (Fig. 2). We do not expect to be able
to go beyond the map-overlay stage with the
Landsat imagery, at which point visual assess-
ments of changes in coastal landforms will be
I O
CQNCLUSIONS
ECOMMENDATION
F i g . 2 : I n v e s t i g a t i v e P r o c e s s. I 1
. made. We hope to be able to go completely
through to the data-tabulation stage with the
high-altitude imagery. This will require
slight modification of the computer program Analysis
but no change in.the process of recording data.
The success of this attempt must await arrival
of our first set of high-altitude imagery.
Visits to selected field sites are to be
made following major storms and will be co-
ordinated with overpasses of high-altitude and
low-altitude imagery support whenever possible.
Field
Measurements
Large markers that will be visible in the low-
altitude photography will be placed at criti-
cal points around the overwash site and
appropriate measurements will be made between
markers. These critical points include:
1. High-water line,
2. Vegetation line,
3 . Line of farthest penetration of most
recent overwash if different than
vegetation line,
4 . Edges of throat in overwash fan,
5. Top ridge of fore dune.
Extensive field notes will be taken des-
cribing qualitative measurements such as amount
12

and type of material deposited in the fan,
extent of dune scarping, and a visual assess-
ment of the overall lmpact of the storm. An
attempt will be made to assess the damage that
Storm
Impact
might have occurred had man-made structures
been present in the area of storm penetration.
Field notes and measurements will then be
correlated with findings obtained through ana-
lysis of post-storm imagery. Conclusions reached
at specific test sites will be related to the
remainder of the study area and to similar
Correlation
with
Imagery
coastlines in general.
The end
E x p e c t e d ResuZ t s
product of the investigation will
consist of four parts:
1. Computer output of historical data
Data
Set
2. Map
Over lays
representing the change of coastal
landforms over time. Figure 3 is an
example of a statistical summary for
a section of Hatteras Island.
Selected map overlays showing changes
in coastal landforms detected in
Landsat imagery and showing predicted
locations of future shorelines.
13

.. JJW 00 z 2' u a c c mv) H H m a z ZI 0 0 HU +I- u a g: W W z z w w
X I VIv) 4 4 3 1 W o ! w w > -
u a
GI Z Z OI
1-
. c 3 n J
J - n - U - n a Q c b c
I
v) a! W C W S 0 -l U Y
Nl
.I 0: 1-
N/
, f
'II H x U S
a
14

Supporting graphics will be included.
Landform
3. Graphical comparisons showing coastal
landform trends, analysis, predicted
storm impact, and actual storm impact Comparisons
for selected sections of the coast.
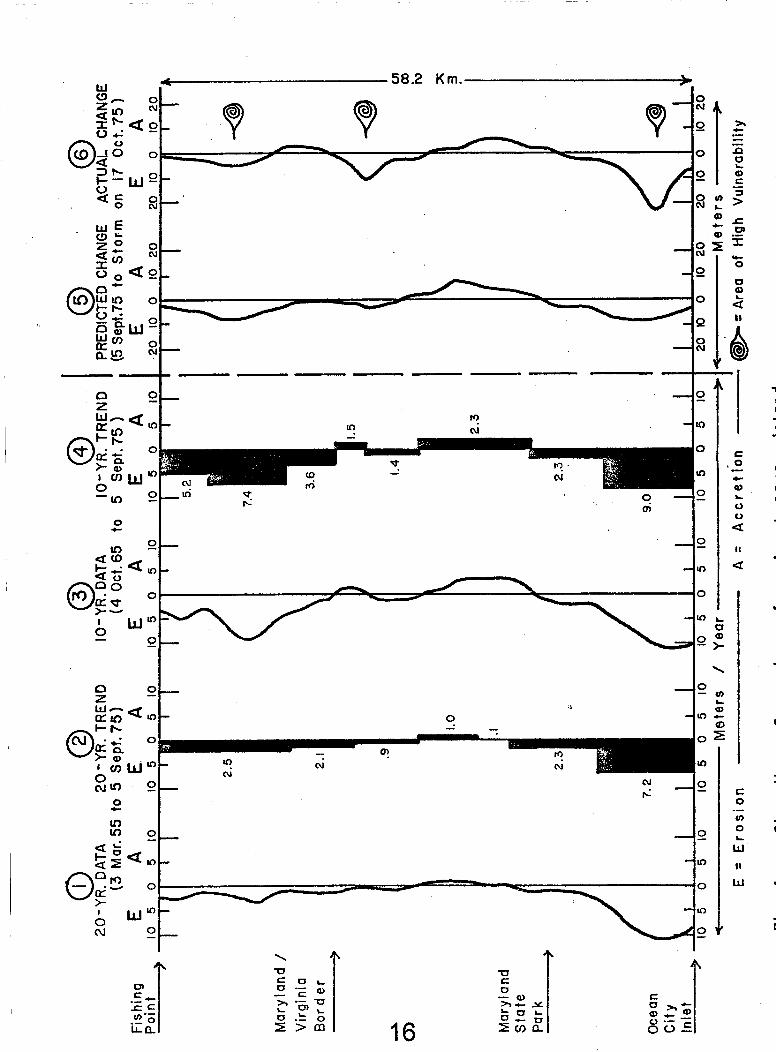
An example of how such comparisons
might look is shown in Figure 4 . These
figures are based on fictitious data
and are presented for illustrative pur-
poses only.
4 . A complete discussion of the investiga-
tion including a review of objectives,
Discussion the method of approach, results of ana-
lysis, conclusions, xecommendations,
and other pertinent.information. The
items discussed in this progress report
will be as closely adhered to as pos-
sible but will depend on the timely
flow of imagery and the occurrence of
significant storm activity.
Imagery Requirements
This investigation is based on the assump-
tion that there will be coastal storms during the
fall of 1975 and the winter of 1976 of sufficient
15
16

Prediction Reliability Table
(to accompany Figure 4)
~ ~~
Criteria Predicted Actual Reliability ( % I
~ ~~~
Percentage of shoreline eroded 77% 60% 72
Percentage of shoreline accreted 21% 39% 54 '
Mean shoreline erosion 4.1 m/yr 5.3 m/yr 77
Mean shoreline accretion 3.2 m/yr 3.1 m/yr 97
Aggregate percentage of reliability 75
17

magnitude to cause overwash events and associ-
ated changes in landform.
on the availability of pre-storm and post-stom
imagery. In order to properly address the
Dependent
on
Imagery
It is totally dependent
questions presented in this report, the following
imagery is required:
1. Landsat imagery of the mid-Atlantic
coast from Cape Henlopen, Delaware, Landsat
High
Altitude
to Cape Fear, North Carolina, for
every satellite pass from May, 1975,
through the end of the storm season
in April, 1976. A single 20” x 20”
black and white print of MSS Band 6
for each frame would be more valuable
than one 70 mm transparency per band
(total of 4 ) for each frame.
2. High-altitude (1:60,000 scale), color
infrared prints from Cape Henlopen,
Delaware, to Cape Fear, North Carolina,
prior to the first storm expected in
September and following each major
storm through April. Prints are prefer-
red to transparencies and 60% overlap
is desirable but not necessary.
3 . Low-altitude (1:10,000 scale), color
infrared prints of Assateague Island
18

Low
Altitude
from Ocean City Inlet to Chincoteague
Inlet and Hatteras/Ocracoke Islands
from Nags Head to Ocracoke Inlet prior
to the first storm in September and
following each major storm through
April. Prints are preferred to trans-
parencies and 60% overlap is desirable
but not necessary.
Close communication must exist between this
office and the supplier of aerial photography
so that a major storm can be identified as such
when it occurs. All frames must include the
shoreline and as much of the barrier island as
possible.
only in low-altitude imagery.
This becomes a critical situation
19