Embed Size (px)
Citation preview
Landscape Modeling for the Resource Management Plans for
Western Oregon
Prepared by Carolina HooperVegetation Modeling Lead
Oregon State Office4/23/13
What is the Intent of Landscape Modeling?
Simulate the management actions and allocations of the alternatives toproject the development of the forestover time.
Provide quantitative basis forcomparing alternatives.
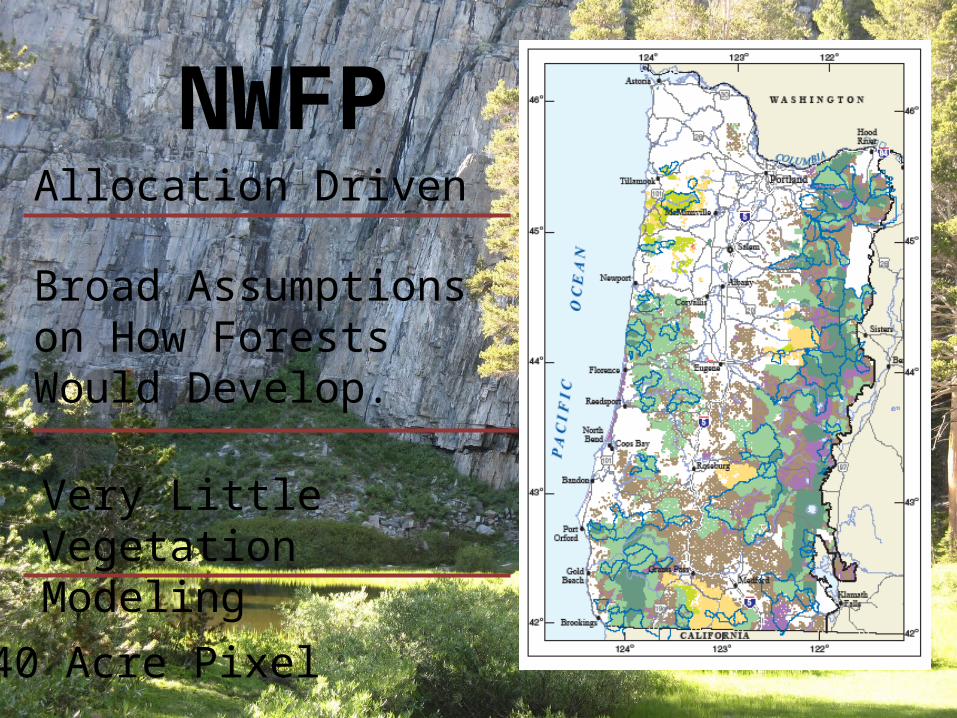
NWFP
Allocation Driven
Broad Assumptions on How Forests Would Develop.
Very Little Vegetation Modeling
40 Acre Pixel
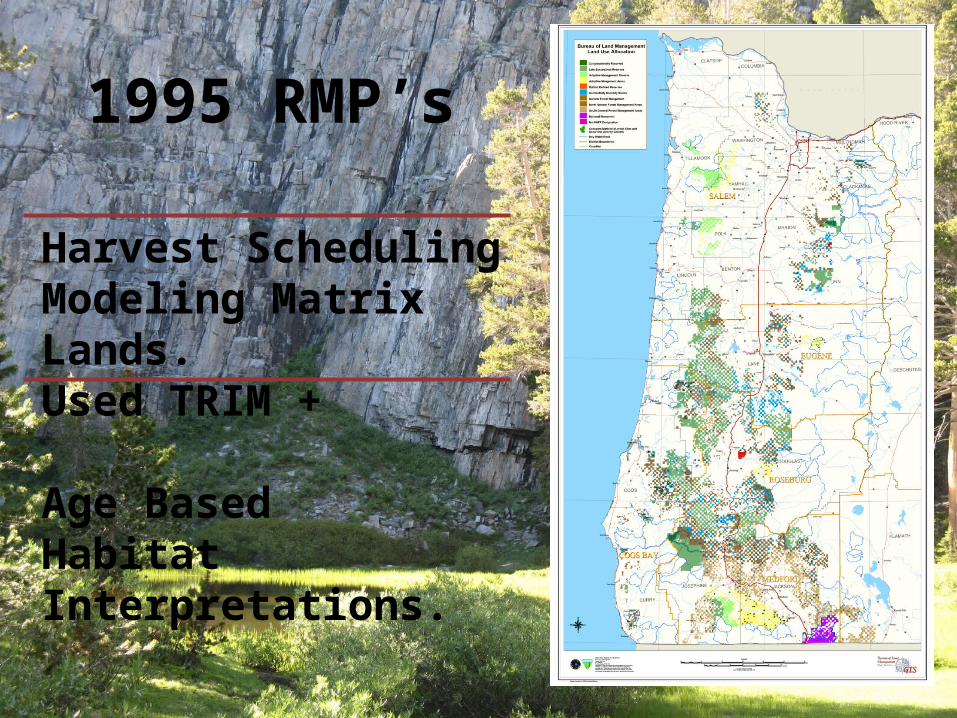
1995 RMP’s
Age Based Habitat Interpretations.
Harvest Scheduling Modeling Matrix Lands.Used TRIM +
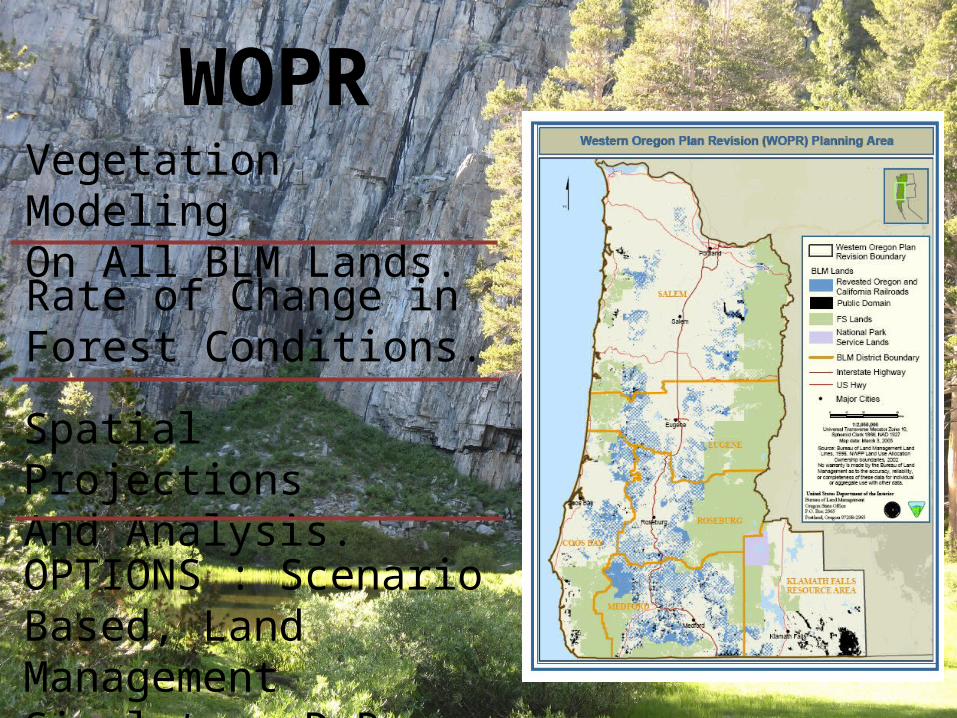
WOPRVegetation Modeling On All BLM Lands.
Rate of Change inForest Conditions.
Spatial ProjectionsAnd Analysis.
OPTIONS : Scenario Based, Land Management Simulator, D.R. Systems Inc.
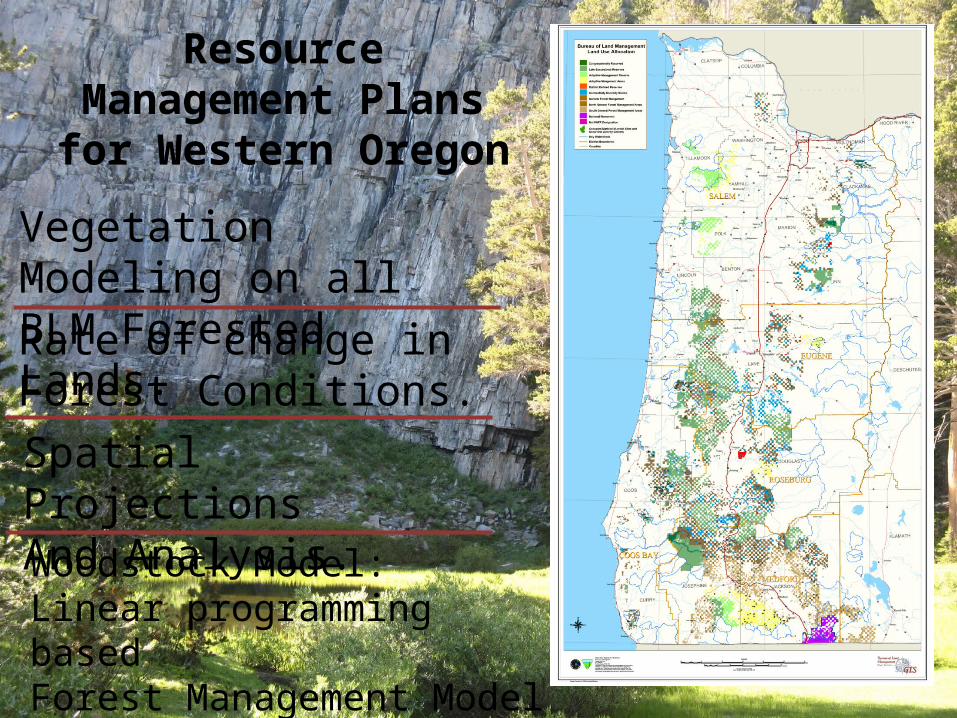
Resource Management Plans for Western Oregon
Vegetation Modeling on all BLM Forested Lands. Rate of change in Forest Conditions. Spatial ProjectionsAnd Analysis.Woodstock Model: Linear programming basedForest Management ModelRemsoft
Modeling Philosophy
To the extent possible, we will use data that has been collected on BLM managed land. Our stand-level and permanent plot-level information has been developed, collected and maintained by BLM employees for use in developing Resource Management Plans, and provides the best available information.
Three Main Data Sources
Forest Operations Inventory (FOI) - Stand-level inventory
Current Vegetation Survey (CVS) - Permanent Plot inventory
Geographic Information System (GIS)
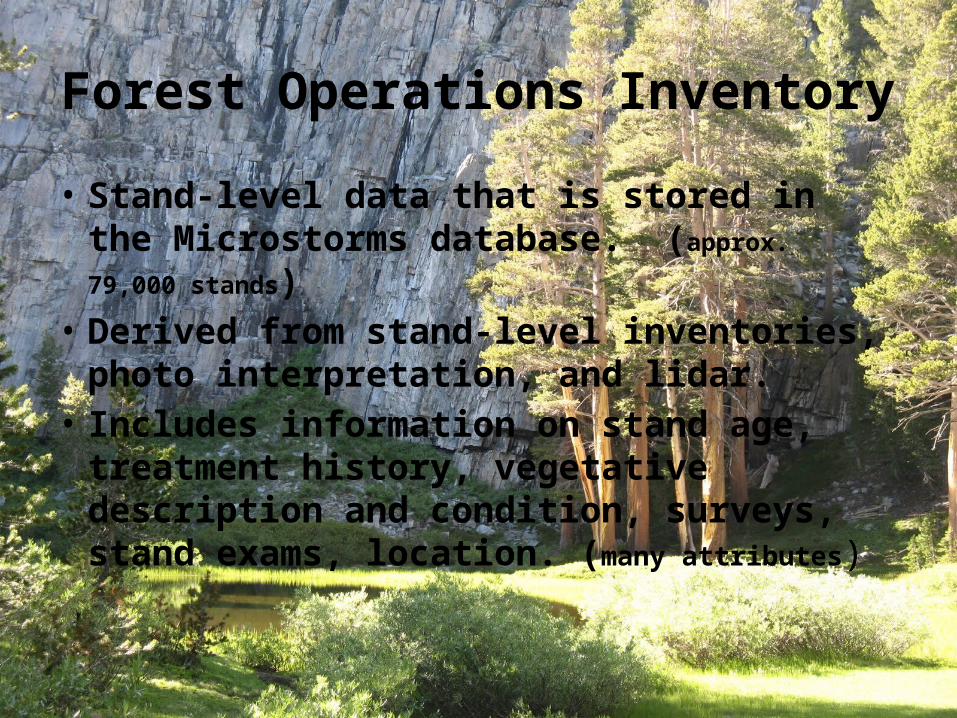
Forest Operations Inventory
• Stand-level data that is stored in the Microstorms database. (approx. 79,000 stands)
• Derived from stand-level inventories, photo interpretation, and lidar.
• Includes information on stand age, treatment history, vegetative description and condition, surveys, stand exams, location. (many attributes)
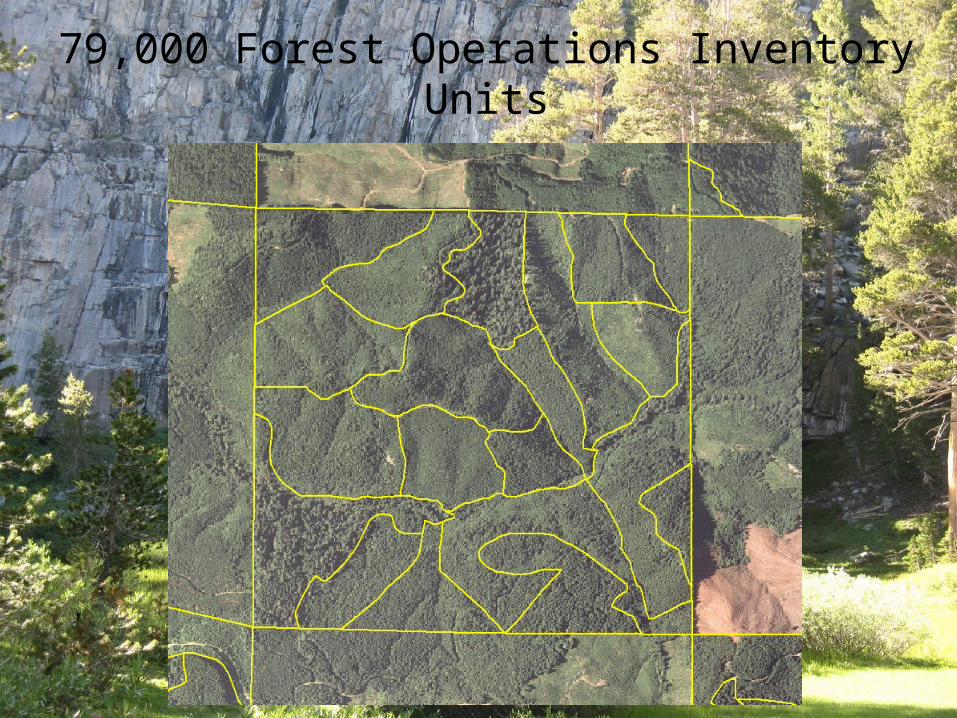
79,000 Forest Operations Inventory Units
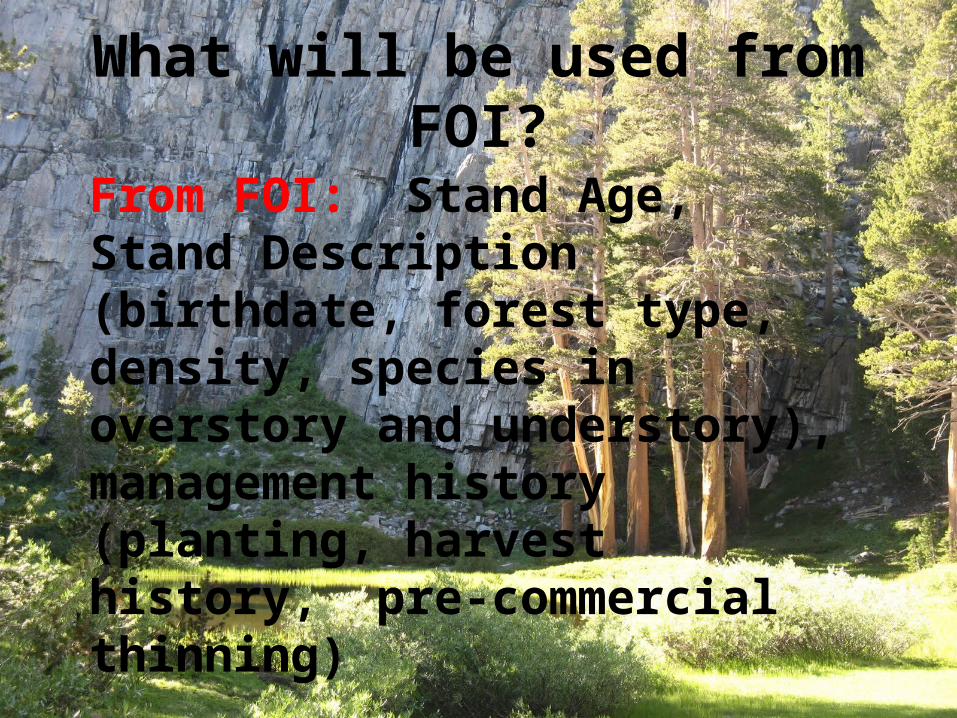
What will be used from FOI?
From FOI: Stand Age, Stand Description (birthdate, forest type, density, species in overstory and understory), management history (planting, harvest history, pre-commercial thinning)
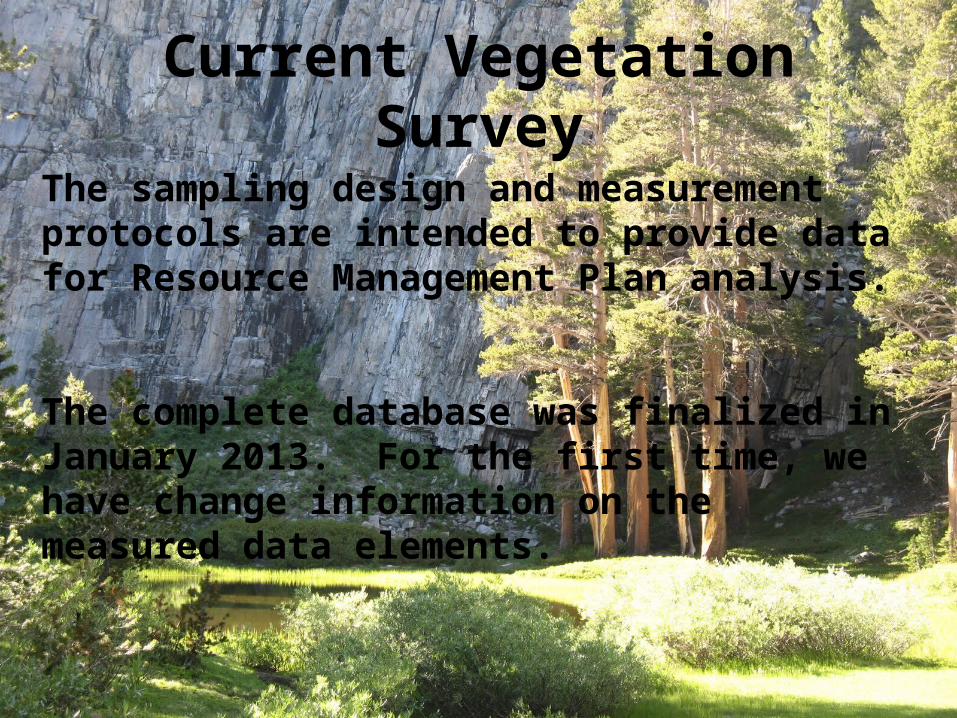
Current Vegetation Survey
The sampling design and measurement protocols are intended to provide data for Resource Management Plan analysis.
The complete database was finalized in January 2013. For the first time, we have change information on the measured data elements.
CVS cont.• Permanent plots are established on a systematic 1.7 mile grid across all
BLM land in Western Oregon. The grid covers the Salem, Eugene, Roseburg, Coos Bay, Medford District and the west side of Klamath Falls Resource Area.
• Plots were installed if one or more subplot centers are on BLM, and the plot is forested.
• The plot grid was divided into 4 panels for establishment and remeasurement.
• Panel 1 was installed in 1997, panel 2-4 were installed between 1999 and 2001. Every 3 years afterward the next panels were re-measured. Panel 4 was completed in 2011.
CVS Database
• Approximately 1400 permanent plots. 1 plot for every 1600 acres of forested BLM land. • 210,000 individual trees (live trees, >4.9”dbh). Each
tree is individually identified and we follow individuals. We have growth, ingrowth, mortality, changes in insect and disease etc. • Usually 1 to 5 site trees per PSU that are over 20
years old.
Snags and Down Wood
• 30,000 dead trees. Individually identified, information on height, decay class, species, insect and disease, wildlife usage. Includes both hardwoods and softwoods.
• 34,000 pieces of down woody material. These are a minimum of 3 feet long and 3 inches diameter. We have large end, small end, intersect diameter, total length, and decay class. Not uniquely identified, but we do have occasion 1 and occasion 2 measurements. Includes both hardwoods and softwoods.
What will be used from CVS?
• Measured tree lists from CVS subplots. These will be grown in Organon. Will use empirical data to describe the older stands.
• Snags/Down Wood data• Marbled Murrelet Platform data
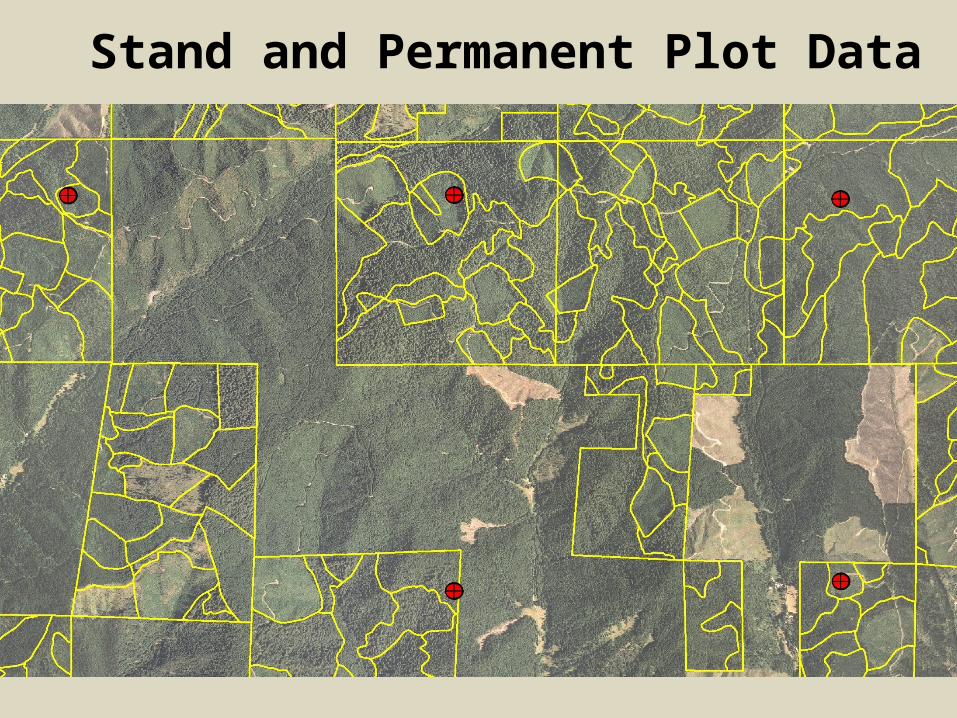
Stand and Permanent Plot Data
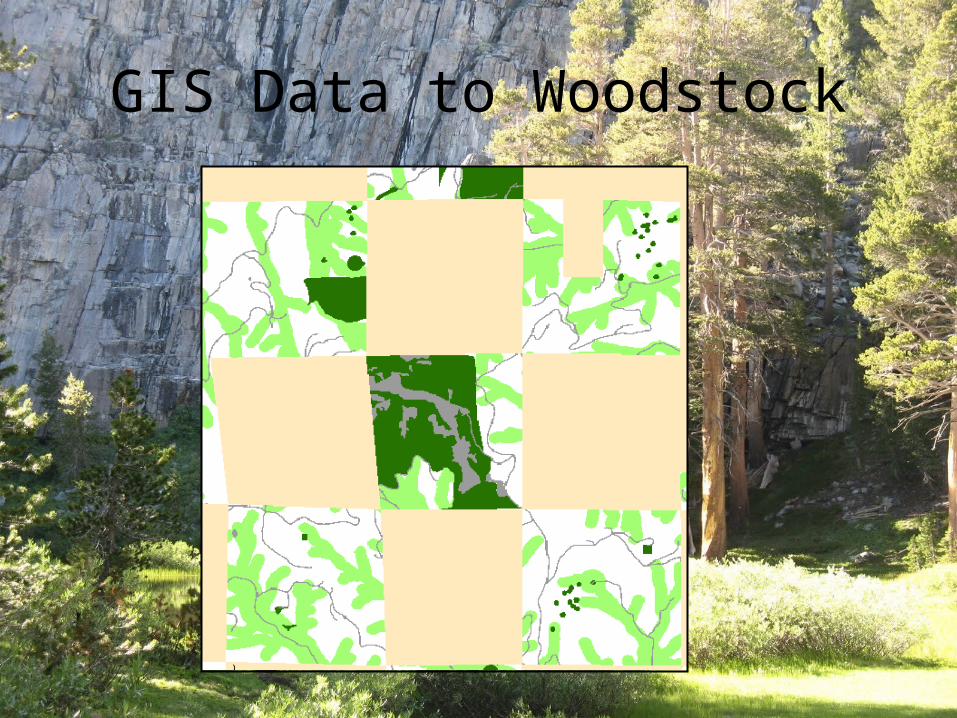
GIS Data to Woodstock

GIS ThemesACECsNS Owls sites
MAMU
S&M
VRM
W&SR
Recreation
Riparian
Land Status5th Fields
Counties
Provinces
Swiss Needle Cast
Critical Habitat Units
TPCCForest Operations Inventory
And Many More
Site Index Determination
• Use BLM measured SI where we have it. (12,562 FOI’s, 625,500 acres)• Use NRCS site index maps to fill in the
roughly 75% that is not measured. • Adjust the NRCS classification to move
acres between site classes to come up with the CVS distribution.
Tree Growth and Harvest Models
• Harvest Scheduling and the changes in vegetation composition and structure will be modeled with Woodstock.
• Contracted with Mason, Bruce and Girard to set-up and run the vegetation model.
• Growth and Yield Modeling will be done with Organon 9.1
BLM Modeling Needs
Strategic-level Planning • 2.5 million acres• 200+ year time frame• Spatial representation and analysis
The Woodstock Model
Linear programming model
The model will determine the BEST solution among a number of management scenarios.
Specify the kind of solution we are looking for, and then the model solves the linear programming function to determine what activity levels are needed to achieve our goals.
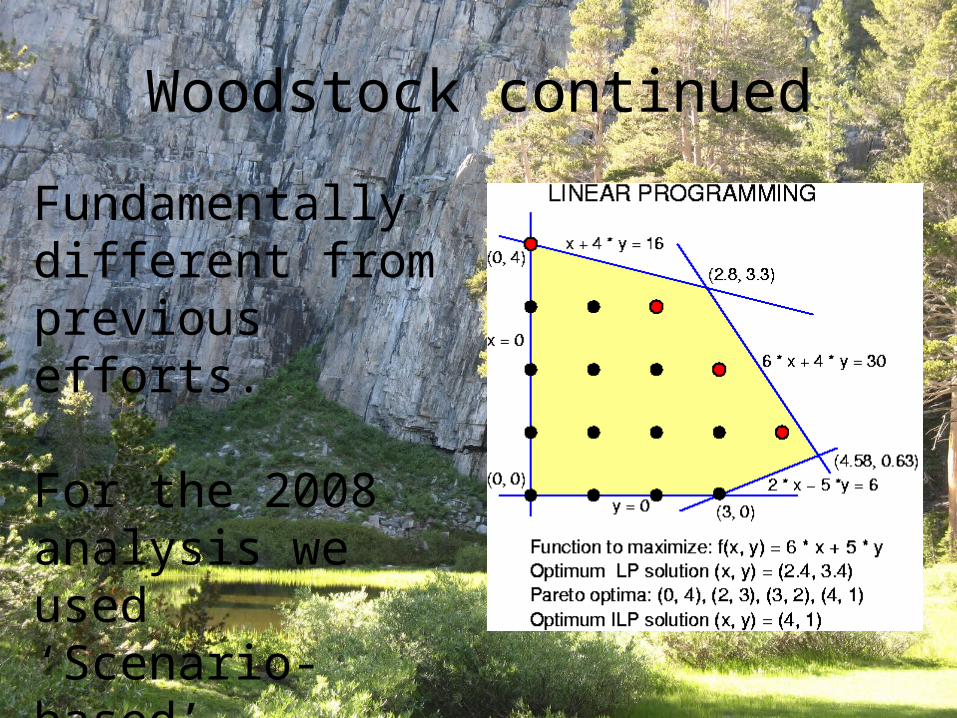
Woodstock continued
Fundamentally different from previous efforts.
For the 2008 analysis we used ‘Scenario-based’ analysis methods.
Woodstock Inputs
• A Method of Describing the Forest (a classification scheme).
• A Range of Silvicultural Activities and Natural events.
• A Means of Measuring the Impacts of Interventions and Natural Events.
• A Method of Accounting for the Passage of Time.
What is New in the RMP’s for WO?
• Incorporating Stochastic Change Due to Fire into the Model Runs • Modeling Snags, Coarse Woody Debris • Habitat Suitability Index for the Northern
Spotted Owl and the Marbled Murrelet.• Demographic Modeling for the Northern
Spotted Owl
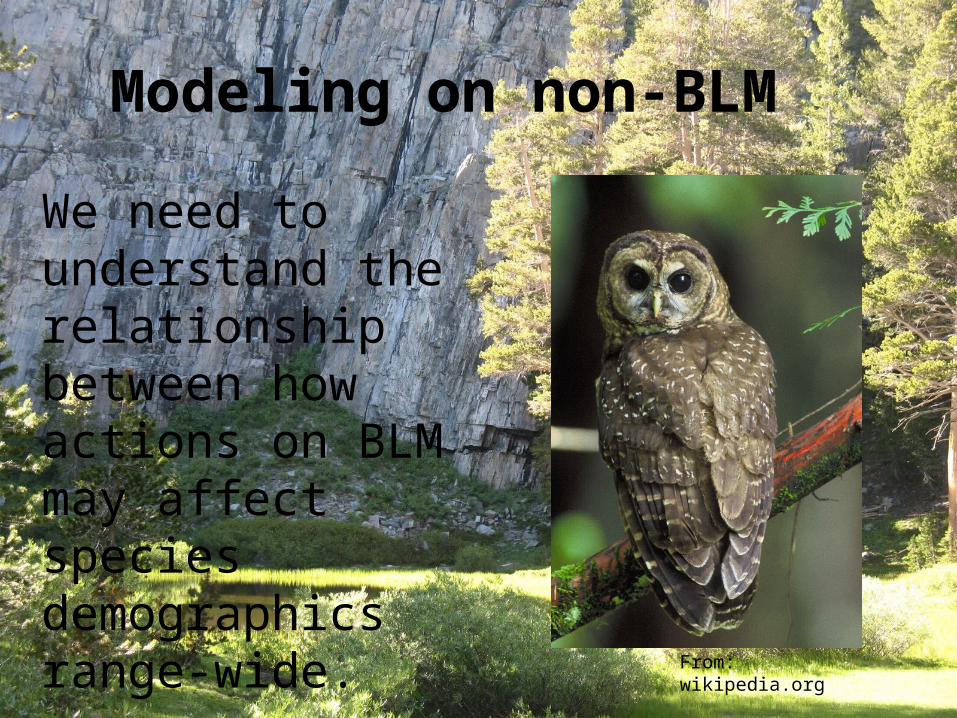
Modeling on non-BLM
From: wikipedia.org
We need to understand the relationship between how actions on BLM may affect species demographics range-wide.
Other Models
Using MaxEnt model to develop habitat suitability index’s for both the NSO and the Marbled Murrelet. (PNW-GTR-848, 2011; PNW-GTR-850, 2011)
NSO range-wide demographic analysis using the HexSim model.
Modeling Timeline
Putting the inventory plots into strataBeginning the Growth and Yield workBenchmark runs done in June and JulyThe No-Action Alternative modeled in JulyModeling the Alternatives this Summer and FallDraft EIS by Winter of 2014. Modeling the proposed RMP’s fall and winter of 2015.
RMP’s for WO
Website: http://www.blm.gov/or/plans/rmpswesternoregon/
Project Manager: Mark Brown [email protected]
Public Affairs: Jodi Bean [email protected]
Veg Modeling : Carolina Hooper [email protected]