Embed Size (px)
Citation preview
Missouri University of Science and Technology Missouri University of Science and Technology
Scholars' Mine Scholars' Mine
International Conference on Case Histories in Geotechnical Engineering
(2008) - Sixth International Conference on Case Histories in Geotechnical Engineering
14 Aug 2008, 4:30pm - 6:00pm
Landslide Investigation at Phata Village on Rudraprayag-Landslide Investigation at Phata Village on Rudraprayag-
Kedarnath Road, Uttaranchal — A Case Study Kedarnath Road, Uttaranchal — A Case Study
A. Ghosh Central Building Research Institute, Roorkee, India
S. Sarkar Central Building Research Institute, Roorkee, India
D. P. Kanungo Central Building Research Institute, Roorkee, India
S. K. Jain Central Building Research Institute, Roorkee, India
Dalip Kumar Central Building Research Institute, Roorkee, India
See next page for additional authors
Follow this and additional works at: https://scholarsmine.mst.edu/icchge
Part of the Geotechnical Engineering Commons
Recommended Citation Recommended Citation Ghosh, A.; Sarkar, S.; Kanungo, D. P.; Jain, S. K.; Kumar, Dalip; Ahmed, Zameer; and Patra, Ashish, "Landslide Investigation at Phata Village on Rudraprayag-Kedarnath Road, Uttaranchal — A Case Study" (2008). International Conference on Case Histories in Geotechnical Engineering. 32. https://scholarsmine.mst.edu/icchge/6icchge/session02/32
This work is licensed under a Creative Commons Attribution-Noncommercial-No Derivative Works 4.0 License.
This Article - Conference proceedings is brought to you for free and open access by Scholars' Mine. It has been accepted for inclusion in International Conference on Case Histories in Geotechnical Engineering by an authorized administrator of Scholars' Mine. This work is protected by U. S. Copyright Law. Unauthorized use including reproduction for redistribution requires the permission of the copyright holder. For more information, please contact [email protected].

Author Author A. Ghosh, S. Sarkar, D. P. Kanungo, S. K. Jain, Dalip Kumar, Zameer Ahmed, and Ashish Patra
This article - conference proceedings is available at Scholars' Mine: https://scholarsmine.mst.edu/icchge/6icchge/session02/32
Paper No. 2.24 1
LANDSLIDE INVESTIGATION AT PHATA VILLAGE ON RUDRAPRAYAG-KEDARNATH ROAD, UTTARANCHAL - A CASE STUDY
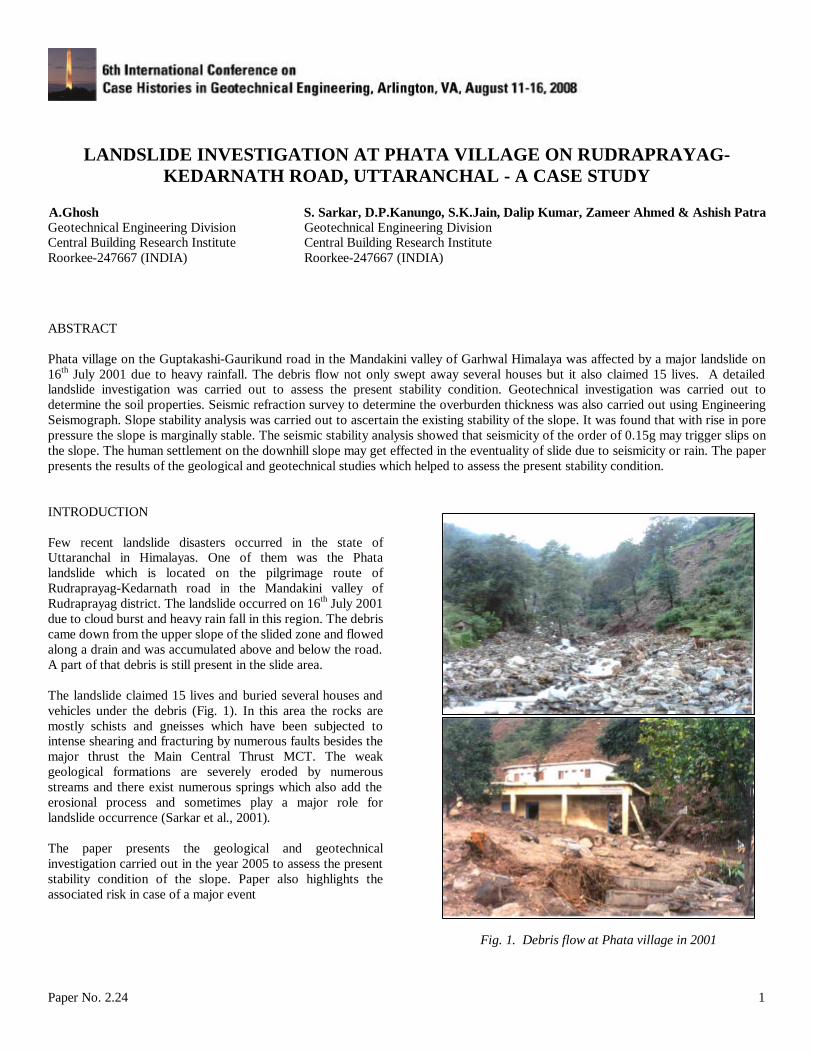
A.Ghosh S. Sarkar, D.P.Kanungo, S.K.Jain, Dalip Kumar, Zameer Ahmed & Ashish Patra Geotechnical Engineering Division Geotechnical Engineering Division Central Building Research Institute Central Building Research Institute Roorkee-247667 (INDIA) Roorkee-247667 (INDIA) ABSTRACT Phata village on the Guptakashi-Gaurikund road in the Mandakini valley of Garhwal Himalaya was affected by a major landslide on 16th July 2001 due to heavy rainfall. The debris flow not only swept away several houses but it also claimed 15 lives. A detailed landslide investigation was carried out to assess the present stability condition. Geotechnical investigation was carried out to determine the soil properties. Seismic refraction survey to determine the overburden thickness was also carried out using Engineering Seismograph. Slope stability analysis was carried out to ascertain the existing stability of the slope. It was found that with rise in pore pressure the slope is marginally stable. The seismic stability analysis showed that seismicity of the order of 0.15g may trigger slips on the slope. The human settlement on the downhill slope may get effected in the eventuality of slide due to seismicity or rain. The paper presents the results of the geological and geotechnical studies which helped to assess the present stability condition. INTRODUCTION Few recent landslide disasters occurred in the state of Uttaranchal in Himalayas. One of them was the Phata landslide which is located on the pilgrimage route of Rudraprayag-Kedarnath road in the Mandakini valley of Rudraprayag district. The landslide occurred on 16th July 2001 due to cloud burst and heavy rain fall in this region. The debris came down from the upper slope of the slided zone and flowed along a drain and was accumulated above and below the road. A part of that debris is still present in the slide area. The landslide claimed 15 lives and buried several houses and vehicles under the debris (Fig. 1). In this area the rocks are mostly schists and gneisses which have been subjected to intense shearing and fracturing by numerous faults besides the major thrust the Main Central Thrust MCT. The weak geological formations are severely eroded by numerous streams and there exist numerous springs which also add the erosional process and sometimes play a major role for landslide occurrence (Sarkar et al., 2001). The paper presents the geological and geotechnical investigation carried out in the year 2005 to assess the present stability condition of the slope. Paper also highlights the associated risk in case of a major event
Fig. 1. Debris flow at Phata village in 2001
Paper No. 2.24 2
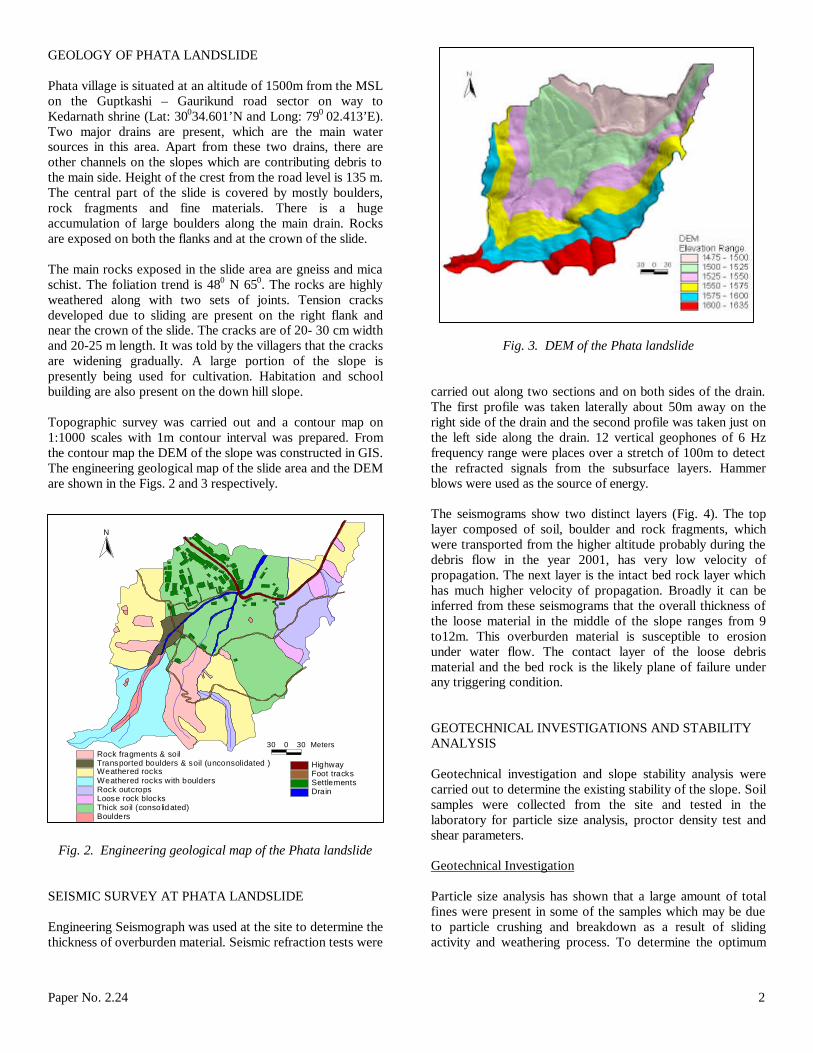
GEOLOGY OF PHATA LANDSLIDE Phata village is situated at an altitude of 1500m from the MSL on the Guptkashi – Gaurikund road sector on way to Kedarnath shrine (Lat: 30034.601’N and Long: 790 02.413’E). Two major drains are present, which are the main water sources in this area. Apart from these two drains, there are other channels on the slopes which are contributing debris to the main side. Height of the crest from the road level is 135 m. The central part of the slide is covered by mostly boulders, rock fragments and fine materials. There is a huge accumulation of large boulders along the main drain. Rocks are exposed on both the flanks and at the crown of the slide. The main rocks exposed in the slide area are gneiss and mica schist. The foliation trend is 480 N 650. The rocks are highly weathered along with two sets of joints. Tension cracks developed due to sliding are present on the right flank and near the crown of the slide. The cracks are of 20- 30 cm width and 20-25 m length. It was told by the villagers that the cracks are widening gradually. A large portion of the slope is presently being used for cultivation. Habitation and school building are also present on the down hill slope. Topographic survey was carried out and a contour map on 1:1000 scales with 1m contour interval was prepared. From the contour map the DEM of the slope was constructed in GIS. The engineering geological map of the slide area and the DEM are shown in the Figs. 2 and 3 respectively.
Fig. 2. Engineering geological map of the Phata landslide
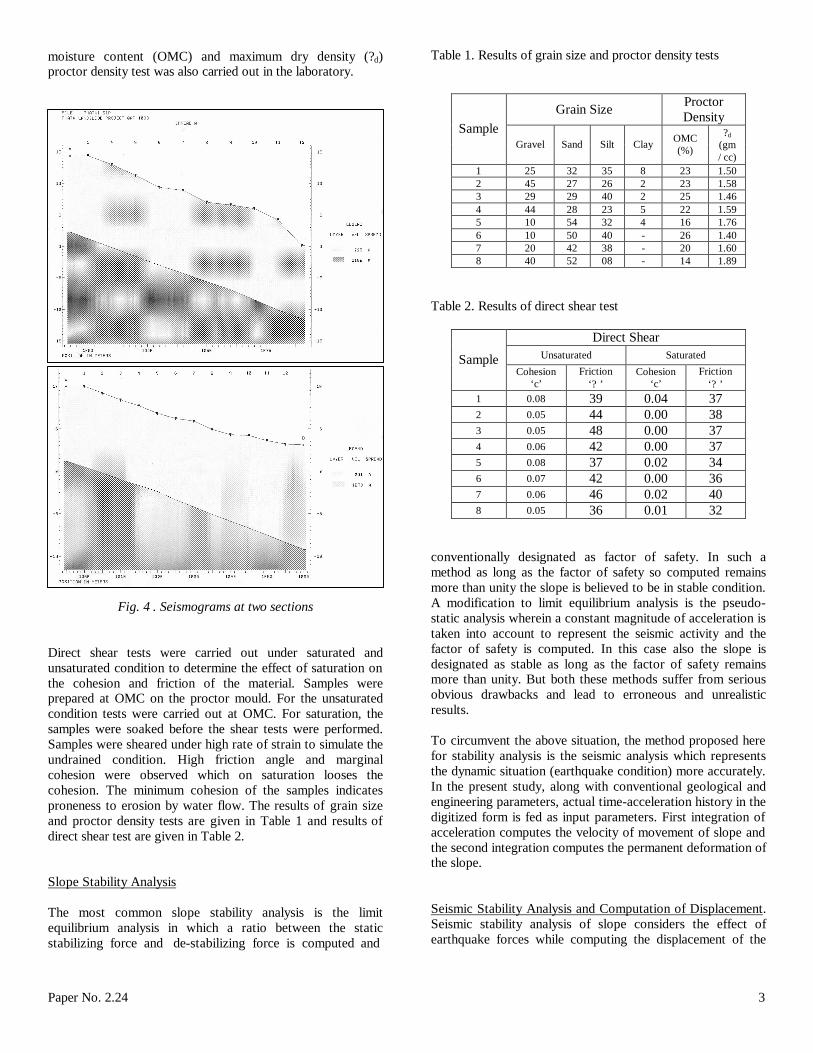
SEISMIC SURVEY AT PHATA LANDSLIDE Engineering Seismograph was used at the site to determine the thickness of overburden material. Seismic refraction tests were
Fig. 3. DEM of the Phata landslide
carried out along two sections and on both sides of the drain. The first profile was taken laterally about 50m away on the right side of the drain and the second profile was taken just on the left side along the drain. 12 vertical geophones of 6 Hz frequency range were places over a stretch of 100m to detect the refracted signals from the subsurface layers. Hammer blows were used as the source of energy. The seismograms show two distinct layers (Fig. 4). The top layer composed of soil, boulder and rock fragments, which were transported from the higher altitude probably during the debris flow in the year 2001, has very low velocity of propagation. The next layer is the intact bed rock layer which has much higher velocity of propagation. Broadly it can be inferred from these seismograms that the overall thickness of the loose material in the middle of the slope ranges from 9 to12m. This overburden material is susceptible to erosion under water flow. The contact layer of the loose debris material and the bed rock is the likely plane of failure under any triggering condition. GEOTECHNICAL INVESTIGATIONS AND STABILITY ANALYSIS Geotechnical investigation and slope stability analysis were carried out to determine the existing stability of the slope. Soil samples were collected from the site and tested in the laboratory for particle size analysis, proctor density test and shear parameters. Geotechnical Investigation Particle size analysis has shown that a large amount of total fines were present in some of the samples which may be due to particle crushing and breakdown as a result of sliding activity and weathering process. To determine the optimum
N
30 0 30 MetersRock fragments & soil Transported boulders & soil (unconsolidated )Weathered rocksWeathered rocks with bouldersRock outcropsLoose rock blocksThick soil (consolidated)Boulders
Drain
HighwayFoot tracksSettlements
Paper No. 2.24 3
moisture content (OMC) and maximum dry density (? d) proctor density test was also carried out in the laboratory.
Fig. 4 . Seismograms at two sections Direct shear tests were carried out under saturated and unsaturated condition to determine the effect of saturation on the cohesion and friction of the material. Samples were prepared at OMC on the proctor mould. For the unsaturated condition tests were carried out at OMC. For saturation, the samples were soaked before the shear tests were performed. Samples were sheared under high rate of strain to simulate the undrained condition. High friction angle and marginal cohesion were observed which on saturation looses the cohesion. The minimum cohesion of the samples indicates proneness to erosion by water flow. The results of grain size and proctor density tests are given in Table 1 and results of direct shear test are given in Table 2. Slope Stability Analysis The most common slope stability analysis is the limit equilibrium analysis in which a ratio between the static stabilizing force and de-stabilizing force is computed and
Table 1. Results of grain size and proctor density tests
Grain Size Proctor Density
Sample Gravel Sand Silt Clay OMC
(%)
? d (gm / cc)
1 25 32 35 8 23 1.50 2 45 27 26 2 23 1.58 3 29 29 40 2 25 1.46 4 44 28 23 5 22 1.59 5 10 54 32 4 16 1.76 6 10 50 40 - 26 1.40 7 20 42 38 - 20 1.60 8 40 52 08 - 14 1.89
Table 2. Results of direct shear test
Direct Shear Unsaturated Saturated Sample
Cohesion ‘c’
Friction ‘? ’
Cohesion ‘c’
Friction ‘? ’
1 0.08 39 0.04 37 2 0.05 44 0.00 38 3 0.05 48 0.00 37 4 0.06 42 0.00 37 5 0.08 37 0.02 34 6 0.07 42 0.00 36 7 0.06 46 0.02 40 8 0.05 36 0.01 32
conventionally designated as factor of safety. In such a method as long as the factor of safety so computed remains more than unity the slope is believed to be in stable condition. A modification to limit equilibrium analysis is the pseudo-static analysis wherein a constant magnitude of acceleration is taken into account to represent the seismic activity and the factor of safety is computed. In this case also the slope is designated as stable as long as the factor of safety remains more than unity. But both these methods suffer from serious obvious drawbacks and lead to erroneous and unrealistic results. To circumvent the above situation, the method proposed here for stability analysis is the seismic analysis which represents the dynamic situation (earthquake condition) more accurately. In the present study, along with conventional geological and engineering parameters, actual time-acceleration history in the digitized form is fed as input parameters. First integration of acceleration computes the velocity of movement of slope and the second integration computes the permanent deformation of the slope. Seismic Stability Analysis and Computation of Displacement. Seismic stability analysis of slope considers the effect of earthquake forces while computing the displacement of the
Paper No. 2.24 4
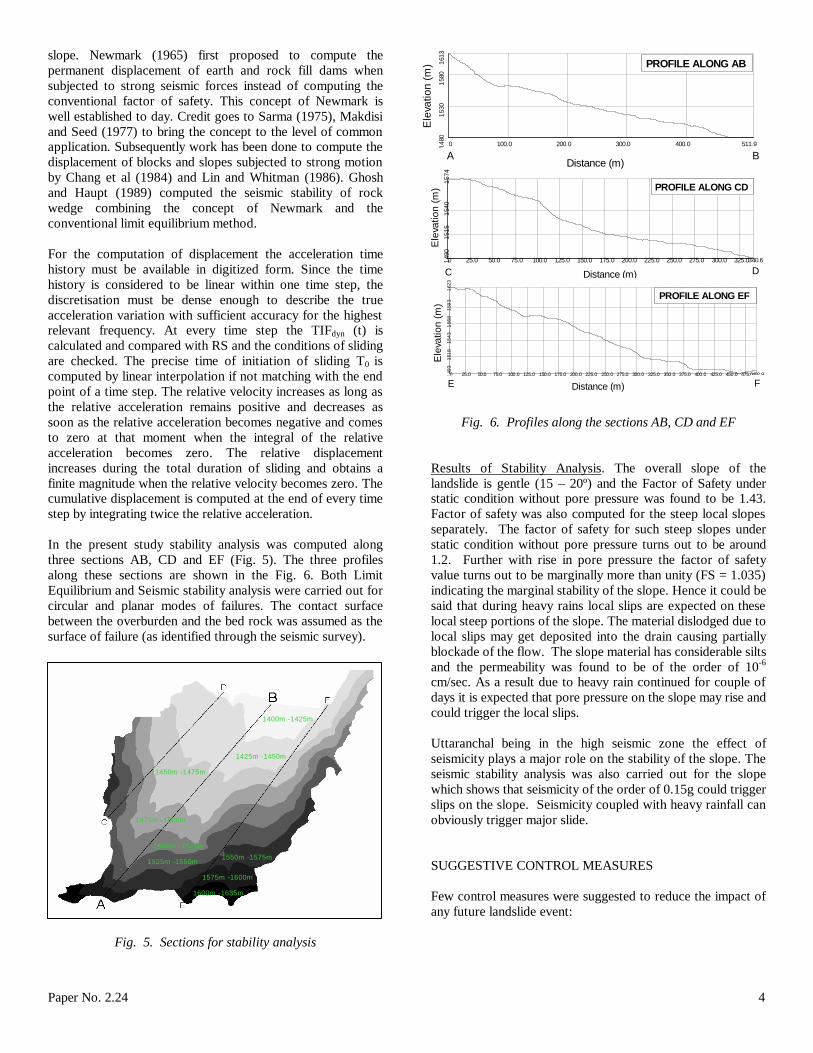
slope. Newmark (1965) first proposed to compute the permanent displacement of earth and rock fill dams when subjected to strong seismic forces instead of computing the conventional factor of safety. This concept of Newmark is well established to day. Credit goes to Sarma (1975), Makdisi and Seed (1977) to bring the concept to the level of common application. Subsequently work has been done to compute the displacement of blocks and slopes subjected to strong motion by Chang et al (1984) and Lin and Whitman (1986). Ghosh and Haupt (1989) computed the seismic stability of rock wedge combining the concept of Newmark and the conventional limit equilibrium method. For the computation of displacement the acceleration time history must be available in digitized form. Since the time history is considered to be linear within one time step, the discretisation must be dense enough to describe the true acceleration variation with sufficient accuracy for the highest relevant frequency. At every time step the TIFdyn (t) is calculated and compared with RS and the conditions of sliding are checked. The precise time of initiation of sliding T0 is computed by linear interpolation if not matching with the end point of a time step. The relative velocity increases as long as the relative acceleration remains positive and decreases as soon as the relative acceleration becomes negative and comes to zero at that moment when the integral of the relative acceleration becomes zero. The relative displacement increases during the total duration of sliding and obtains a finite magnitude when the relative velocity becomes zero. The cumulative displacement is computed at the end of every time step by integrating twice the relative acceleration. In the present study stability analysis was computed along three sections AB, CD and EF (Fig. 5). The three profiles along these sections are shown in the Fig. 6. Both Limit Equilibrium and Seismic stability analysis were carried out for circular and planar modes of failures. The contact surface between the overburden and the bed rock was assumed as the surface of failure (as identified through the seismic survey).
Fig. 5. Sections for stability analysis
Fig. 6. Profiles along the sections AB, CD and EF Results of Stability Analysis. The overall slope of the landslide is gentle (15 – 20º) and the Factor of Safety under static condition without pore pressure was found to be 1.43. Factor of safety was also computed for the steep local slopes separately. The factor of safety for such steep slopes under static condition without pore pressure turns out to be around 1.2. Further with rise in pore pressure the factor of safety value turns out to be marginally more than unity (FS = 1.035) indicating the marginal stability of the slope. Hence it could be said that during heavy rains local slips are expected on these local steep portions of the slope. The material dislodged due to local slips may get deposited into the drain causing partially blockade of the flow. The slope material has considerable silts and the permeability was found to be of the order of 10-6 cm/sec. As a result due to heavy rain continued for couple of days it is expected that pore pressure on the slope may rise and could trigger the local slips. Uttaranchal being in the high seismic zone the effect of seismicity plays a major role on the stability of the slope. The seismic stability analysis was also carried out for the slope which shows that seismicity of the order of 0.15g could trigger slips on the slope. Seismicity coupled with heavy rainfall can obviously trigger major slide. SUGGESTIVE CONTROL MEASURES Few control measures were suggested to reduce the impact of any future landslide event:
1600m -1635m
1575m -1600m
1550m -1575m1525m -1550m
1500m -1525m
1475m -1500m
1450m -1475m
1425m -1450m
1400m -1425m
1600m -1635m
1575m -1600m
1550m -1575m1525m -1550m
1500m -1525m
1475m -1500m
1450m -1475m
1425m -1450m
1400m -1425m
Distance
511.90
1613
1480
100.0 200.0 300.0 400.0
1530
1580
Distance (m)
Ele
vatio
n (m
)
A B
PROFILE ALONG AB
Distance
511.90
1613
1480
100.0 200.0 300.0 400.0
1530
1580
Distance (m)
Ele
vatio
n (m
)
A B
PROFILE ALONG AB
340.60
1574
1490
25.0 50.0 75.0 100.0 125.0 150.0 175.0 200.0 225.0 250.0 275.0 300.0 325.0
1515
1540
PROFILE ALONG CD
Distance (m)
Ele
vatio
n (m
)
C D340.60
1574
1490
25.0 50.0 75.0 100.0 125.0 150.0 175.0 200.0 225.0 250.0 275.0 300.0 325.0
1515
1540
PROFILE ALONG CD
Distance (m)
Ele
vatio
n (m
)
C D
492.90
1623
149
3
25.0 50.0 75.0 100.0 125.0 150.0 175.0 200.0 225.0 250.0 275.0 300.0 325.0 350.0 375.0 400.0 425.0 450.0 475.0
1518
1543
156
815
93
Distance (m)
Ele
vatio
n (m
)
E F
PROFILE ALONG EF
492.90
1623
149
3
25.0 50.0 75.0 100.0 125.0 150.0 175.0 200.0 225.0 250.0 275.0 300.0 325.0 350.0 375.0 400.0 425.0 450.0 475.0
1518
1543
156
815
93
Distance (m)
Ele
vatio
n (m
)
E F
PROFILE ALONG EF
Paper No. 2.24 5
Construction of Drainage Network Network of catch water drain on the slope at different altitude leading the discharge to the main drain may be constructed to divert water through the main drain. This network of drainage system will tap the free flowing surface water which raises the pore water pressure on the slope and often triggers slides. Design and Maintenance of Drain The central drain should be designed taking into account the catchment area, rate of rainfall during storm and the maximum duration of storm. The velocity of flow is also to be taken into account to avoid erosion of the base. However self cleansing velocity of the flow is to be maintained. Construction of Retaining Wall Retaining walls may be constructed as mitigation measure to minimize the possibility of local slips. Retaining walls may be constructed particularly around the school building to avoid the rolling rock fragments and debris in the eventuality of a major event. Construction of Rock Catch Fences Rock catching fences may be constructed to minimize the damage and chances of accident in the downhill in the eventuality of rock fall from the places where few big boulders rest on steep slopes. CONCLUSIONS The local topography of the slope is such that the drain flowing almost through the middle of the slope can carry considerable debris. However, the overall condition of the slope is such that it may not fail unless there is some major triggering factor. The associated risk elements such as the school building, the local village level offices, shops and the residential houses located at foot hill slope may get affected in the eventuality of a major event. The slope material has considerable silts and the permeability was found to be of the order of 10-6 cm/sec. As a result due to heavy rain continued for couple of days it is expected that pore pressure on the slope may rise and could trigger the local slip. The material dislodged due to local slips may get deposited into the drain causing partially blockade of the flow. Under such a condition the subsequent damage down stream of the slope will be even larger. Uttaranchal being on the high seismic zone the effect of seismicity plays a major role on the stability of the slope. Seismicity coupled with heavy rainfall can obviously trigger a
major slide. However, the extent of the damage will depend on the magnitude of failure. REFERENCES Chang, C.J., F.C. Wai and T.P.Y. James [1984]. “Seismic displacement in slope by limit analysis”, Jour. Geotech. Engineering, ASCE, Vol. 110, No. 7, pp. 860–874. Ghosh, A. and W. Haupt [1989]. “Computation of the seismic stability of rock wedge”, Jour. of Rock Mechanics and Rock engineering, Vol. 22, pp. 109–125. Lin, J.S. and R.V. Whitman [1986]. “Earthquake induced displacement of sliding blocks”, Jour. Geotech. Engineering, ASCE, Vol. 112, No. 1, pp. 44-59. Makdisi, F.I. and H.B. Seed [1977]. “A simplified procedure for estimating earthquake induced deformations in dams and embankments”, University of California, Barkley, EERC, Report No 77/79. Newmark, N.M. [1965]. “Effects of earthquake on dams and embankments”, Geotechnique, Vol. 15, No. 2, pp. 139–160. Sarkar, S., D.P. Kanungo and A.K. Jethi [2001]. “Landslide hazard and risk in Uttaranchal”, All India Seminar on Infrastructure development in Uttaranchal problems & prospects, Institution of Engineers, Roorkee, India, pp. VI 112-121. Sarma, S.K. [1975]. “Seismic stability of earth dams and embankments”, Geotechnique, Vol. 25, No. 4, pp. 743–461.